
Technical publication
Back to publications
Industrial applications
Sonochemical Effect Induced by Hydrodynamic Cavitation
okozyuk.com
Published
Read complete publication for whole-document Find and printing. Browser Find and native printing on this reader include only loaded content.
10 Influence of Device Geometry and Operating Conditions
The geometry of a hydrodynamic cavitation device determines the complete pressure time history experienced by the bubble population. Orifices create rapid acceleration, jet contraction, separated shear layers, and abrupt recovery. Venturi devices usually provide a smoother pressure reduction and a more extended low pressure zone. Vortex devices create low pressure in a rotating core and can retain cavities through a longer, curved trajectory. Rotor stator and rotary generators superimpose repeated high velocity gaps, pressure pulses, and intense shear. Microfluidic devices shorten diffusion distances and permit high local pressure gradients at very small flow rates. Controlled flow multistage devices can sequence nucleation, growth, collapse, and interstage mixing [7-8,11-15,17-18,35,50-52].
The same nominal pressure drop can therefore produce very different chemistry. Pawar and coworkers compared three Venturi geometries and an orifice by CFD, individual bubble simulation, high speed imaging, and iodide oxidation. Under their tested conditions, the orifice gave the highest chemical yield per unit energy despite a lower operating inlet pressure. Dense vapor clouds in the Venturi devices increased bubble interaction, coalescence, and radical recombination [11]. This result should not be generalized to every orifice and Venturi; it demonstrates that vapor volume fraction and chemical yield must be optimized separately.
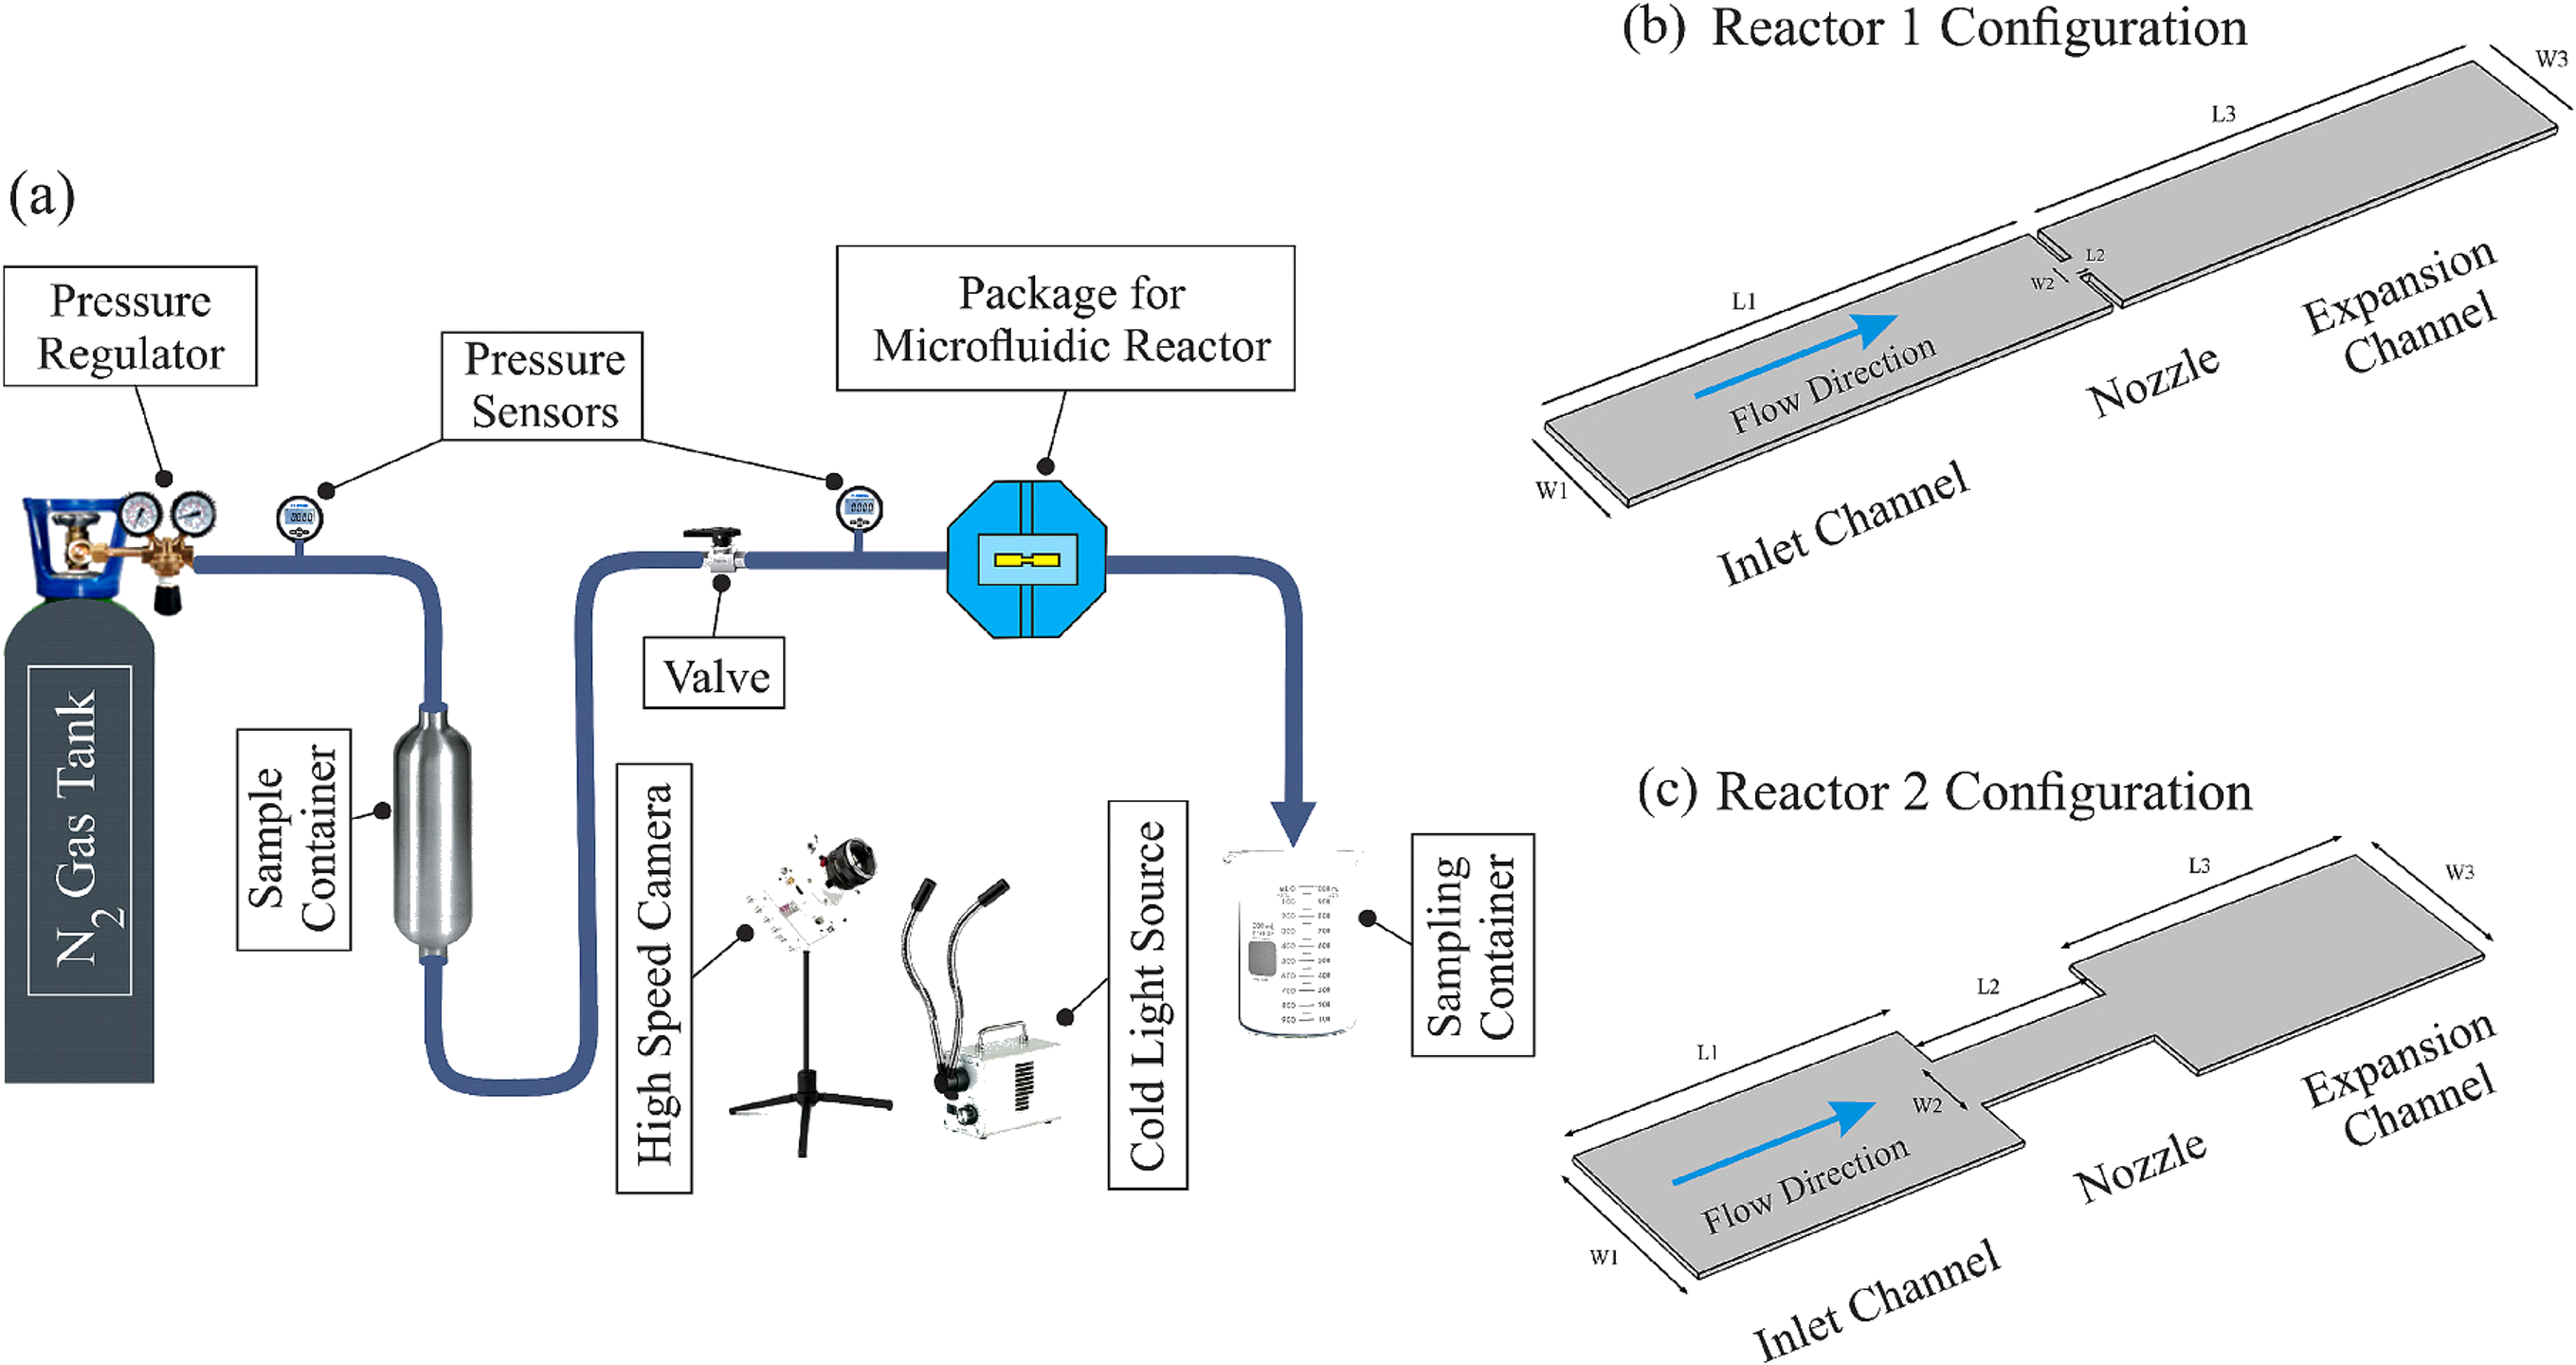
Figure 10.1. Experimental hydrodynamic cavitation on a chip system and the two reactor configurations used to compare a micro orifice with a long diaphragm. [15].
Microscale hydrodynamic cavitation provides a clear demonstration of geometry dependent chemistry. Golshaei and coworkers compared a micro orifice with a long diaphragm configuration using triiodide formation as a chemical indicator [15]. The micro orifice generated a concentrated radical production zone associated with a sharp pressure gradient. The long diaphragm distributed cavitation over a larger length and produced a more gradual chemical signal. In the cavitation inception regime, the reported hydroxyl radical yield per energy input was approximately 0.6 × 10⁻⁶ g J⁻¹ for the micro orifice and 3.0 × 10⁻⁸ g J⁻¹ for the long diaphragm, illustrating an order of magnitude geometry effect.

Figure 10.2. Observed cavitation structures and flow regimes in micro orifice and long diaphragm devices. [15].
Figure 10.2 shows that a reactor can transition from isolated inception bubbles to attached or cloud cavitation as pressure increases. The chemically optimal regime often occurs near or moderately above inception, where collapse intensity remains high and shielding is limited. At very high void fraction, additional vapor can reduce the recovery pressure acting on individual bubbles and can cause collective collapse rather than isolated, chemically efficient events. This is the physical basis of the process window shown later in Figure 10.6.
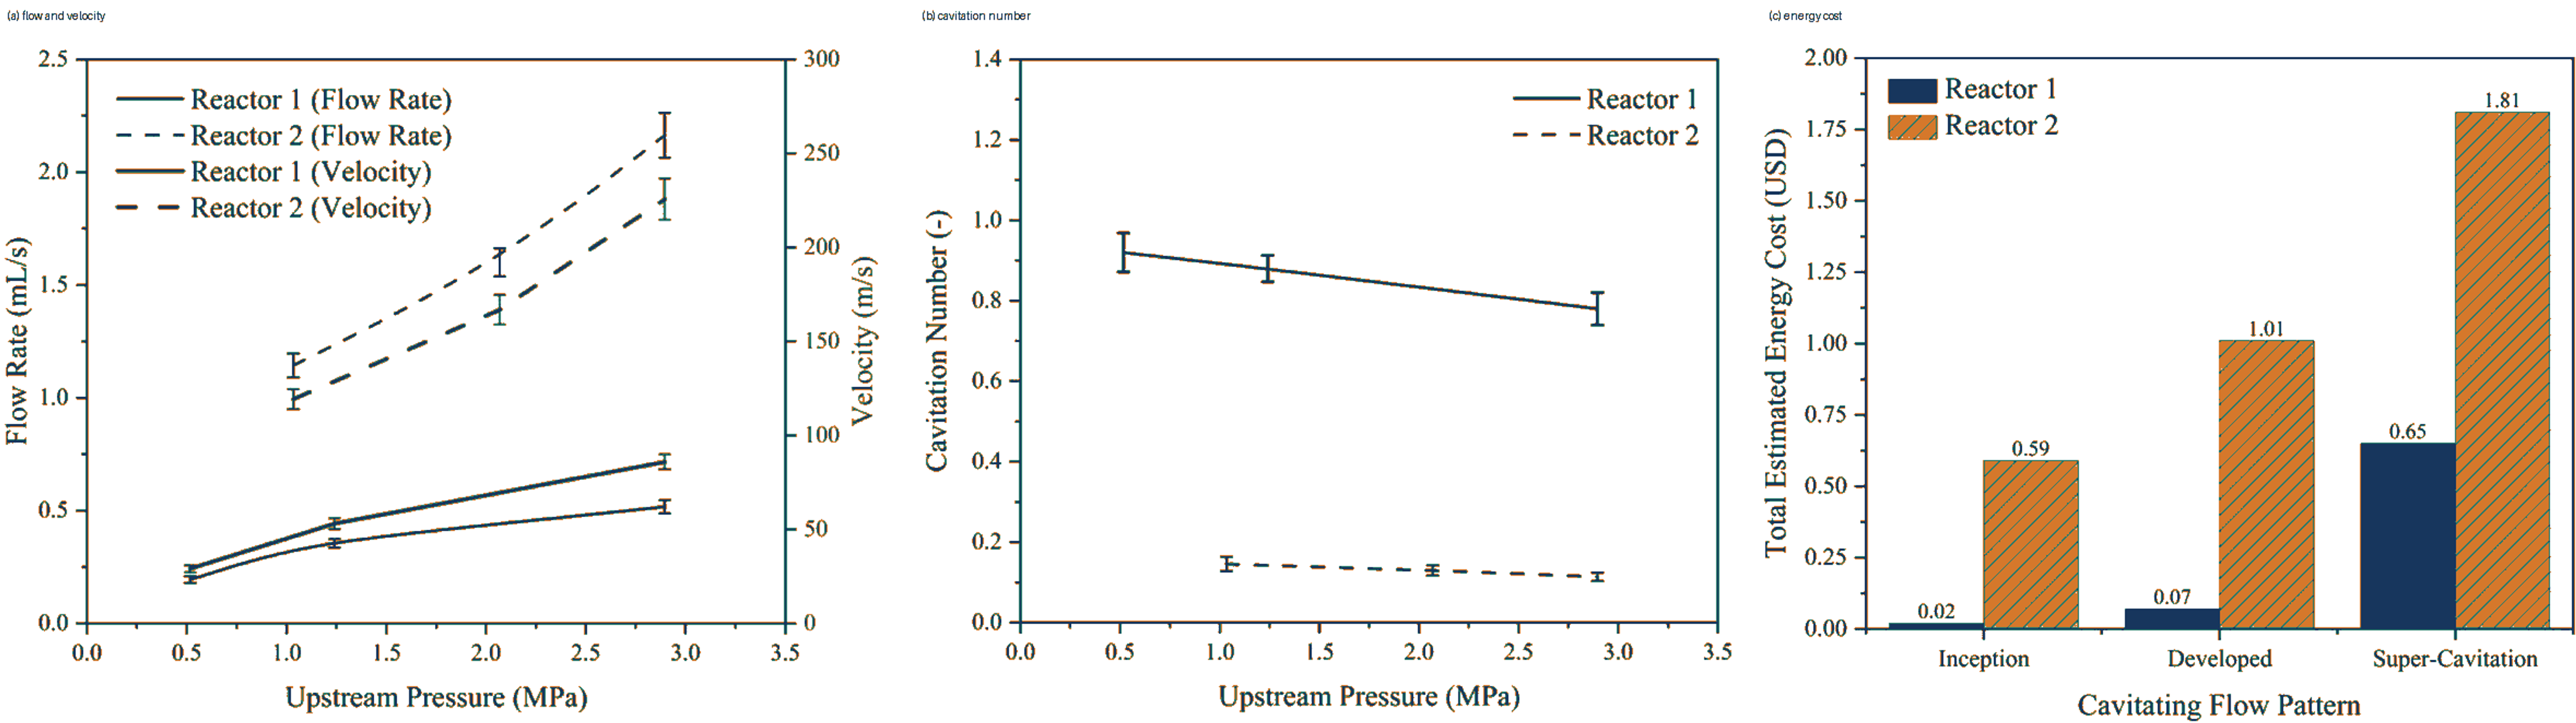
Figure 10.3. Pressure dependent chemical response and comparison of reactor configurations in hydrodynamic cavitation on a chip. [15].
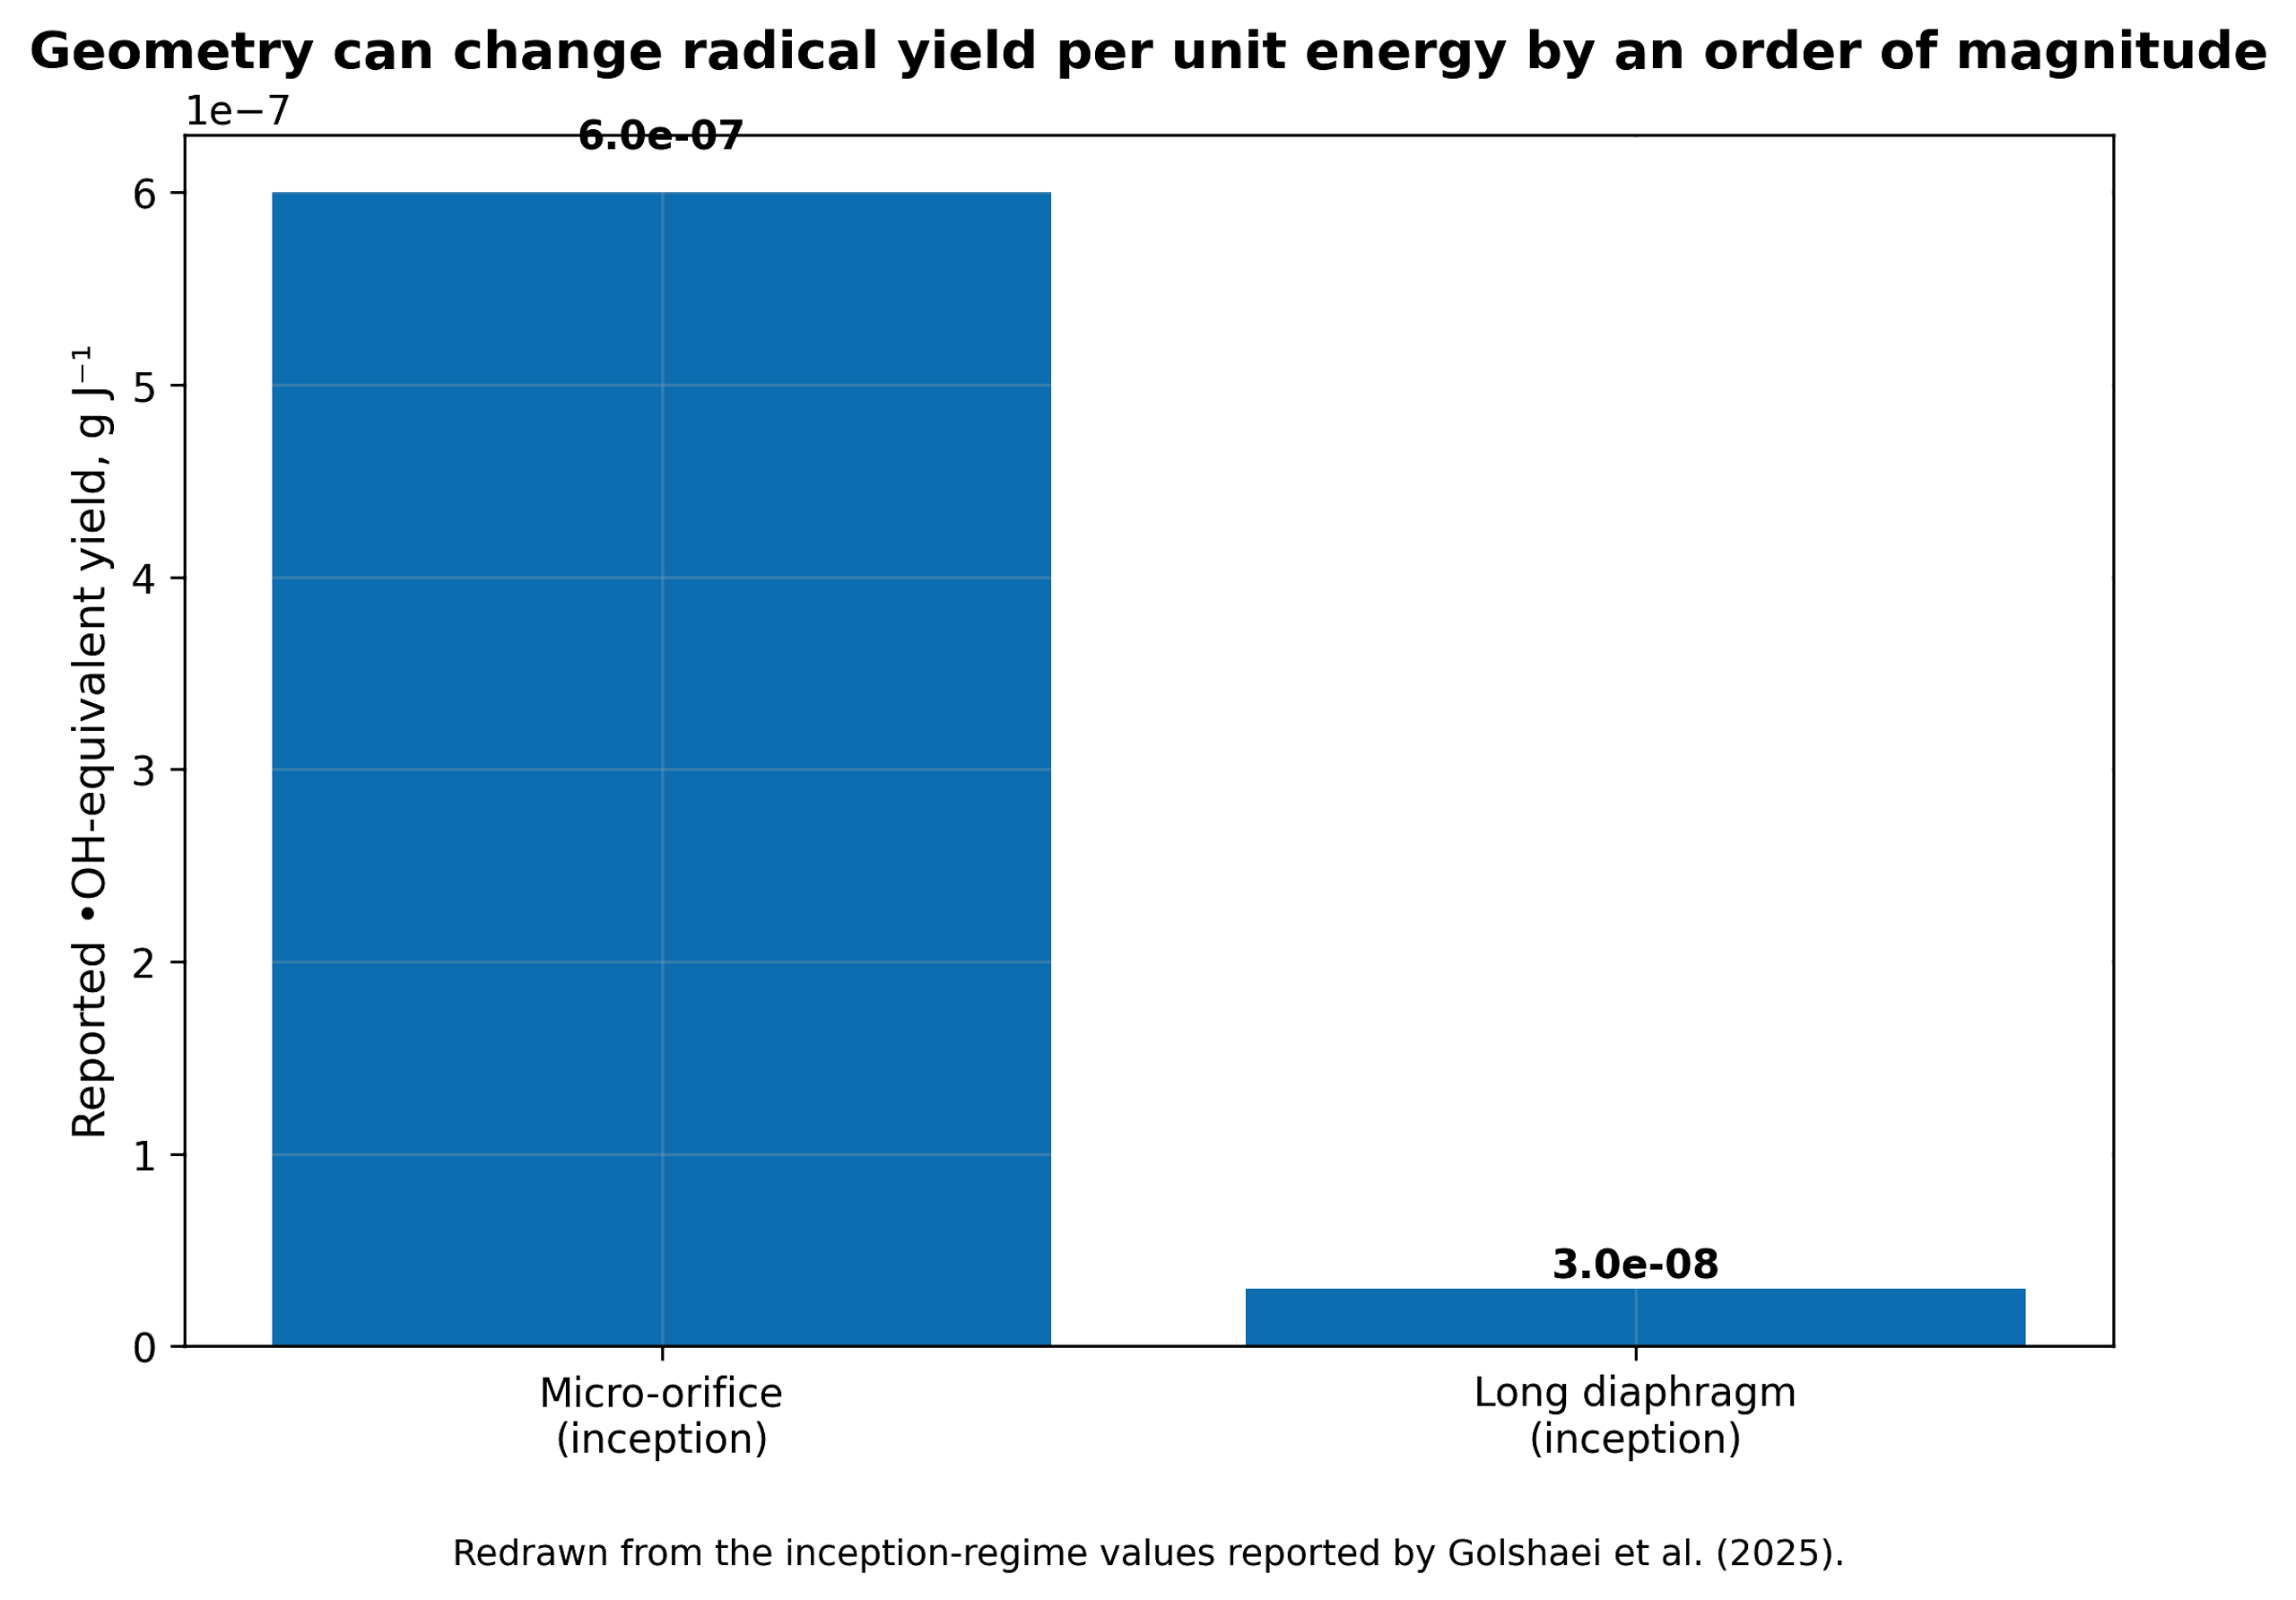
Figure 10.4. Geometry can change hydroxyl radical yield per unit energy by more than an order of magnitude in the inception regime. [15].
The hydraulic power dissipated across a cavitating element is defined as:
where is hydraulic power, Q is volumetric flow, and Δp is pressure drop across the defined device boundary.
The corresponding electrical power attributable to pumping is approximately:
where and are pump and motor efficiencies. Auxiliary power must be added when gas compression, ozone generation, heating, cooling, or separation is part of the process.
The volumetric energy dose delivered over treatment time t is:
where P is the selected power basis and V is treated liquid volume.
A mass specific energy dose is:
where m is treated mass.
Table 10.1. Hydrodynamic cavitation geometries and expected sonochemical behavior
| Geometry | Pressure history | Typical bubble field | Sonochemical opportunity | Main limitation |
|---|---|---|---|---|
| Single hole orifice | Very rapid drop and recovery with jet separation | Discrete bubbles to compact cloud | Strong collapse and simple replaceable element | Erosion, clogging, high local loss |
| Multi hole orifice | Parallel jets and interacting wakes | Distributed clouds; hole to hole interaction | High throughput and tunable perimeter | Cloud shielding and maldistribution |
| Venturi | Smooth acceleration, throat residence, controlled diffuser recovery | Attached sheet or cloud depending on diffuser | Lower permanent pressure loss and controlled residence | Long clouds can collapse weakly or interact strongly |
| Vortex diode/chamber | Low pressure in swirling core; curved recovery path | Core cavitation with recirculation | Scale up by geometric similarity and robust passage | Complex residence time and gas core behavior |
| Rotor stator | Repeated gap acceleration and pressure pulses | Many short events plus intense shear | High throughput, slurries, sludge, emulsions | Shaft power, seals, erosion, heat generation |
| Micro orifice | Extremely steep gradient over short length | Localized inception and rapid collapse | High radical yield per joule in selected regimes | Low single channel throughput and fouling |
| Long micro diaphragm | Extended low pressure and recovery region | Distributed bubble activity | Uniform exposure and sustained chemistry | Lower local collapse intensity |
| Multistage controlled flow device | Repeated acceleration, cavity formation, recovery, and mixing | Sequenced bubble populations | Tailored number of collapse events and scale up | Greater pressure demand and design complexity |
10.1 Operating pressure, backpressure, and recovery
Increasing inlet pressure usually increases velocity and vapor generation, but chemical yield commonly passes through a maximum. At low pressure, few bubbles reach an inertial collapse. At intermediate pressure, the number of active bubbles and collapse intensity increase. At excessive pressure or too low backpressure, a long vapor cloud can persist beyond the intended reactor and collapse weakly, collectively, or in downstream equipment. Raising backpressure can shorten the cloud and force collapse within a designed recovery zone, but too much backpressure suppresses inception. The optimum is therefore defined by both inlet pressure and pressure ratio.
The recovery gradient is as important as the minimum pressure. A very abrupt recovery can create intense collapse but also erosion and strongly nonspherical jets. A gradual diffuser can reduce loss and erosion but may allow vapor to condense without a violent event. For chemical service, diffuser angle, throat length, and downstream geometry should be selected to place collapse in a replaceable, well mixed region rather than on a pump impeller, valve seat, or thin wall [50,52].
10.2 Temperature, viscosity, surface tension, and dissolved gas
Bulk temperature has competing effects. Higher temperature raises vapor pressure, lowers viscosity, and often increases vapor volume. Lower viscosity improves flow and bubble growth, but increased water or solvent vapor cushions collapse. Chemical reaction rates and mass transfer can improve while radical yield per bubble declines. A temperature sweep is therefore required for each liquid. The optimum for aqueous oxidation is often below the temperature that maximizes visible cavitation.
Surface active contaminants can lower surface tension and stabilize small bubbles or droplets, increasing the apparent bubble count. They can also occupy the interface and scavenge radicals. In wastewater, surfactants may initially promote dispersion and then be degraded, causing the cavitation field to change during treatment. Dissolved salts alter gas solubility and coalescence; solids act as nuclei but can also erode passages or quench radicals. These effects explain why results from clean water cannot be transferred directly to process liquids.
10.3 Hybrid advanced oxidation
Hydrodynamic cavitation is frequently combined with hydrogen peroxide, ozone, Fenton reagents, persulfate, photocatalysts, aeration, ultraviolet light, or electrochemistry. The hybrid process can be synergistic when cavitation improves reagent dispersion, renews catalyst surfaces, decomposes a stable oxidant into radicals, or increases transfer of gas such as ozone. It can be antagonistic when a reagent cushions collapse, scavenges useful radicals, changes pH away from an optimum, or increases ionic strength and recombination [53-56].
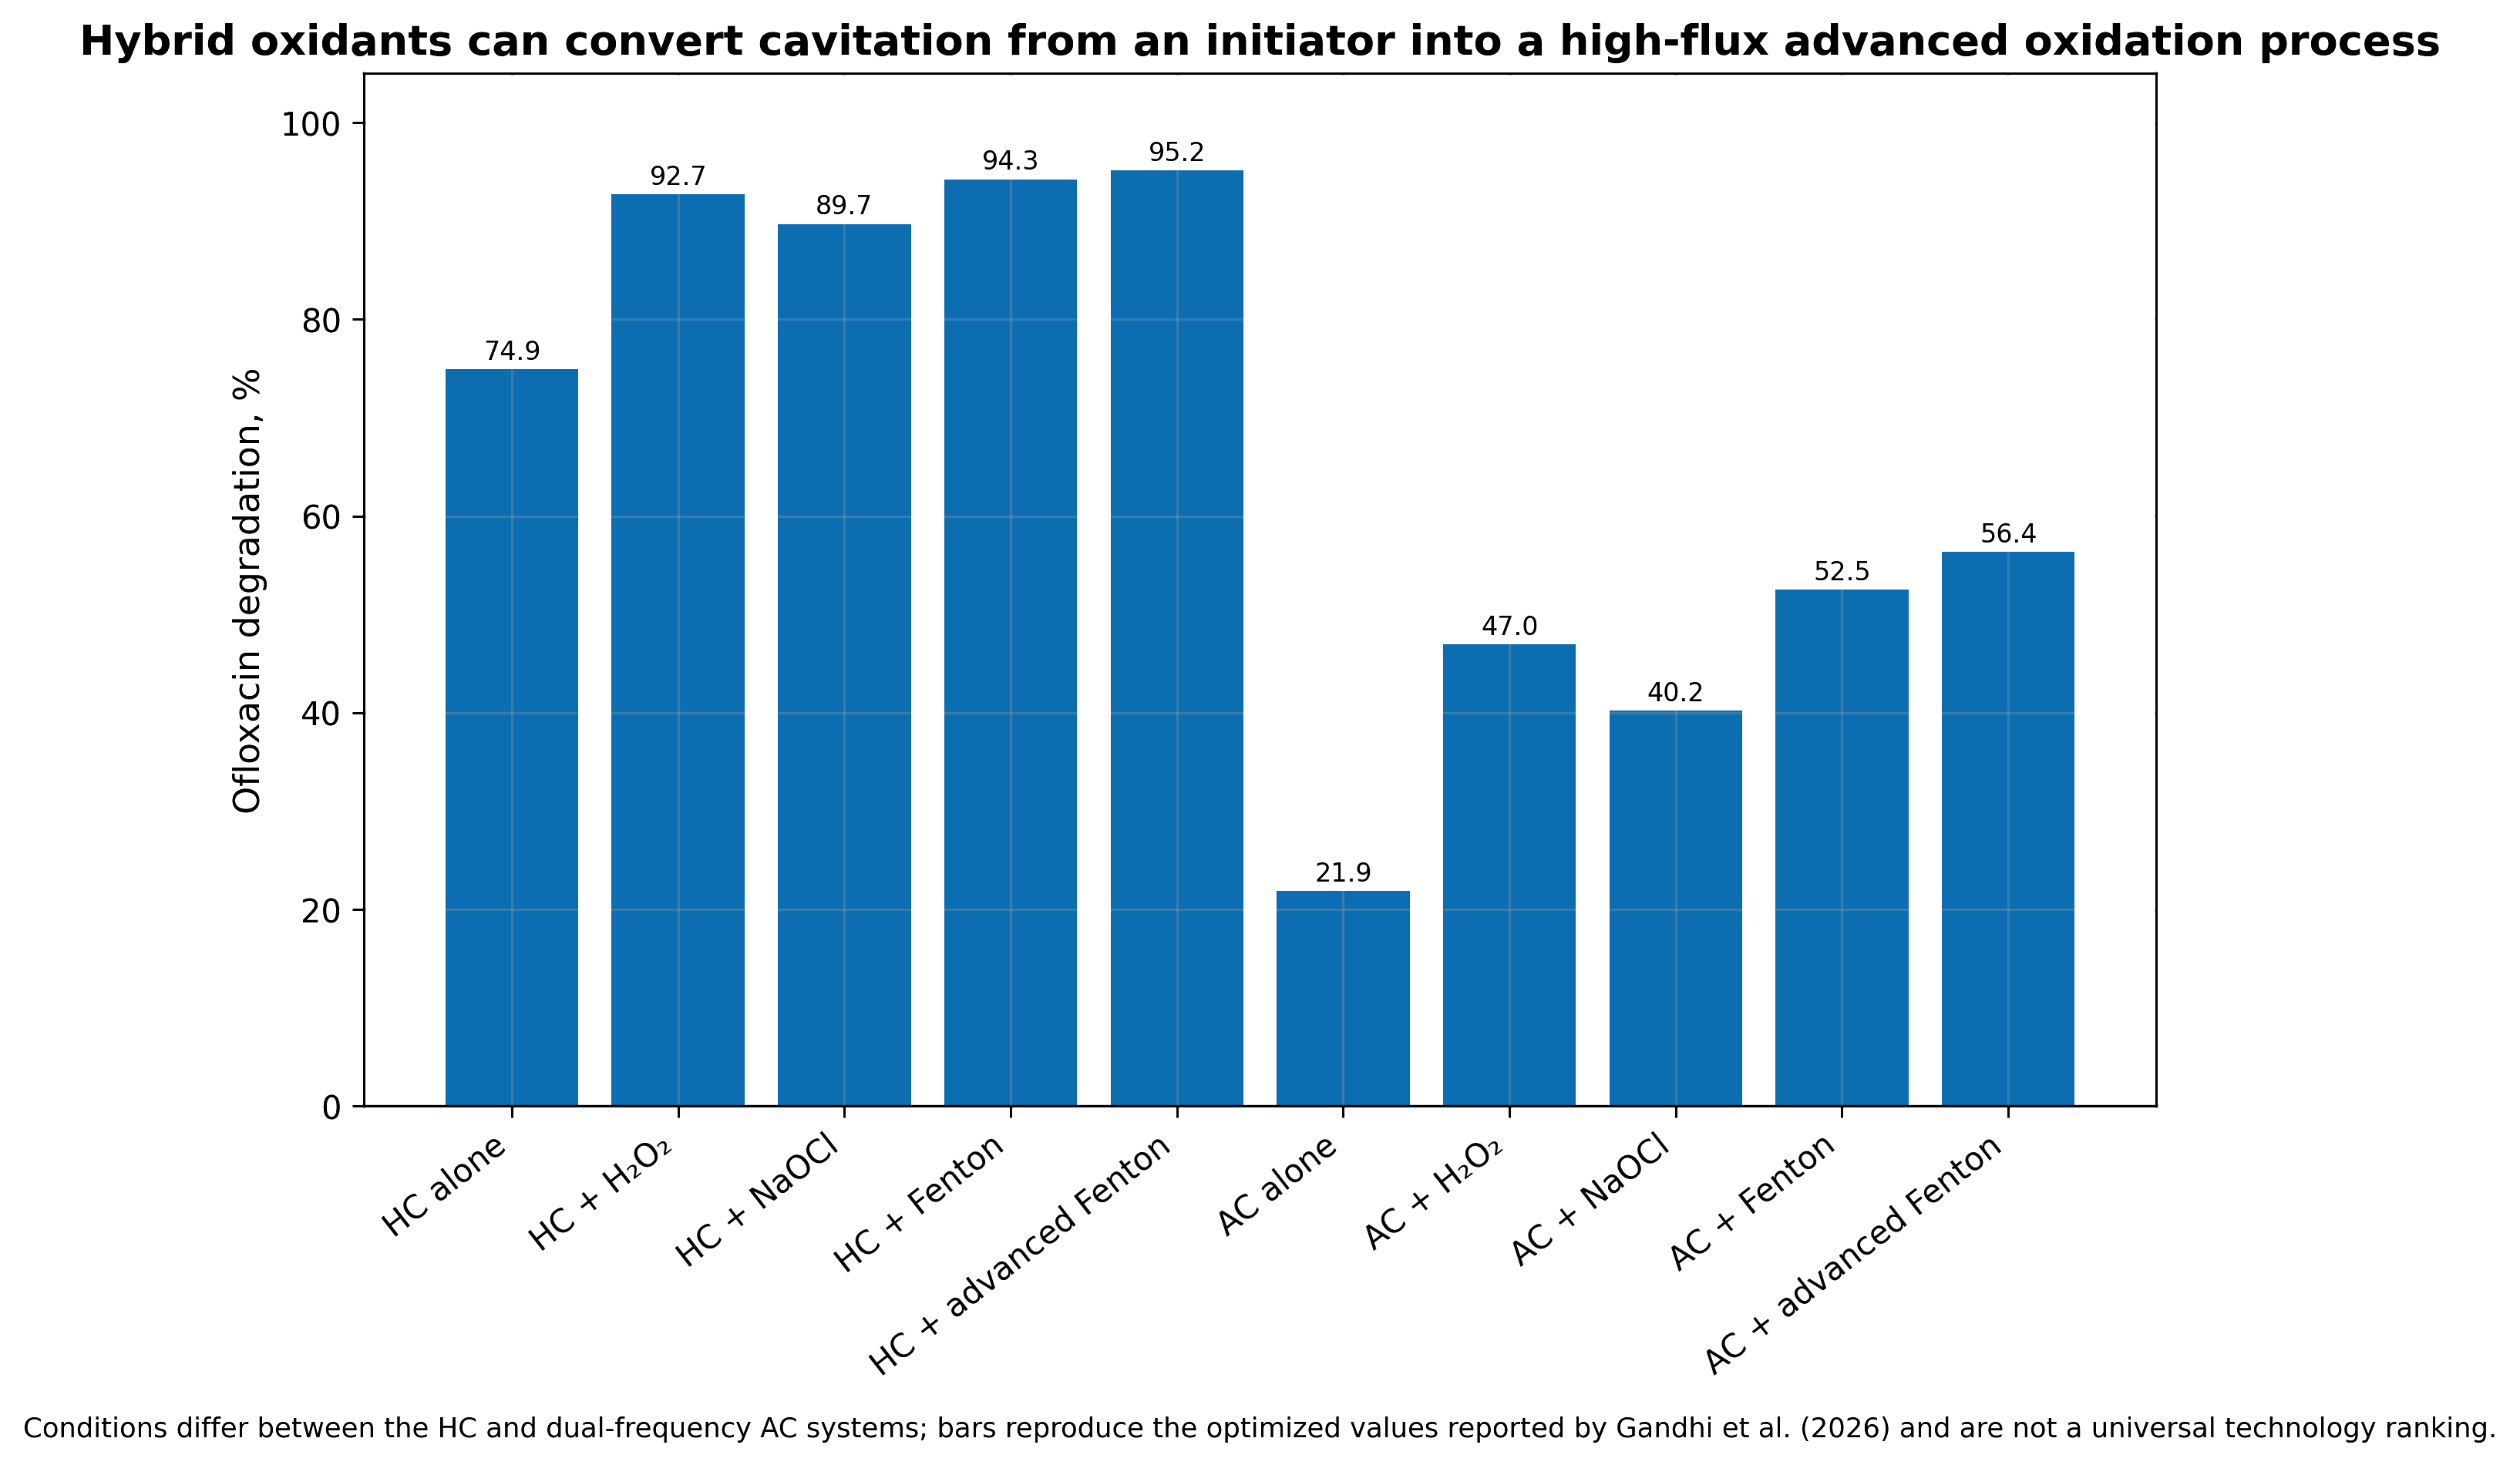
Figure 10.5. Illustrative comparison of hydrodynamic cavitation and hybrid advanced oxidation for a pharmaceutical contaminant. Bars show how auxiliary oxidants can increase conversion while also increasing reagent and energy demand. [53,55-56]. Values are normalized for mechanistic comparison and are not a cross study performance claim.
A proper hybrid evaluation includes four matched tests: untreated control, cavitation alone, auxiliary process alone, and the combination. Reagent consumption and residual oxidant must be measured, not inferred from initial dose. The optimum addition strategy may be staged rather than a single charge. Peroxide added upstream can enter the bubble and decompose, but it can also be consumed before the target is well mixed. Ozone may be transferred more efficiently when injected near the low pressure region, yet gas loading can alter pump performance and bubble collapse. Reactor hydraulics and reagent kinetics must therefore be optimized together.
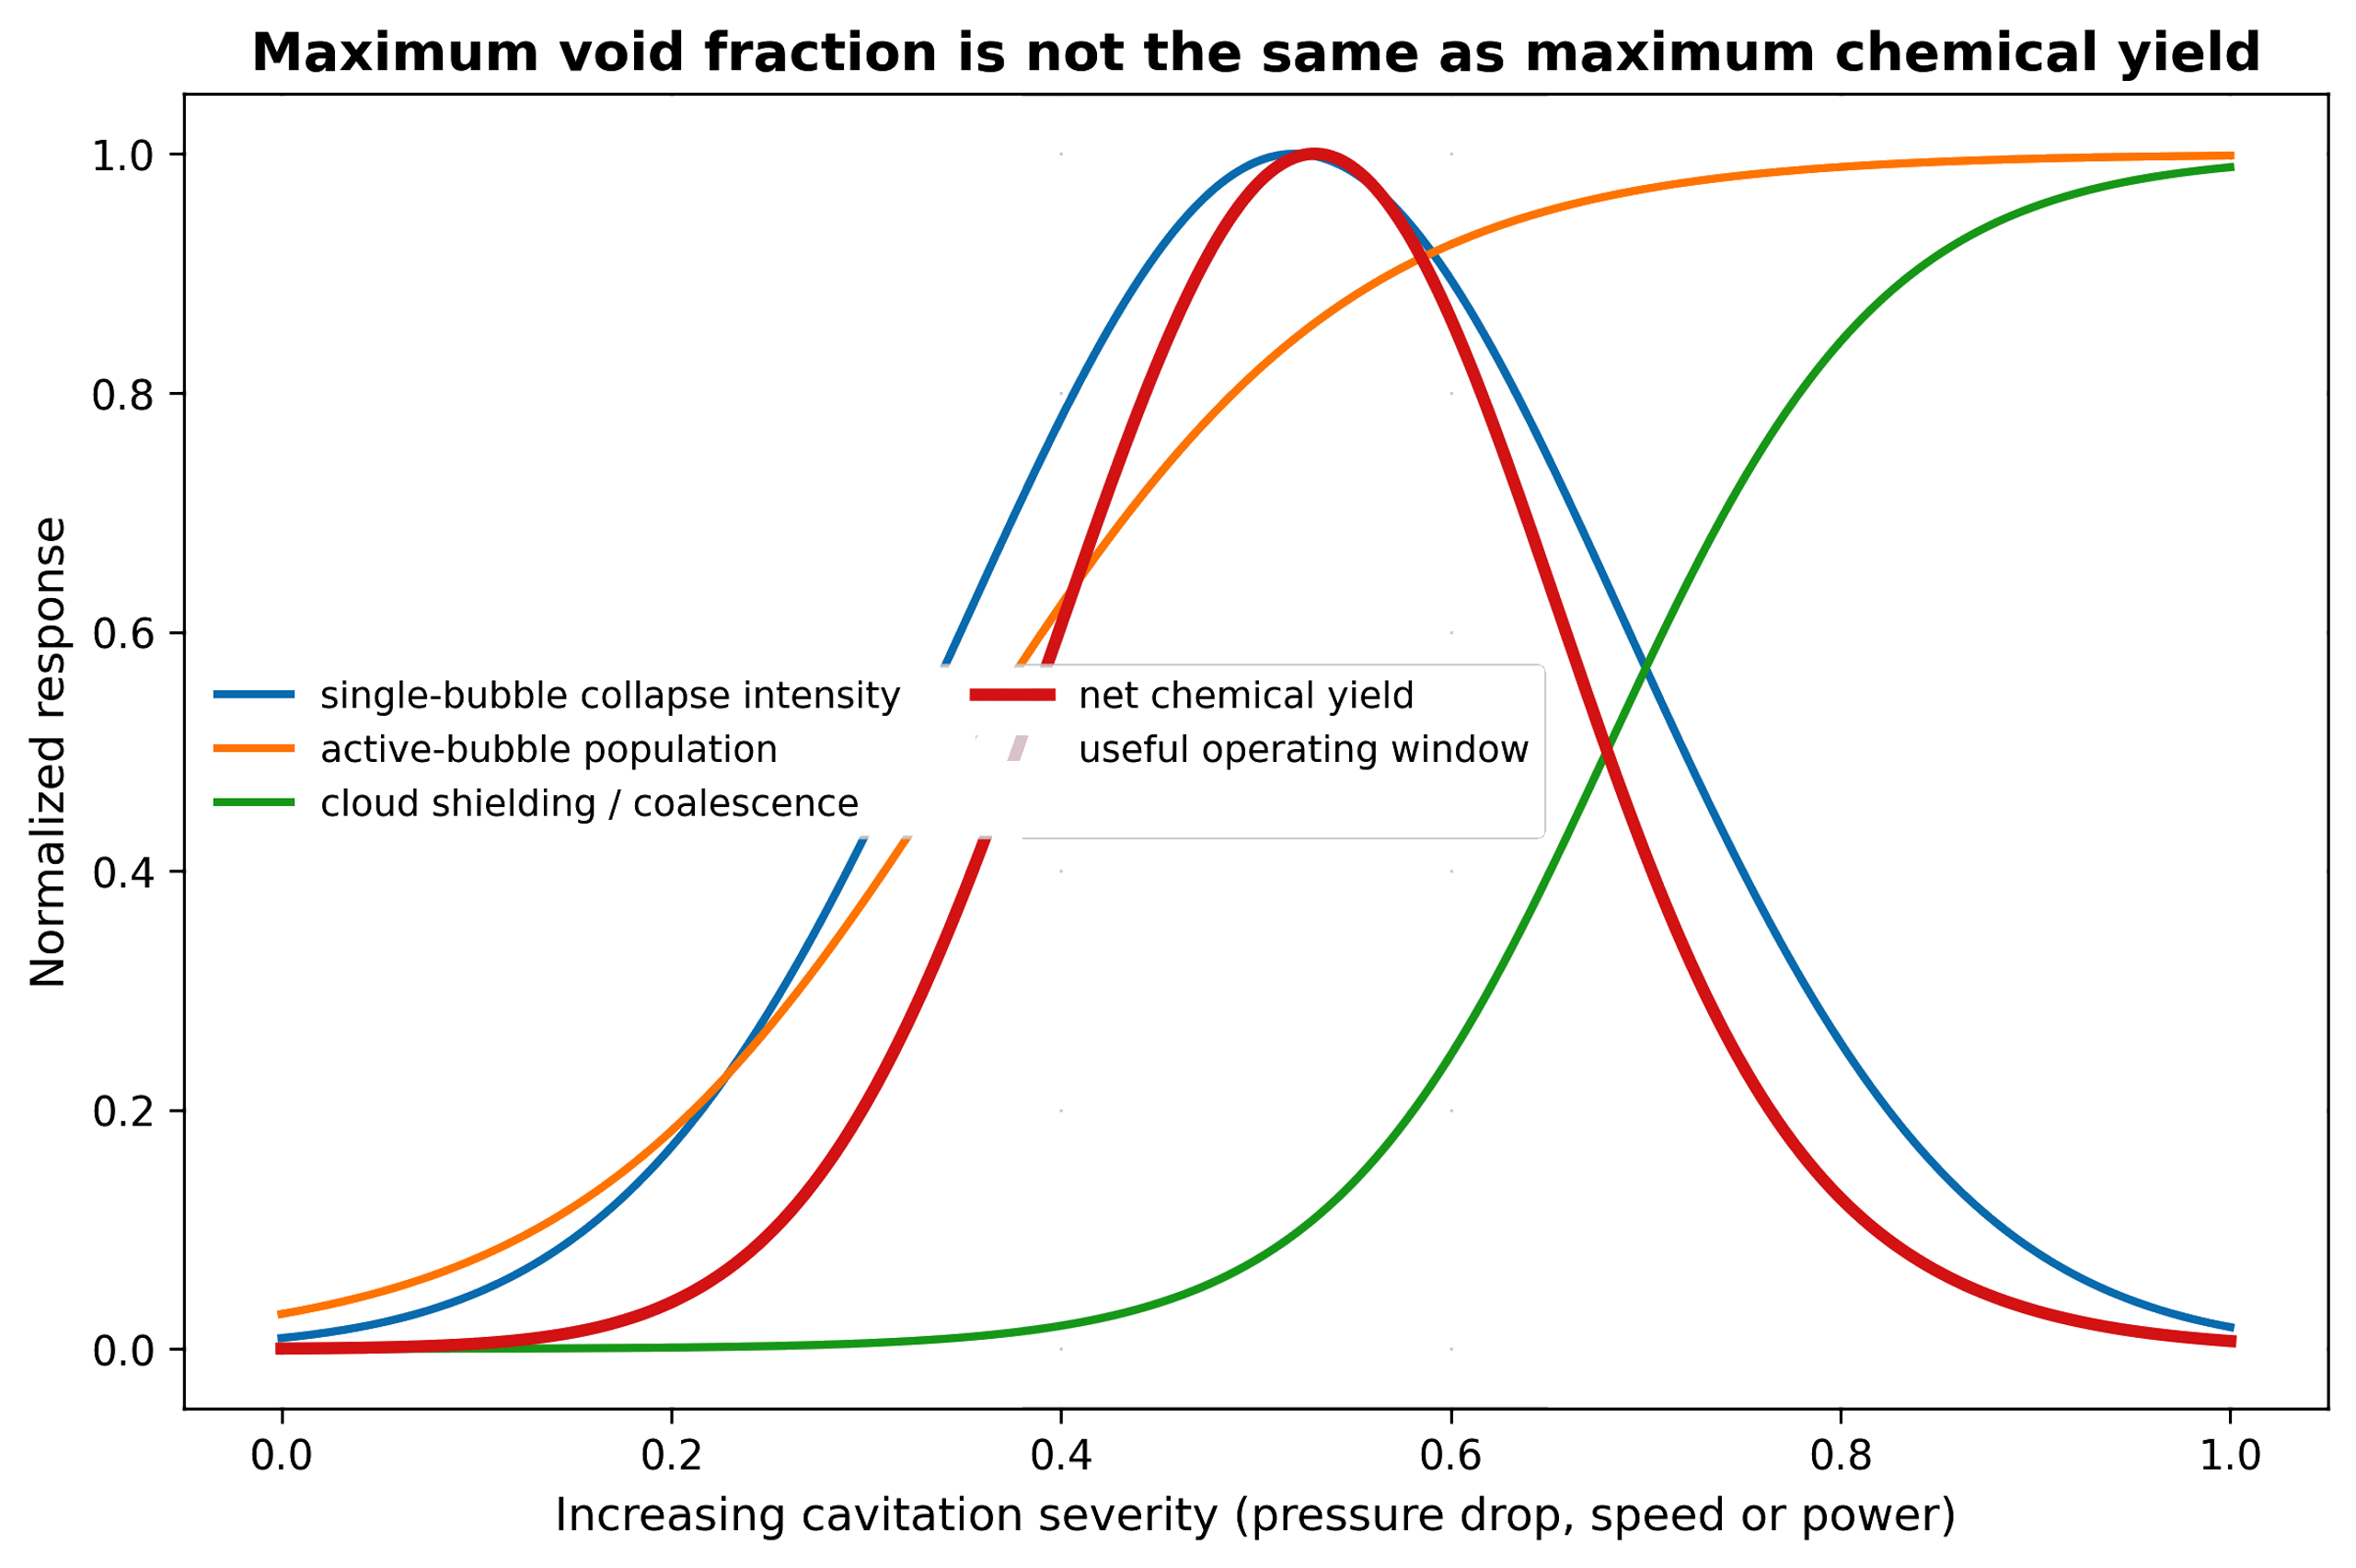
Figure 10.6. Maximum void fraction is not the same as maximum chemical yield. The useful process window balances active bubble population, collapse intensity, radical escape, and reagent accessibility [81].
Table 10.2. Effect of operating variables on chemical yield
| Variable increased | Low to intermediate effect | Excessive value effect | Recommended metric |
|---|---|---|---|
| Inlet pressure or rotor speed | More inception and stronger collapse | Cloud shielding, erosion, heat, and diminishing yield | Product mol/J and cavitation structure |
| Backpressure | Moves collapse into reactor and can intensify recovery | Suppresses bubble growth and inception | Cloud length, pressure ratio, chemical yield |
| Bulk temperature | Lower viscosity and faster kinetics | Higher vapor loading cushions collapse | Yield versus temperature at matched energy |
| Dissolved gas | More nuclei and oxygen availability | Gas cushioning and persistent holdup | Dissolved gas plus bubble count |
| Number of passes | Accumulates exposure and conversion | Product over oxidation, heat, erosion, and diminishing returns | Per pass conversion and selectivity |
| Oxidant dose | More secondary radicals and bulk oxidation | Scavenging, residual chemical, cost | Oxidant utilization efficiency |
| Solids concentration | More nuclei and surface activation | Attenuation, clogging, erosion, and viscosity increase | Specific energy per dry mass |
| Surfactant concentration | Stabilizes dispersion and interfacial area | Radical scavenging and foam | Interfacial area, foam, target conversion |
| Device stages | More controlled collapse events | Higher pressure loss and mechanical complexity | Incremental yield per stage |