Technical publication
Back to publications
Sonochemical Effect Induced by Hydrodynamic Cavitation
okozyuk.com
Published
Sonochemical Effect Induced by Hydrodynamic Cavitation
Abstract
Hydrodynamic cavitation can generate chemical effects analogous to those associated with acoustic sonochemistry while operating through spatial pressure reduction and recovery in a flowing liquid rather than through an imposed acoustic field. This article examines the physical and chemical basis of these effects, including bubble growth and inertial collapse, adiabatic compression, gas and vapor composition, radical generation, interfacial chemistry, and transport into the bulk liquid. The analysis distinguishes thermal, interfacial, bulk, and mechanically assisted reaction pathways and evaluates the influence of device geometry, pressure recovery, temperature, dissolved gas, bubble cloud structure, and repeated exposure. Chemical dosimetry, energy normalization, high speed imaging, luminescence, and thermal diagnostics are considered as complementary methods for establishing a defensible evidence chain from hydraulic forcing to chemical output. Representative applications include advanced oxidation, disinfection, inorganic synthesis, crystallization, organic and multiphase processing, biomass treatment, and food and beverage processing. Experimental evidence demonstrates that maximum visible vapor volume does not necessarily correspond to maximum chemical yield because bubble interaction, shielding, recombination, and collapse location affect productive energy focusing. The principal scale up objective is therefore to preserve the pressure history, active bubble population, chemically productive collapse exposure, gas condition, residence time distribution, and energy boundary required for the target reaction while controlling erosion, contamination, and safety.
1 Introduction
This article applies standard hydraulic definitions, energy boundaries, residence time expressions, uncertainty requirements, and scale translation principles to the sonochemical effects induced by hydrodynamic cavitation. The discussion develops the relevant mechanisms, models, measurement methods, reactor design principles, and acceptance criteria.
Cavitation is the formation, growth, and collapse of vapor filled or gas vapor cavities when the local liquid pressure is reduced sufficiently below the pressure required to sustain the continuous liquid phase. In a hydrodynamic cavitation reactor, the pressure reduction is generated by fluid acceleration, streamline curvature, vortex formation, rotor motion, or a combination of these mechanisms. A restriction, Venturi throat, orifice, vortex core, valve trim, rotor stator gap, or specially profiled passage produces a low pressure interval in which preexisting nuclei grow. Downstream pressure recovery then drives collapse. This sequence is mechanically different from acoustic cavitation, where an oscillating sound field repeatedly supplies tensile and compressive half cycles, but the terminal collapse of a sufficiently inertial bubble can create closely related physical and chemical microenvironments [1-10].
The term sonochemical effect is retained because the relevant chemistry was first established and most extensively characterized in ultrasonic fields. It should not be interpreted to mean that sound waves are required. Hydrodynamic cavitation can induce the same primary radical generating reactions, including water vapor dissociation and secondary peroxide formation. Suslick, Mdleleni, and Ries demonstrated that hydrodynamically induced chemistry responds to dissolved gas and liquid temperature in ways analogous to acoustic sonochemistry [4]. Subsequent hydrodynamic studies quantified iodide oxidation, hydroxyl radical production, and pollutant degradation in orifice, Venturi, vortex, and microscale devices [5-6,11-15]. The reaction mechanism may therefore be chemically analogous while reactor yield, selectivity, and energy efficiency remain device specific.
For engineering analysis, cavitation inception and severity are commonly summarized by the cavitation number. Because definitions vary among device classes, the pressure and velocity locations used in the ratio must always be stated. A practical form based on a selected downstream reference pressure and throat velocity is:
where σ is the cavitation number, is the selected downstream or recovered pressure, is liquid vapor pressure, ρ is liquid density, and is the characteristic throat or minimum passage velocity. A lower value generally increases the probability and extent of cavitation, but σ alone does not specify the duration of the low pressure interval, the pressure recovery gradient, bubble cloud density, or collapse location.
The pressure reduction itself follows the mechanical energy balance. Between two stations of a flowing liquid, including irreversible head loss , the balance may be written as:
where p is static pressure, u is mean velocity, z is elevation, g is gravitational acceleration, and is irreversible head loss expressed as liquid head. Equation (1.2) emphasizes that a cavitation device does not create energy. It converts pump work and pressure head into acceleration, turbulence, phase change, and pressure recovery. Only a fraction of that energy reaches chemically productive bubble collapses.
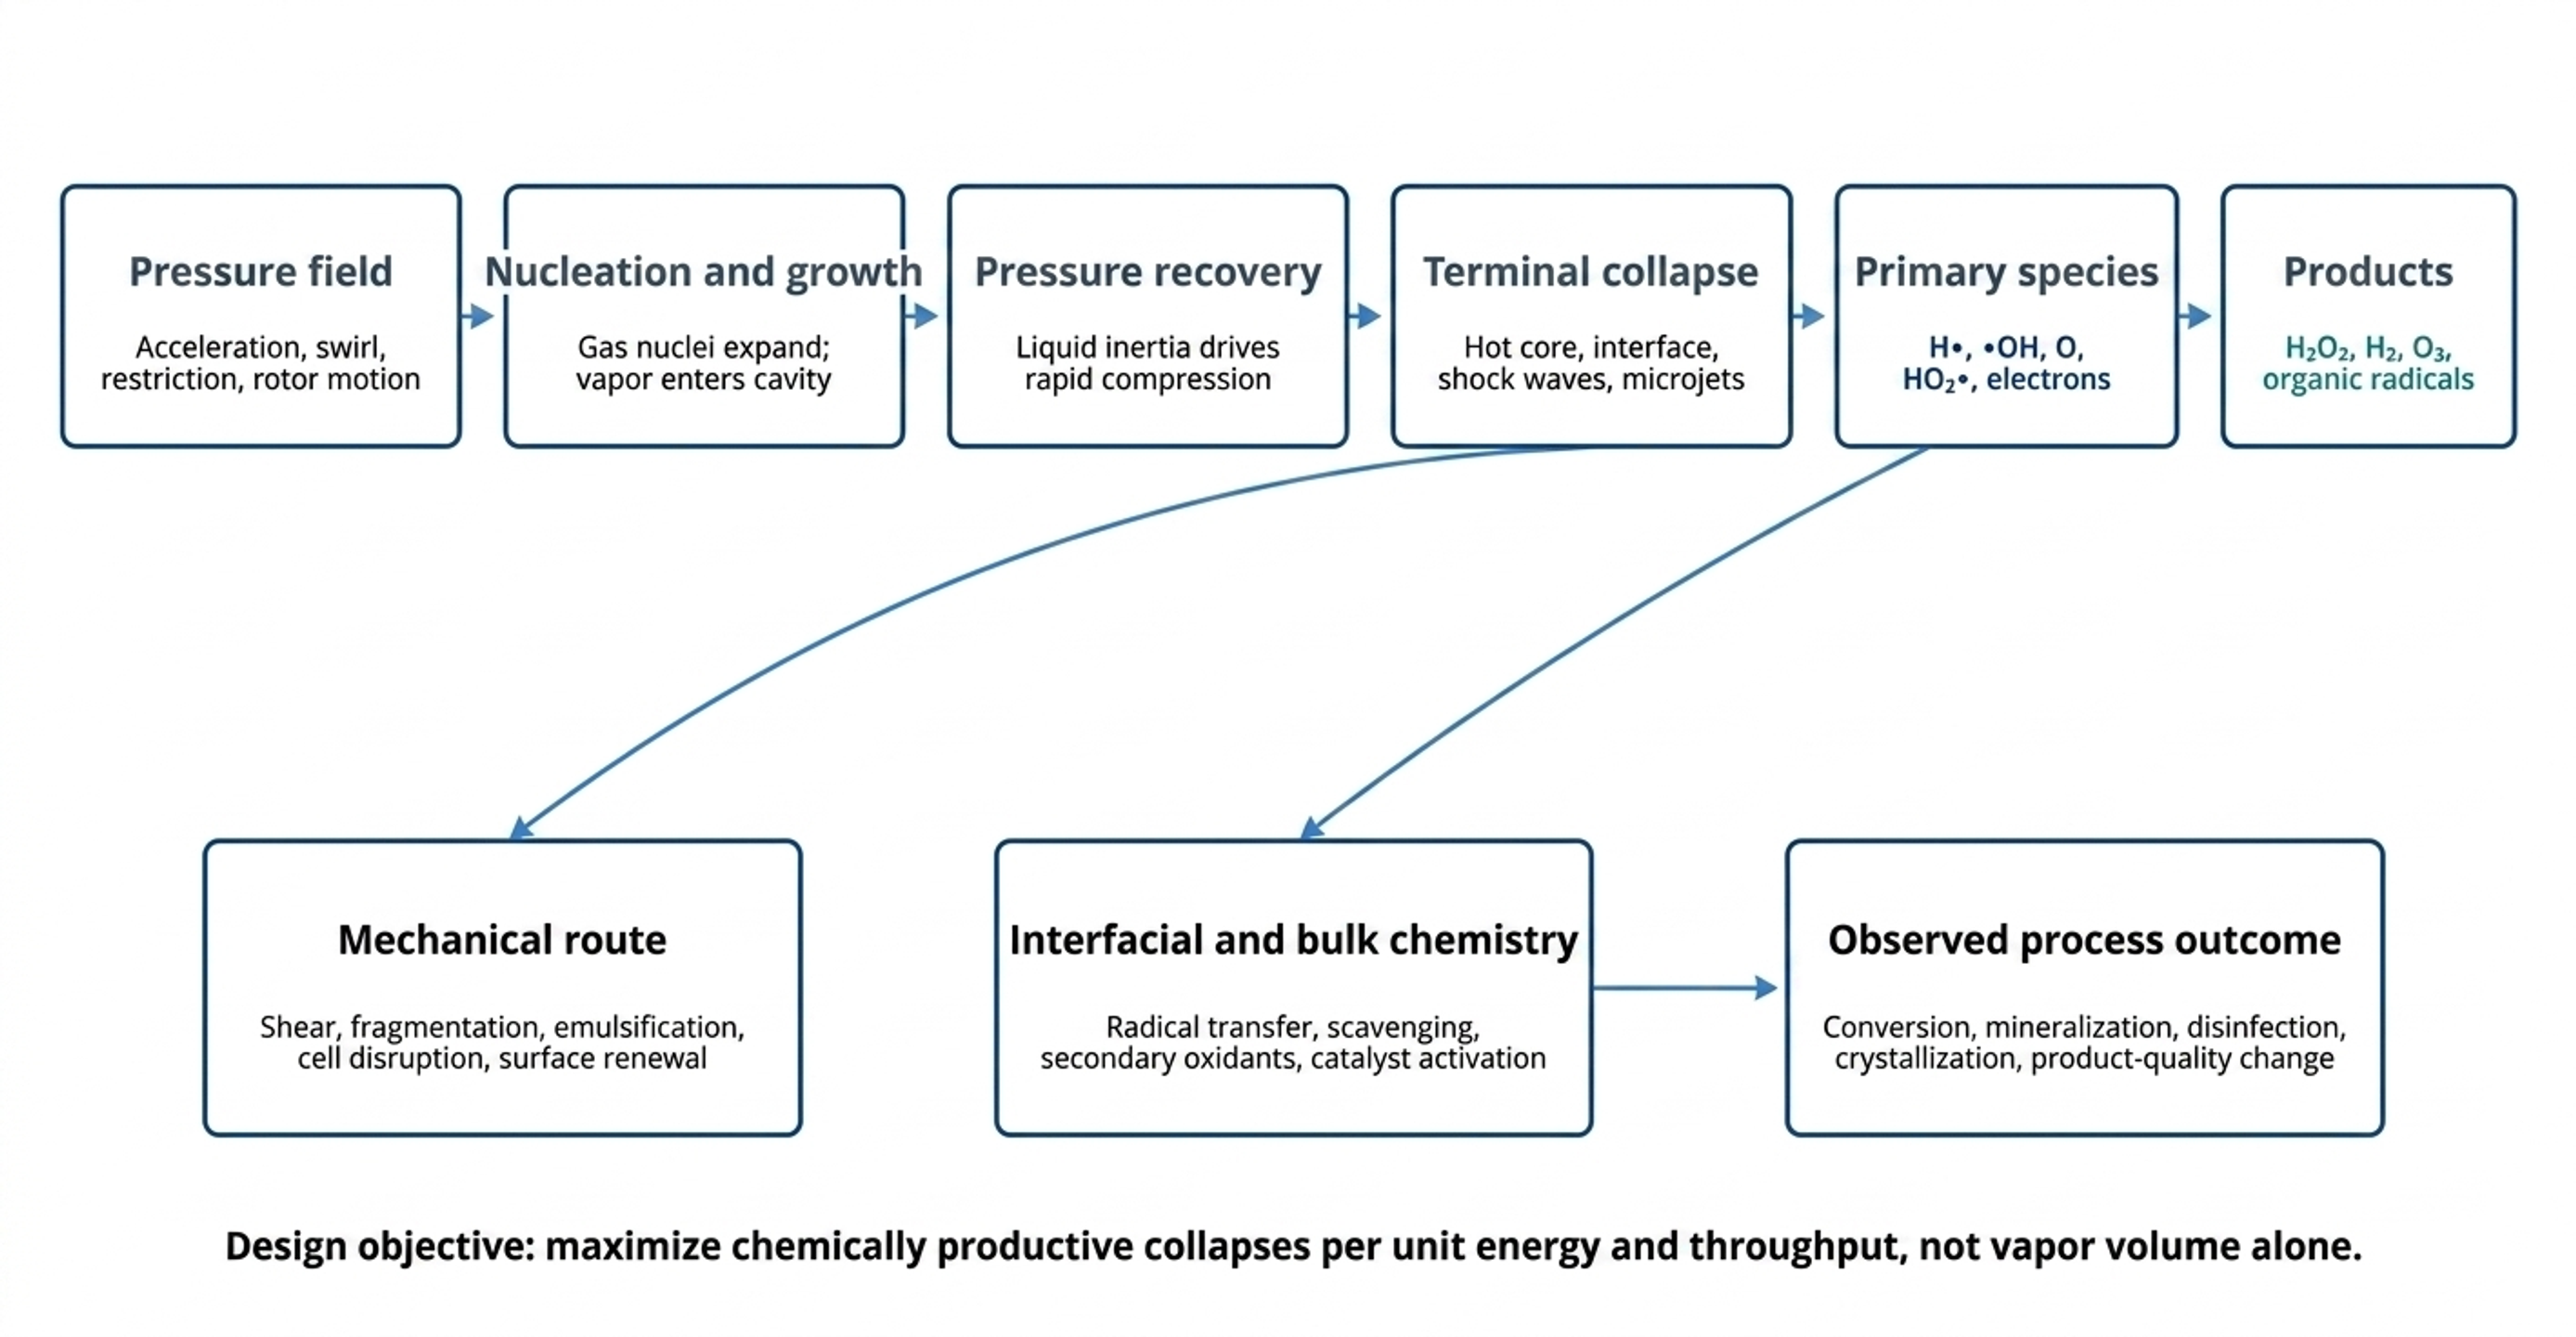
Figure 1.1. Integrated mechanism map for the sonochemical effect induced by hydrodynamic cavitation [81].
Figure 1.1 separates the pressure field mechanism from the observed process result. This distinction is necessary because a large conversion increase may arise from direct radical chemistry, mechanical interfacial renewal, or a combination of both. The same device can therefore be highly effective for emulsification or cell disruption while producing a modest stable oxidant yield.
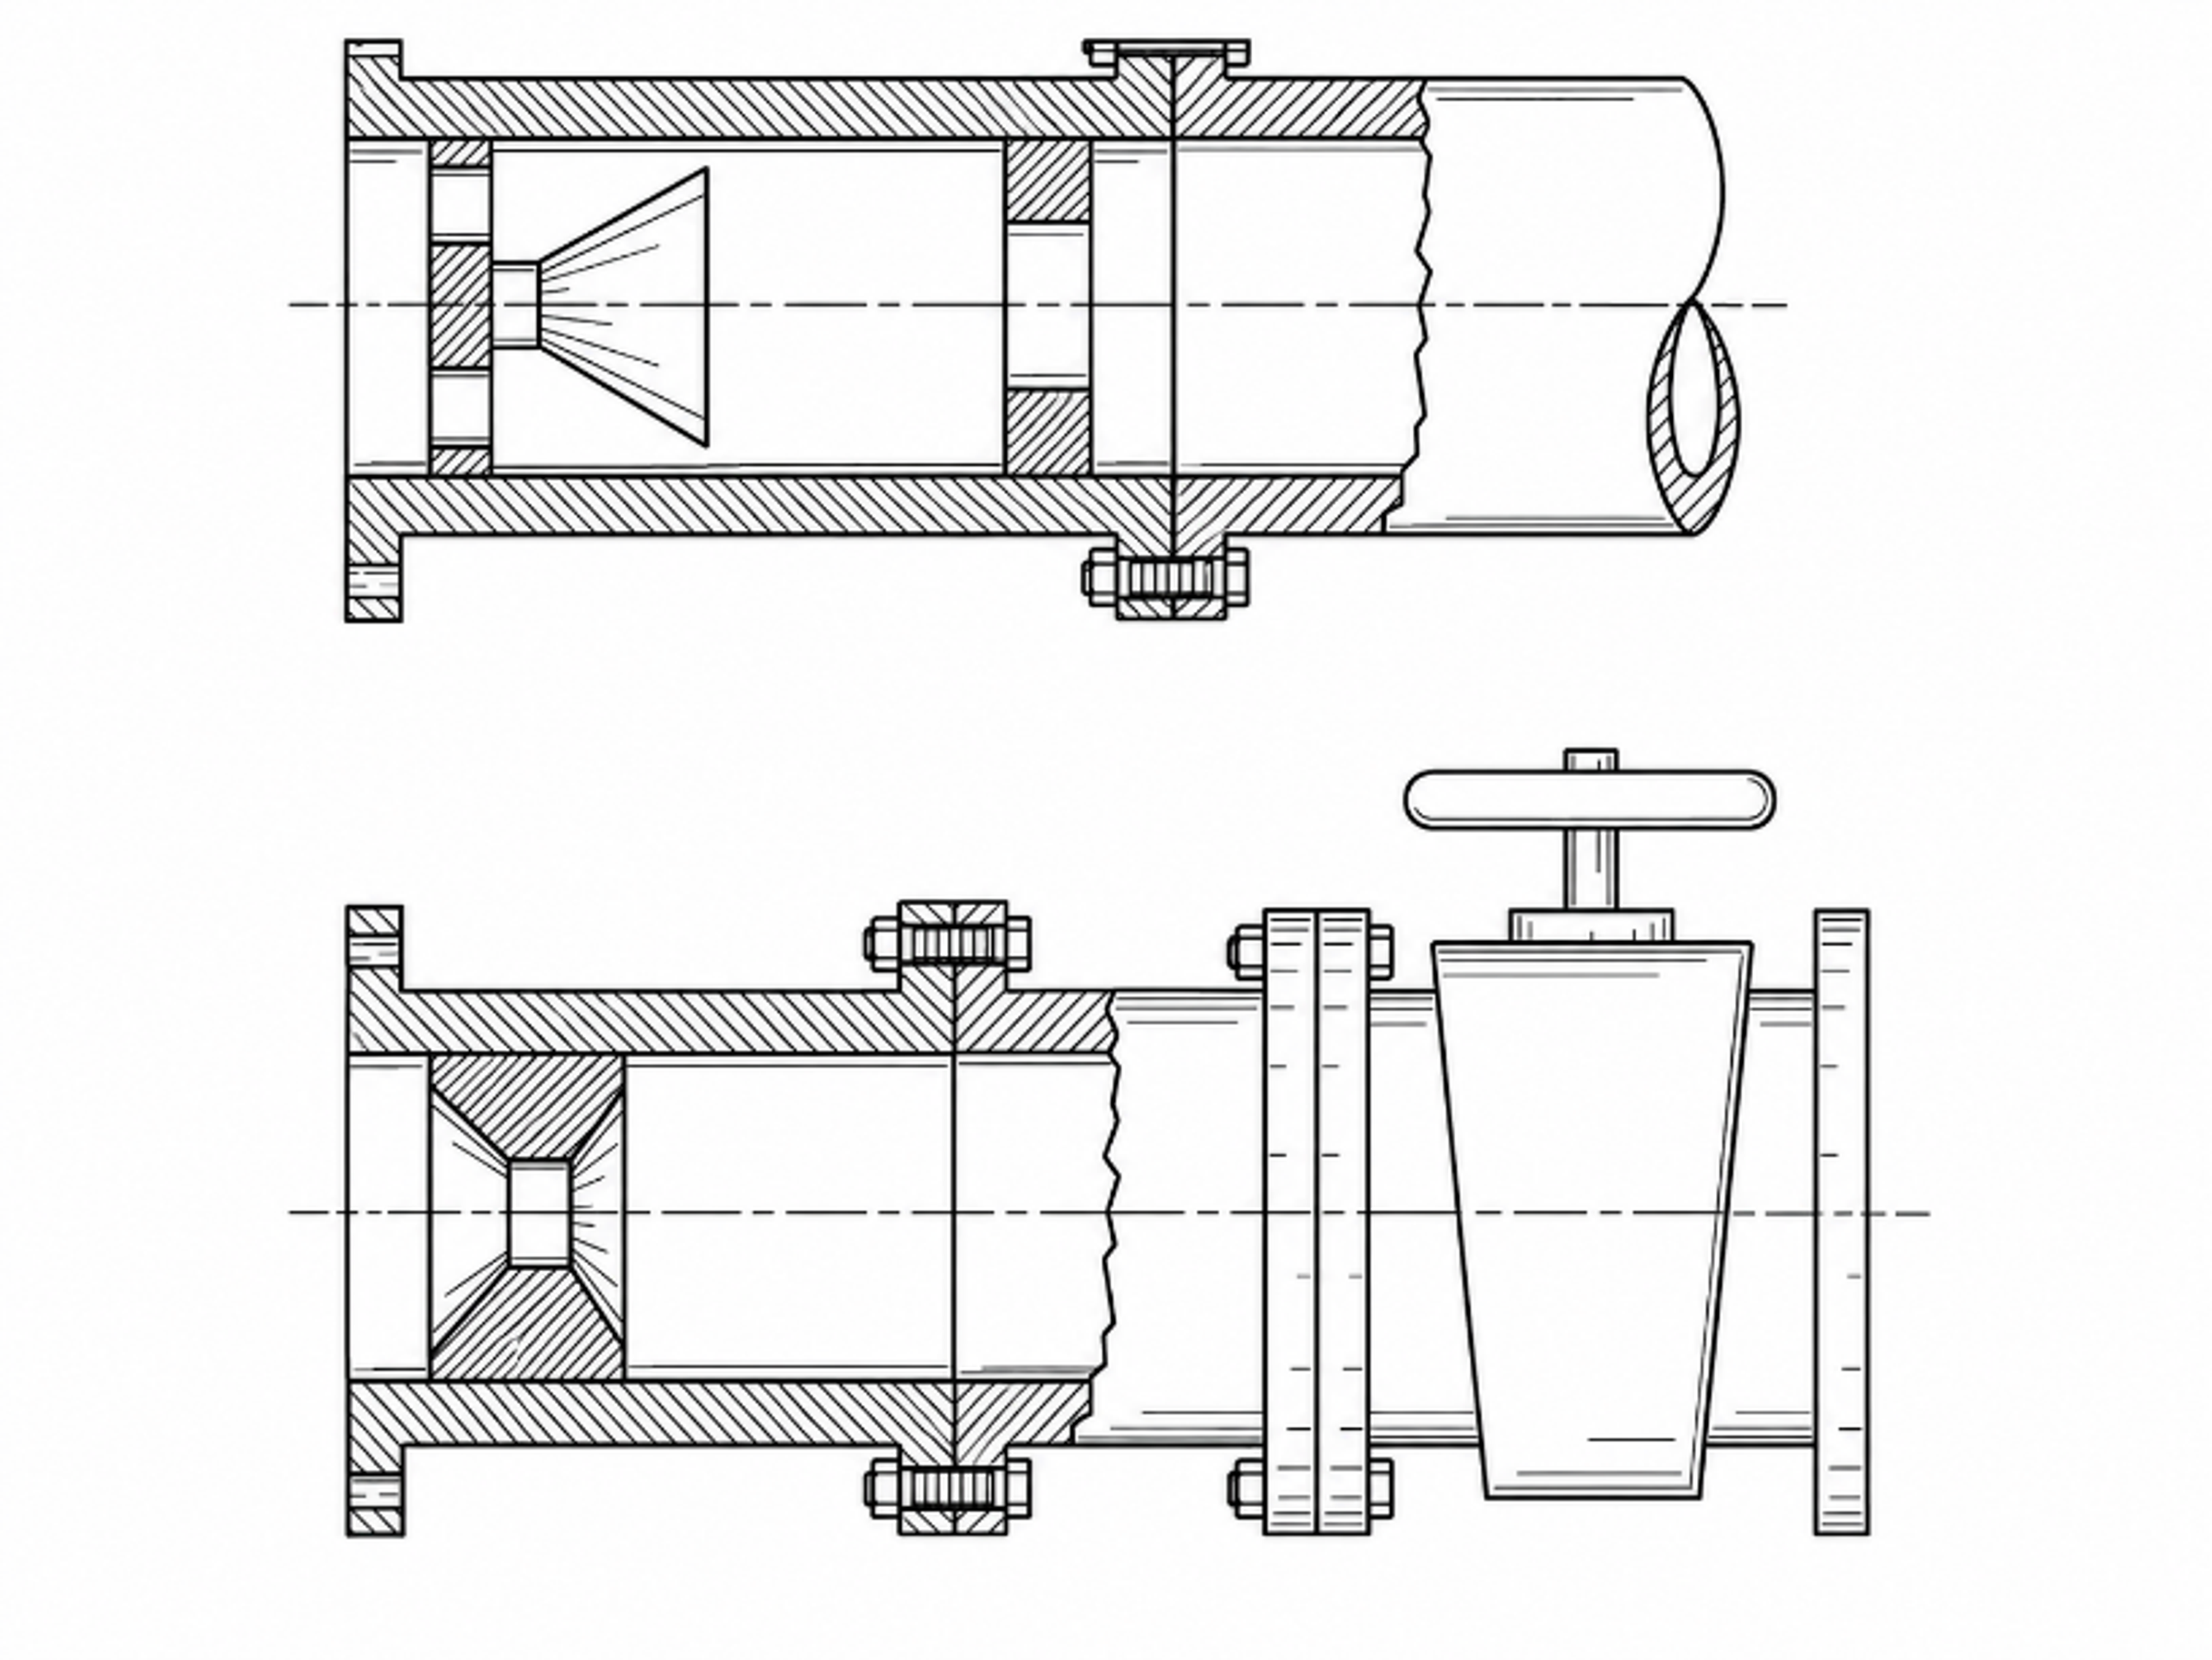
Figure 1.2. Controlled flow apparatus for generating cavities in a local constriction and collapsing them in a downstream elevated pressure region. [16].
The apparatus concept in Figure 1.2 makes the sequence explicit: a local restriction generates a cavitation cavern, the cavities are convected downstream, and a separate hydraulic resistance or recovery zone raises static pressure to initiate collapse. This separation of inception and collapse zones is a recurring design principle in later multistage, vortex, and microfluidic devices [15-17].
Table 1.1. Evidence chain for identifying a genuine hydrodynamic sonochemical effect
| Stage | Required evidence | Chemical significance | Recommended measurement |
|---|---|---|---|
| Hydrodynamic forcing | Defined pressure drop, throat velocity, pressure time history | Establishes whether nuclei experience a low pressure growth interval | Calibrated pressure sensors, flow rate, temperature |
| Cavity formation | Vapor or gas vapor population in the predicted low pressure zone | Confirms phase change or gas release rather than turbulence alone | High speed imaging, acoustic emission, void fraction |
| Collapse and energy focusing | Pressure recovery, shock emission, microjets, rebound or luminescence | Provides a physical route to local heating and bond cleavage | Hydrophone or pressure transducer, high speed imaging, erosion witness |
| Primary chemistry | Radical specific or radical sensitive chemical signal | Demonstrates reactive species formation | Coumarin, salicylic acid, iodide, luminol, EPR where available |
| Process outcome | Mass balance, intermediates, mineralization, selectivity or biological response | Connects cavitation chemistry to the target process | HPLC, LC MS, TOC, spectroscopy, microbiology |
| Energy performance | Yield normalized to a declared hydraulic and electrical boundary | Prevents high conversion at high energy from being misidentified as efficient | mol J⁻¹, g J⁻¹, kWh m⁻³, throughput per reactor volume |
1.1 Terminology and scope
The phrase chemical effect of cavitation includes several mechanisms that should be separated. Thermal chemistry occurs in the compressed gas vapor core. Interfacial chemistry occurs in the hot, high gradient liquid shell surrounding the bubble. Bulk liquid chemistry is driven by radicals and longer lived products transported away from the collapse. Mechanical chemistry includes reactions accelerated indirectly by emulsification, particle fracture, oxide removal, catalyst activation, cell disruption, and renewal of phase boundaries. A process may show a large conversion increase even when the direct radical yield is modest, because cavitation simultaneously changes mass transfer, local composition, and available surface area [3,18-23].
For aqueous advanced oxidation, hydroxyl radicals are often treated as the principal species. This is useful but incomplete. Hydrogen atoms, hydroperoxyl and superoxide radicals, oxygen atoms, ozone under some gas compositions, hydrogen peroxide, nitrogen derived species, chlorine radicals in saline water, sulfate radicals when persulfate is present, and organic radicals formed from volatile solutes can all contribute. The observed pathway is therefore a network whose dominant branch depends on bubble temperature, gas atmosphere, solute location, pH, ionic strength, and the time between radical creation and reaction [24-32].
2 Bubble Dynamics and the Three Zone Model of Cavitation Chemistry
The chemical microreactor is created during the final fraction of the collapse. A bubble first grows because the external pressure falls and vapor or gas enters the cavity. When the external pressure recovers, the surrounding liquid accelerates inward. The inertia of this liquid can carry the interface far beyond quasistatic equilibrium, compressing noncondensable gas and residual vapor into a very small volume. Liquid compressibility, shock formation, heat conduction, condensation, evaporation, diffusion, chemical reactions, and nonspherical deformation become increasingly important as the radius approaches its minimum [1-2,24,33-35].
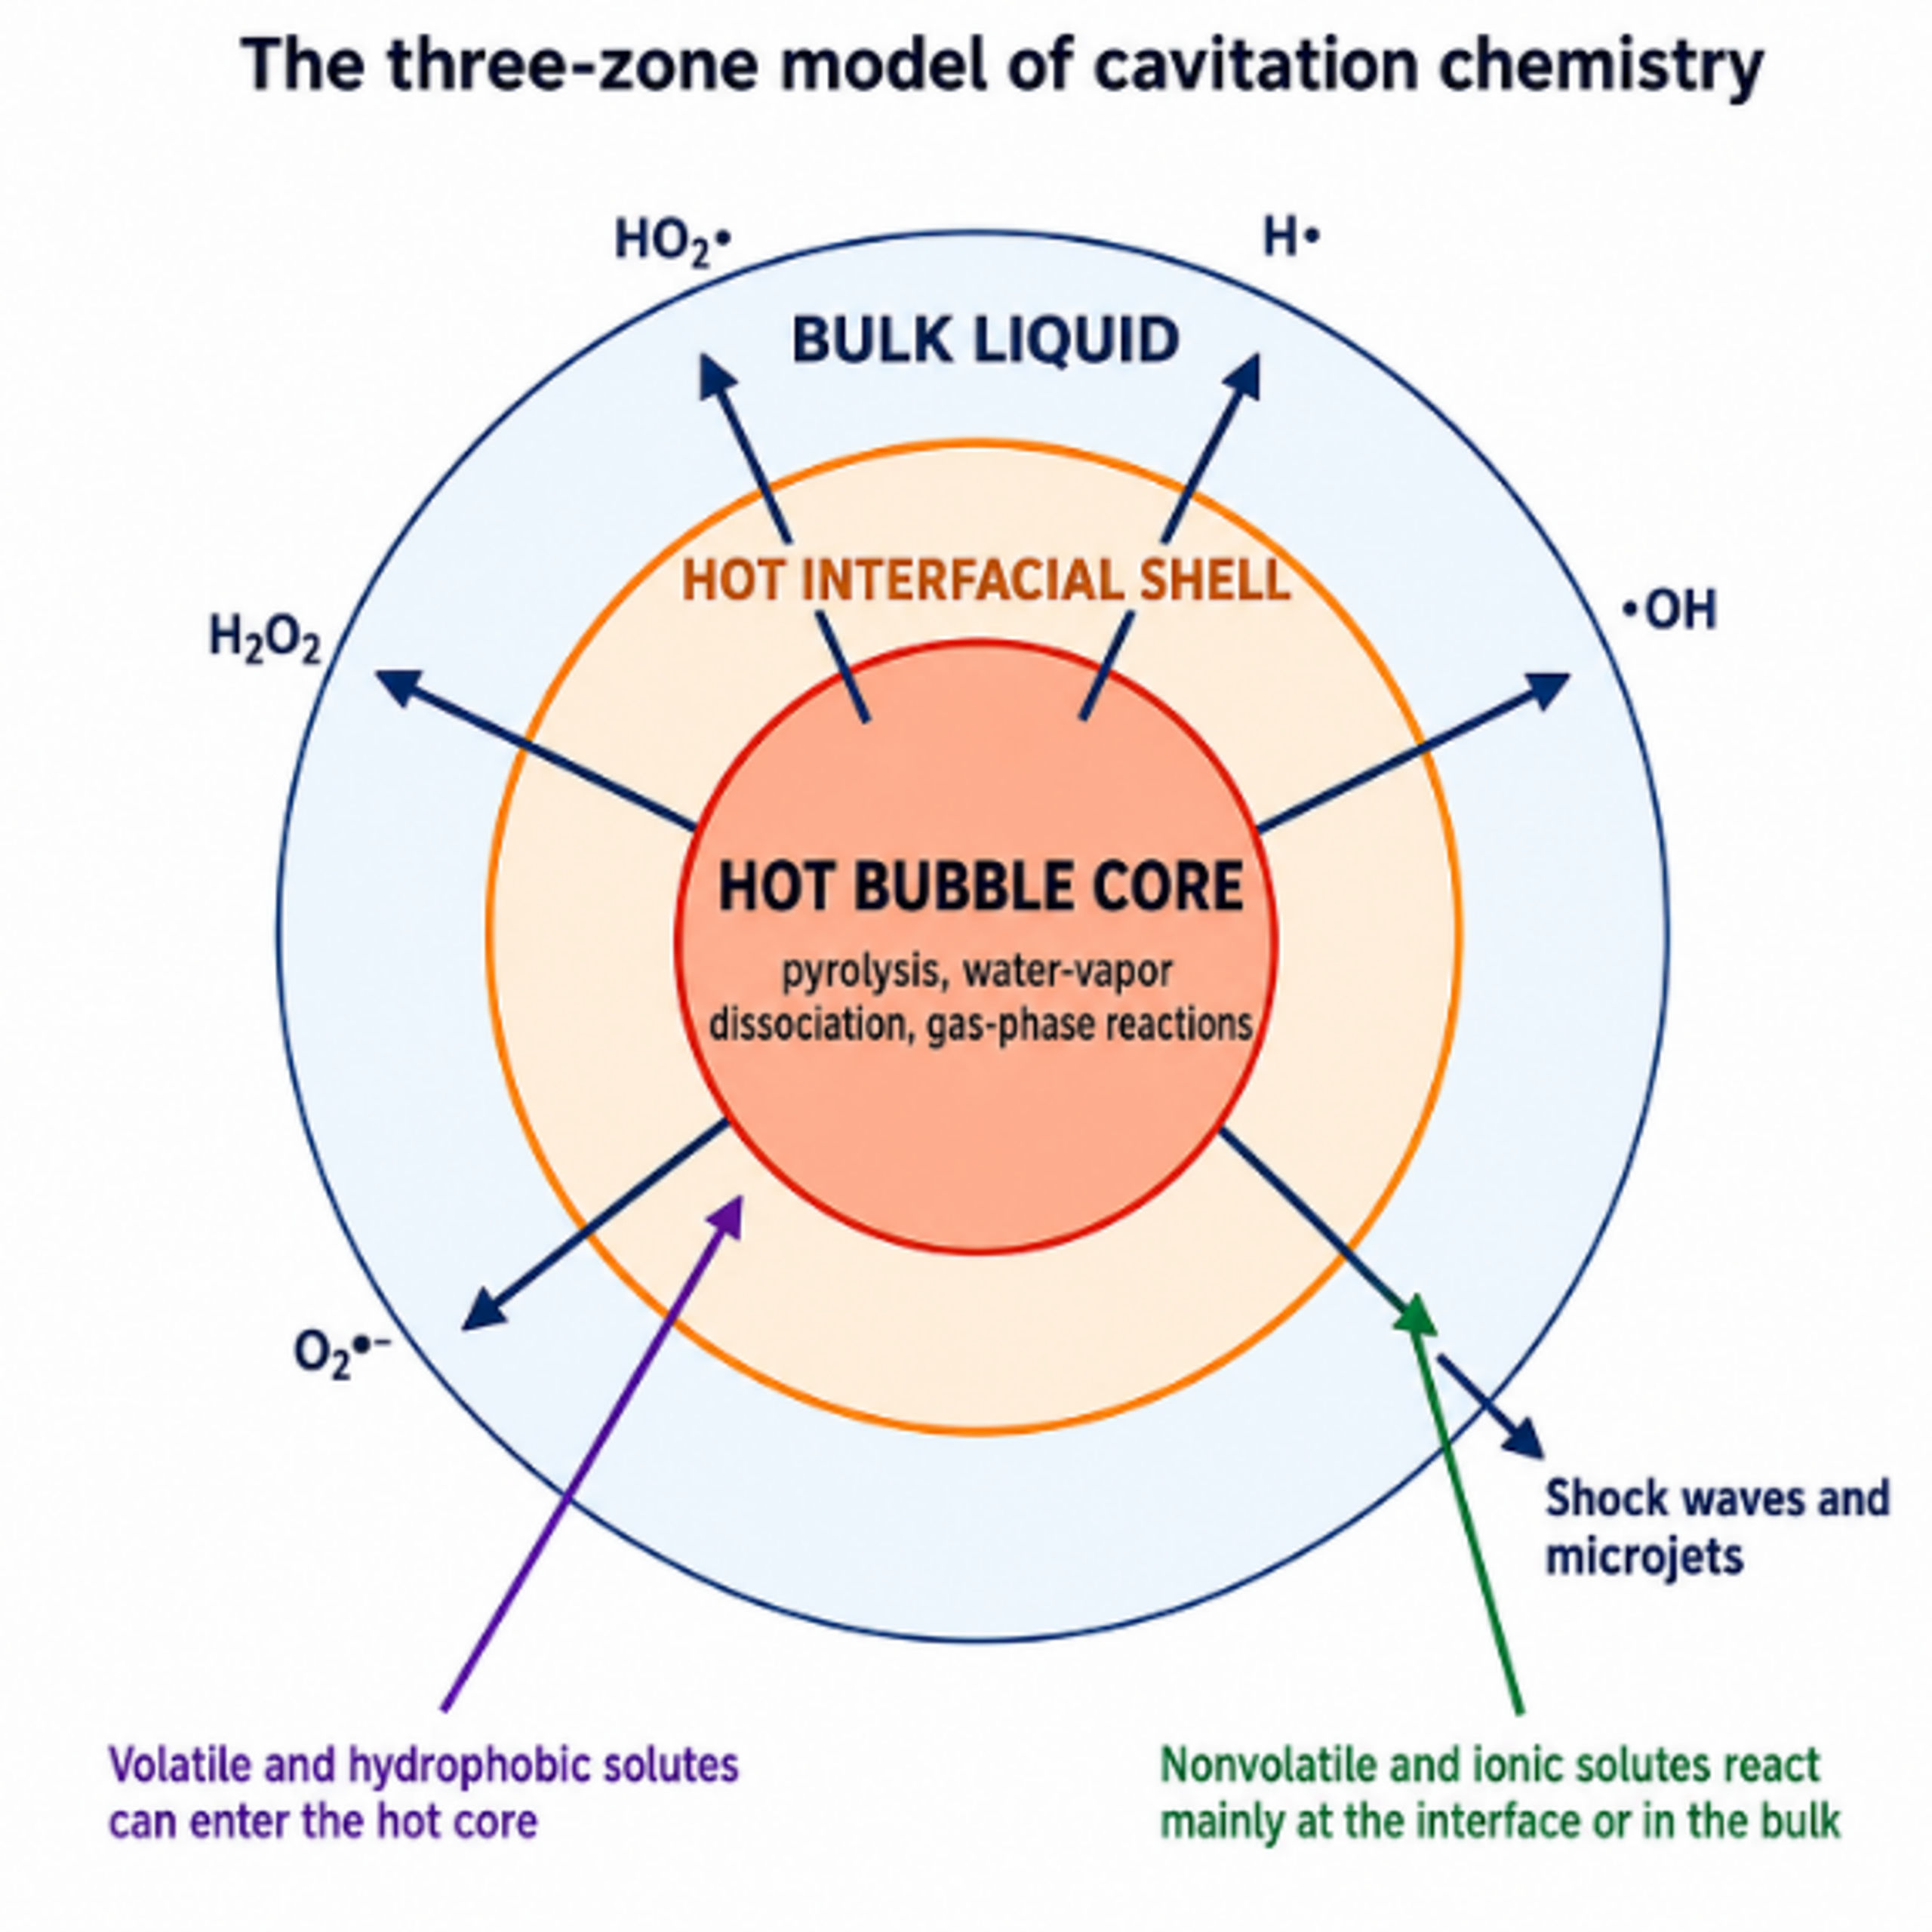
Figure 2.1. Three zone model of cavitation chemistry: gas vapor core, hot interfacial shell, and surrounding bulk liquid [81].
The three zone model in Figure 2.1 is a practical framework for predicting where a reactant will be transformed. Volatile molecules can enter the bubble during growth and undergo pyrolysis or radical attack in the gas vapor core. Nonvolatile ionic species remain in the liquid and react mainly in the interfacial shell or bulk. Moderately volatile amphiphilic molecules can accumulate at the interface, where they experience high radical flux and strong thermal gradients. The interface is not a geometrically sharp reaction surface; it is a transient region with steep temperature, density, and composition gradients.
For a spherical bubble in an incompressible liquid, the classical Rayleigh Plesset equation provides the baseline dynamic balance. It is not adequate for the last instants of a strongly compressible collapse, but it organizes the effects of pressure, gas compression, viscosity, and surface tension:
where R is bubble radius, is pressure inside the bubble, is far field liquid pressure, S is surface tension, μ is dynamic viscosity, and overdots denote time derivatives.
When vapor and gas pressure are neglected, the classical Rayleigh collapse time of an empty spherical cavity of maximum radius under constant driving pressure Δp
where is the first collapse time and Δp is the pressure difference driving collapse.
Equation (2.2) shows why the event is short. A 100 µm cavity collapsing under a 100 kPa pressure difference has a Rayleigh time of approximately 9 µs. The chemically active compression stage occupies only a small fraction of that interval. Consequently, high peak temperature alone is not enough: reaction rates must be fast on nanosecond to microsecond scales, and products must escape recombination during the subsequent quench.
Table 2.1. Chemical characteristics of the bubble core, interfacial shell, and bulk liquid
| Region | Approximate condition | Species favored | Typical reactions | Controlling transport |
|---|---|---|---|---|
| Gas vapor core | Highest transient temperature; low total mass; strong composition change | H•, •OH, O, excited atoms, volatile organic radicals, NOx intermediates | Thermolysis, pyrolysis, gas phase recombination | Evaporation, condensation, gas diffusion, internal shocks |
| Interfacial shell | High temperature gradient and high radical concentration | •OH, H•, organic radicals, solvated products | Hydrogen abstraction, addition to double bonds, electron transfer | Radical diffusion, adsorption, interfacial accumulation |
| Bulk liquid | Near ambient mean temperature with turbulent mixing | H2O2, O3 where formed, HO2•/O2•-, secondary radicals | Advanced oxidation, reduction, hydrolysis, catalyst reactions | Convection, molecular diffusion, scavenging, phase transfer |
| Solid or droplet boundary | Microjet, shock, shear, freshly exposed surface | Surface radicals, lattice defects, active catalytic sites | Heterogeneous oxidation, nucleation, fragmentation | Impact, erosion, wetting, boundary layer renewal |
3 Adiabatic Bubble Collapse and Temperature
Adiabatic compression is the simplest upper bound model for collapse heating. It assumes that the noncondensable gas behaves ideally, compression is sufficiently rapid that no heat leaves the gas, the amount and composition of gas remain constant, and chemical reactions do not consume energy. For a gas with heat capacity ratio γ, pressure and volume satisfy:
where is noncondensable gas pressure, V is bubble volume, and γ = /.
The corresponding temperature volume relation is:
where T is the gas temperature.
For a spherical bubble with V proportional to R³, the ideal temperature amplification from an initial radius to a minimum radius is:
where is the initial gas temperature. In a growth collapse cycle, is often replaced by for an illustrative compression ratio.
The ideal pressure amplification is even steeper:
where is the corresponding initial gas pressure.
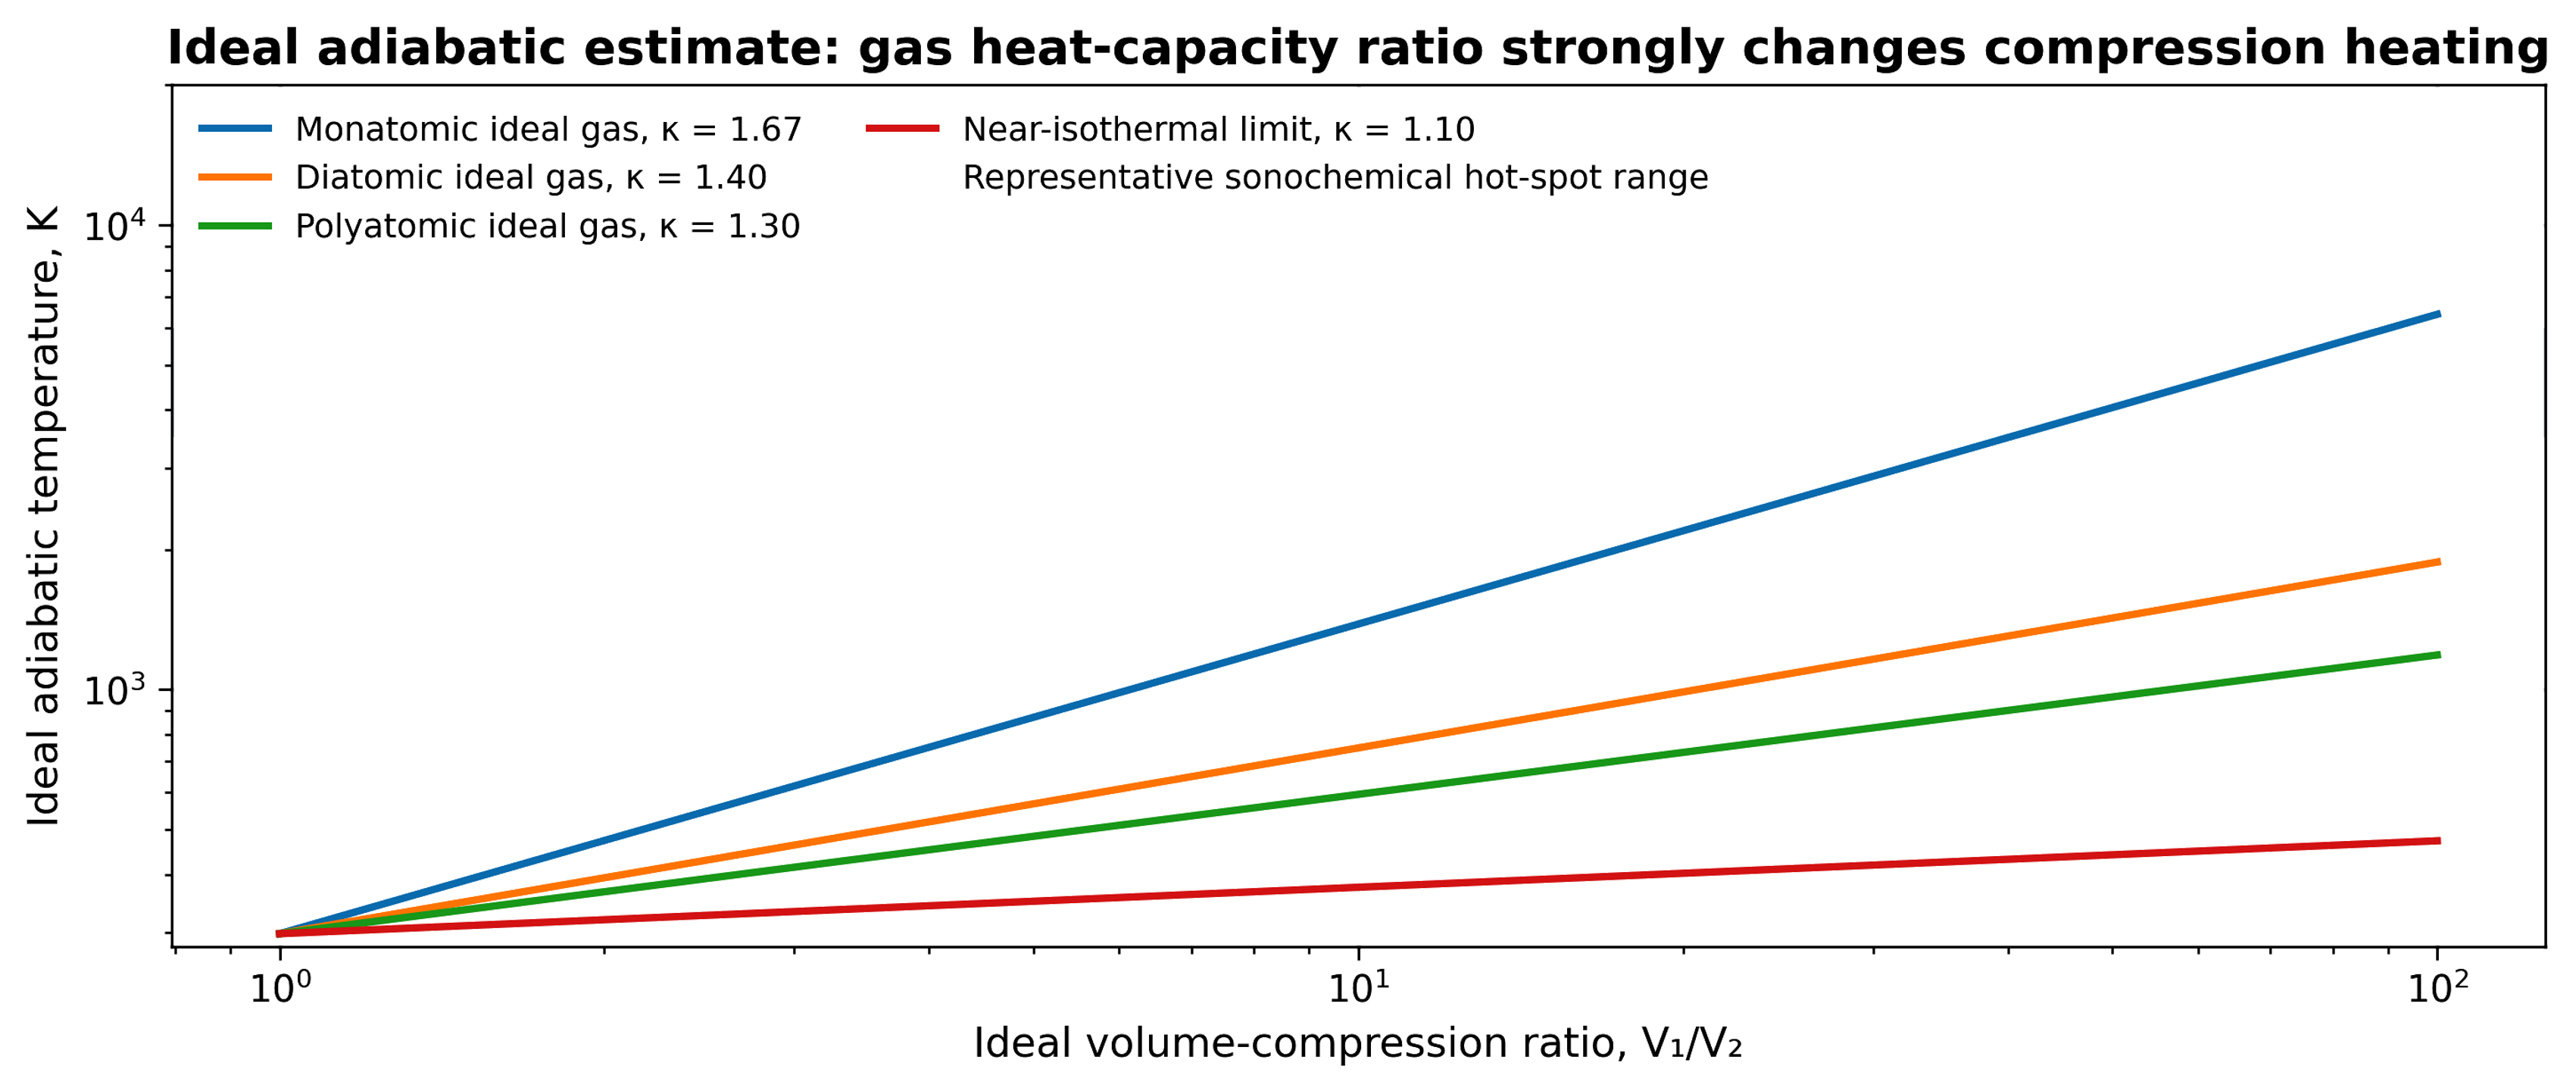
Figure 3.1. Ideal adiabatic temperature amplification as a function of volume compression ratio for representative heat capacity ratios. Calculation from Equation (3.2) [81].
Figure 3.1 demonstrates why small differences in γ matter. Monatomic gases with γ near 5/3 produce a stronger ideal temperature increase than diatomic gases with γ near 1.4 or polyatomic vapors with lower effective γ. However, the graph intentionally omits the most important real bubble losses. Water vapor condenses, dissociates, and absorbs energy; heat flows into the liquid; the gas may not remain spatially uniform; internal shocks can form; and the bubble can become nonspherical. Thus, a large ideal value is evidence of the strength of geometric focusing, not a literal uniform temperature [24-29].
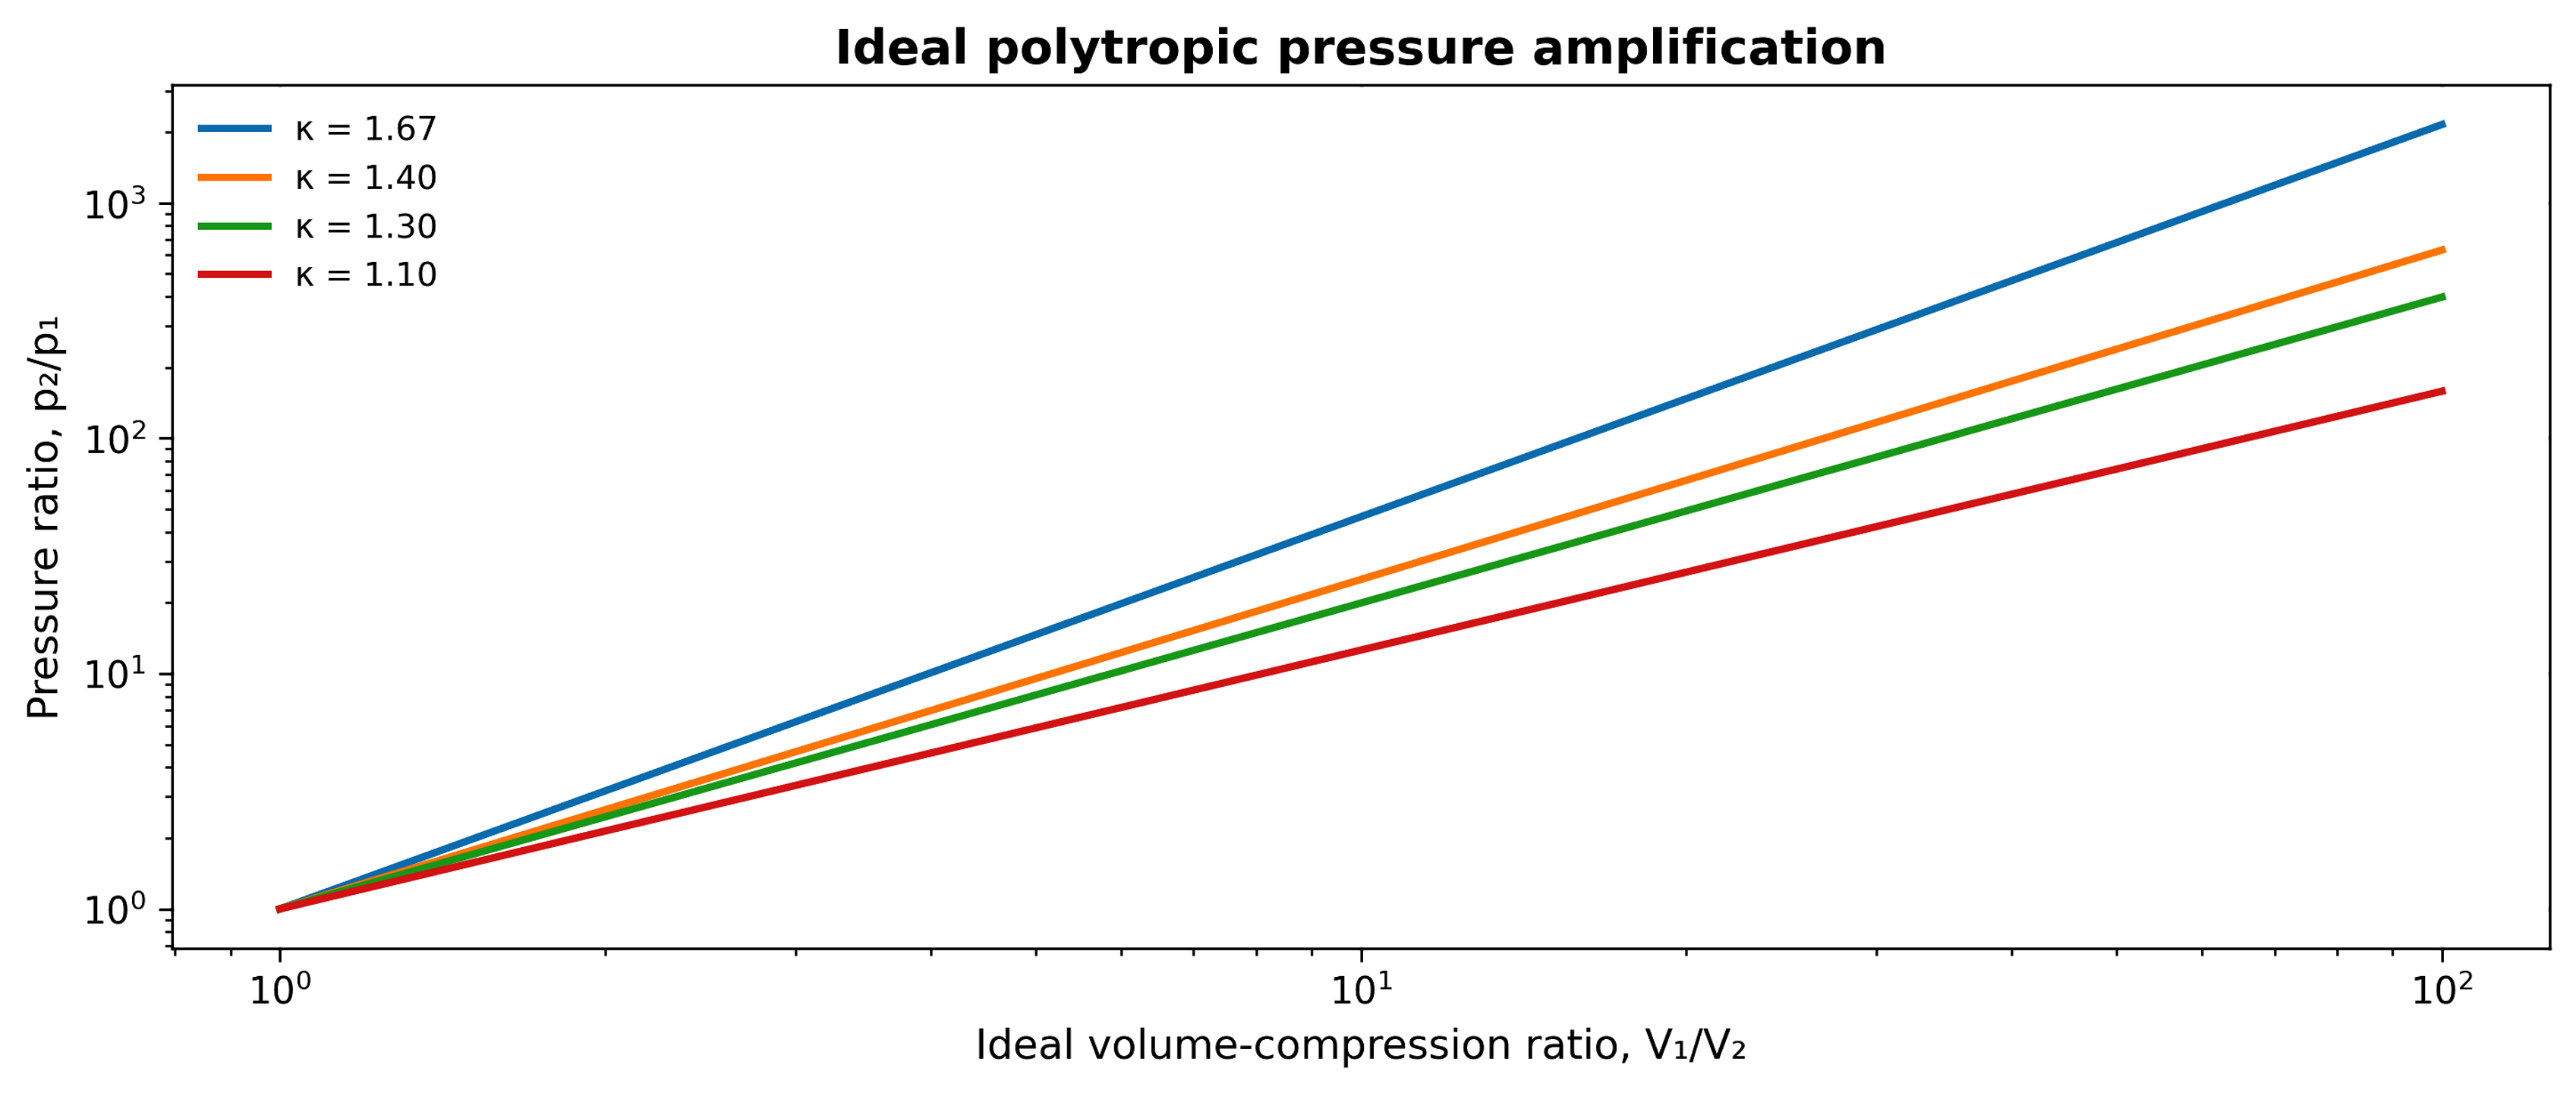
Figure 3.2. Ideal polytropic pressure amplification for several compression exponents. Calculation from Equation (3.4). Real collapse pressure is limited by liquid compressibility, phase change, gas chemistry, and geometry [81].
At extreme compression, finite molecular size can be represented by a hard core radius h. A commonly used van der Waals type correction replaces R³ by R³, h³:
where h is an effective hard core radius below which the gas volume cannot contract in the idealized model.
The reversible work of polytropic compression between states 1 and 2 is:
where n is the polytropic exponent; n = γ for ideal adiabatic compression and n approaches 1 for isothermal compression.
The work in Equation (3.6) is partitioned among gas internal energy, chemical dissociation, heat transfer, acoustic radiation, shock waves, liquid kinetic energy, rebound, and deformation. A model that reproduces radius time data can still predict the wrong chemistry if it uses an oversimplified energy balance. For sonochemical calculations, the bubble pressure equation must be coupled to vapor transport and a reaction mechanism; for engineering design, it is usually more reliable to calibrate the model against both physical and chemical observables [12,24,26-27,35].
Table 3.1. Assumptions in the ideal adiabatic estimate and their real bubble consequences
| Ideal assumption | Real behavior | Expected influence on peak state |
|---|---|---|
| No heat transfer | Gas and vapor conduct heat to a cold liquid boundary layer | Reduces core temperature and increases thermal damping |
| Fixed gas mass | Gas diffusion and vapor evaporation/condensation occur | Changes pressure support, heat capacity, and composition |
| No phase change | Water vapor can condense during compression | Removes vapor mass but releases latent heat near the wall |
| No chemistry | Dissociation and ionization consume energy | Caps temperature and changes radical inventory |
| Uniform core | Temperature and composition gradients and internal shocks develop | Creates local hot regions rather than one uniform state |
| Spherical collapse | Neighboring bubbles, walls, vortices, and pressure gradients deform the cavity | Redirects energy into jets and lowers thermal focusing |
| Ideal gas | High density and finite molecular volume become important | Limits compression and modifies pressure temperature relation |
3.1 Water vapor as a thermochemical moderator
The total pressure inside an aqueous cavitation bubble is commonly represented as the sum of noncondensable gas and vapor contributions:
where is total internal pressure, is noncondensable gas partial pressure, and is water vapor partial pressure.
Water vapor is necessary for hydroxyl radical formation, but excessive vapor lowers collapse temperature. It increases the heat capacity of the bubble contents, undergoes endothermic dissociation, and may not condense rapidly enough to leave the core before the strongest compression. Storey and Szeri showed that nonequilibrium vapor transport strongly constrains the peak state [24]. The resulting design problem is nonmonotonic: a bubble must contain enough water vapor to provide reactive feedstock, but not so much that the collapse is cushioned and the gas mixture becomes thermally soft.
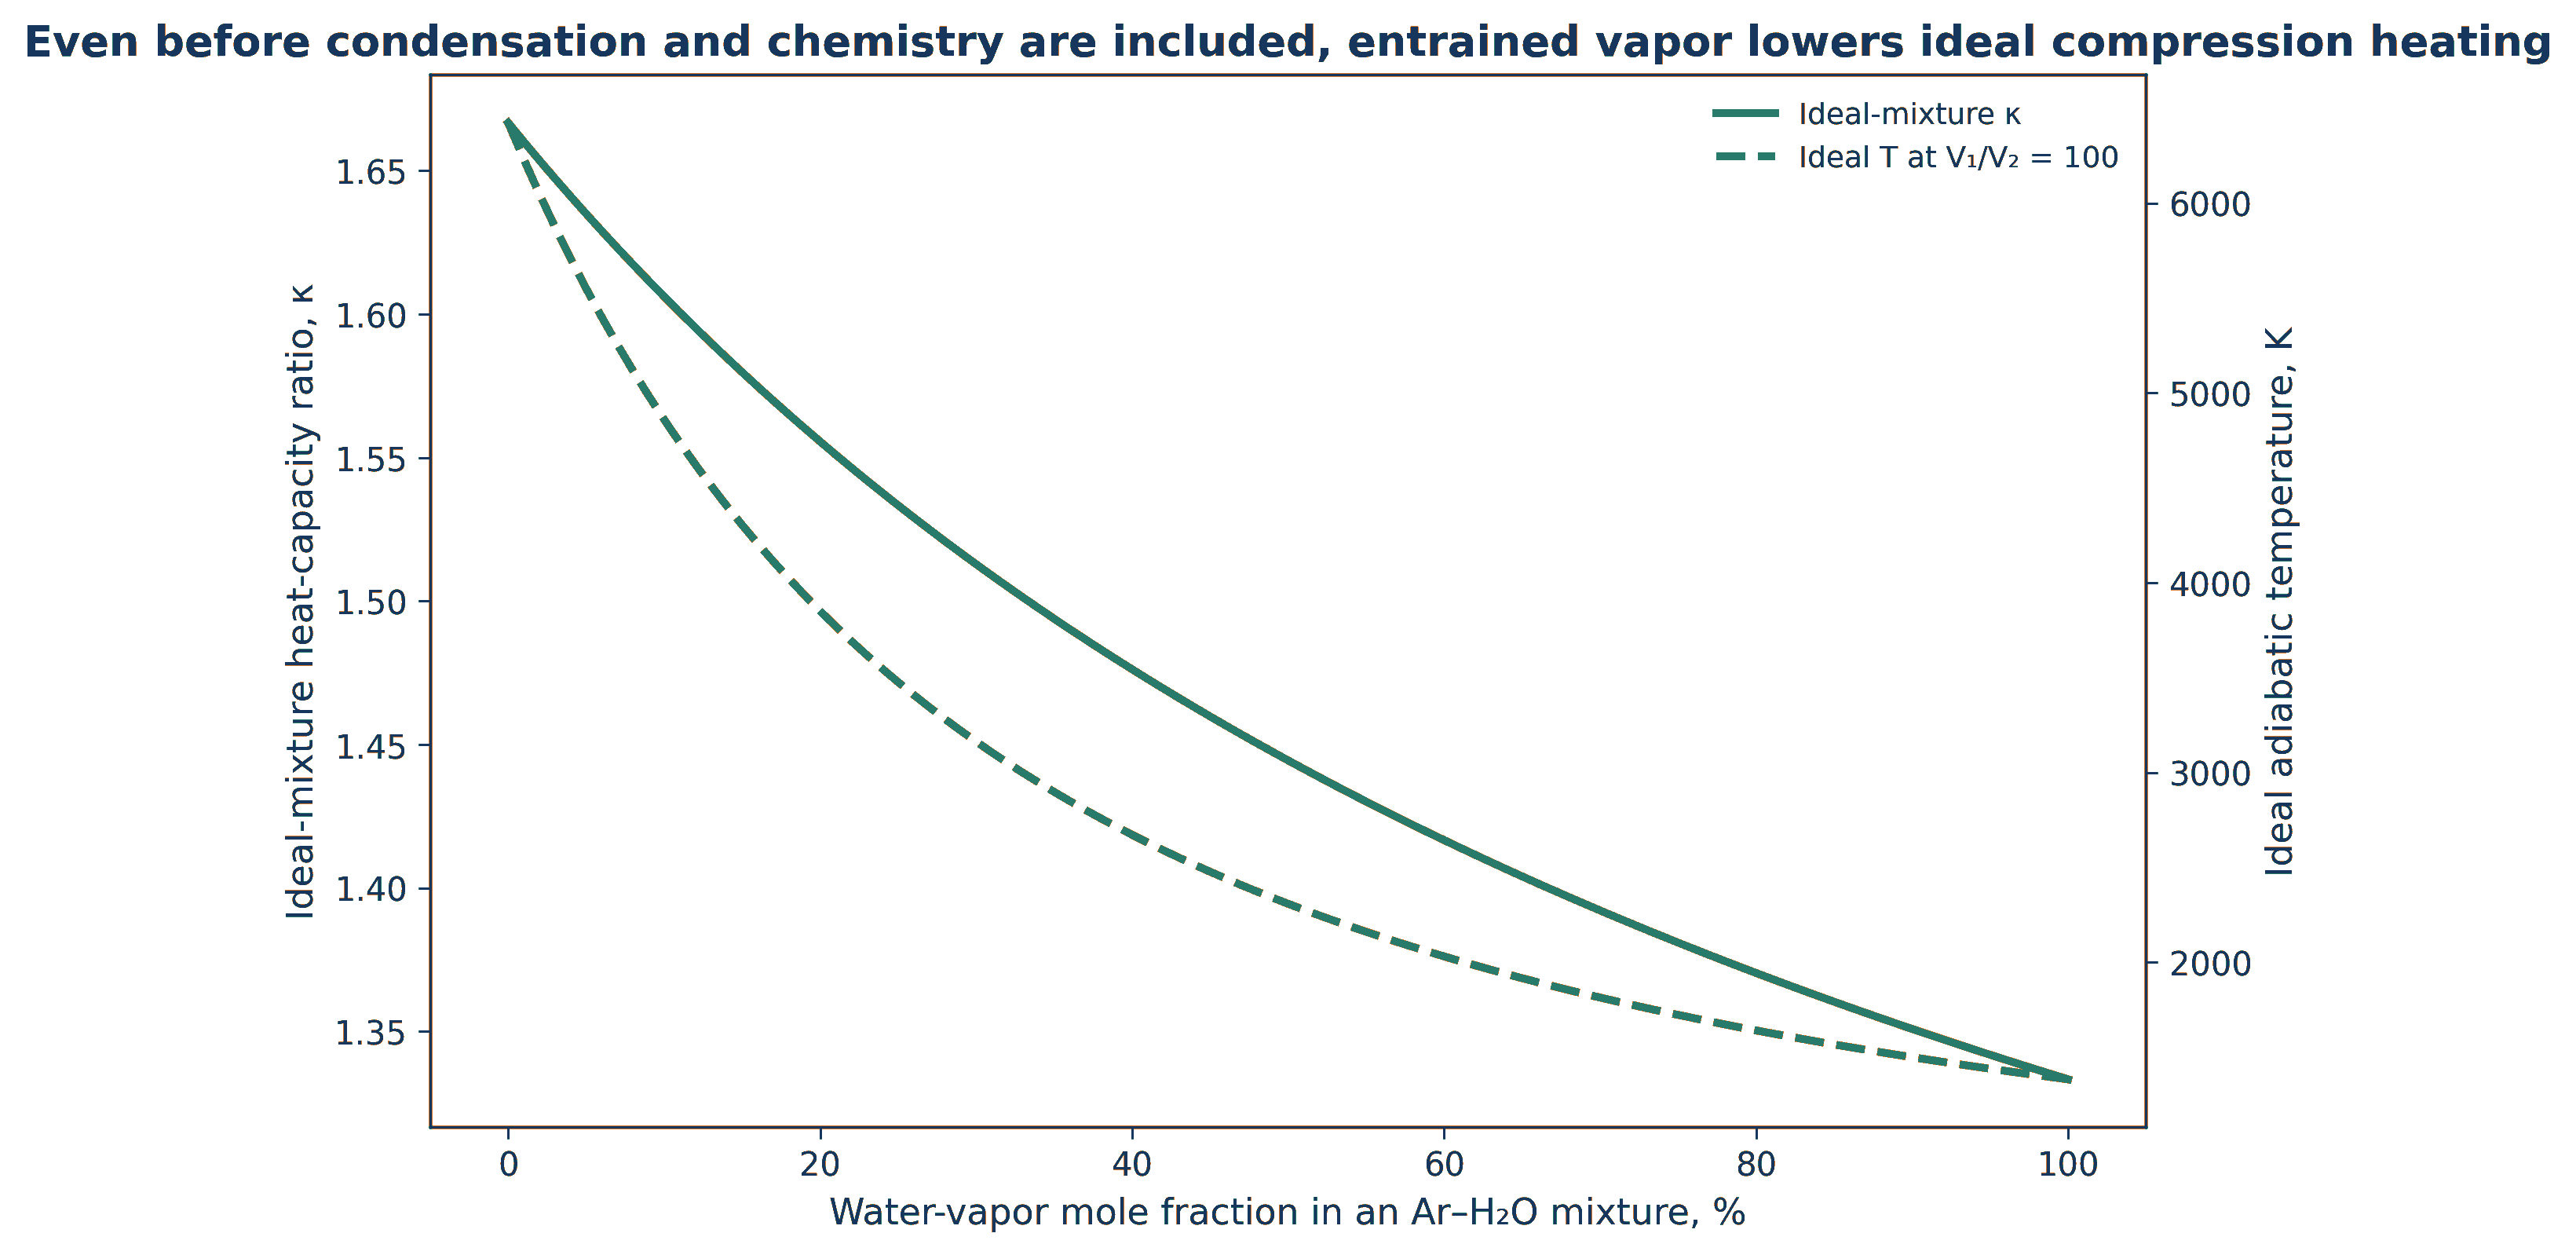
Figure 3.3. Illustrative sensitivity of ideal compression heating to entrained water vapor and associated thermochemical damping. Calculation based on [24-29]. The curve is intended to show direction and nonlinearity rather than a universal quantitative law.
A compact statement of the bubble energy balance is:
where U is internal energy, is heat transfer into gas, represents enthalpy carried by species crossing the interface, and V represents energy consumed or released by reaction r.
Equation (3.8) shows why an adiabatic relation is an upper bound. During collapse, - dV/dt is positive and compressive, but heat loss, condensation, dissociation, and radical chemistry can absorb a substantial fraction. During rebound, energy returns to the liquid or remains as a smaller gas vapor cavity. The chemical products that survive are therefore only one branch of the total collapse energy partition [26].
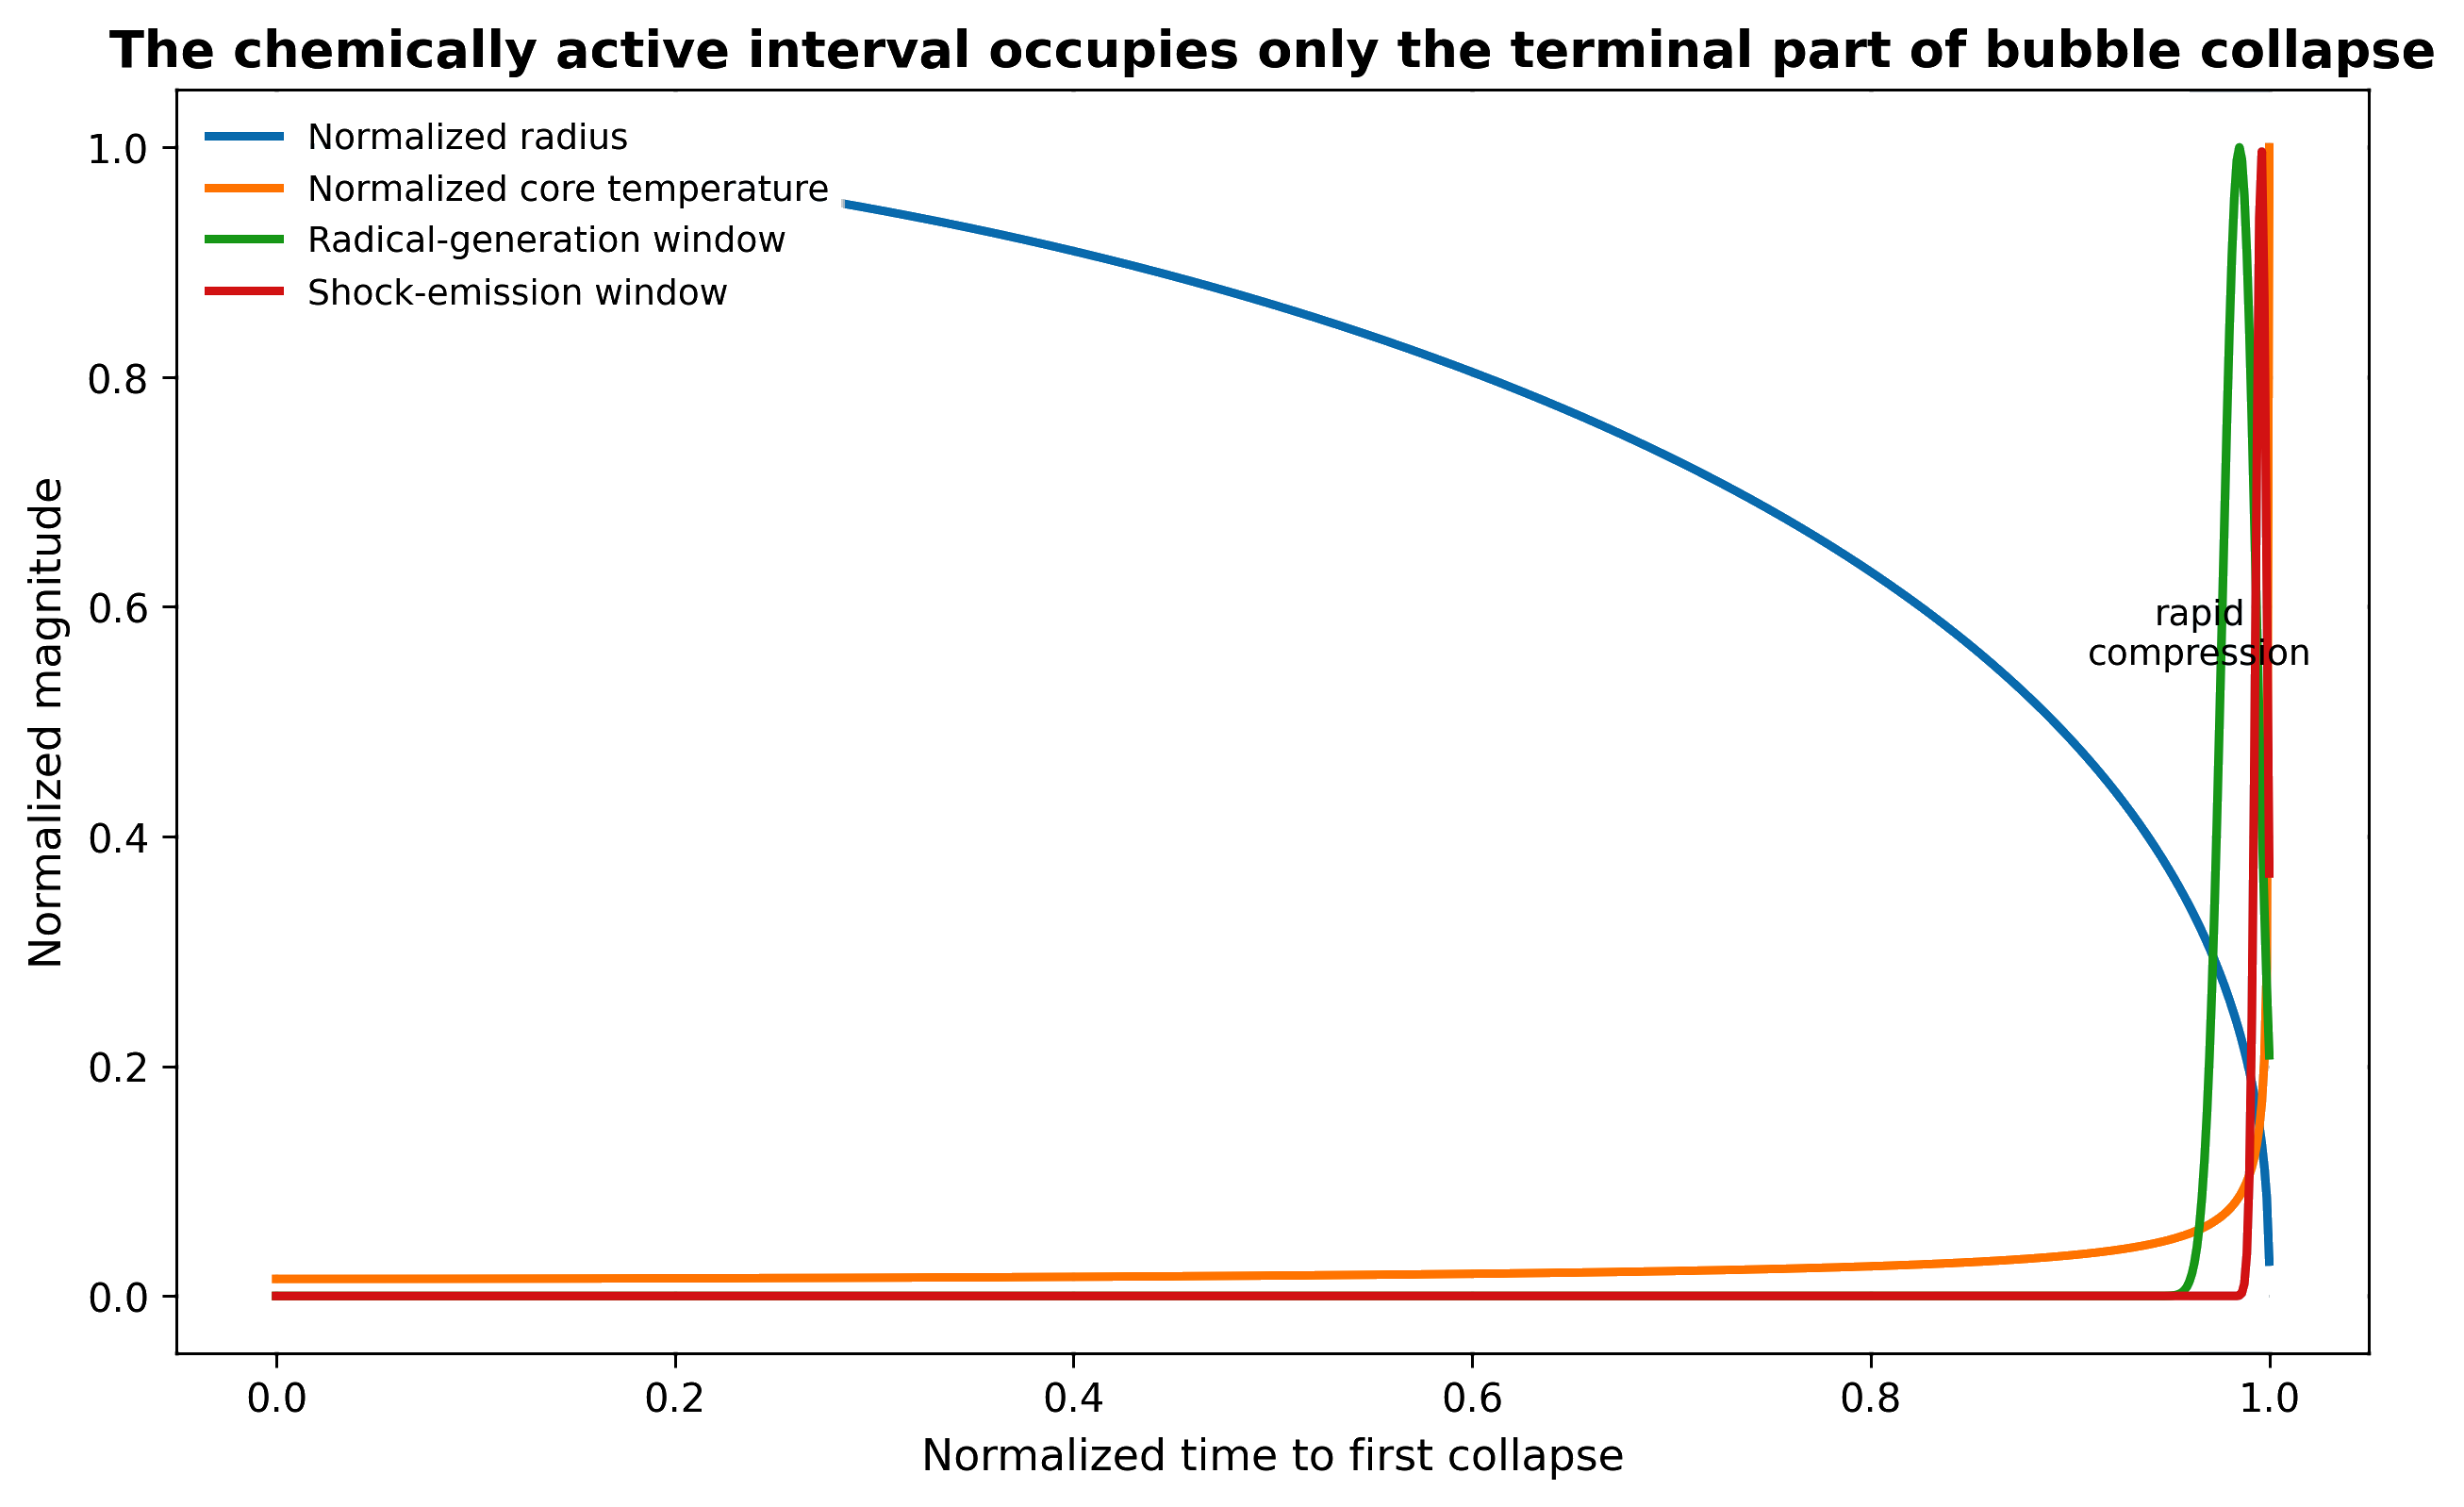
Figure 3.4. The chemically active interval occupies only the terminal portion of a bubble collapse. Radius changes over the full collapse time, while temperature and radical production rise sharply near minimum volume [81].
4 Effect of Gas Type on Adiabatic Bubble Collapse
Dissolved gas determines more than the initial number of nuclei. Gas identity changes the heat capacity ratio, thermal conductivity, diffusivity, solubility, ionization energy, chemical reactivity, and the rate at which the bubble exchanges mass with the liquid. These properties jointly control collapse temperature, luminescence, radical production, and product selectivity. The strongest ideal compression is associated with a large γ, but the highest chemical yield does not necessarily occur for the gas with the largest γ because thermal transport, vapor content, gas chemistry, and bubble stability can dominate [4,25,27-29].
For an ideal mixture with mole fractions and molar heat capacities and , an effective heat capacity ratio can be estimated by:
where is the gas phase mole fraction of species i.
The effective exponent during a real collapse is frequency and time scale dependent. Slow oscillation permits heat exchange and drives the behavior toward isothermal compression. Rapid terminal compression moves the gas core toward adiabatic behavior while retaining a thermal boundary layer. A gas phase Peclet number expresses the competition:
where is gas thermal diffusivity. Large indicates interface motion faster than thermal diffusion across the bubble radius.
A second useful descriptor is the initial noncondensable gas fraction relative to total bubble contents:
where is moles of noncondensable gas and is moles of vapor.
A large increases the gas spring and can prevent complete collapse, while a very small allows intense compression but may produce an unstable cavity with limited chemical feedstock and weak rebound. In practical reactors, gas concentration also affects nucleation density. Degassing may intensify the collapse of the few remaining bubbles but reduce the number of active events. Gas sparging may create more nuclei and improve oxygen supply, yet excessive gas loading can cushion collapse and produce persistent gas holdup. Optimization therefore requires both per bubble intensity and active bubble population.
Table 4.1. Qualitative influence of common gases on cavitation chemistry
| Gas | Key physical properties | Likely collapse effect | Chemical implications |
|---|---|---|---|
| Argon | Monatomic, high γ, relatively low thermal conductivity, chemically inert | Strong compressional heating and stable spectroscopic emitter | Often favors high hot spot temperature and radical yield; widely used reference gas |
| Xenon | Monatomic, high polarizability, low ionization energy, high molar mass | Can enhance light emission and alter plasma chemistry | Potentially strong excitation but high solubility and cost limit process use |
| Helium | Monatomic but very high thermal conductivity and diffusivity | Rapid heat loss can offset the high γ | Can reduce hot spot temperature compared with argon under otherwise similar conditions |
| Nitrogen | Diatomic, γ near 1.4, chemically reactive at high temperature | Lower ideal heating than monatomic gas | Can form NO, NO2-, and NO3-; competes for oxidants at high temperature |
| Oxygen | Diatomic and reactive | Supports oxygen radical pathways | Promotes HO2•, O2•-, peroxide, and oxidation; may also quench excited states |
| Air | N2/O2 mixture with water vapor | Practical compromise between nuclei, oxygen supply, and thermal softness | Produces mixed oxygen- and nitrogen derived chemistry |
| Carbon dioxide | High solubility, polyatomic, lower effective γ, acidifies water | Strong thermal and chemical damping | Often suppresses hot spot temperature; generates carbonate/bicarbonate chemistry |
| Hydrogen | High diffusivity and thermal conductivity; combustible | Rapid transport and heat loss | Strong reducing radical chemistry but major safety constraints |
| Steam rich bubble | High polyatomic vapor fraction | Substantial cushioning and endothermic dissociation | Provides H• and •OH precursor but can lower temperature and oxidant survival |
Rare gas experiments in acoustic cavitation are especially valuable because they isolate the effect of heat capacity and thermal transport. McNamara and coworkers measured emission temperatures between approximately 2300 and 5100 K as gas vapor composition was varied [25]. Okitsu and coworkers showed that the relationship between rare gas atmosphere and chemical yield is not governed by temperature alone [28]. The transferable lesson for hydrodynamic cavitation is that gas composition must be treated as a process variable, not merely as an uncontrolled liquid property.
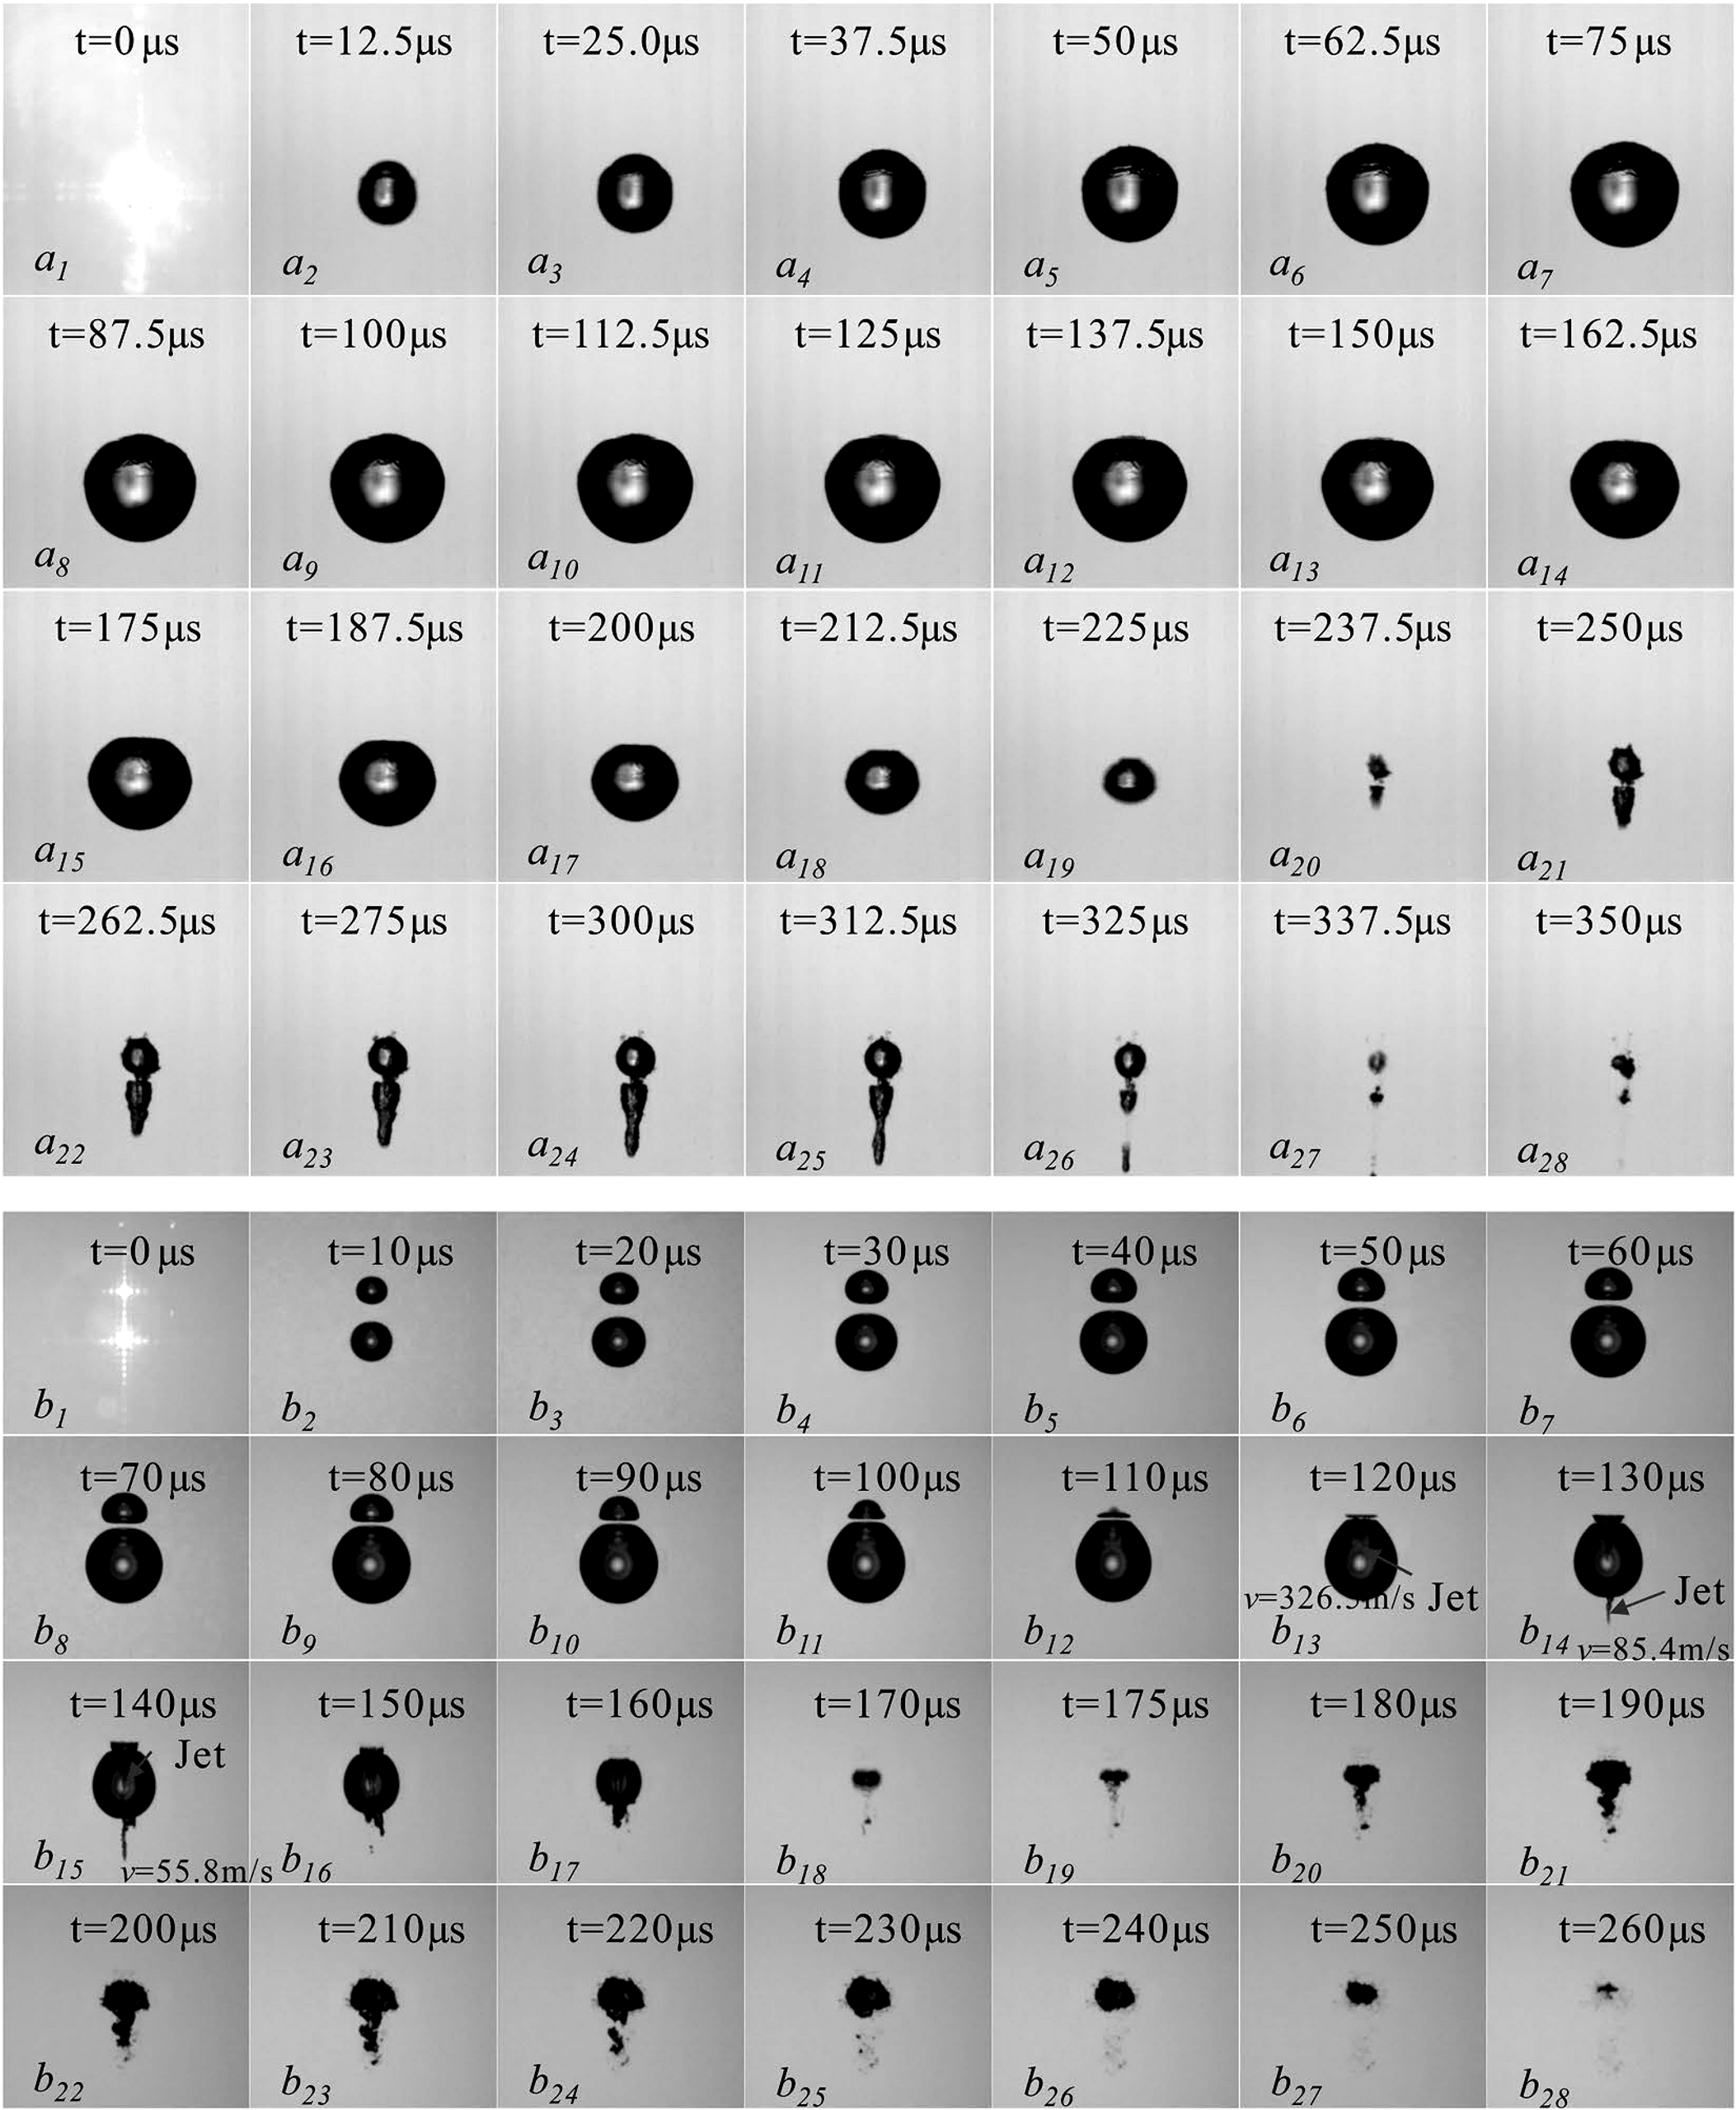
Figure 4.1. High speed image sequences showing interaction, deformation, jetting, and collapse of two cavitation bubbles. [36]. The sequence illustrates why neighboring bubbles change collapse symmetry and energy focusing.
Bubble interaction can overwhelm the single bubble gas effect. Neighboring cavities modify the pressure field, exchange shock waves, coalesce, and collapse asymmetrically. The high speed sequences in Figure 4.1 show that spacing and relative size can redirect jets and distribute shock emission over multiple events [36]. In a dense hydrodynamic cloud, increasing inlet pressure may increase vapor volume while decreasing the chemical yield per unit energy because shielding, coalescence, and radical recombination become stronger [11].

Figure 4.2. Representative high speed images of cavitation bubble clusters generated by focused shock waves at different operating conditions. [37].
Fattahi and coworkers quantified chemistry in controlled bubble clusters and found a maximum conversion of focused shock wave energy to chemical energy at an intermediate cluster energy density, rather than at the largest cluster [37]. Their result was obtained with acoustically or laser mediated cluster generation, but it directly informs hydrodynamic cloud design: more bubbles are useful only while each bubble retains sufficient collapse intensity and products can escape the cluster without immediate recombination.
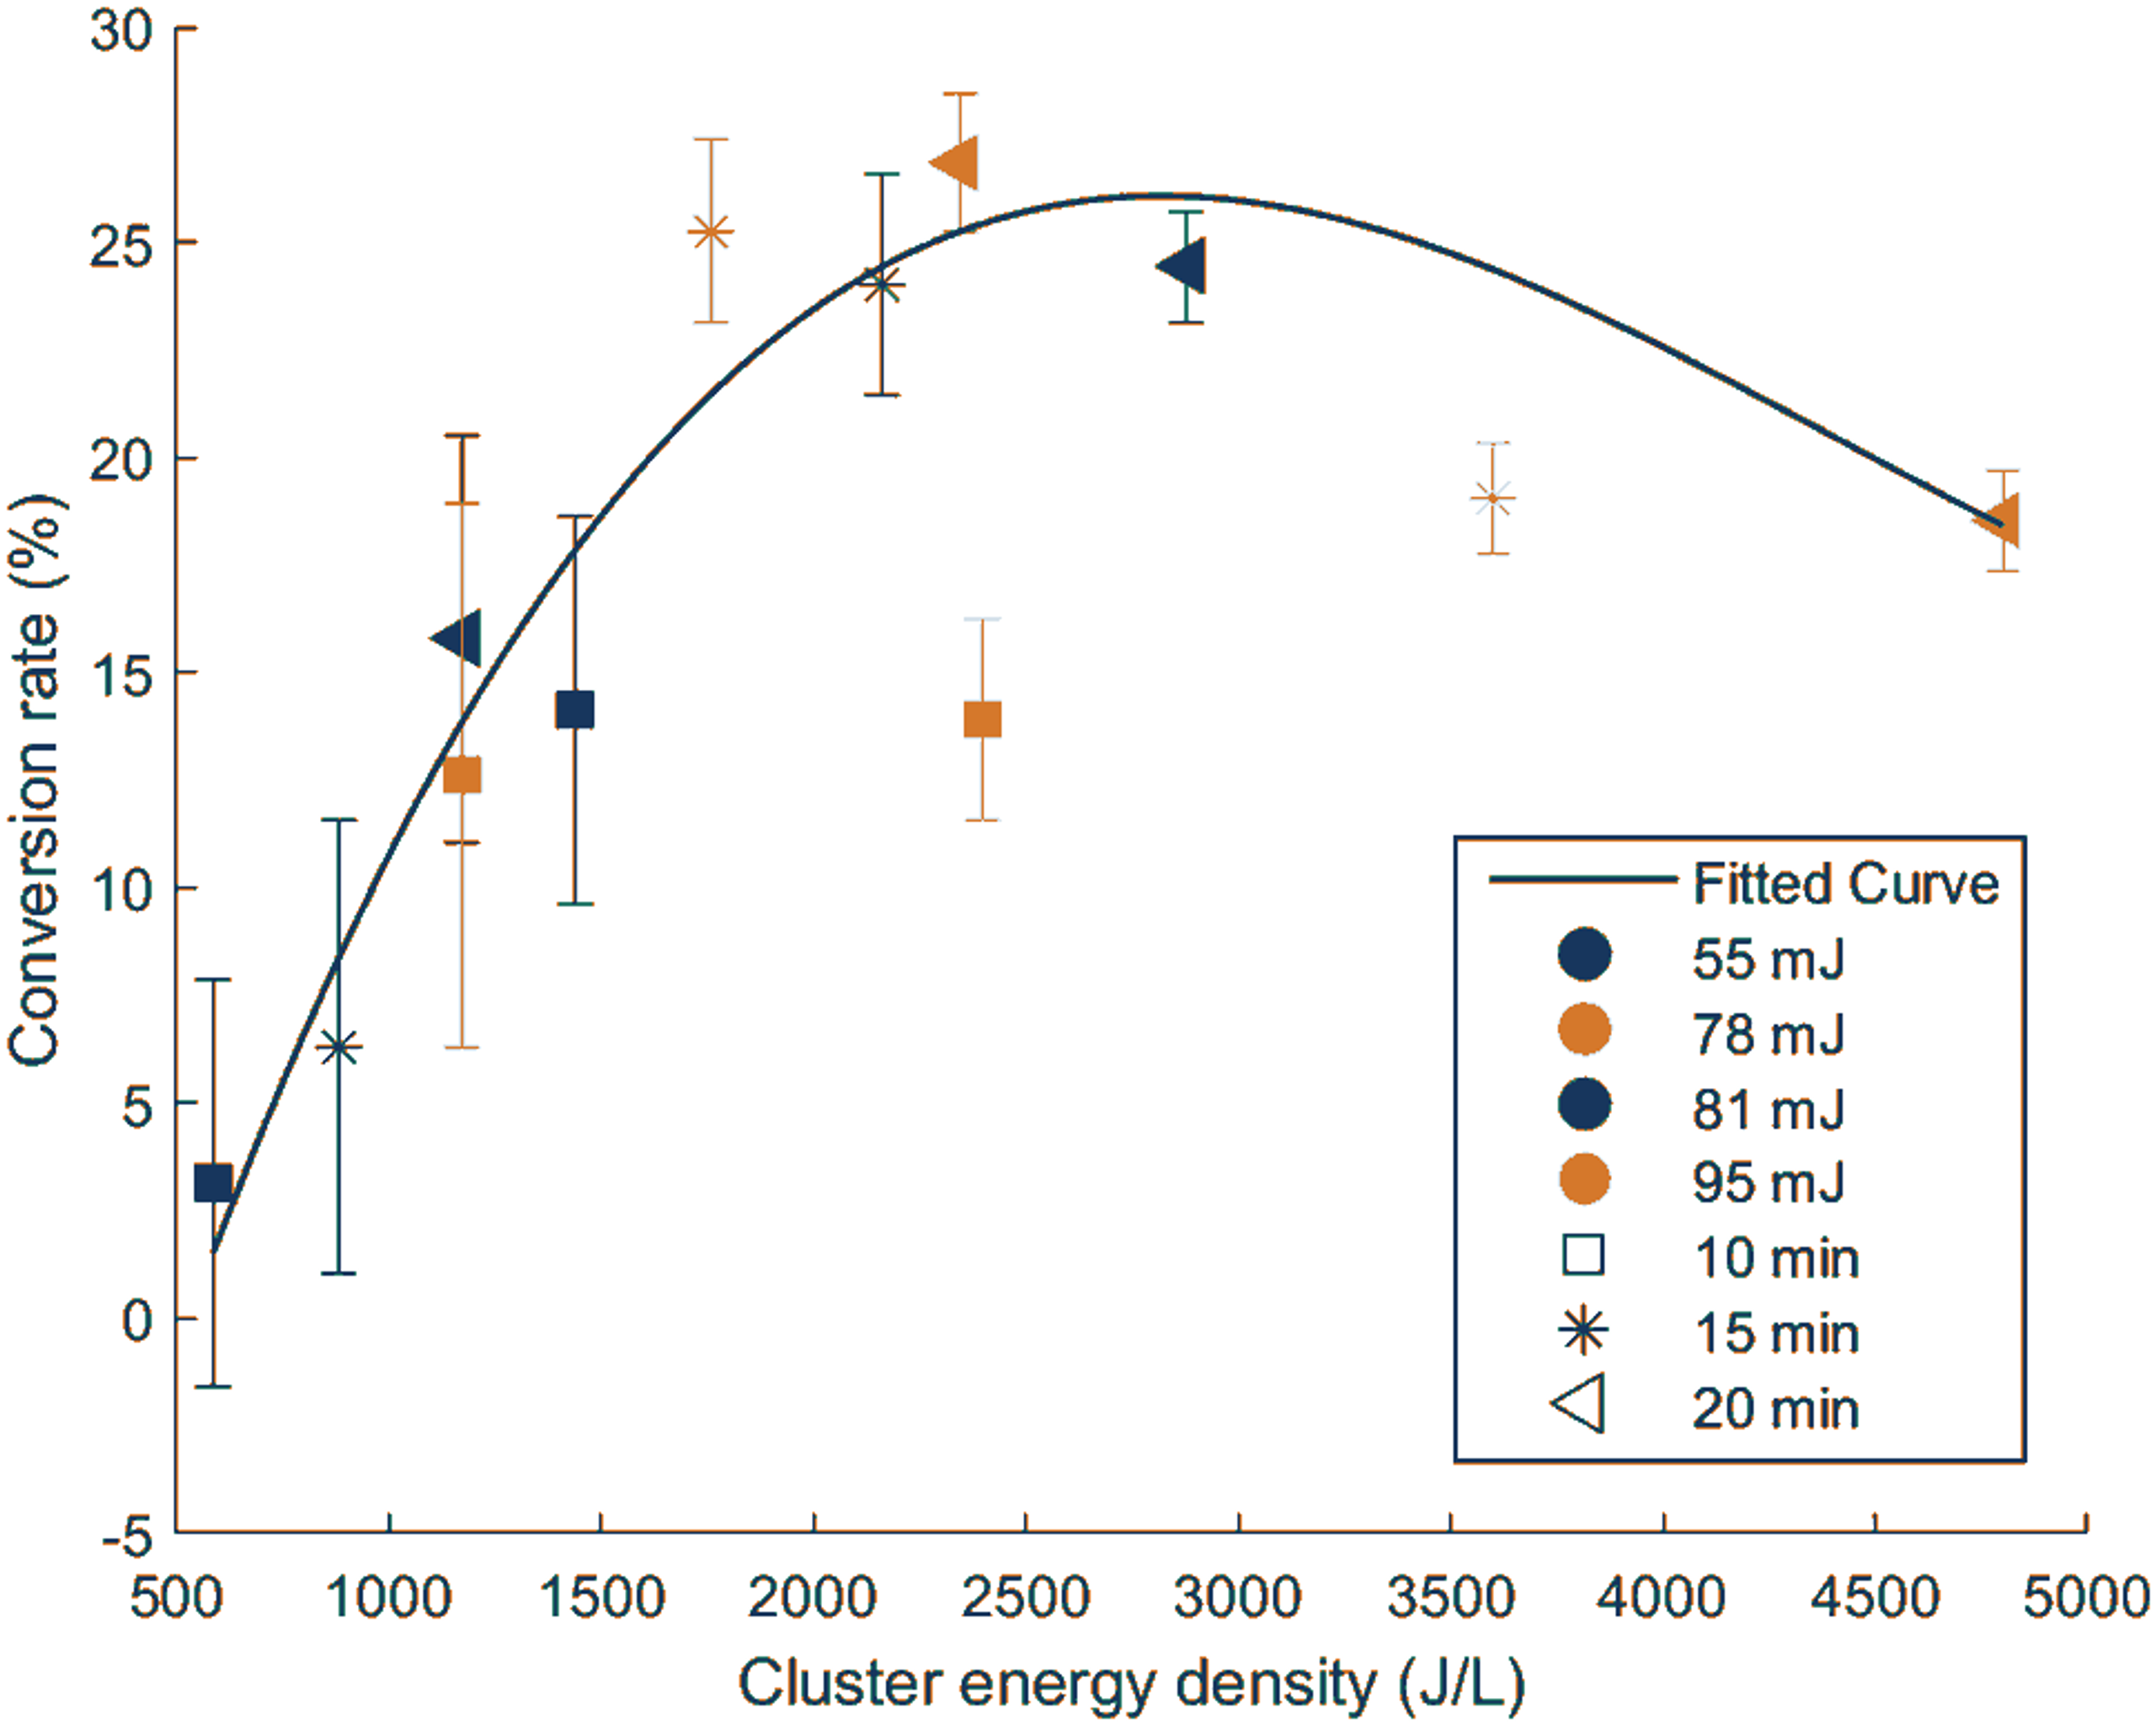
Figure 4.3. Measured conversion of focused shock wave energy to chemical energy as a function of cluster energy density. [37].
Table 4.2. Gas management strategies for hydrodynamic cavitation reactors
| Strategy | Potential benefit | Potential penalty | Recommended verification |
|---|---|---|---|
| Operate air saturated | Simple and reproducible in open systems | Gas content changes with temperature and pressure history | Measure dissolved oxygen and temperature before each run |
| Argon saturation | Can increase per bubble hot spot intensity | Cost, gas consumption, and possible reduction in oxygen chemistry | Compare radical yield per joule and not conversion alone |
| Oxygen sparging | Raises dissolved oxygen and can support secondary oxidation | Excess gas holdup cushions collapse and changes pump behavior | Measure void fraction, pressure drop, off gas, and oxidant yield |
| Partial degassing | May reduce cloud shielding and intensify remaining collapses | Reduces nucleation population and can delay inception | Measure inception pressure, bubble count, and chemical yield |
| CO2 addition | Controls pH and may assist carbonate chemistry | Thermally damps collapse and scavenges •OH through bicarbonate/carbonate | Track inorganic carbon, pH, and product selectivity |
| Closed loop gas control | Enables repeatable composition and mass balance | Requires gas liquid equilibrium control and safety instrumentation | Use gas analysis, pressure control, and leak testing |
5 Chemical Mechanisms Generated by Bubble Collapse
The chemical output of cavitation is generated by a sequence of ultrafast reactions inside and around the bubble. The initial step in water is thermal dissociation of water vapor. The products are not released into an inert environment: they immediately react with water, oxygen, nitrogen, other radicals, volatile solutes, and the bubble wall. Consequently, measured hydrogen peroxide or iodide oxidation represents the surviving integrated product of a reaction network, not the instantaneous number of hydroxyl radicals created at minimum radius [3,24,26-27,30-32,38].
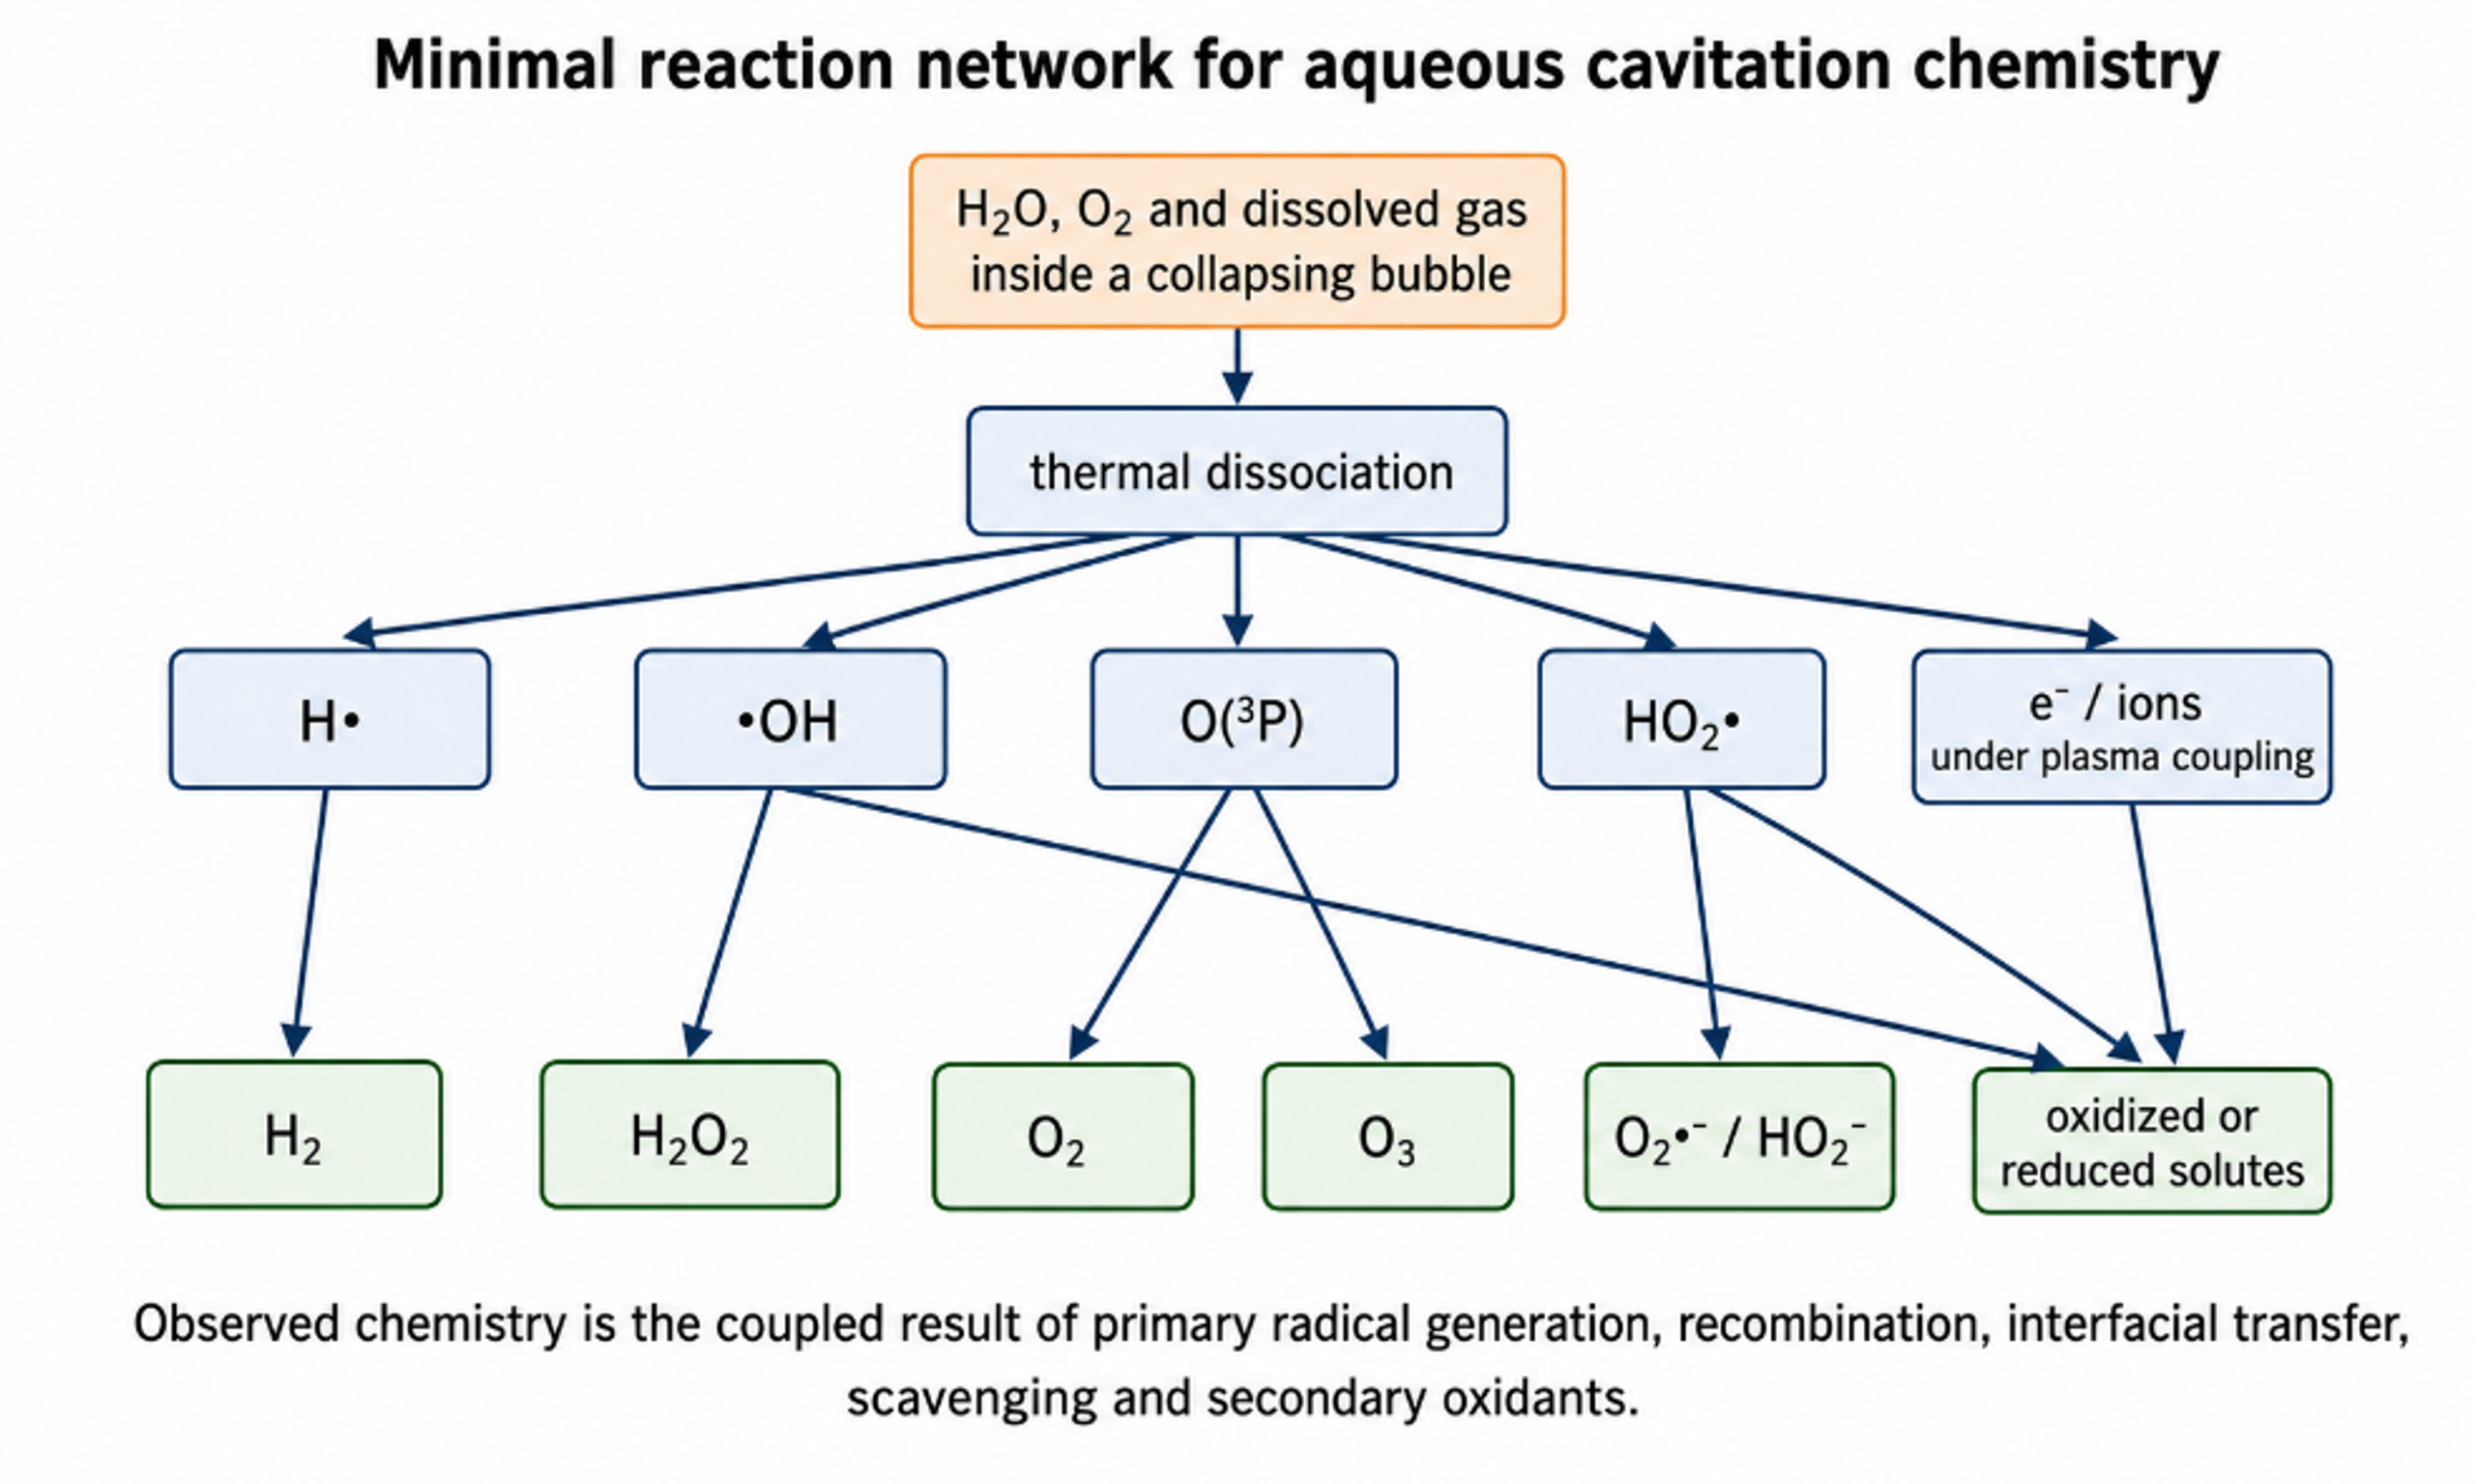
Figure 5.1. Minimal reaction network for aqueous cavitation chemistry. Water and dissolved gas enter a collapsing bubble, radicals form during the hot stage, and longer lived products escape into the liquid [81].
The simplest initiation reaction is:
The energy source is compressional heating and, in extreme cases, electronically excited or plasma like states in the gas vapor core.
Hydroxyl radicals can recombine to form hydrogen peroxide:
Hydrogen atoms can recombine:
In oxygen containing systems, hydrogen atoms form hydroperoxyl radicals:
Hydroperoxyl radicals can produce hydrogen peroxide and oxygen:
At sufficiently high temperature, oxygen atoms and ozone can participate:
where M is a third body that removes excess energy.
The network is strongly temperature dependent. Yasui and coworkers predicted an optimum bubble temperature near 5500 K for oxidant formation in an air bubble because still higher temperatures accelerate nitrogen oxidation and consume useful oxidants [27]. This result is conceptually important: the strongest collapse is not automatically the most productive chemical collapse. A reactor should maximize the net flux of useful species to the liquid, not the unobservable peak temperature.
Table 5.1. Representative aqueous cavitation reactions and engineering significance
| Reaction family | Representative species | Role in process performance | Important sensitivities |
|---|---|---|---|
| Primary thermolysis | H•, •OH | Creates highly reactive reducing and oxidizing radicals | Peak temperature, water vapor fraction, collapse duration |
| Radical recombination | H₂, H₂O₂ | Converts short lived radicals into stable products; can preserve or waste reactivity | Local radical concentration, cluster density, quench rate |
| Oxygen chemistry | HO₂•, O₂•-, O•, O₃ | Extends oxidation beyond the bubble and changes selectivity | Dissolved oxygen, pH, gas composition |
| Nitrogen chemistry | NO, NO₂-, NO₃- | Consumes oxidants but can provide measurable products and alter acidity | Air or N₂ atmosphere, high temperature, oxygen availability |
| Organic radical chemistry | R•, RO•, ROO• | Leads to fragmentation, oxygenation, polymerization, or reduction | Volatility, interfacial adsorption, oxygen level |
| Halide chemistry | Cl•, Cl₂•-, Br•, Br₂•- | Shifts oxidation selectivity and can create halogenated byproducts | Chloride/bromide concentration, pH, radical scavengers |
| Sulfate chemistry | SO₄•- | Provides a longer lived, selective oxidant in activated persulfate systems | Persulfate dose, temperature, catalysts, pH |
A compact rate expression for a dissolved target A separates the three reaction zones:
where each term is an effective volumetric rate associated with gas core pyrolysis, interfacial reaction, or bulk liquid chemistry.
The temperature dependence of an elementary rate constant is commonly represented by the Arrhenius equation:
where A is the pre exponential factor, is activation energy, is the universal gas constant, and T is local temperature.
Equation (5.8) explains the extraordinary reaction acceleration at a hot spot, but it must be applied locally and transiently. The bulk liquid does not attain the bubble core temperature. A process scale rate constant therefore combines a distribution of bubble temperatures, reaction times, active bubble populations, radical escape fractions, and mixing. Assigning the entire reactor a temperature of several thousand kelvin is physically incorrect.
5.1 Volatility, interfacial enrichment, and radical survival
Volatility controls whether an organic molecule can enter the bubble. Highly volatile solutes partition into the gas vapor core and can undergo pyrolysis. Nonvolatile ions and large molecules remain in the liquid and depend on radical transport to the interface or bulk. Surface active molecules can concentrate at the interface, where they may be transformed more rapidly than their bulk concentration predicts. A mechanistic study should therefore report vapor pressure or Henry coefficient, acid base state, octanol water partition tendency where relevant, and surface activity rather than relying only on nominal concentration [3,30,39-41].
Radical survival is controlled by competition. Hydroxyl radicals react close to their formation site because their rate constants with many solutes and scavengers approach diffusion control. At high bubble density, radicals created by neighboring collapses can recombine before contacting the target. At high target concentration, the target itself may intercept more radicals, but it can also reduce vapor pressure, change interfacial properties, or attenuate cavitation. The resulting conversion versus concentration curve can be nonlinear and may show an optimum.
| Critical distinction: Hydrogen peroxide yield is a useful integrated indicator of cavitation chemistry, but it is not identical to hydroxyl radical production. High H₂O₂ can indicate efficient radical escape and recombination, while rapid reaction with a target or catalyst can produce low measured H₂O₂ even when radical generation is high. |
|---|
6 Measurement and Quantification of Sonochemical Activity
A credible hydrodynamic cavitation study should combine at least one hydraulic measurement, one physical cavitation measurement where possible, and one chemical dosimeter. Pressure drop alone cannot establish chemical activity. Conversely, pollutant removal alone cannot distinguish radical chemistry from volatilization, adsorption, thermal hydrolysis, emulsification, or sampling artifacts. Recommended measurements include inlet and outlet pressure, flow, temperature, pump power, dissolved gas, cavitation images or acoustic emission, and a chemically defined probe [6,11,15,30-32,35,38].
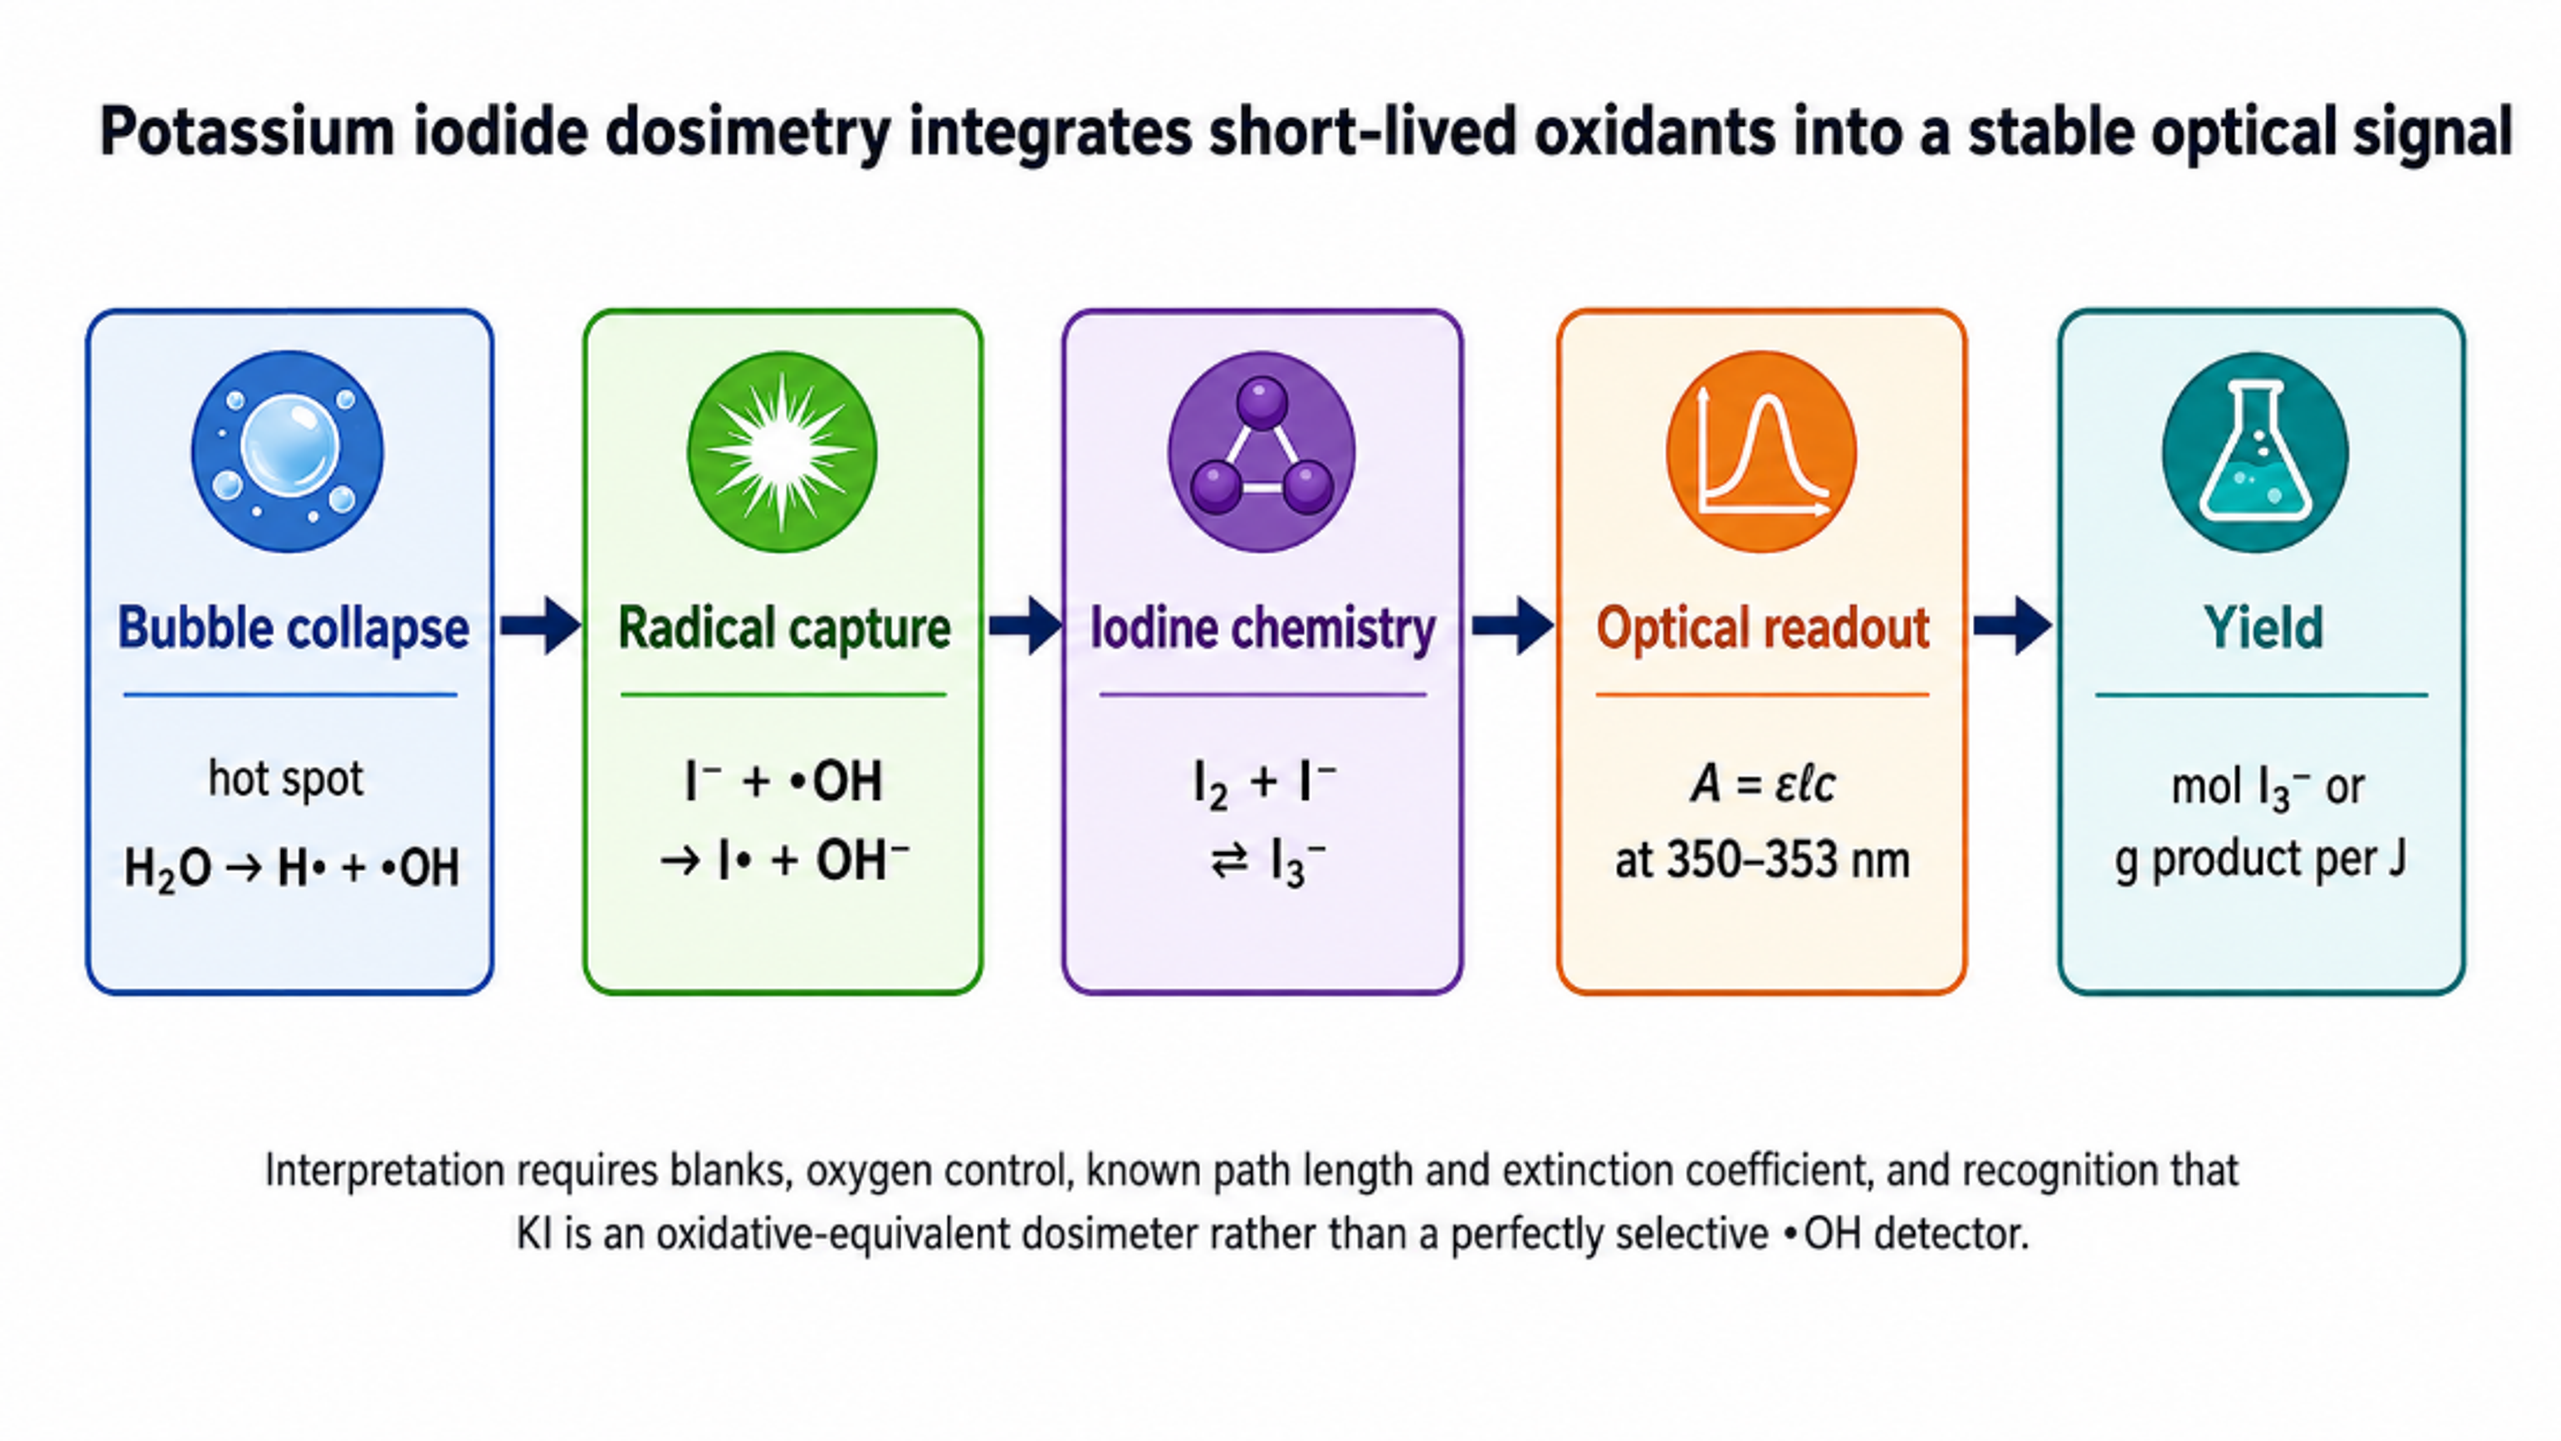
Figure 6.1. Potassium iodide dosimetry converts short lived oxidants into a stable optical signal through iodine and triiodide formation [81].
Potassium iodide oxidation is widely used because it is inexpensive, sensitive, and compatible with flow loops. In an acidic medium, hydrogen peroxide, or related oxidizing species generated during cavitation, oxidizes iodide ions according to:
In the presence of excess iodide, the liberated iodine rapidly complexes to form triiodide ():
The triiodide concentration is obtained from Beer Lambert absorption:
where is absorbance at wavelength λ, is molar absorptivity, b is optical path length, and is triiodide concentration.
The energy normalized cavitational yield can be defined as:
where is moles of a specified product and is the hydraulic or electrical energy basis stated by the author.
For continuous operation over a sampling interval Δt, an oxidant production rate is:
where Q is volumetric flow, and are outlet and inlet concentrations, and is the selected reactor or loop volume used for normalization.
A target degradation is often approximated as pseudo first order over a restricted concentration range:
The electrical energy used in water treatment is:
where EEO is commonly expressed in kWh m⁻³ order⁻¹, is electrical power, V is treated volume, and one order is a tenfold concentration reduction.
Table 6.1. Methods for measuring cavitation induced chemical activity
| Method | Measured response | Strength | Limitation and control |
|---|---|---|---|
| KI dosimetry | I₂/I₃⁻ formation by integrated oxidizing equivalents | Simple, sensitive, established for comparing reactors | Not specific to •OH; depends on pH, oxygen, iodine chemistry, and mass transfer |
| Terephthalate fluorescence | 2-hydroxyterephthalate formed by •OH addition | Sensitive proxy for hydroxyl radicals | Product yield is less than unity and probe chemistry must be calibrated |
| Salicylic acid dosimetry | Hydroxylated aromatic products | Provides product fingerprints | Multiple products and chromatographic analysis required |
| H₂O₂ assay | Stable peroxide accumulated in liquid | Useful for mass balance and hybrid AOP design | Can be consumed by catalysts, solutes, walls, light, or further cavitation |
| EPR spin trapping | Radical adduct spectra | Direct species identification | Specialized, time sensitive, and affected by spin trap transport |
| Fricke dosimetry | Fe²⁺ oxidation to Fe³⁺ | Long established oxidant dosimeter | Strongly dependent on acidity and dissolved oxygen |
| Chemical target degradation | Loss of a selected compound and product formation | Application relevant | Mechanism may include non-radical effects; requires blanks and carbon balance |
| Calorimetry | Rate of bulk temperature rise | Defines dissipated power for normalization | Does not identify how much energy enters productive collapses |
| High speed imaging and acoustic emission | Bubble cloud, collapse, shock/noise signatures | Links chemistry to physical cavitation state | Optical access and calibration can be difficult in opaque industrial fluids |
Koda and coworkers proposed standardized KI oxidation normalized by calorimetric power for acoustic systems [38]. Hydrodynamic studies should adopt the same principle of explicit energy accounting, but the appropriate input basis must be stated. Hydraulic power QΔp describes energy delivered across the cavitating device. Pump electrical power includes motor and pump inefficiency. Whole plant power may include cooling, gas compression, ozone generation, and separation. All three metrics can be useful, but they answer different questions.
Controls are essential. A noncavitating pressure drop control distinguishes cavitation from ordinary pumping and shear. A thermal control follows the same bulk temperature history without cavitation. Gas and pH controls identify oxygen or acid base effects. For hybrid systems, each component must be tested alone at the same energy and reagent dose. Samples should be quenched when necessary to prevent post reactor reaction from being mistaken for in reactor chemistry.
7 Comparison of Hydrodynamic and Acoustic Cavitation
Hydrodynamic and acoustic cavitation share the same elementary mechanism of bubble growth and inertial collapse, but they impose different pressure histories and distribute energy differently. Acoustic reactors use piezoelectric or magnetostrictive transducers to generate oscillatory pressure. Hydrodynamic reactors use pumps, pressure drops, vortices, or rotating elements to create spatial pressure gradients in a flowing liquid. The primary radicals, reaction zones, and hot spot chemistry can be the same, as demonstrated by gas and temperature effects and by common dosimetry reactions [3-6]. Identical chemistry does not imply identical bubble populations or reactor performance.
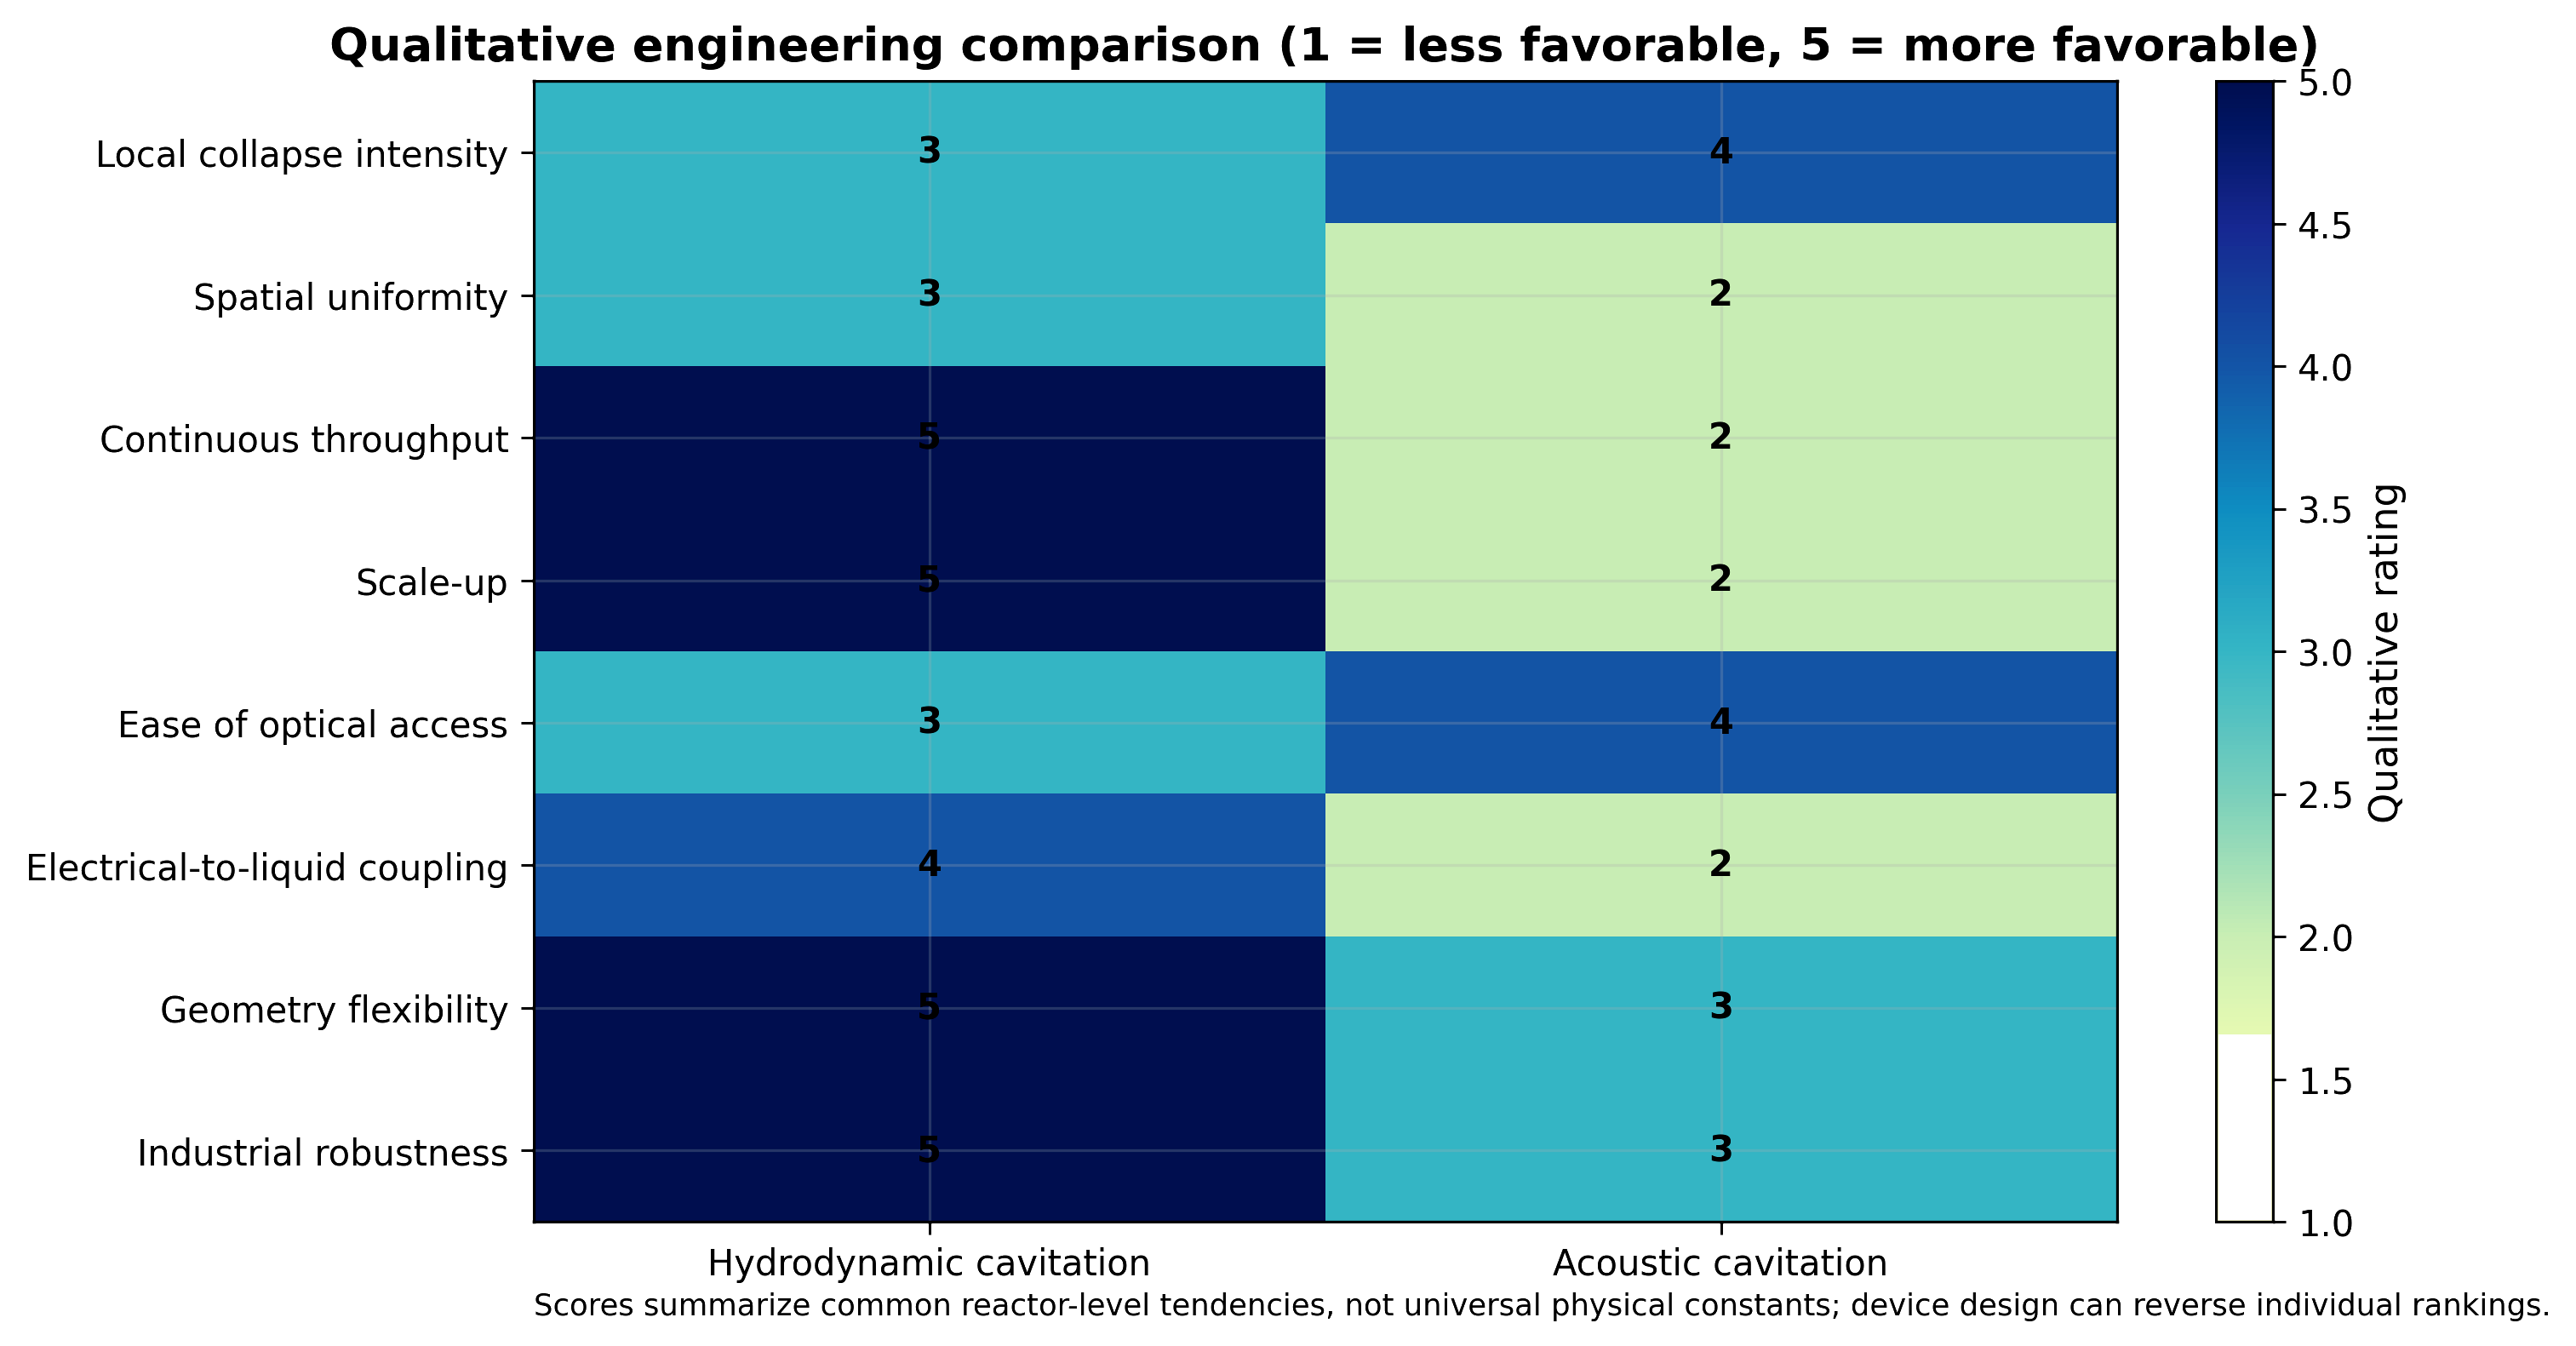
Figure 7.1. Qualitative engineering comparison of hydrodynamic and acoustic cavitation. Darker cells indicate a stronger relative advantage for the listed criterion [81].
The mean number of hydrodynamic passes through a device in a recirculating loop is approximately:
where Q is loop flow, t is treatment time, and is the working liquid volume.
For an acoustic source, nominal intensity is often defined as:
where is acoustic power delivered to the liquid and is radiating area. The spatial field is usually nonuniform, so local intensity can differ greatly from the nominal value.
Table 7.1. Comparison of hydrodynamic and acoustic cavitation for chemical processing
| Criterion | Hydrodynamic cavitation | Acoustic cavitation | Design implication |
|---|---|---|---|
| Forcing | Convected pressure decrease and recovery; turbulence and vortices | Periodic acoustic pressure oscillation | Bubble trajectory rather than equipment name determines chemistry |
| Frequency | No single imposed frequency; set by flow structures and residence time | Externally selected transducer frequency | Acoustic systems offer direct frequency control |
| Bubble exposure | Often one major collapse per pass, with rebound or vortex recirculation | Many repeated cycles in the acoustic field | HC scale up commonly uses passes, residence distribution, or scale out |
| Spatial field | Localized at restriction, vortex, rotor, or recovery zone | Standing waves, near field zones, and shielding can create strong nonuniformity | Both require mapping rather than nominal power alone |
| Scale up | Compatible with pipelines, conventional pumps, continuous throughput | Large volumes require transducer arrays and control of acoustic attenuation | HC is often easier to integrate into industrial flow |
| Chemical intensity | Can be high but strongly geometry dependent | Well established and tunable in laboratory systems | Compare mol/J, not conversion at unequal energy |
| Mechanical effects | Strong shear, pressure recovery, jets, and bulk circulation | Strong local microstreaming and shock fields | HC often couples chemistry with mixing and emulsification |
| Maintenance | Erosion at restrictions or rotors; pump wear | Transducer erosion, delamination, and coupling losses | Materials and inspection plans differ |
| Energy accounting | Hydraulic, shaft, and electrical power bases available | Electrical, calorimetric, and acoustic power may differ | State boundary and efficiency chain explicitly |
| Best fit uses | Continuous treatment, high throughput, multiphase processing, retrofits | Small batches, precision fields, research, cleaning, specialty synthesis | Hybrid or complementary deployment may be optimal |
Experimental comparisons illustrate why no universal winner exists. Senthil Kumar and coworkers reported iodide oxidation rates in a hydrodynamic apparatus that exceeded acoustic cavitation at equivalent stated power under their conditions [6]. Ye and coworkers compared Rhodamine B treatment and found performance depended on reaction conditions and energy basis [42]. Hydrodynamic cavitation generally offers easier scale up and continuous operation, while acoustic systems offer direct frequency control and convenient laboratory diagnostics. Selection should be based on the required throughput, fluid properties, target mechanism, energy cost, and maintenance burden.
8 Chemistry in Inorganic Liquids and Aqueous Electrolytes
In hydrodynamic cavitation literature, chemistry in inorganic liquids most often means water containing acids, bases, salts, dissolved gases, oxidants, or inorganic precursors. These solutes rarely enter the bubble core because they are nonvolatile. Their transformation occurs at the interface or in the bulk through radicals, longer lived oxidants, extreme local supersaturation, and cavitation generated surfaces. Ionic strength also changes gas solubility, vapor pressure, interfacial tension, and bubble coalescence, so salts affect both bubble physics and chemical kinetics.
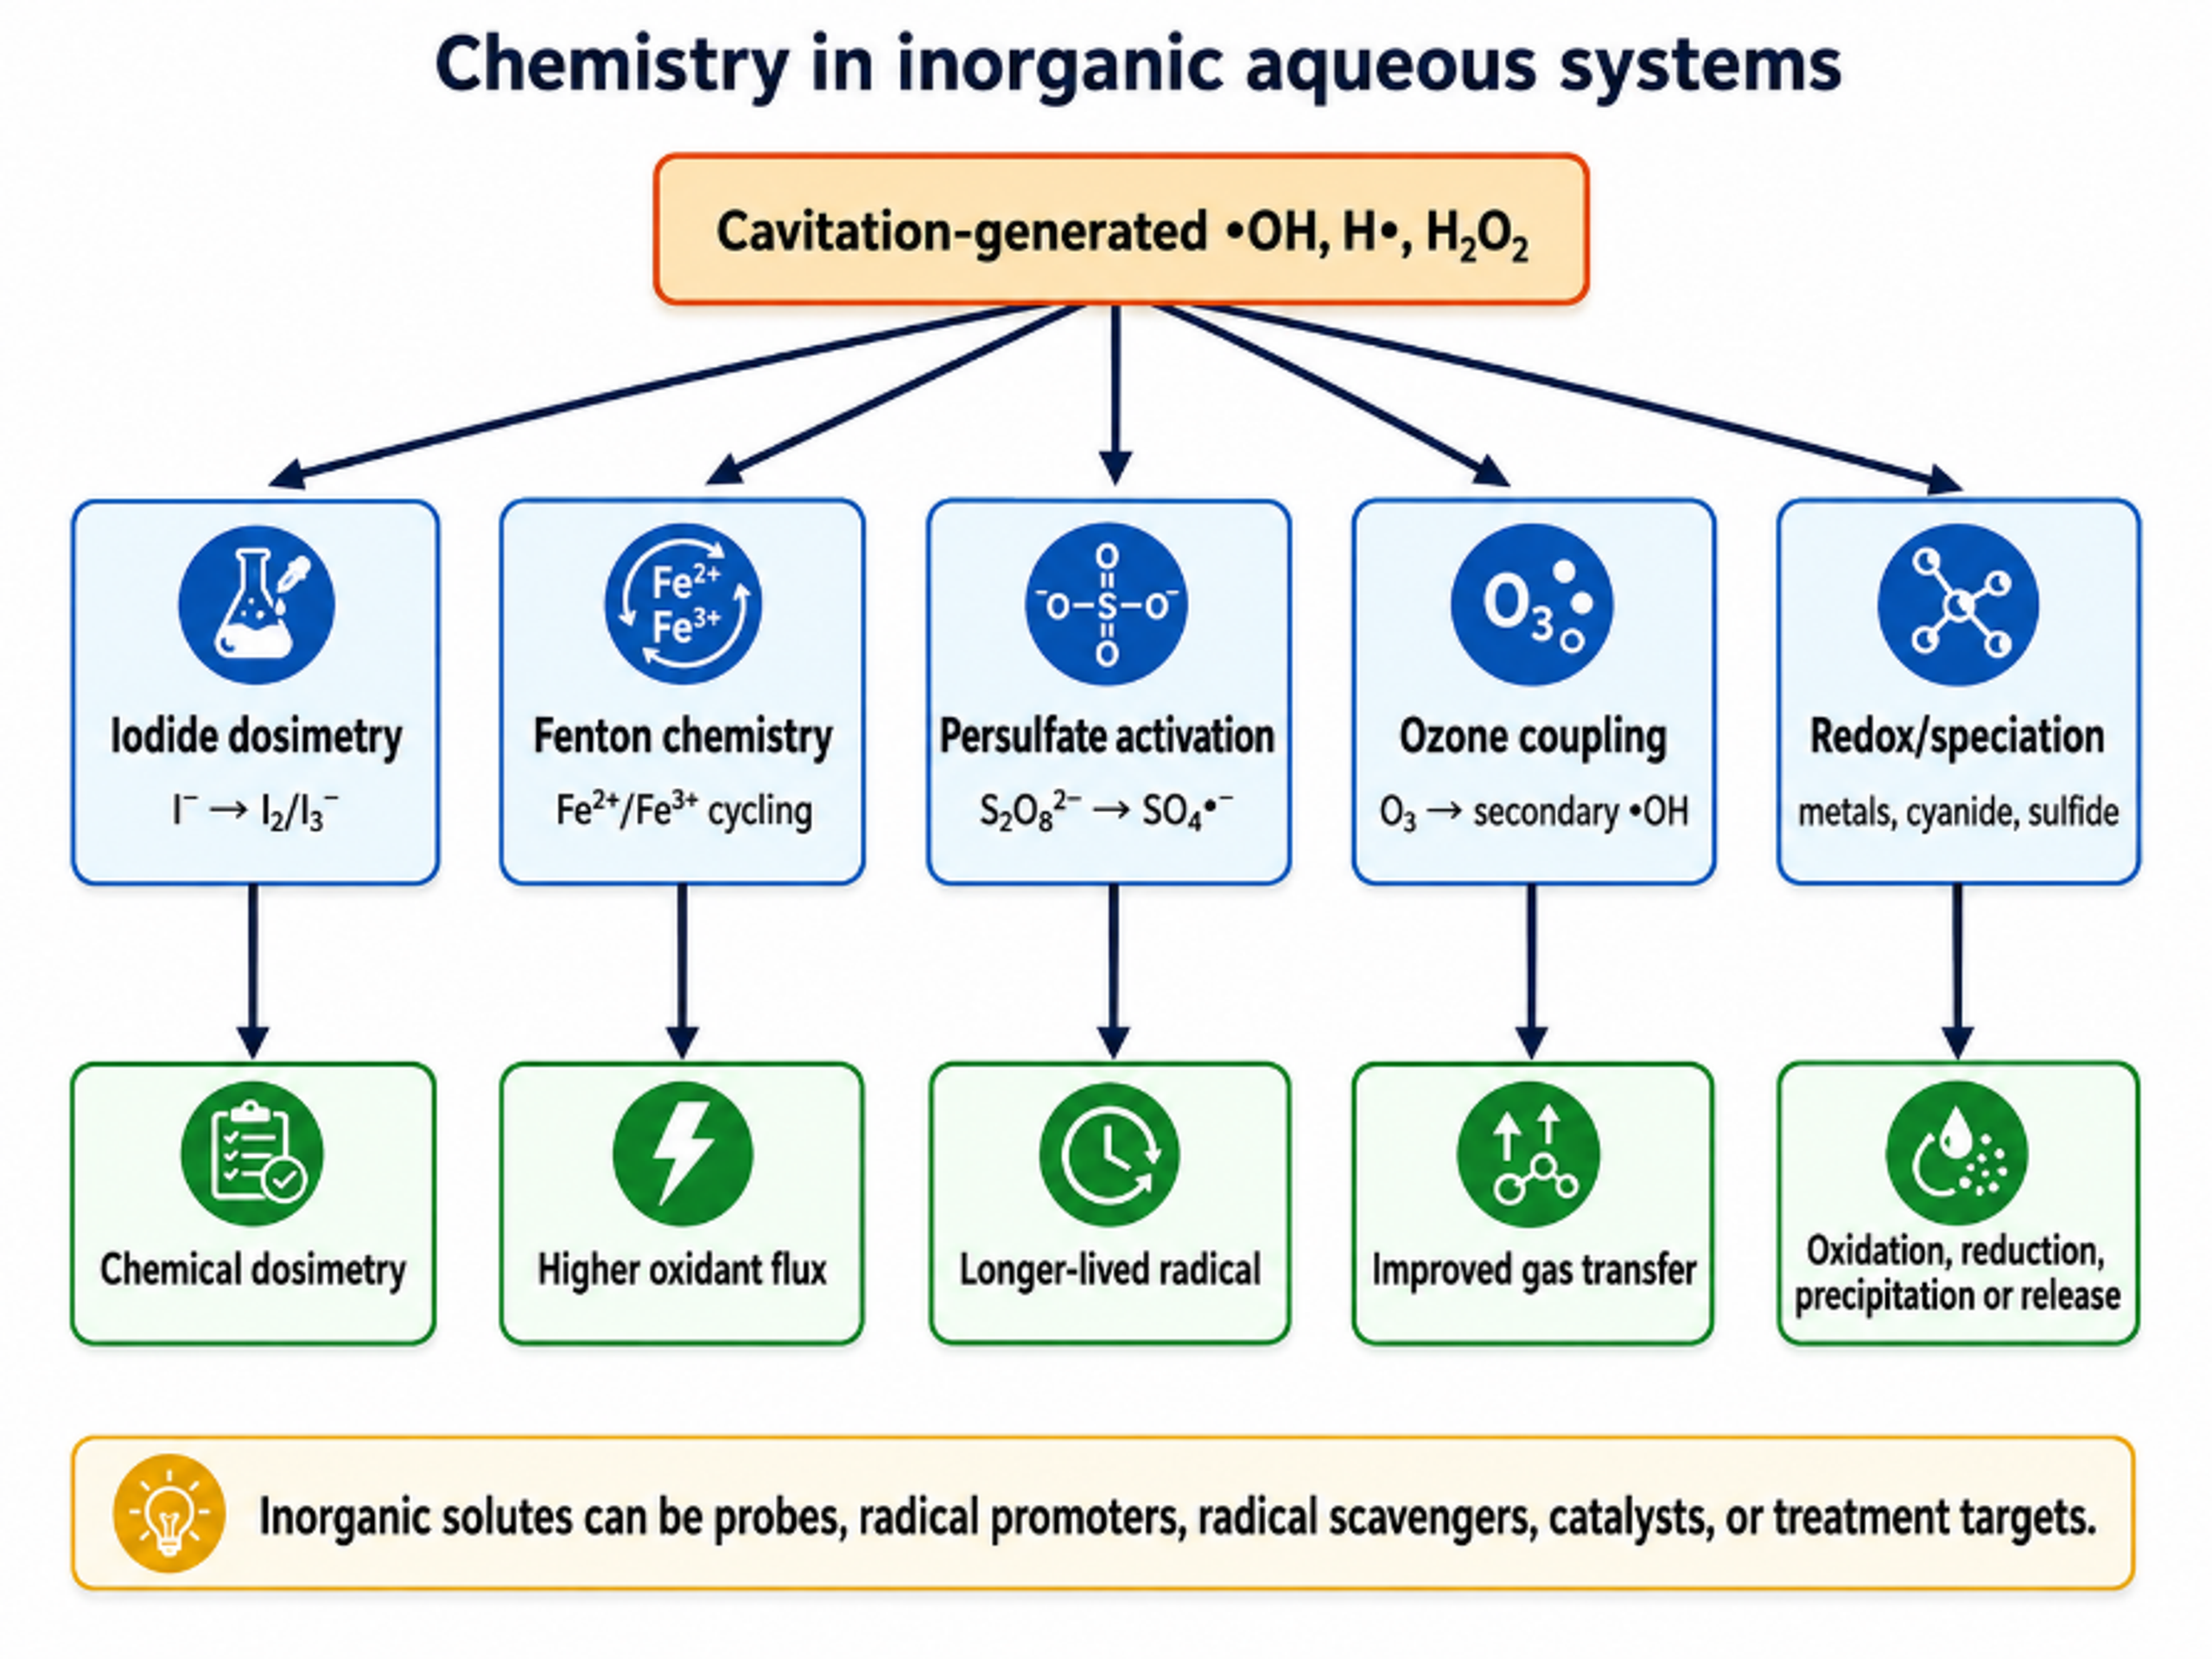
Figure 8.1. Principal chemical pathways in inorganic aqueous systems are exposed to hydrodynamic cavitation [81].
The Fenton reaction is a common route for converting accumulated hydrogen peroxide into hydroxyl radicals:
Persulfate can be activated thermally, mechanically, photochemically, or catalytically to form sulfate radicals. A simplified activation step is:
Bicarbonate scavenges hydroxyl radicals and forms the less reactive but more selective carbonate radical:
Cavitation generated reducing species can reduce metal ions or metal complexes:
where denotes an effective reducing equivalent supplied by H•, organic radicals, or solvated electron like chemistry depending on the system.
For cavitation assisted crystallization, classical nucleation theory provides a useful baseline:
where J is nucleation rate, is solid liquid interfacial energy, is molecular volume, is Boltzmann's constant, and is supersaturation ratio.
Supersaturation is defined as:
where C is actual solute concentration and C* is equilibrium solubility at the local temperature and pressure.
Cavitation can increase nucleation by several coupled routes: transient cooling or heating, rapid pressure change, formation of clean surfaces, fragmentation of early crystals, removal of adsorbed gas, and intense micromixing. It can also increase secondary nucleation by crystal collision and attrition. Equations (8.5) and (8.6) therefore describe only the thermodynamic contribution; practical controlled flow crystallization also depends on hydrodynamic history and crystal population balance [43-44].
Table 8.1. Influence of common inorganic ions and additives
| Species | Primary interaction | Possible benefit | Possible adverse effect |
|---|---|---|---|
| Fe²⁺/Fe³⁺ | Fenton and redox cycling | Converts H₂O₂ to •OH and intensifies oxidation | Sludge generation, pH sensitivity, catalyst loss |
| HCO₃⁻/CO₃²⁻ | •OH scavenging and CO₃•⁻ formation | May increase selectivity toward electron rich compounds | Usually lowers nonselective oxidation rate |
| Cl⁻ | Formation of chlorine radicals under strong oxidation | Can assist disinfection in selected conditions | Chlorinated byproducts and radical scavenging |
| Br⁻ | Bromine radical chemistry | Fast electron transfer reactions | Bromate or brominated byproduct risk |
| SO₄²⁻ | Changes ionic strength and interfacial behavior | Can influence coalescence and conductivity | May alter dosimetry and scaling tendency |
| S₂O₈²⁻/HSO₅⁻ | Precursor to sulfate radicals | Extends oxidation and can improve selectivity | Reagent cost, residual sulfate, quenching requirement |
| I⁻ | Sensitive oxidant dosimeter | Quantifies integrated chemical activity | Probe chemistry can perturb the radical field at high concentration |
| NO₂⁻/NO₃⁻ | Products and reactants of nitrogen chemistry | Can indicate high temperature gas reactions | Compete for radicals and affect water quality |
| Metal salts | Reduction, hydrolysis, precipitation, nucleation | Nanoparticle and catalyst synthesis | Agglomeration, contamination, and uncontrolled redox chemistry |
Table 8.2. Inorganic and materials applications of cavitation induced chemistry
| Application | Primary chemical role | Important physical role | Key controls |
|---|---|---|---|
| Advanced oxidation | Generate •OH, H₂O₂, SO₄•⁻, or secondary oxidants | Mix reagents and renew interfaces | pH, oxidant dose, ion matrix, energy per order |
| Fenton and Fenton like treatment | Accelerate Fe redox cycle and peroxide activation | Disperse catalyst and reduce mass transfer resistance | Iron dose, pH, peroxide staging, sludge management |
| Nanometal synthesis | Reduce metal ions and create unusual phases | Rapid quench, fragmentation, and deagglomeration | Gas atmosphere, precursor concentration, stabilizer, contamination |
| Metal oxide synthesis | Hydrolysis, oxidation, defect generation | Micromixing and nucleation | Temperature, pH, precursor feed, residence distribution |
| Crystallization | Local supersaturation and possible radical chemistry | Nucleation, attrition, surface cleaning | Supersaturation, pass number, crystal breakage, scale up |
| Disinfection | Oxidative damage to cell components | Membrane disruption and microjet action | Water matrix, organism, contact time, residual oxidant |
| Electrochemical intensification | Remove passivating films and improve redox transport | Boundary layer thinning and gas removal | Electrode spacing, erosion, conductivity, gas evolution |
The classic sonochemical synthesis of amorphous iron demonstrates how cavitation can create phases that are difficult to produce under ordinary bulk conditions [45]. Although that work used acoustic cavitation, the mechanism, rapid localized heating followed by quench and radical reduction, is relevant to hydrodynamic reactors when sufficient collapse intensity and precursor access are achieved. Hydrodynamic devices add continuous throughput and potentially larger production rates, but they require careful control of erosion derived metal contamination and residence time distribution.
9 Chemistry in Organic Liquids and Organic Containing Systems
Organic systems fall into two distinct classes: organic compounds dissolved or dispersed in water, and predominantly organic liquids such as fuels, oils, alcohols, solvents, and monomer mixtures. In aqueous systems, the central question is where the organic molecule resides relative to the bubble. In neat or high organic fraction liquids, solvent vapor becomes a major component of the bubble and can dominate the hot spot chemistry. Organic vapors may pyrolyze to carbon centered radicals, unsaturated fragments, hydrogen, carbon monoxide, carbon dioxide, soot like products, or polymer precursors depending on structure and oxygen availability [3,39-41].
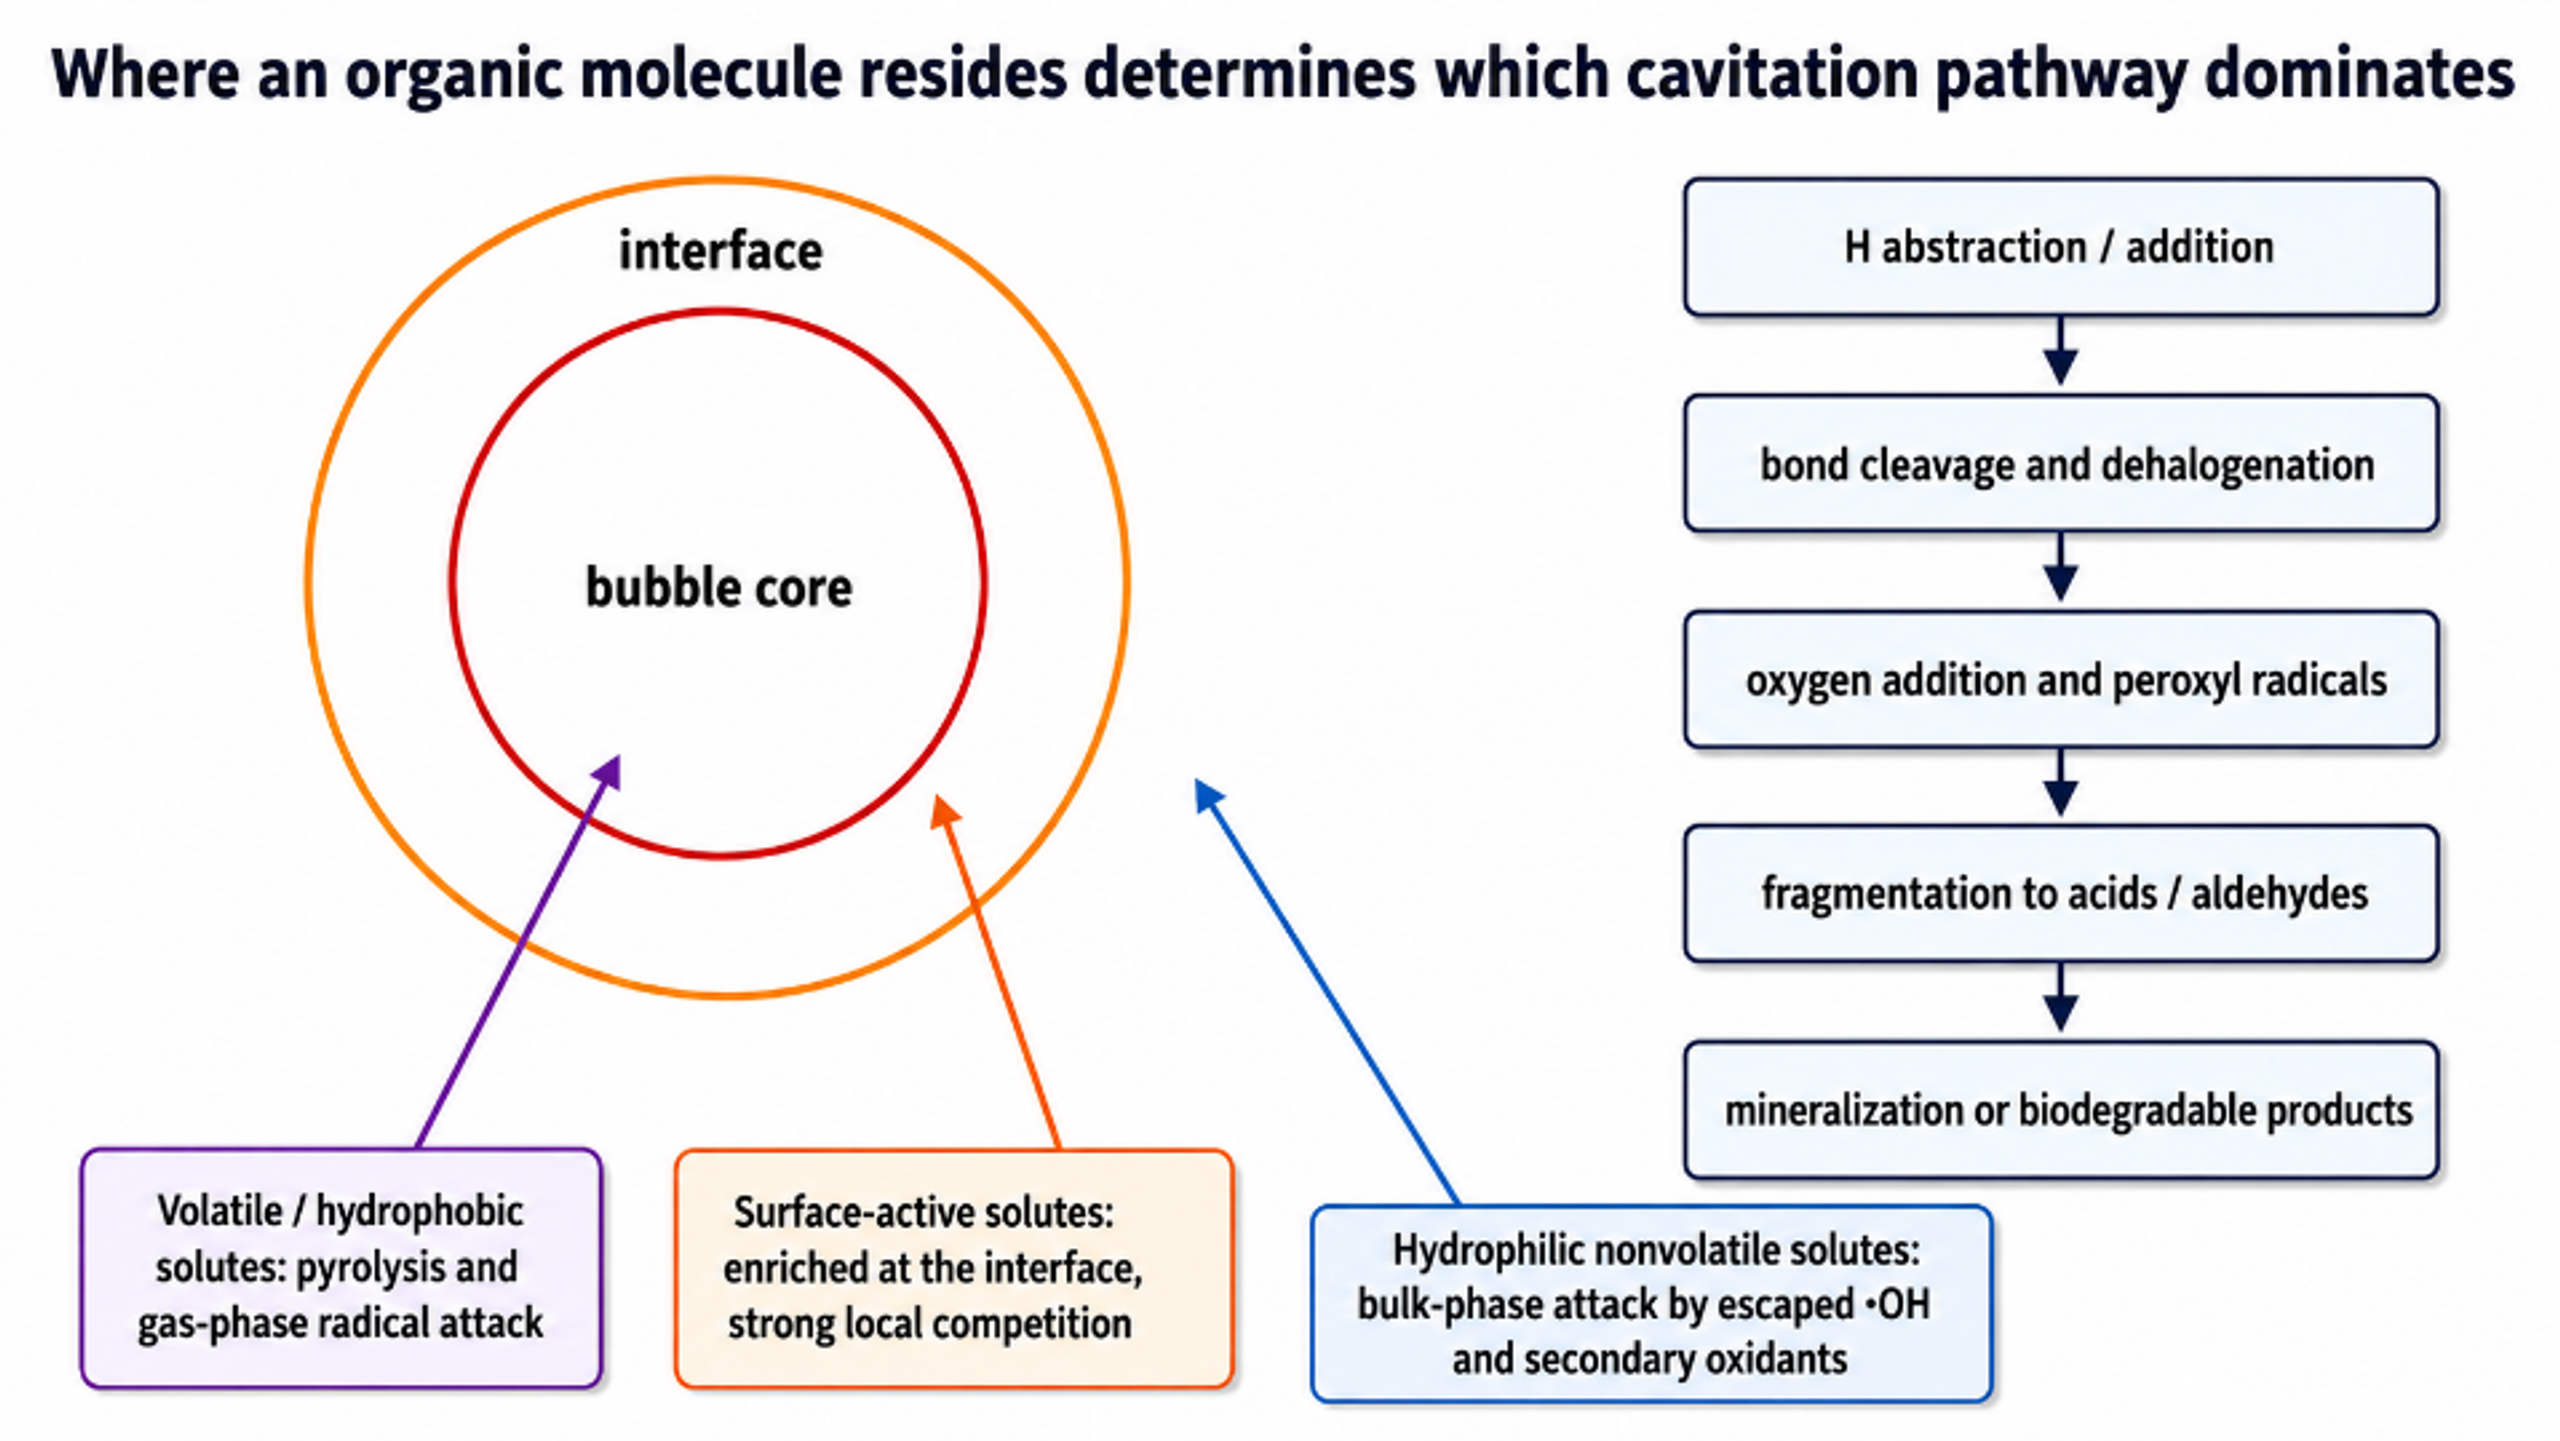
Figure 9.1. Organic molecule location determines the dominant cavitation pathway: gas core pyrolysis, interfacial radical attack, or bulk liquid oxidation [81].
For a dilute volatile solute, Henry's law provides a first estimate of gas liquid partitioning:
where is solute partial pressure, is Henry's law constant under the selected convention, and is liquid mole fraction.
A convenient distribution factor between a cavitation bubble and liquid is:
For a nonvolatile target reacting mainly with a steady radical flux, the observed kinetics may be approximated by:
where contains radical generation, transport, scavenging, and intrinsic reaction contributions.
For a multiphase organic process, the overall rate can be decomposed as:
where the terms represent direct chemistry, enhanced interphase transport, and conversion caused by particle or droplet disruption and surface renewal.
Hybrid process synergy is frequently reported as:
where is the observed rate constant for the combined process and and are rate constants for hydrodynamic cavitation and the auxiliary process alone under matched conditions. greater than 1 indicates positive kinetic synergy on this basis.
Table 9.1. Organic compound classes and likely cavitation pathways
| Compound class | Dominant location | Likely transformations | Analytical concerns |
|---|---|---|---|
| Volatile chlorinated solvents | Bubble core and interface | Pyrolysis, dehalogenation, radical oxidation | Volatilization and off gas must be separated from destruction |
| Phenols and aromatic pollutants | Interface and bulk | •OH addition, ring opening, oxygenation, mineralization | Intermediate toxicity and total organic carbon balance |
| Dyes | Mostly bulk/interface | Chromophore cleavage and oxidation | Color loss can precede mineralization |
| Pharmaceuticals | Bulk/interface; speciation dependent | Hydroxylation, dealkylation, ring cleavage | Transformation products and biological activity |
| Alcohols | Often volatile and interfacially active | H abstraction, aldehyde/ketone formation, radical scavenging | Can suppress aqueous •OH yield while forming organic radicals |
| Hydrocarbons and fuels | Organic phase and bubble vapor | Oxidation, desulfurization, cracking, emulsification | Flammability, off gas, peroxide formation, phase separation |
| Vegetable oils and fatty esters | Dispersed organic phase | Interesterification/transesterification support, oxidation if air is present | Distinguish chemical conversion from emulsification and soap formation |
| Polymers and monomers | Bulk/interface | Chain scission, radical initiation, crosslinking or polymerization | Molecular weight distribution and oxygen inhibition |
| Biomass slurries | Solid liquid interface | Limited direct radical oxidation plus hydrolysis and surface activation | Physical size reduction often dominates observed benefit |
The early hot spot experiments in nonaqueous liquids established that solvent vapor composition controls cavitation temperature and emission [39-41]. High vapor pressure solvents can fill the bubble with polyatomic vapor and lower the collapse temperature. Low vapor pressure liquids may permit stronger heating but can be viscous, difficult to nucleate, or unsafe at elevated pressure. The organic liquid must therefore be selected and conditioned with attention to vapor pressure, viscosity, surface tension, heat capacity, thermal conductivity, gas solubility, flash point, and chemical stability.
Table 9.2. Influence of organic liquid properties on hydrodynamic sonochemistry
| Property | Bubble dynamic effect | Chemical consequence | Design response |
|---|---|---|---|
| Vapor pressure | Controls vapor loading during growth | High vapor pressure supplies reactant but cushions collapse | Lower bulk temperature or raise recovery pressure when appropriate |
| Viscosity | Damps growth and collapse; raises pumping loss | Can reduce active bubble population and radical yield | Use heating cautiously, larger passages, or rotor/vortex designs |
| Surface tension | Changes nucleation and minimum stable radius | Affects interfacial area and emulsion formation | Control surfactants and contamination |
| Thermal conductivity | Controls heat loss from the gas liquid interface | Changes hot spot temperature and quench rate | Consider gas selection and residence time |
| Gas solubility | Sets nuclei and noncondensable gas content | Controls collapse cushioning and oxygen chemistry | Use closed gas conditioning when reproducibility is critical |
| Polarity and hydrogen bonding | Influence vapor composition and radical stabilization | Shift pyrolysis, H abstraction, and electron transfer pathways | Use product analysis rather than assuming aqueous pathways |
| Flash point and autoignition | Do not directly set cavitation, but define hazard envelope | Hot spots do not heat the whole liquid, yet off gas and static ignition remain hazards | Inerting, bonding, ventilation, pressure relief, gas monitoring |
| Phase ratio in emulsions | Changes bubble location and energy dissipation | Controls mass transfer and contact with oxidants | Optimize droplet size, coalescence, and downstream separation |
Hydrodynamic cavitation often benefits organic processing through coupled mechanical and chemical action. In biodiesel synthesis, rapid dispersion and interfacial renewal can dominate over radical chemistry [46]. In deep desulfurization, cavitation disperses aqueous oxidizing species into the organic phase while also generating reactive species [47]. In ethanol and biomass processing, particle disruption and increased enzymatic accessibility are central [21-23,48-49]. These examples reinforce the need to identify the rate limiting mechanism before optimizing for maximum radical yield.
10 Influence of Device Geometry and Operating Conditions
The geometry of a hydrodynamic cavitation device determines the complete pressure time history experienced by the bubble population. Orifices create rapid acceleration, jet contraction, separated shear layers, and abrupt recovery. Venturi devices usually provide a smoother pressure reduction and a more extended low pressure zone. Vortex devices create low pressure in a rotating core and can retain cavities through a longer, curved trajectory. Rotor stator and rotary generators superimpose repeated high velocity gaps, pressure pulses, and intense shear. Microfluidic devices shorten diffusion distances and permit high local pressure gradients at very small flow rates. Controlled flow multistage devices can sequence nucleation, growth, collapse, and interstage mixing [7-8,11-15,17-18,35,50-52].
The same nominal pressure drop can therefore produce very different chemistry. Pawar and coworkers compared three Venturi geometries and an orifice by CFD, individual bubble simulation, high speed imaging, and iodide oxidation. Under their tested conditions, the orifice gave the highest chemical yield per unit energy despite a lower operating inlet pressure. Dense vapor clouds in the Venturi devices increased bubble interaction, coalescence, and radical recombination [11]. This result should not be generalized to every orifice and Venturi; it demonstrates that vapor volume fraction and chemical yield must be optimized separately.
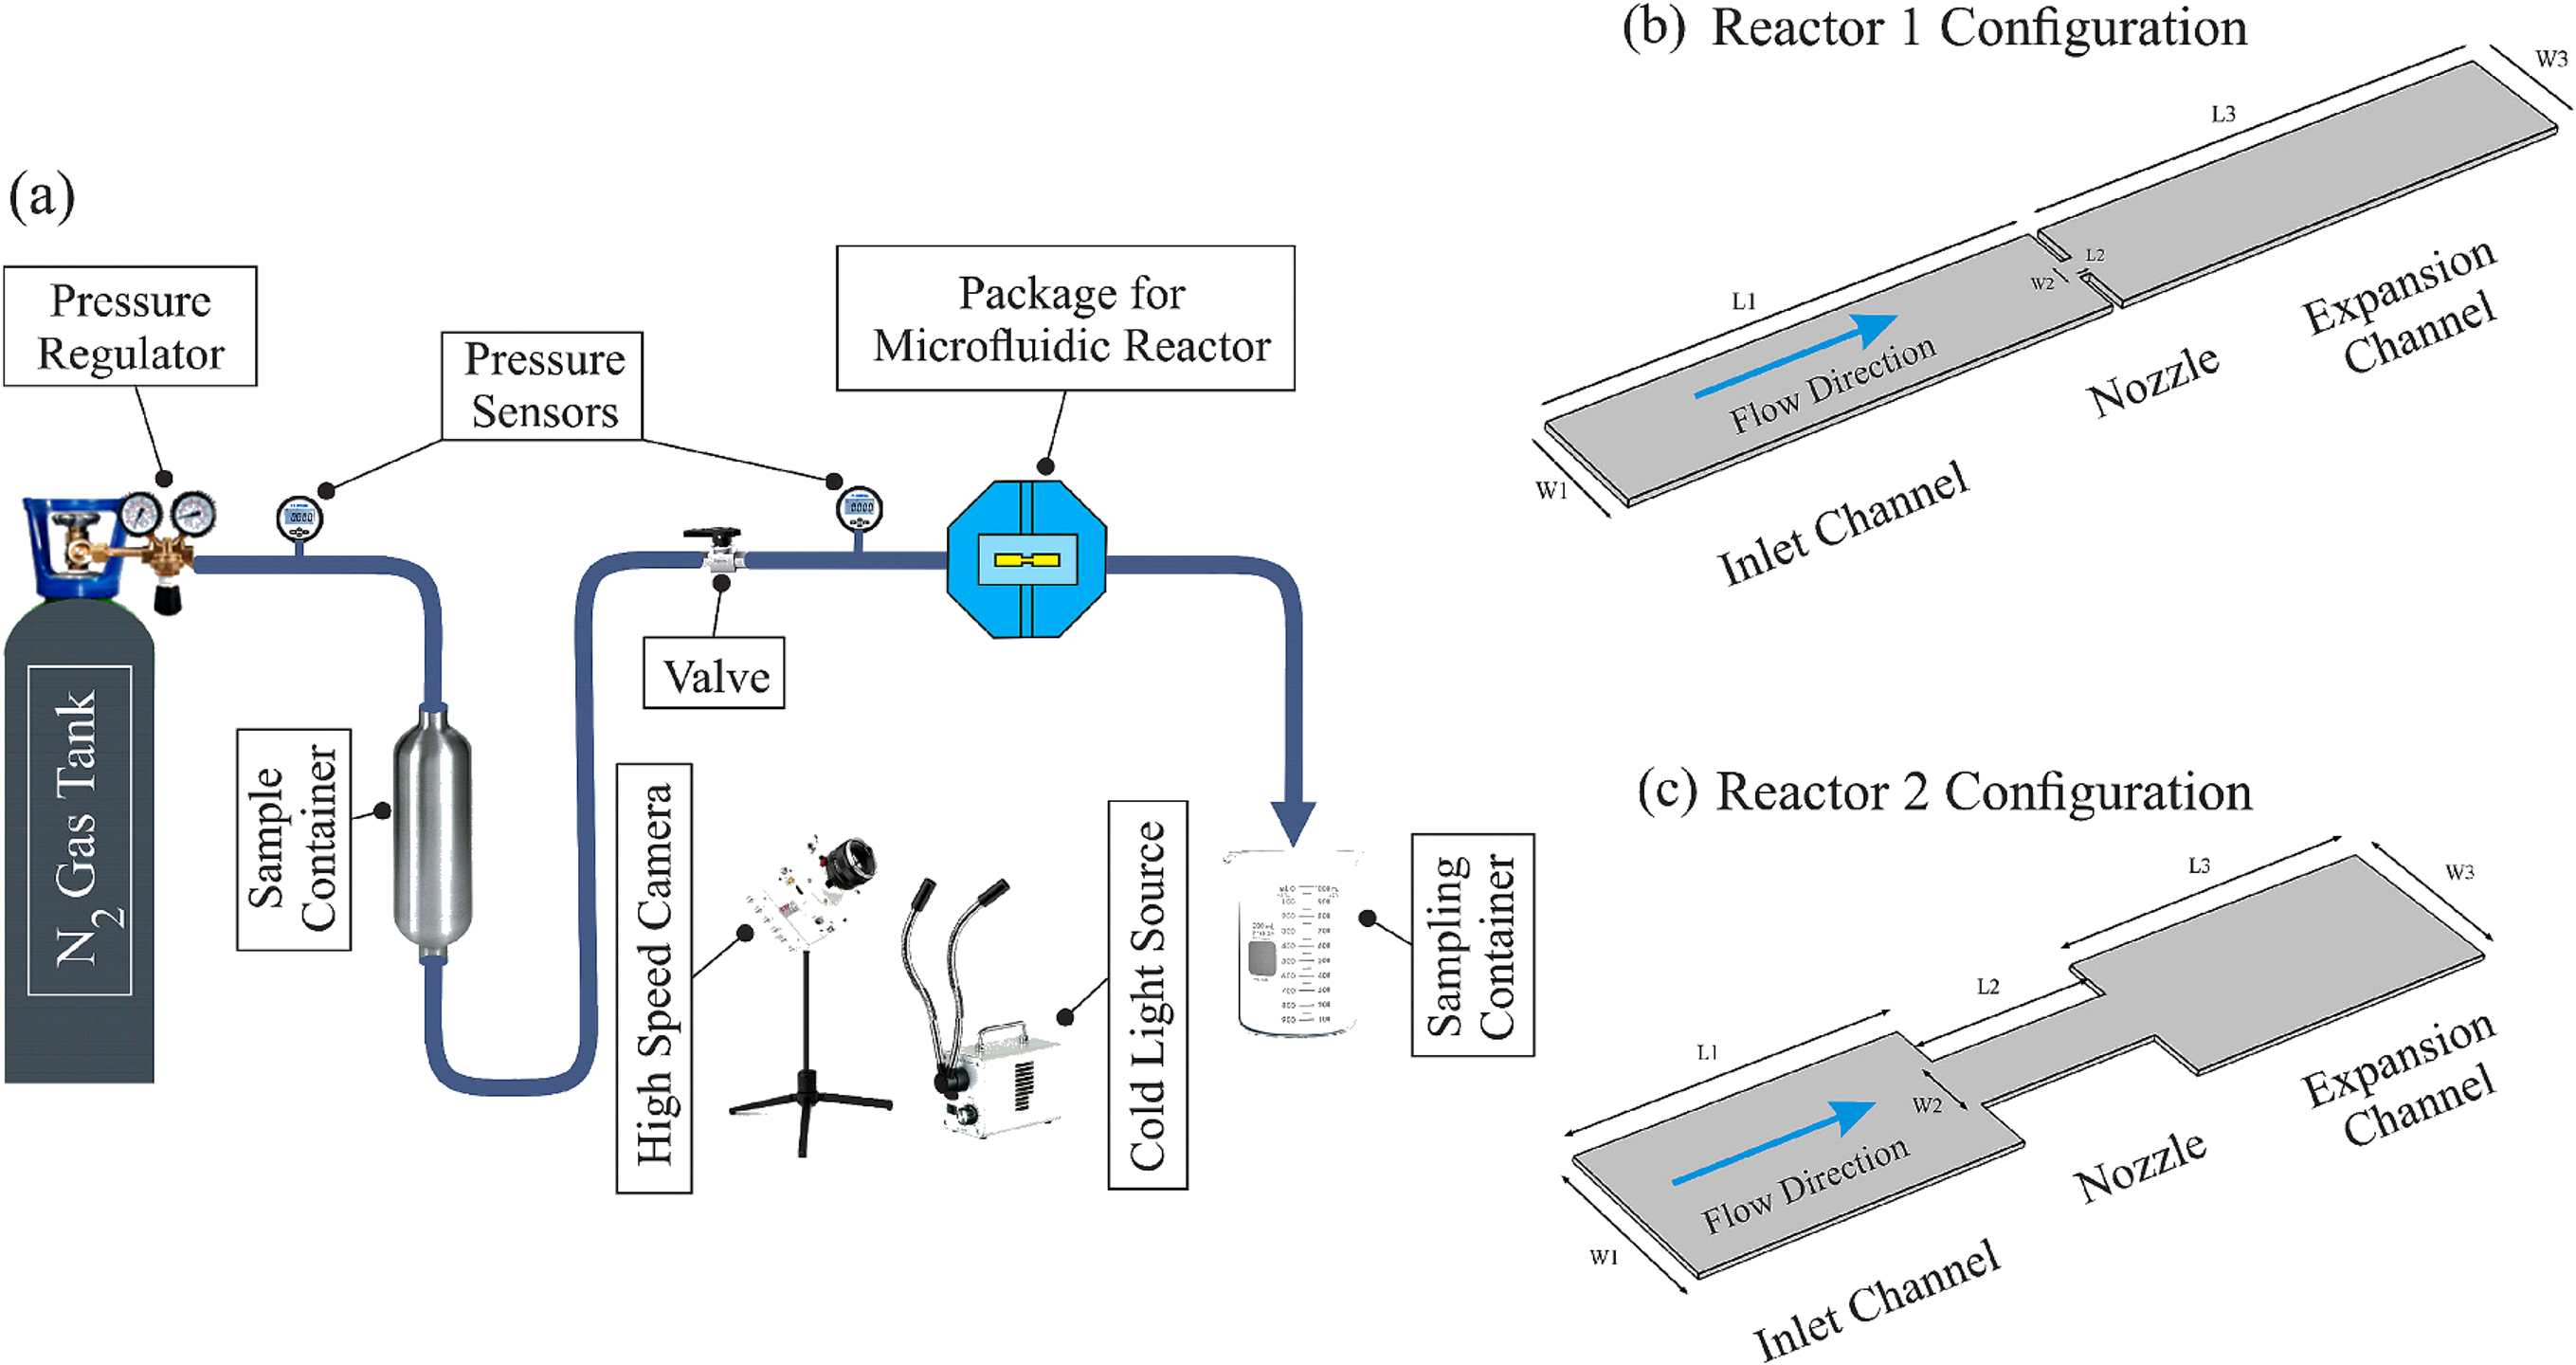
Figure 10.1. Experimental hydrodynamic cavitation on a chip system and the two reactor configurations used to compare a micro orifice with a long diaphragm. [15].
Microscale hydrodynamic cavitation provides a clear demonstration of geometry dependent chemistry. Golshaei and coworkers compared a micro orifice with a long diaphragm configuration using triiodide formation as a chemical indicator [15]. The micro orifice generated a concentrated radical production zone associated with a sharp pressure gradient. The long diaphragm distributed cavitation over a larger length and produced a more gradual chemical signal. In the cavitation inception regime, the reported hydroxyl radical yield per energy input was approximately 0.6 × 10⁻⁶ g J⁻¹ for the micro orifice and 3.0 × 10⁻⁸ g J⁻¹ for the long diaphragm, illustrating an order of magnitude geometry effect.

Figure 10.2. Observed cavitation structures and flow regimes in micro orifice and long diaphragm devices. [15].
Figure 10.2 shows that a reactor can transition from isolated inception bubbles to attached or cloud cavitation as pressure increases. The chemically optimal regime often occurs near or moderately above inception, where collapse intensity remains high and shielding is limited. At very high void fraction, additional vapor can reduce the recovery pressure acting on individual bubbles and can cause collective collapse rather than isolated, chemically efficient events. This is the physical basis of the process window shown later in Figure 10.6.
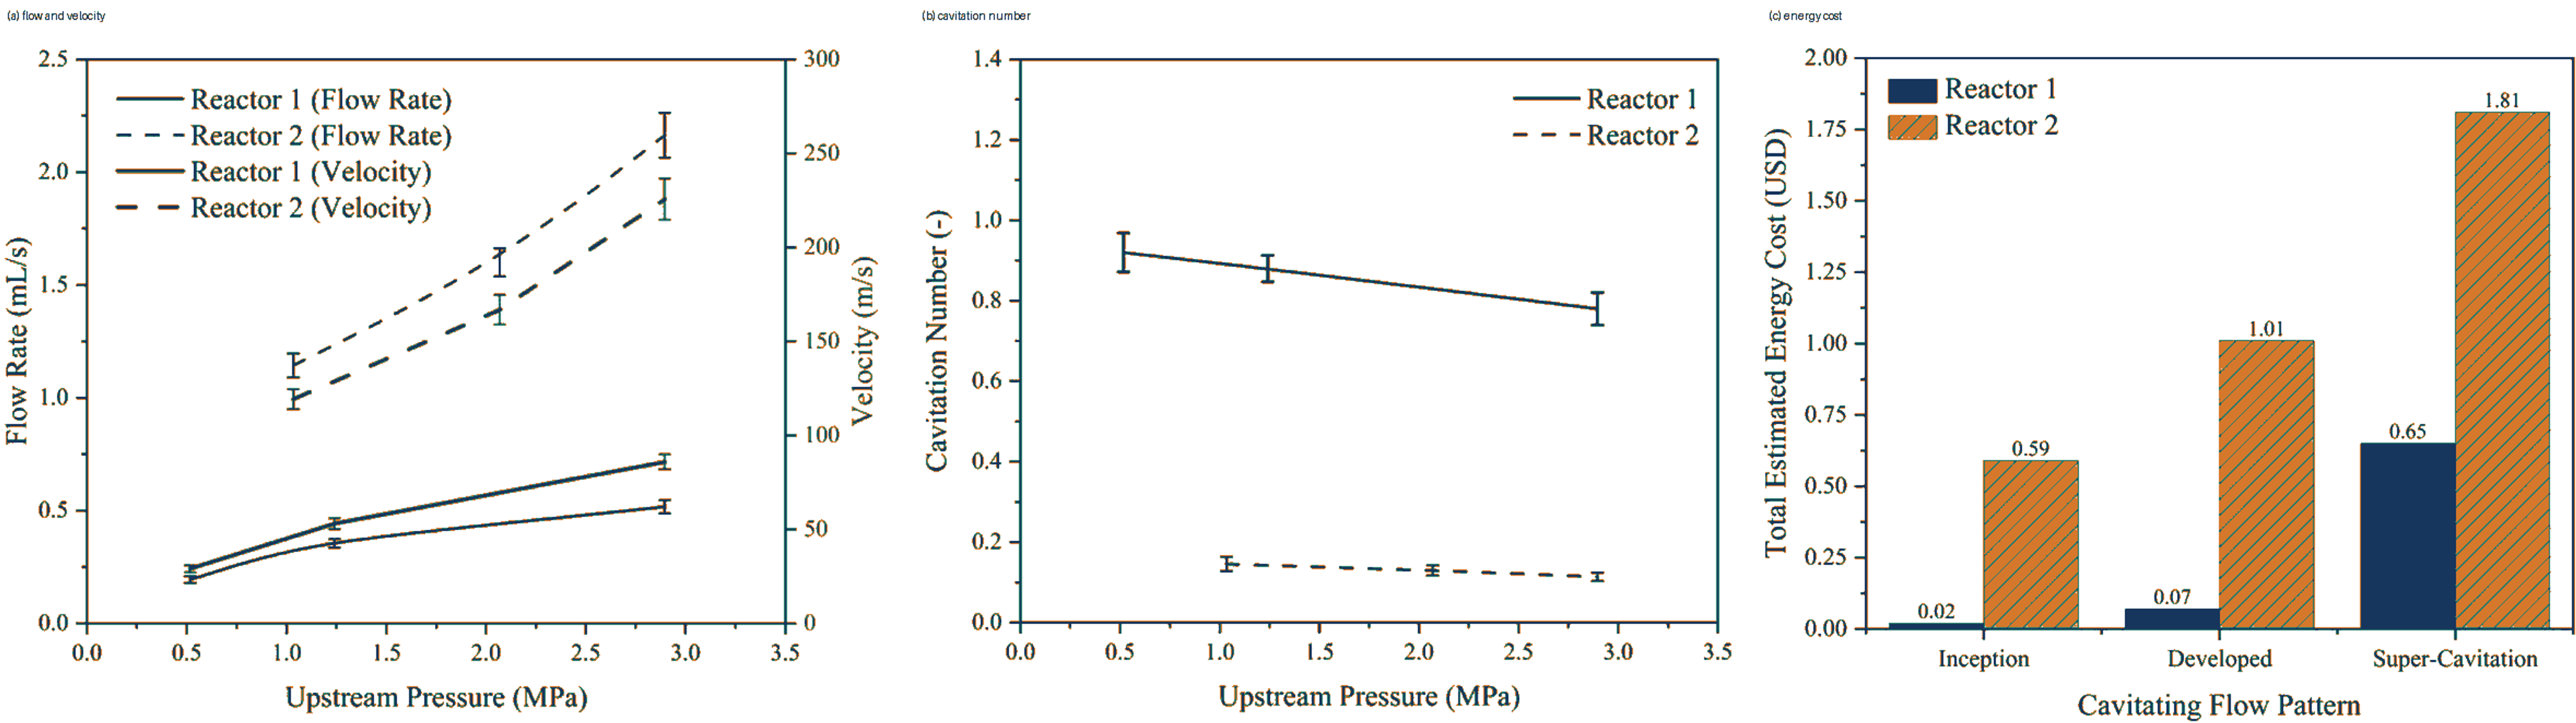
Figure 10.3. Pressure dependent chemical response and comparison of reactor configurations in hydrodynamic cavitation on a chip. [15].
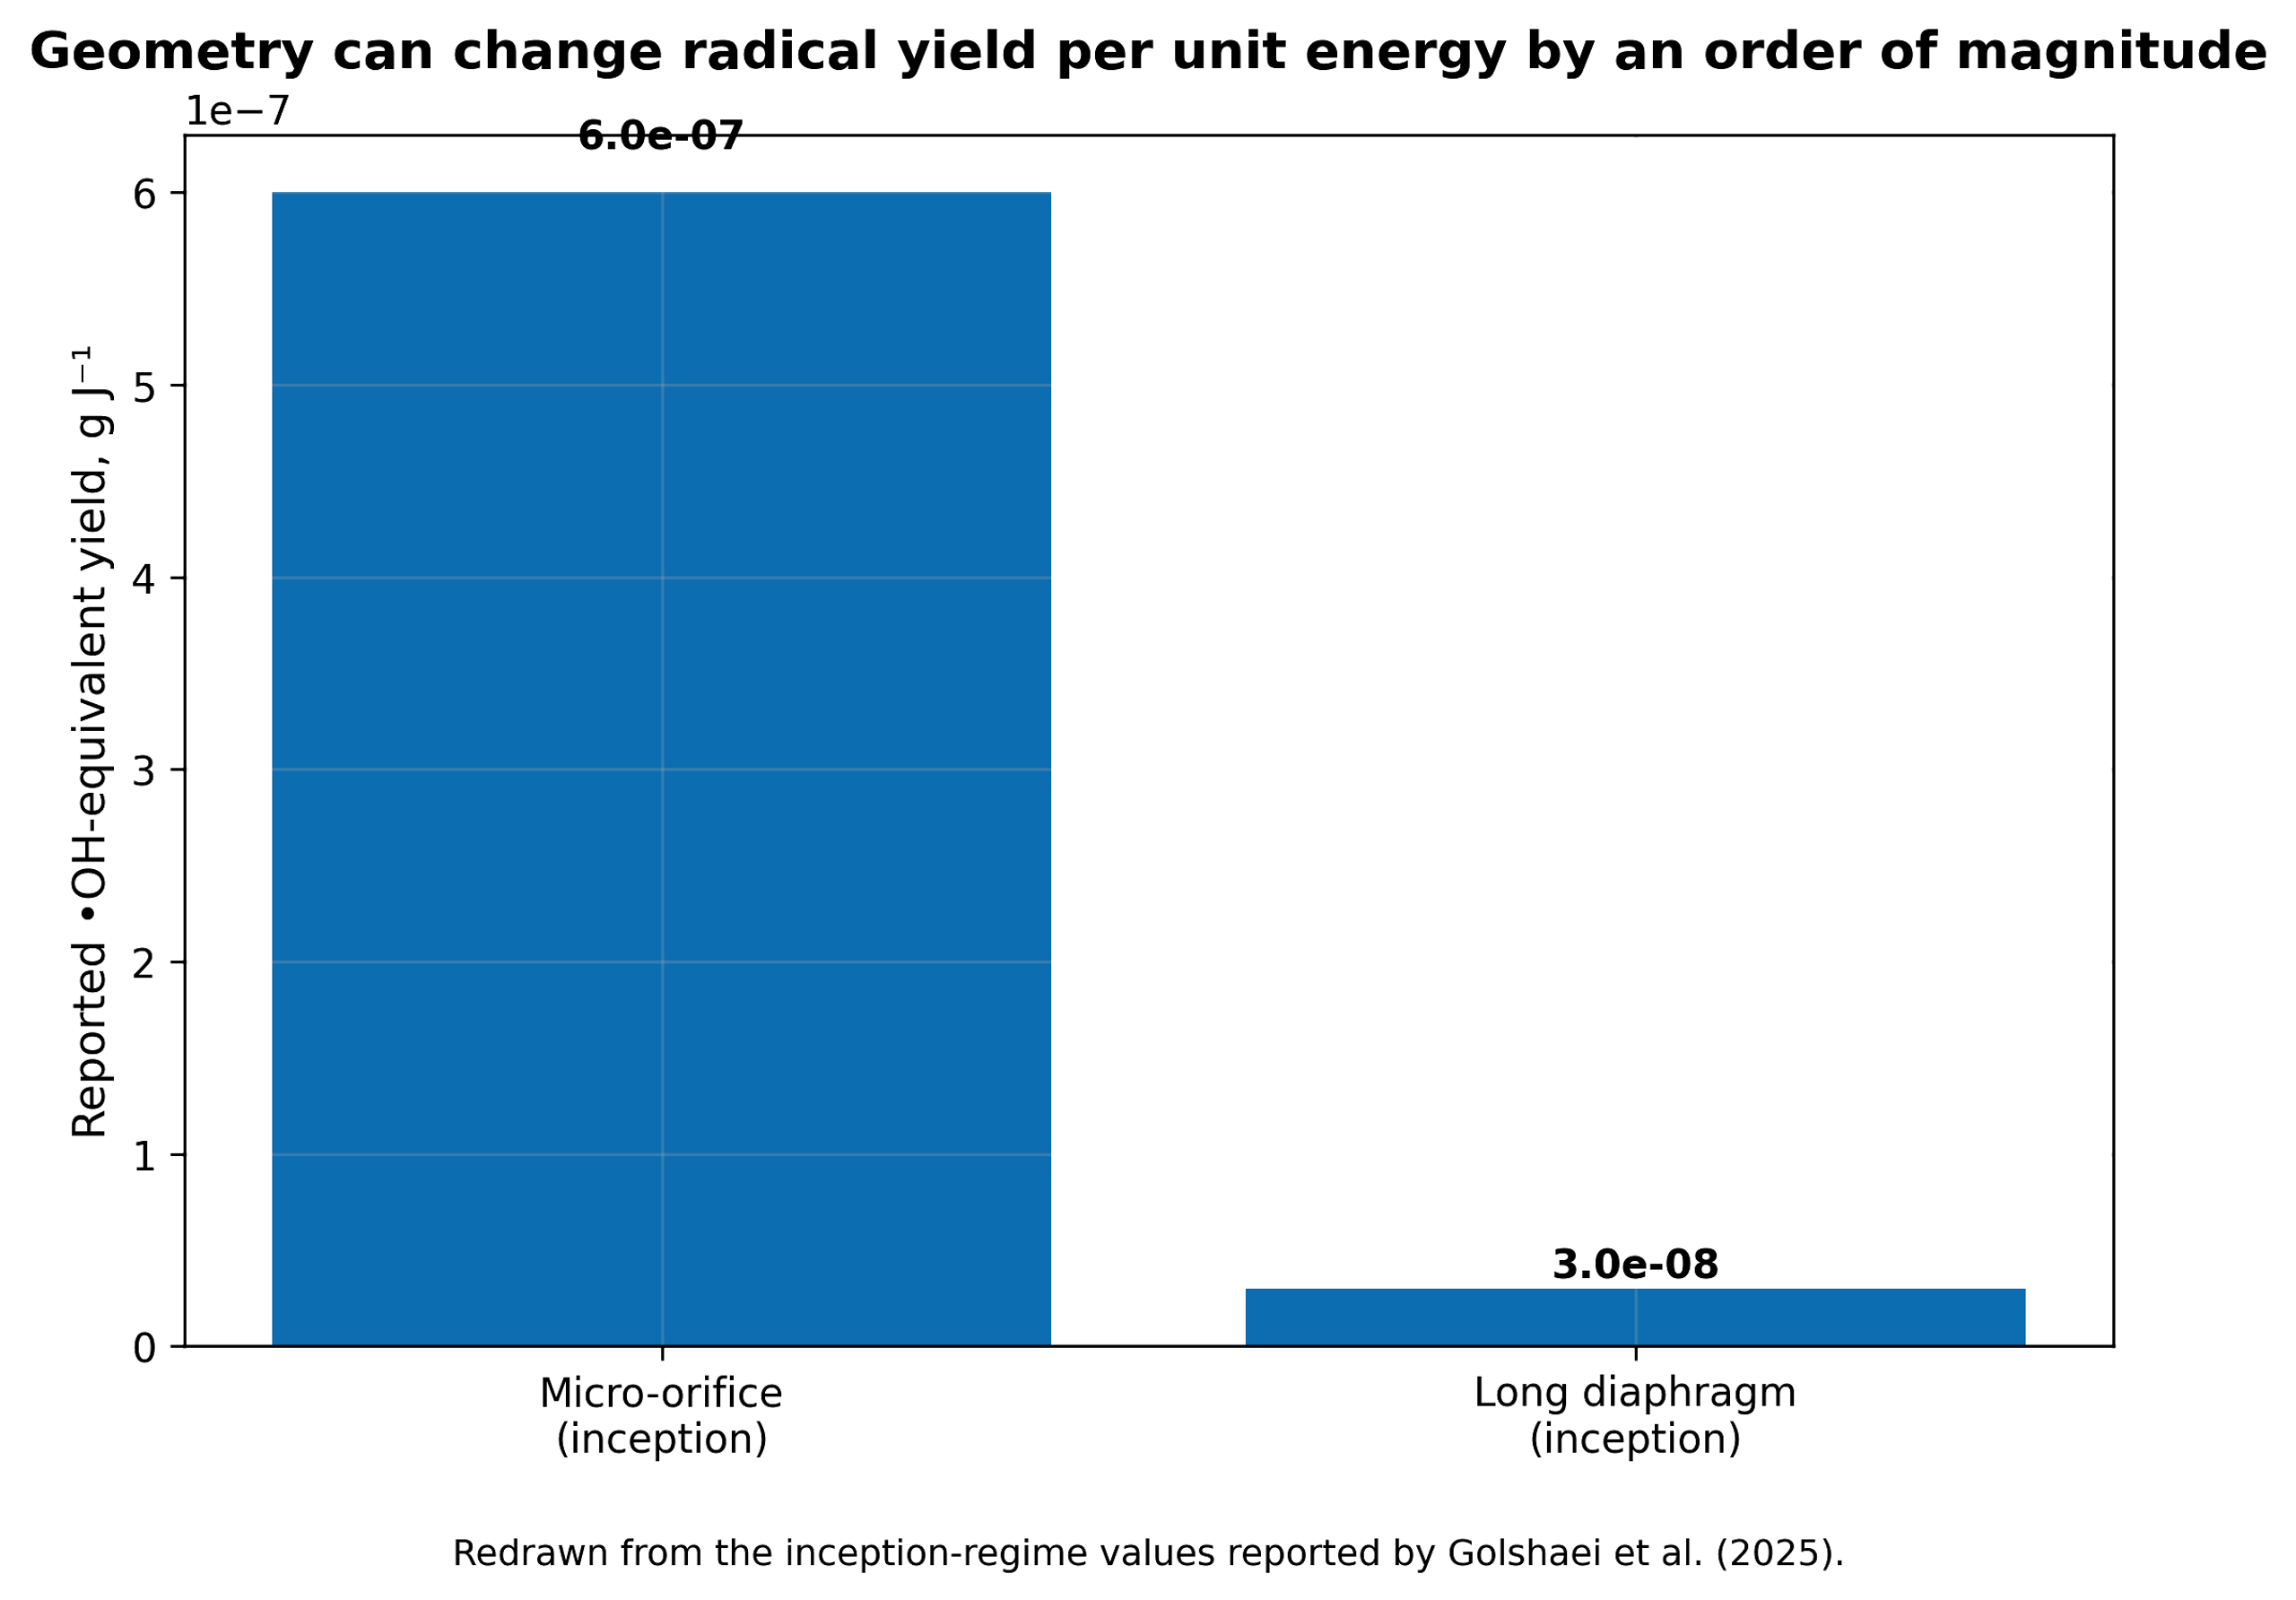
Figure 10.4. Geometry can change hydroxyl radical yield per unit energy by more than an order of magnitude in the inception regime. [15].
The hydraulic power dissipated across a cavitating element is defined as:
where is hydraulic power, Q is volumetric flow, and Δp is pressure drop across the defined device boundary.
The corresponding electrical power attributable to pumping is approximately:
where and are pump and motor efficiencies. Auxiliary power must be added when gas compression, ozone generation, heating, cooling, or separation is part of the process.
The volumetric energy dose delivered over treatment time t is:
where P is the selected power basis and V is treated liquid volume.
A mass specific energy dose is:
where m is treated mass.
Table 10.1. Hydrodynamic cavitation geometries and expected sonochemical behavior
| Geometry | Pressure history | Typical bubble field | Sonochemical opportunity | Main limitation |
|---|---|---|---|---|
| Single hole orifice | Very rapid drop and recovery with jet separation | Discrete bubbles to compact cloud | Strong collapse and simple replaceable element | Erosion, clogging, high local loss |
| Multi hole orifice | Parallel jets and interacting wakes | Distributed clouds; hole to hole interaction | High throughput and tunable perimeter | Cloud shielding and maldistribution |
| Venturi | Smooth acceleration, throat residence, controlled diffuser recovery | Attached sheet or cloud depending on diffuser | Lower permanent pressure loss and controlled residence | Long clouds can collapse weakly or interact strongly |
| Vortex diode/chamber | Low pressure in swirling core; curved recovery path | Core cavitation with recirculation | Scale up by geometric similarity and robust passage | Complex residence time and gas core behavior |
| Rotor stator | Repeated gap acceleration and pressure pulses | Many short events plus intense shear | High throughput, slurries, sludge, emulsions | Shaft power, seals, erosion, heat generation |
| Micro orifice | Extremely steep gradient over short length | Localized inception and rapid collapse | High radical yield per joule in selected regimes | Low single channel throughput and fouling |
| Long micro diaphragm | Extended low pressure and recovery region | Distributed bubble activity | Uniform exposure and sustained chemistry | Lower local collapse intensity |
| Multistage controlled flow device | Repeated acceleration, cavity formation, recovery, and mixing | Sequenced bubble populations | Tailored number of collapse events and scale up | Greater pressure demand and design complexity |
10.1 Operating pressure, backpressure, and recovery
Increasing inlet pressure usually increases velocity and vapor generation, but chemical yield commonly passes through a maximum. At low pressure, few bubbles reach an inertial collapse. At intermediate pressure, the number of active bubbles and collapse intensity increase. At excessive pressure or too low backpressure, a long vapor cloud can persist beyond the intended reactor and collapse weakly, collectively, or in downstream equipment. Raising backpressure can shorten the cloud and force collapse within a designed recovery zone, but too much backpressure suppresses inception. The optimum is therefore defined by both inlet pressure and pressure ratio.
The recovery gradient is as important as the minimum pressure. A very abrupt recovery can create intense collapse but also erosion and strongly nonspherical jets. A gradual diffuser can reduce loss and erosion but may allow vapor to condense without a violent event. For chemical service, diffuser angle, throat length, and downstream geometry should be selected to place collapse in a replaceable, well mixed region rather than on a pump impeller, valve seat, or thin wall [50,52].
10.2 Temperature, viscosity, surface tension, and dissolved gas
Bulk temperature has competing effects. Higher temperature raises vapor pressure, lowers viscosity, and often increases vapor volume. Lower viscosity improves flow and bubble growth, but increased water or solvent vapor cushions collapse. Chemical reaction rates and mass transfer can improve while radical yield per bubble declines. A temperature sweep is therefore required for each liquid. The optimum for aqueous oxidation is often below the temperature that maximizes visible cavitation.
Surface active contaminants can lower surface tension and stabilize small bubbles or droplets, increasing the apparent bubble count. They can also occupy the interface and scavenge radicals. In wastewater, surfactants may initially promote dispersion and then be degraded, causing the cavitation field to change during treatment. Dissolved salts alter gas solubility and coalescence; solids act as nuclei but can also erode passages or quench radicals. These effects explain why results from clean water cannot be transferred directly to process liquids.
10.3 Hybrid advanced oxidation
Hydrodynamic cavitation is frequently combined with hydrogen peroxide, ozone, Fenton reagents, persulfate, photocatalysts, aeration, ultraviolet light, or electrochemistry. The hybrid process can be synergistic when cavitation improves reagent dispersion, renews catalyst surfaces, decomposes a stable oxidant into radicals, or increases transfer of gas such as ozone. It can be antagonistic when a reagent cushions collapse, scavenges useful radicals, changes pH away from an optimum, or increases ionic strength and recombination [53-56].
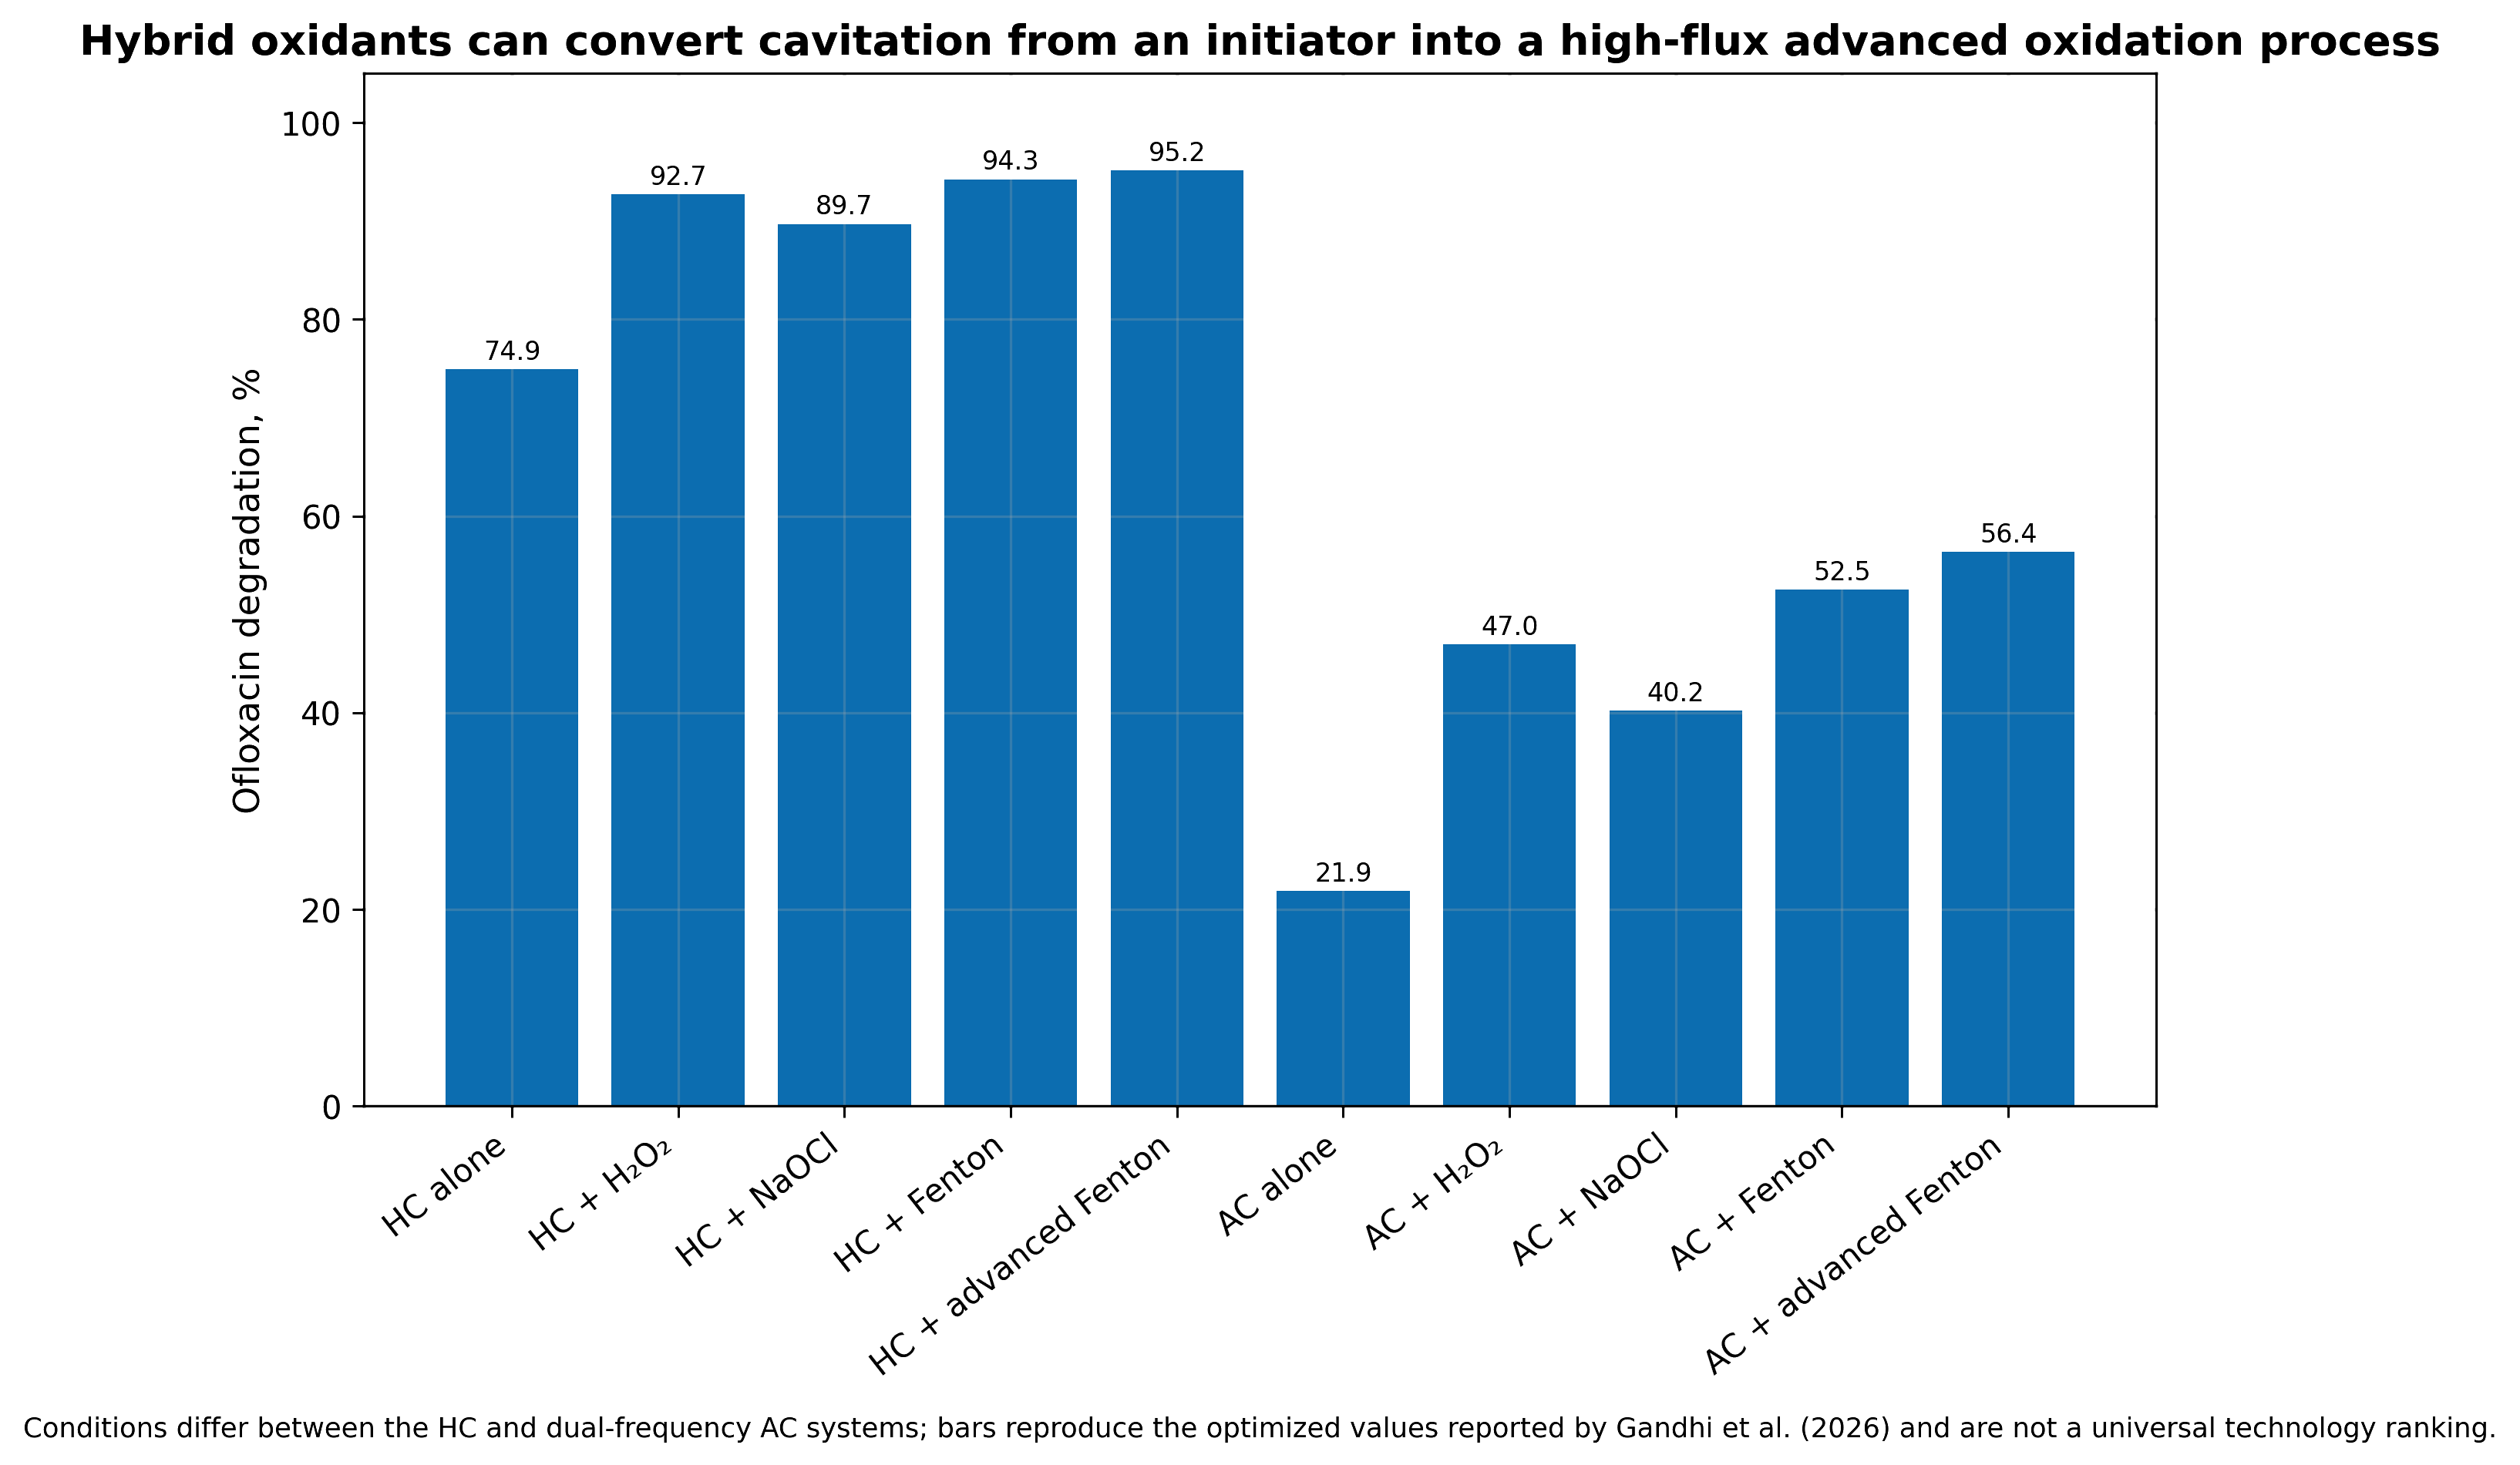
Figure 10.5. Illustrative comparison of hydrodynamic cavitation and hybrid advanced oxidation for a pharmaceutical contaminant. Bars show how auxiliary oxidants can increase conversion while also increasing reagent and energy demand. [53,55-56]. Values are normalized for mechanistic comparison and are not a cross study performance claim.
A proper hybrid evaluation includes four matched tests: untreated control, cavitation alone, auxiliary process alone, and the combination. Reagent consumption and residual oxidant must be measured, not inferred from initial dose. The optimum addition strategy may be staged rather than a single charge. Peroxide added upstream can enter the bubble and decompose, but it can also be consumed before the target is well mixed. Ozone may be transferred more efficiently when injected near the low pressure region, yet gas loading can alter pump performance and bubble collapse. Reactor hydraulics and reagent kinetics must therefore be optimized together.
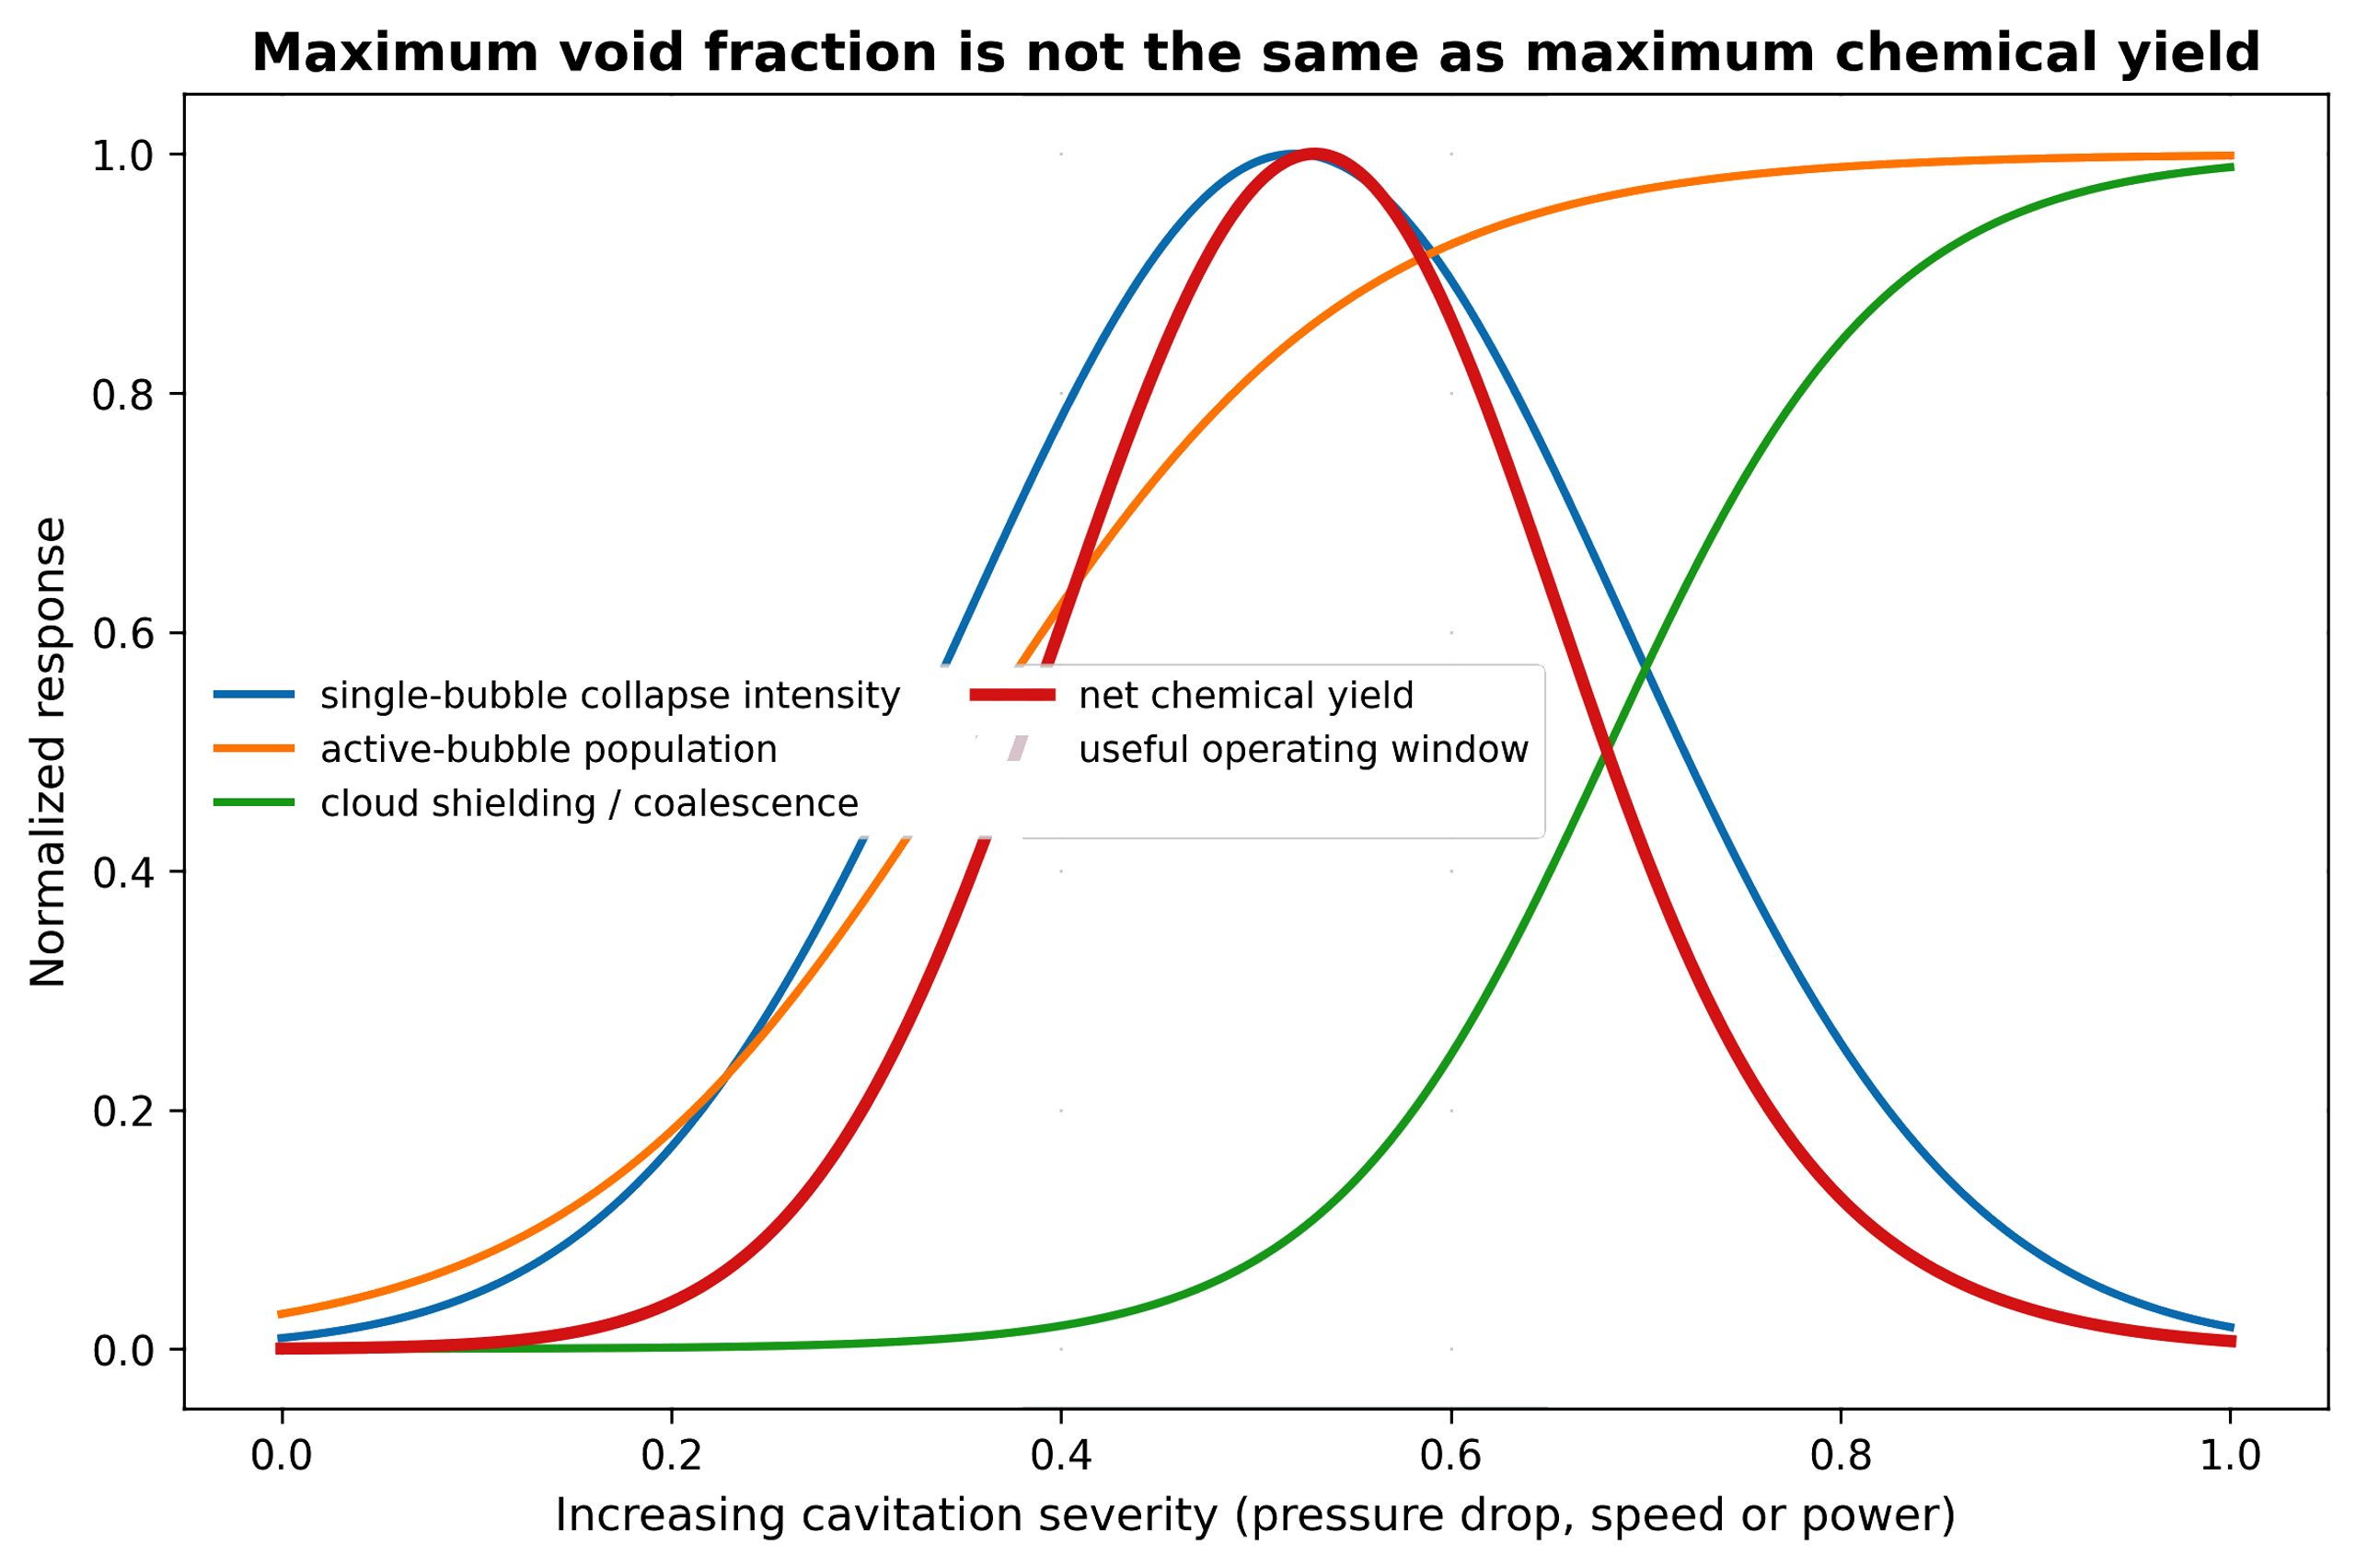
Figure 10.6. Maximum void fraction is not the same as maximum chemical yield. The useful process window balances active bubble population, collapse intensity, radical escape, and reagent accessibility [81].
Table 10.2. Effect of operating variables on chemical yield
| Variable increased | Low to intermediate effect | Excessive value effect | Recommended metric |
|---|---|---|---|
| Inlet pressure or rotor speed | More inception and stronger collapse | Cloud shielding, erosion, heat, and diminishing yield | Product mol/J and cavitation structure |
| Backpressure | Moves collapse into reactor and can intensify recovery | Suppresses bubble growth and inception | Cloud length, pressure ratio, chemical yield |
| Bulk temperature | Lower viscosity and faster kinetics | Higher vapor loading cushions collapse | Yield versus temperature at matched energy |
| Dissolved gas | More nuclei and oxygen availability | Gas cushioning and persistent holdup | Dissolved gas plus bubble count |
| Number of passes | Accumulates exposure and conversion | Product over oxidation, heat, erosion, and diminishing returns | Per pass conversion and selectivity |
| Oxidant dose | More secondary radicals and bulk oxidation | Scavenging, residual chemical, cost | Oxidant utilization efficiency |
| Solids concentration | More nuclei and surface activation | Attenuation, clogging, erosion, and viscosity increase | Specific energy per dry mass |
| Surfactant concentration | Stabilizes dispersion and interfacial area | Radical scavenging and foam | Interfacial area, foam, target conversion |
| Device stages | More controlled collapse events | Higher pressure loss and mechanical complexity | Incremental yield per stage |
11 Energy Partition, Reactor Integration, and Scale Up
Only a fraction of the initial pump or shaft energy is ultimately converted into chemical products. The majority of input energy is dissipated through various physical and chemical pathways, including:
-
Fluid dynamics: Ordinary turbulence, viscous losses, and large scale fluid circulation
-
Thermodynamic and acoustic effects: Thermal heating and pressure waves
-
Cavitation phenomena: Bubble rebound, microjets, and material erosion
Didenko and Suslick [26] quantified the energy partition among photons, radicals, ions, and mechanical outputs for single bubble acoustic cavitation, demonstrating that chemical energy conversion represents a minor yet measurable branch.
Because hydrodynamic reactors introduce significant fluid circulation and permanent pressure losses, precise definition of the system boundary remains essential for accurate performance evaluation and scale up.
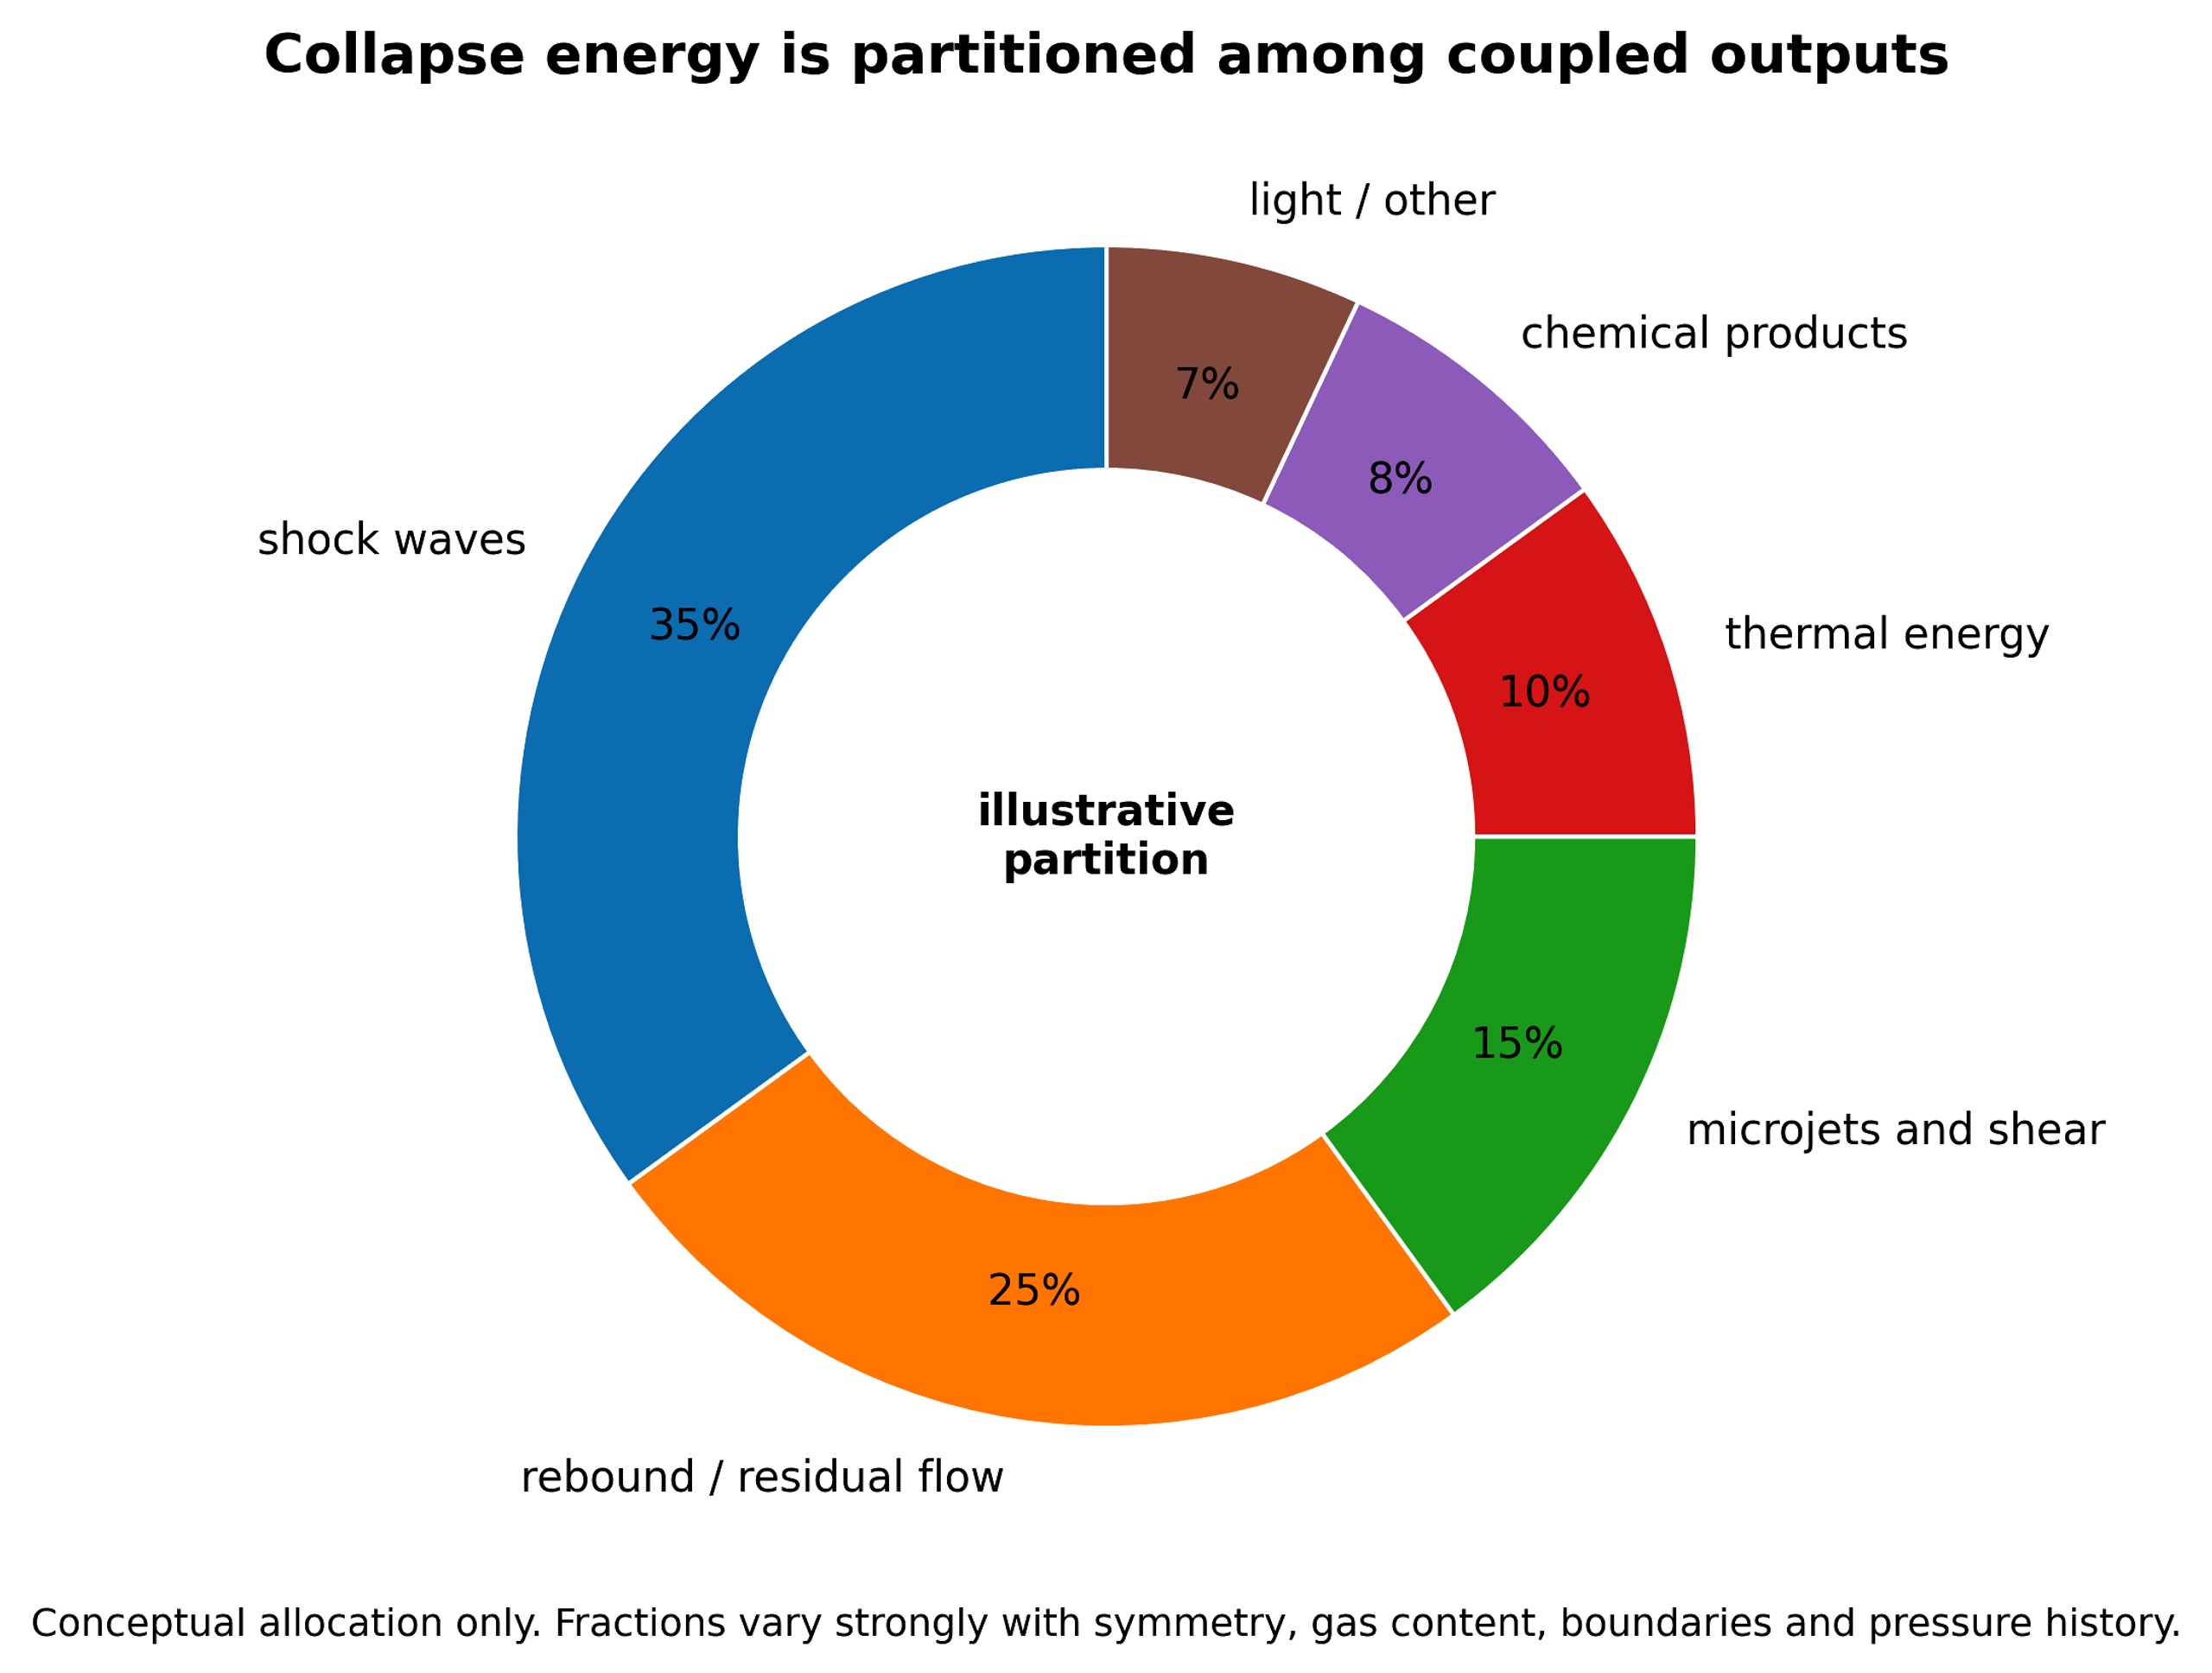
Figure 11.1. Illustrative partition of collapse energy among shock waves, rebound, microjets and shear, thermal energy, chemical products, and light [81].
Chemical energy efficiency () can be formally quantified as:
where is moles of chemical product j, is a selected Gibbs energy value for its formation or useful reaction, and is the stated energy boundary.
For repeated pass treatment with a constant per pass removal fraction , a simple model is:
where N is the number of passes. The model is useful for early design but fails when fluid properties, intermediates, or radical demand change with conversion.
A continuous reactor with residence time distribution E(t) gives outlet concentration:
for a first order reaction with rate constant k.
For geometrically similar devices, a pressure drop similarity criterion can be written:
where Eu is the Euler number. Maintaining Eu alone does not guarantee similar cavitation chemistry because nuclei, Reynolds number, residence time, vapor pressure, and gas content may differ.
A useful collapse exposure density is:
where is the number of chemically active collapse events, is mean energy per active collapse, and is treated volume. is conceptual because the two microscopic quantities are difficult to measure, but it identifies the scale up target more directly than void fraction.
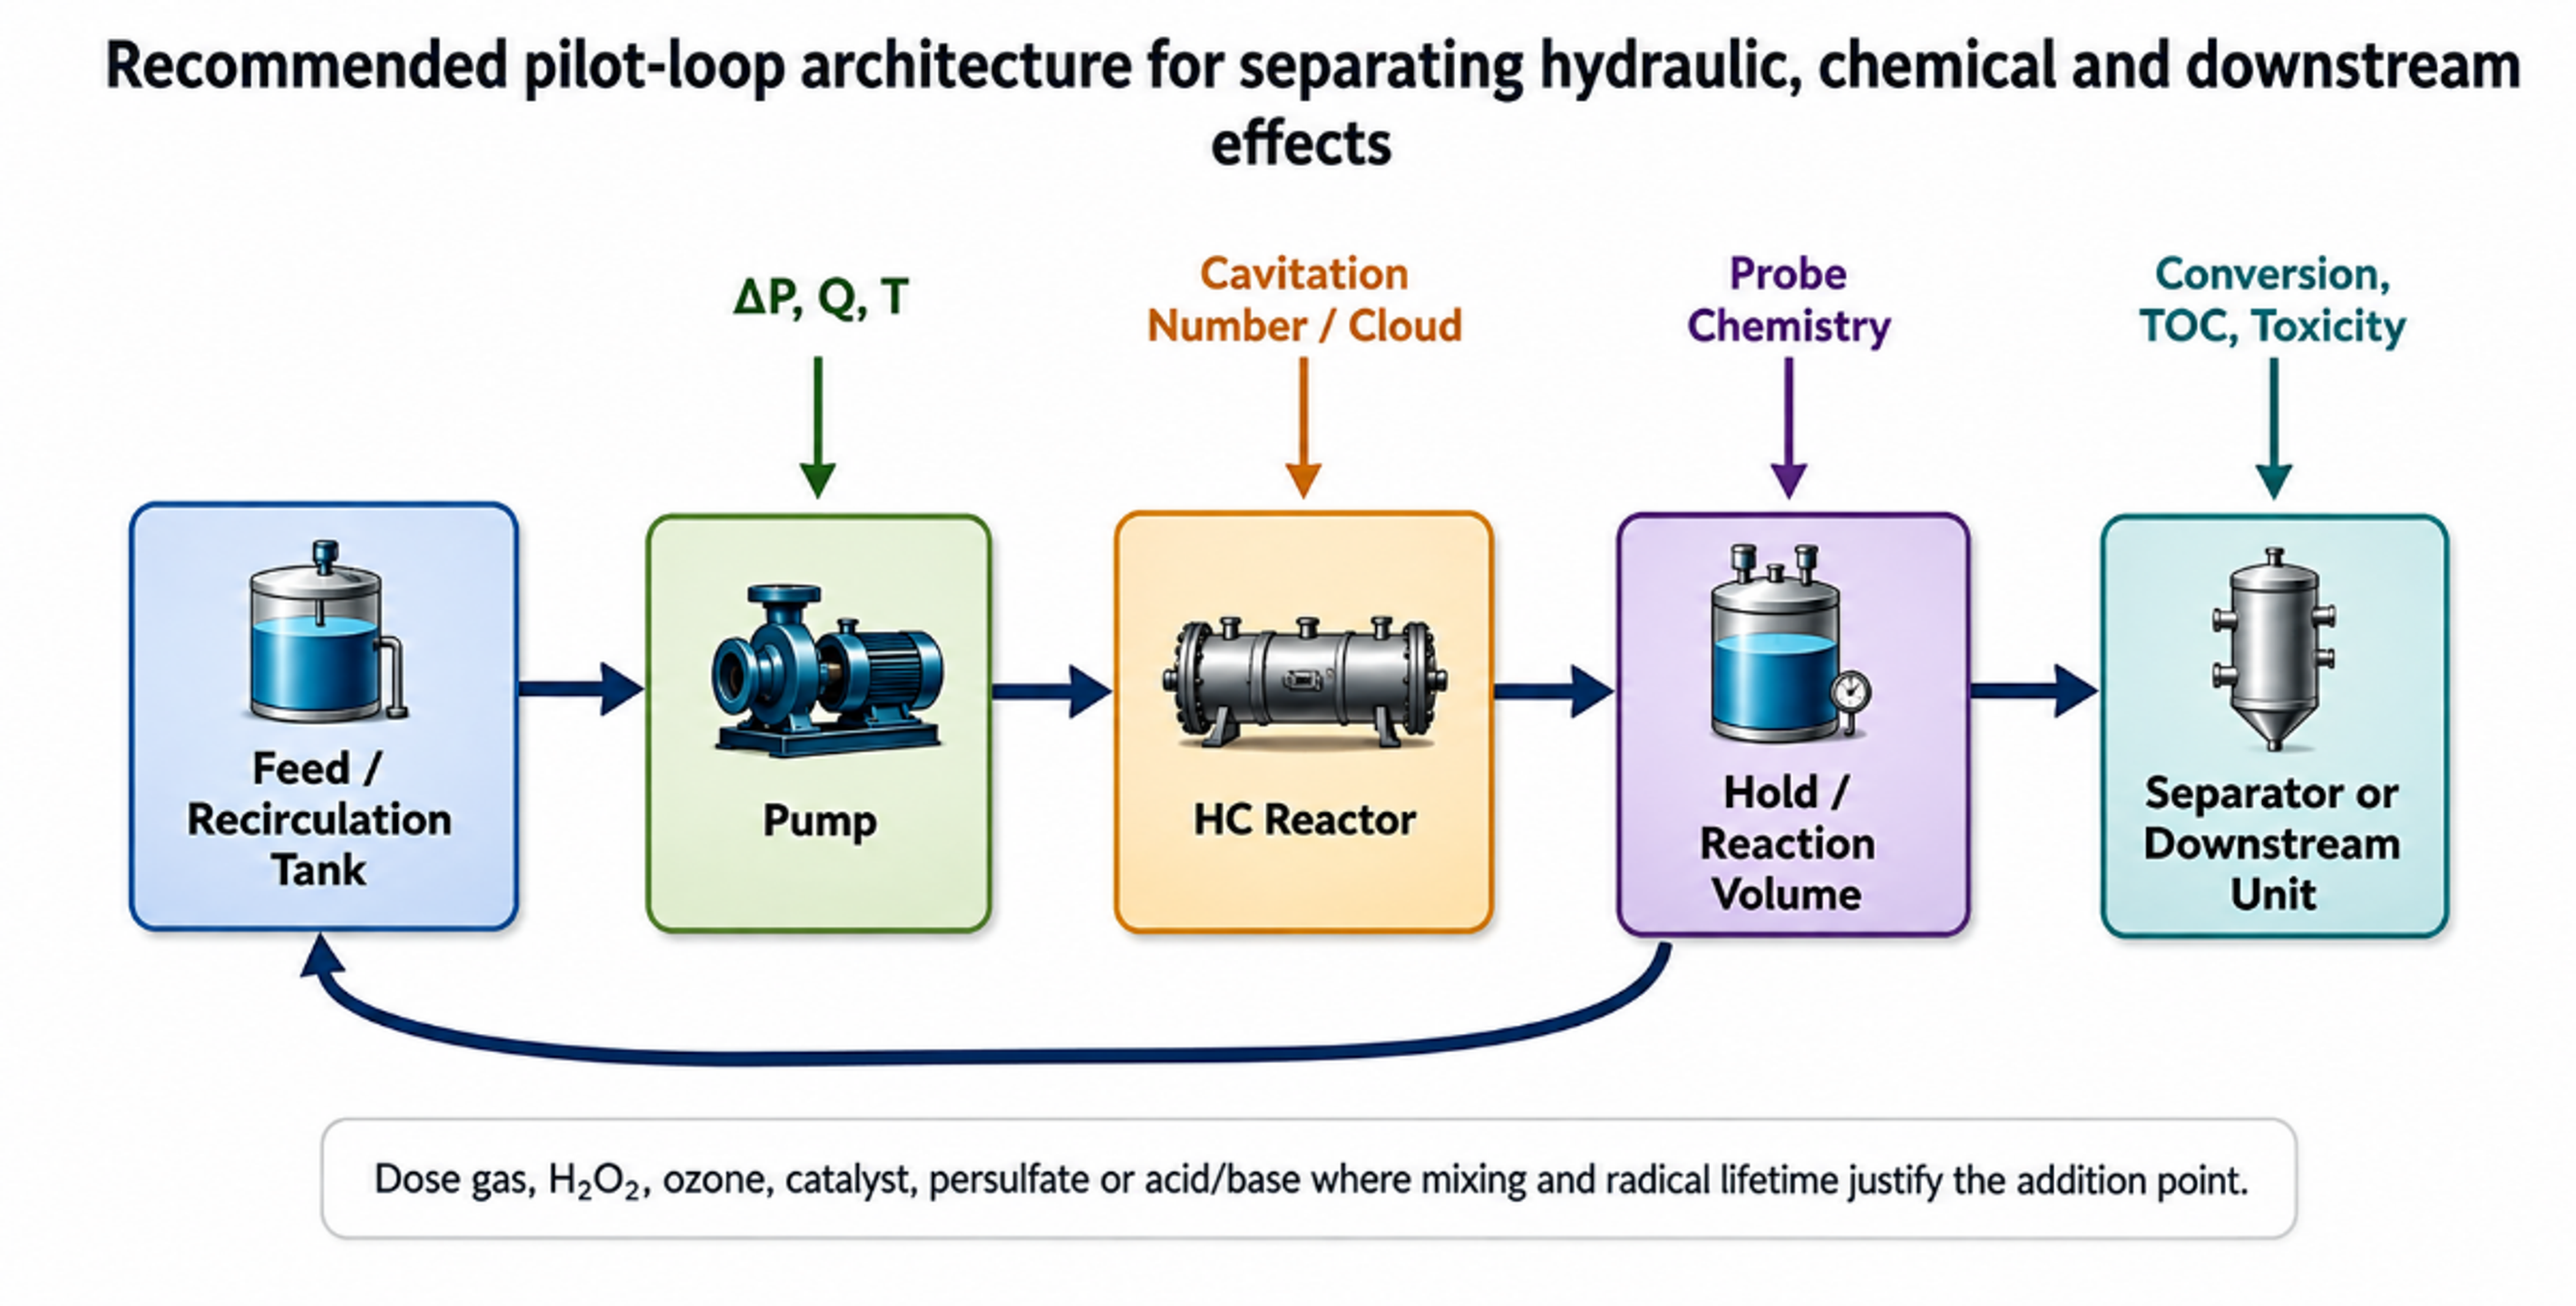
Figure 11.2. Recommended pilot loop architecture for separating hydraulic, chemical, and downstream effects [81].
The pilot loop in Figure 11.2 places pressure and temperature measurements immediately around the cavitation device, includes gas conditioning and sampling, and provides a downstream hold or reaction volume. This separation is important because radicals are generated in the cavitation zone but longer lived species can continue reacting downstream. A heat exchanger controls the temperature history so that chemical improvements are not confused with simple warming. A separator or quench point permits mass balance on volatile compounds, solids, or phases.
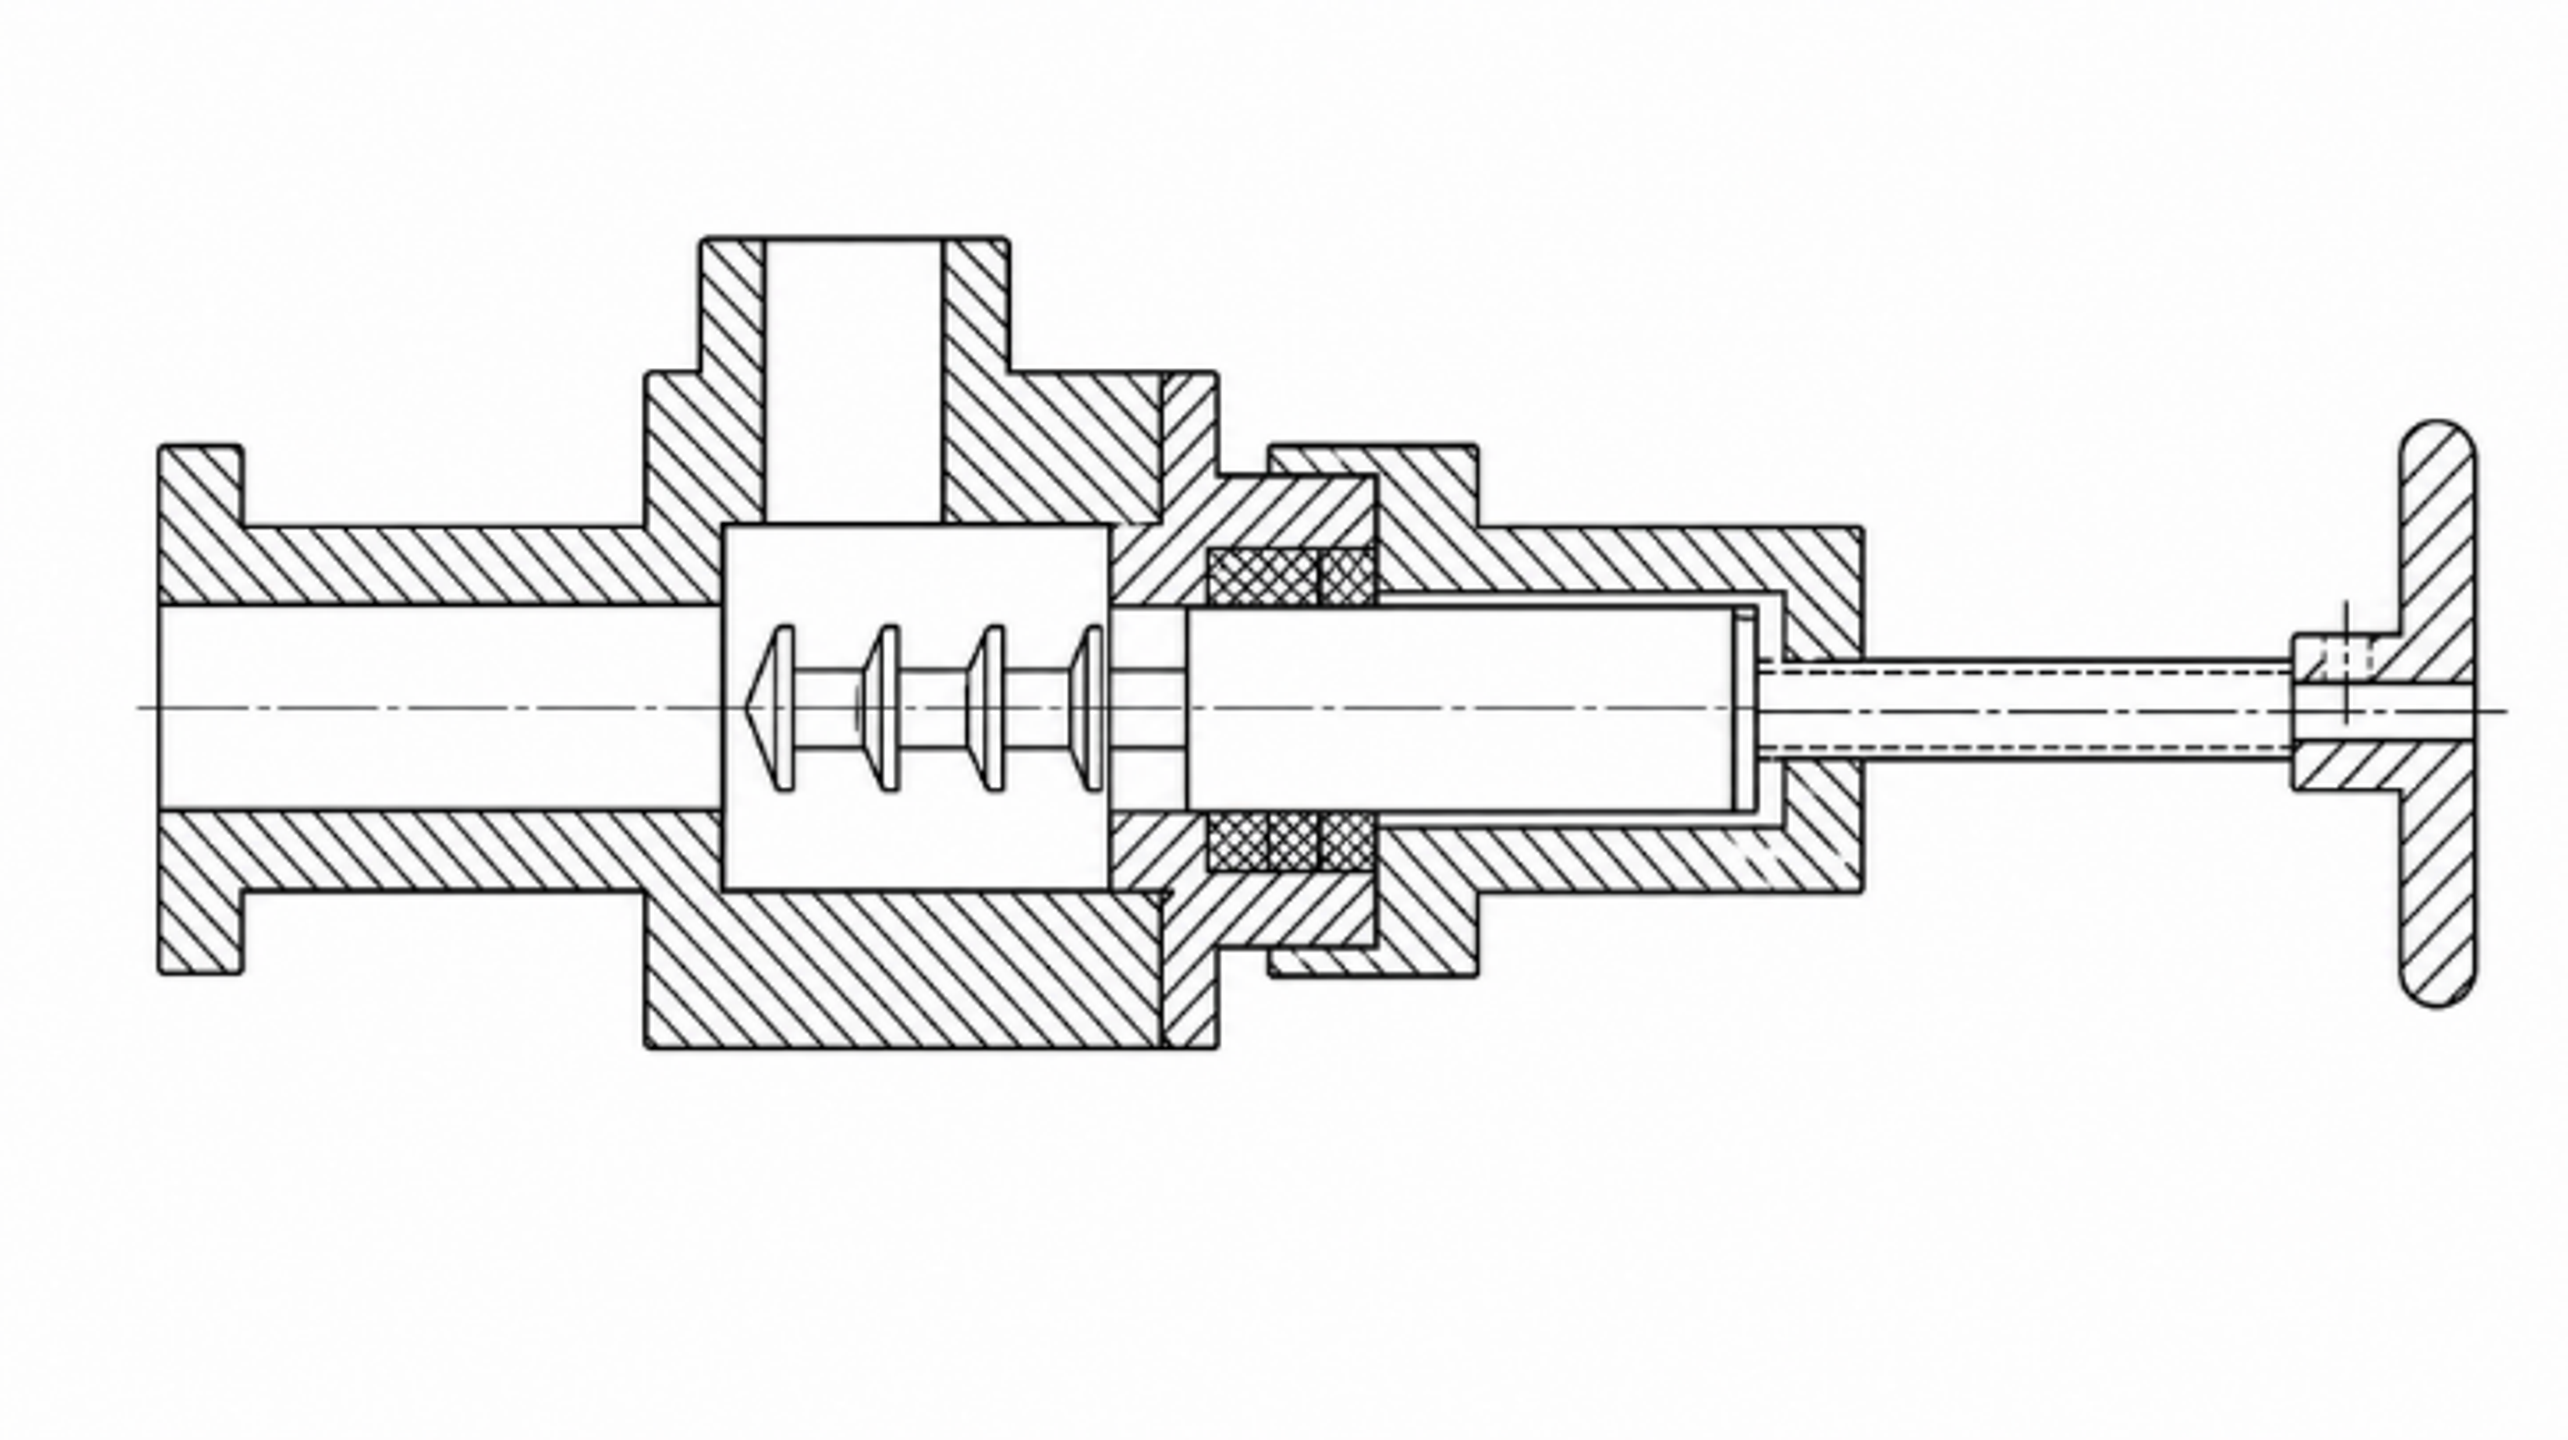
Figure 11.3. Multistage controlled flow hydrodynamic cavitation device with repeated flow passages and recovery regions. [17].
Multistage controlled flow devices, such as the arrangement shown in Figure 11.3, are intended to create repeated cavitation events while maintaining continuous throughput [17]. Staging can distribute the total pressure drop, provide controlled recovery between elements, and improve exposure uniformity. It can also increase cumulative erosion and pumping demand. The correct number of stages is determined by incremental chemical yield, not by the largest feasible pressure drop.
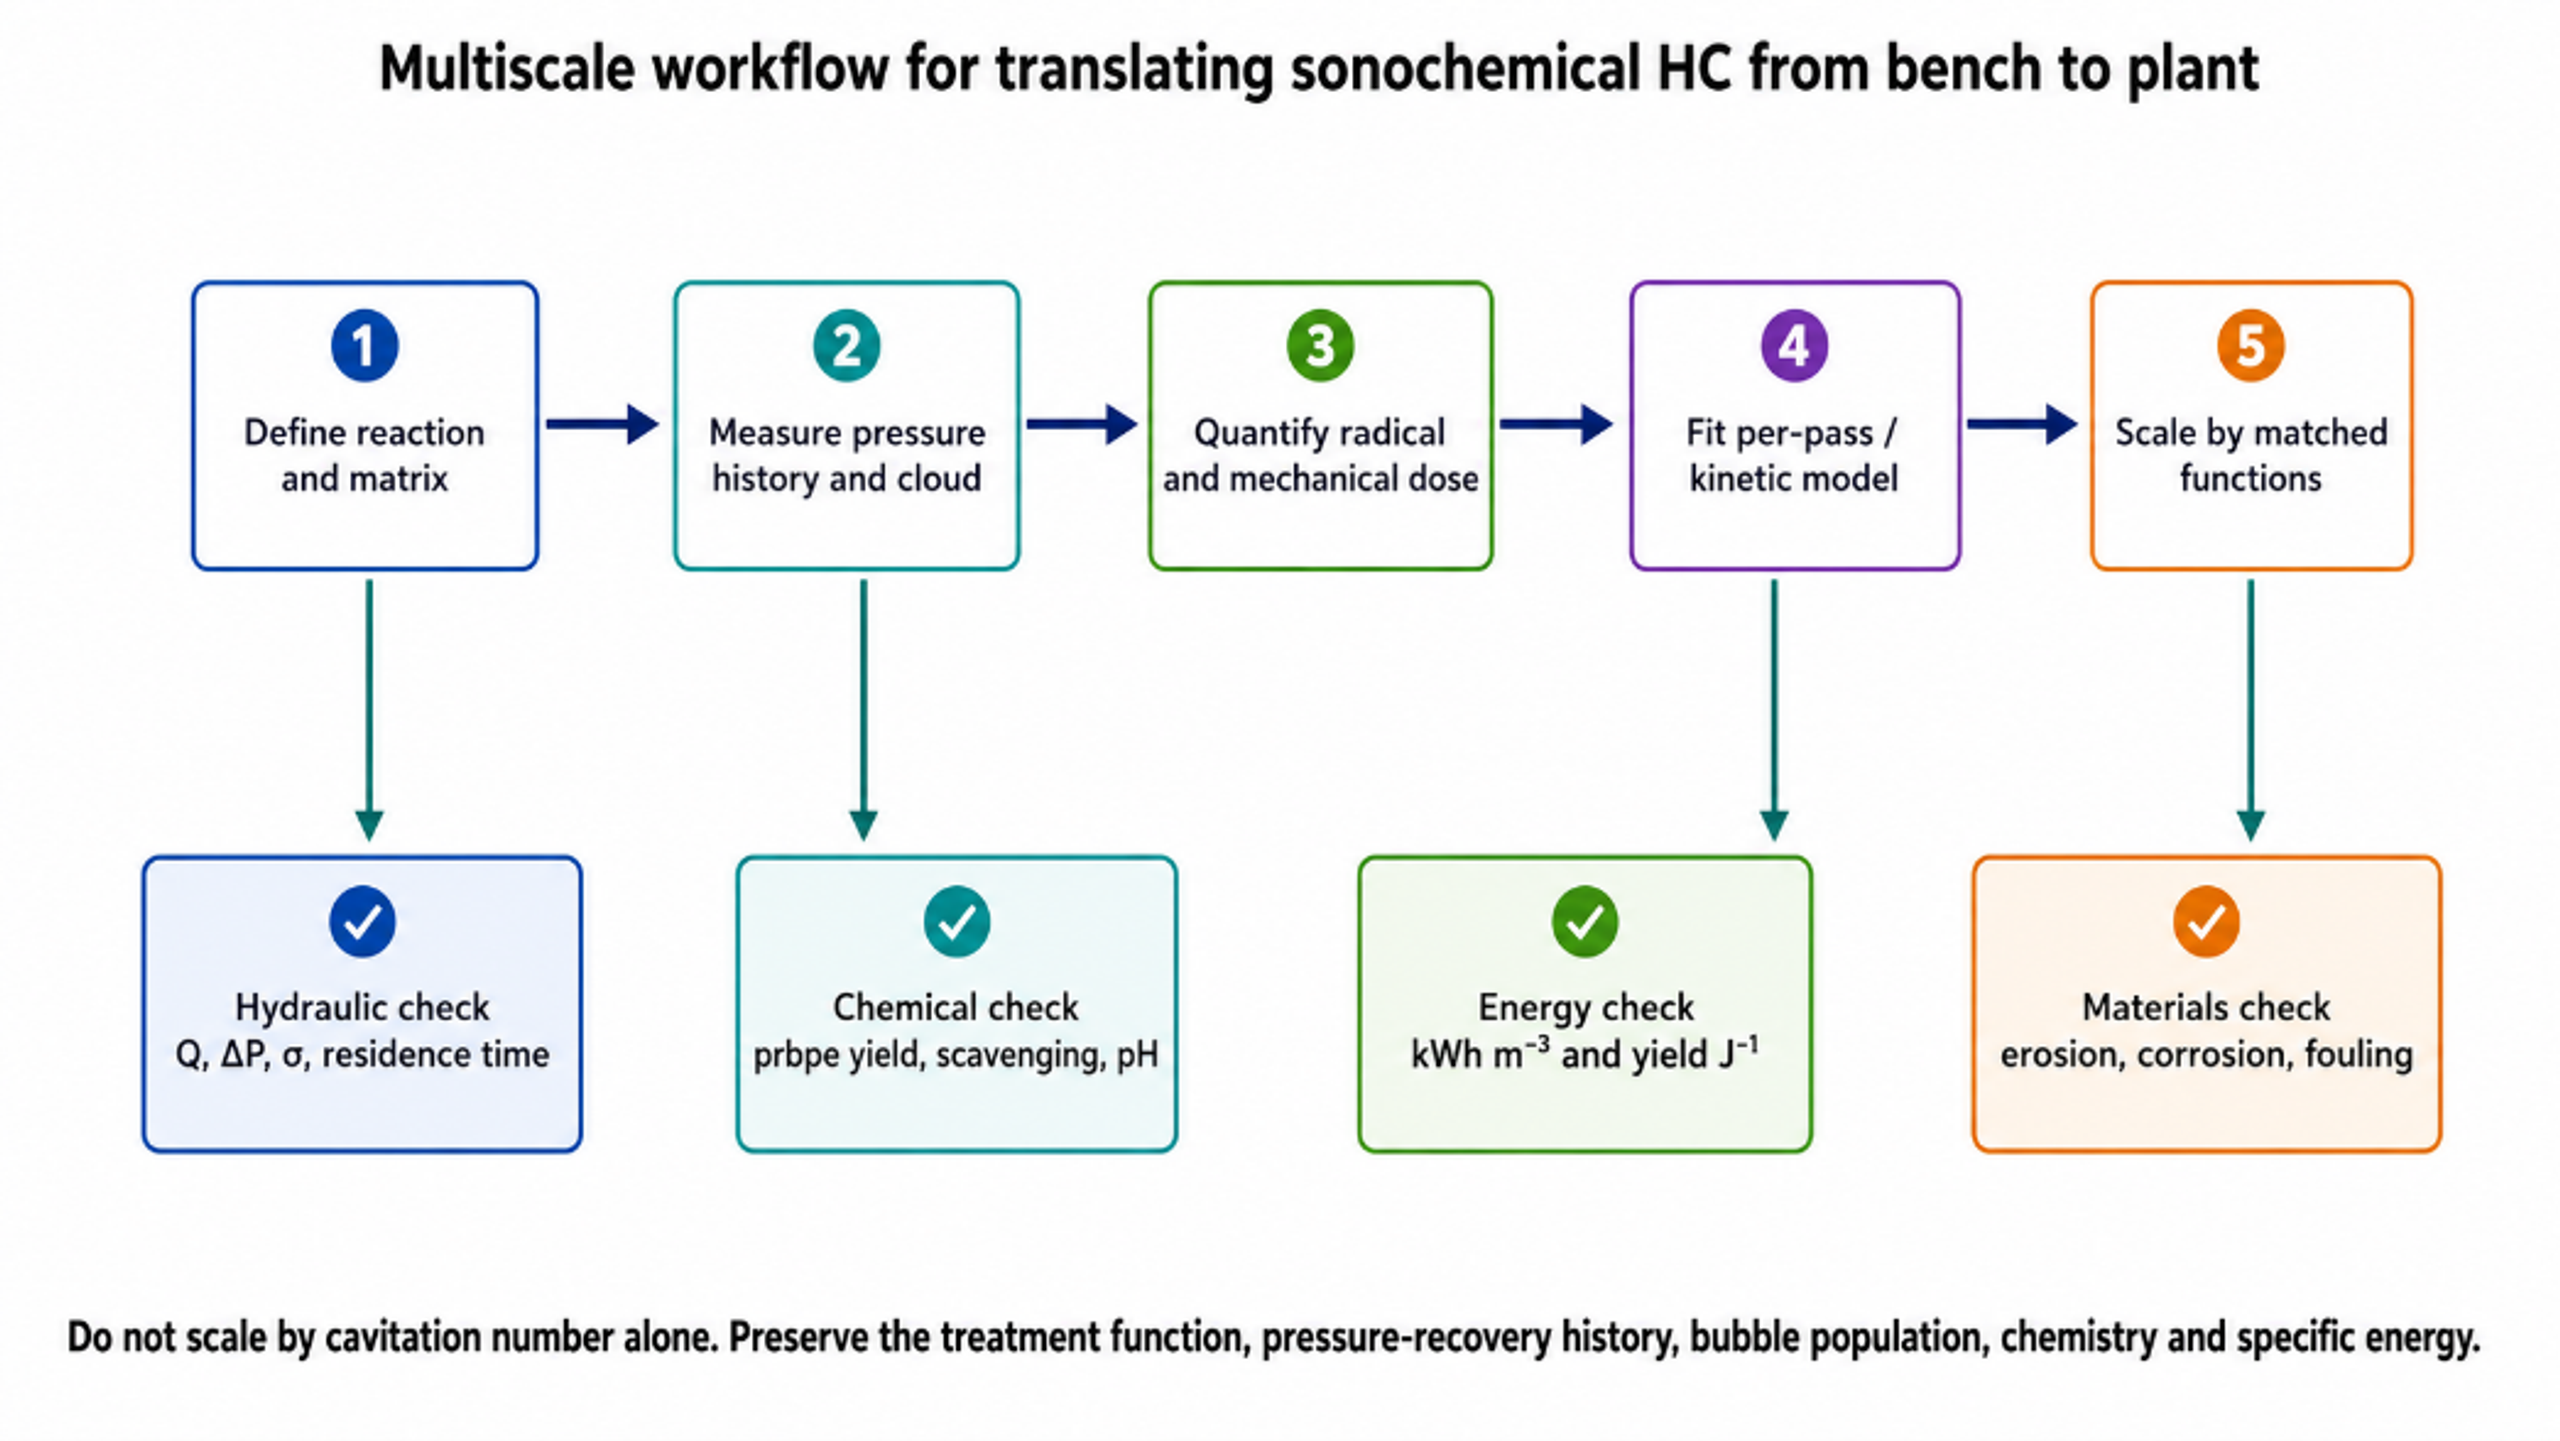
Figure 11.4. Multiscale workflow for translating sonochemical hydrodynamic cavitation from bench to plant [81].
Table 11.1. Scale up variables that should be preserved or explicitly reoptimized
| Category | Variable | Why it matters | Scale up approach |
|---|---|---|---|
| Hydraulic | Pressure ratio and recovery profile | Sets bubble growth and collapse history | Use pressure taps and validated CFD, not pump discharge pressure alone |
| Hydraulic | Velocity and Reynolds number | Controls turbulence, separation, and nuclei transport | Maintain relevant range or characterize deviation |
| Bubble population | Nuclei concentration and dissolved gas | Sets active bubble number and cushioning | Condition gas and characterize feed |
| Thermodynamic | Temperature and vapor pressure | Controls vapor loading and physical properties | Use heat removal and matched temperature history |
| Chemical | Probe or target concentration | Changes scavenging, partition, and oxidant demand | Scale at matched composition and conversion target |
| Exposure | Pass number or residence time distribution | Determines cumulative treatment | Use tracer tests and per pass sampling |
| Energy | Hydraulic and electrical specific energy | Determines economics and comparison | Report both device and whole system boundaries |
| Materials | Wall stress and erosion rate | Can contaminate product and limit life | Coupons, inspection, replaceable liners |
| Control | Backpressure and gas holdup | Moves cloud and changes collapse location | Closed loop pressure and gas control |
| Downstream | Hold time, separation, and quench | Long lived chemistry may continue after device | Preserve reaction and separation sequence |
Table 11.2. Minimum measurement package for pilot and industrial evaluation
| Measurement | Preferred location | Purpose | Common error if omitted |
|---|---|---|---|
| Static pressure | Immediately upstream, throat where possible, and downstream | Define pressure history and Δp | Using pump rating as device pressure |
| Flow rate | Calibrated line section | Hydraulic power and pass count | Ignoring gas or slurry effect on meter |
| Electrical power | Motor drive or power analyzer | Plant relevant energy | Using nameplate power |
| Temperature | Feed, device outlet, tank | Vapor pressure and thermal control | Attributing thermal reaction to cavitation |
| Dissolved gas/oxygen | Feed and return | Reproducibility and gas chemistry | Uncontrolled air entrainment |
| Chemical dosimeter | Feed and immediate outlet | Per pass radical activity | Only measuring after long tank residence |
| Target and products | Time series and outlet | Conversion, selectivity, mineralization | Using color or parent loss alone |
| Cavitation structure | Optical window or acoustic sensor | Identify regime and collapse location | Assuming more noise means more chemistry |
| Erosion and metals | Coupons, filters, product | Materials integrity and contamination | Ignoring wear derived catalytic effects |
| Residence time distribution | Tracer test across loop or reactor | Scale up and kinetic interpretation | Treating total tank volume as active reactor volume |
12 Practical Applications
Hydrodynamic cavitation is most valuable when sonochemical reactions and mechanical process intensification reinforce each other. Applications that require only a highly uniform radical field at low throughput may favor acoustic or photochemical reactors. Applications involving continuous flow, high solids, gas liquid transfer, emulsification, particle activation, or integration into an existing pipe loop often favor hydrodynamic devices. The application map in Figure 12.1 positions representative uses by their relative dependence on chemical and mechanical mechanisms.
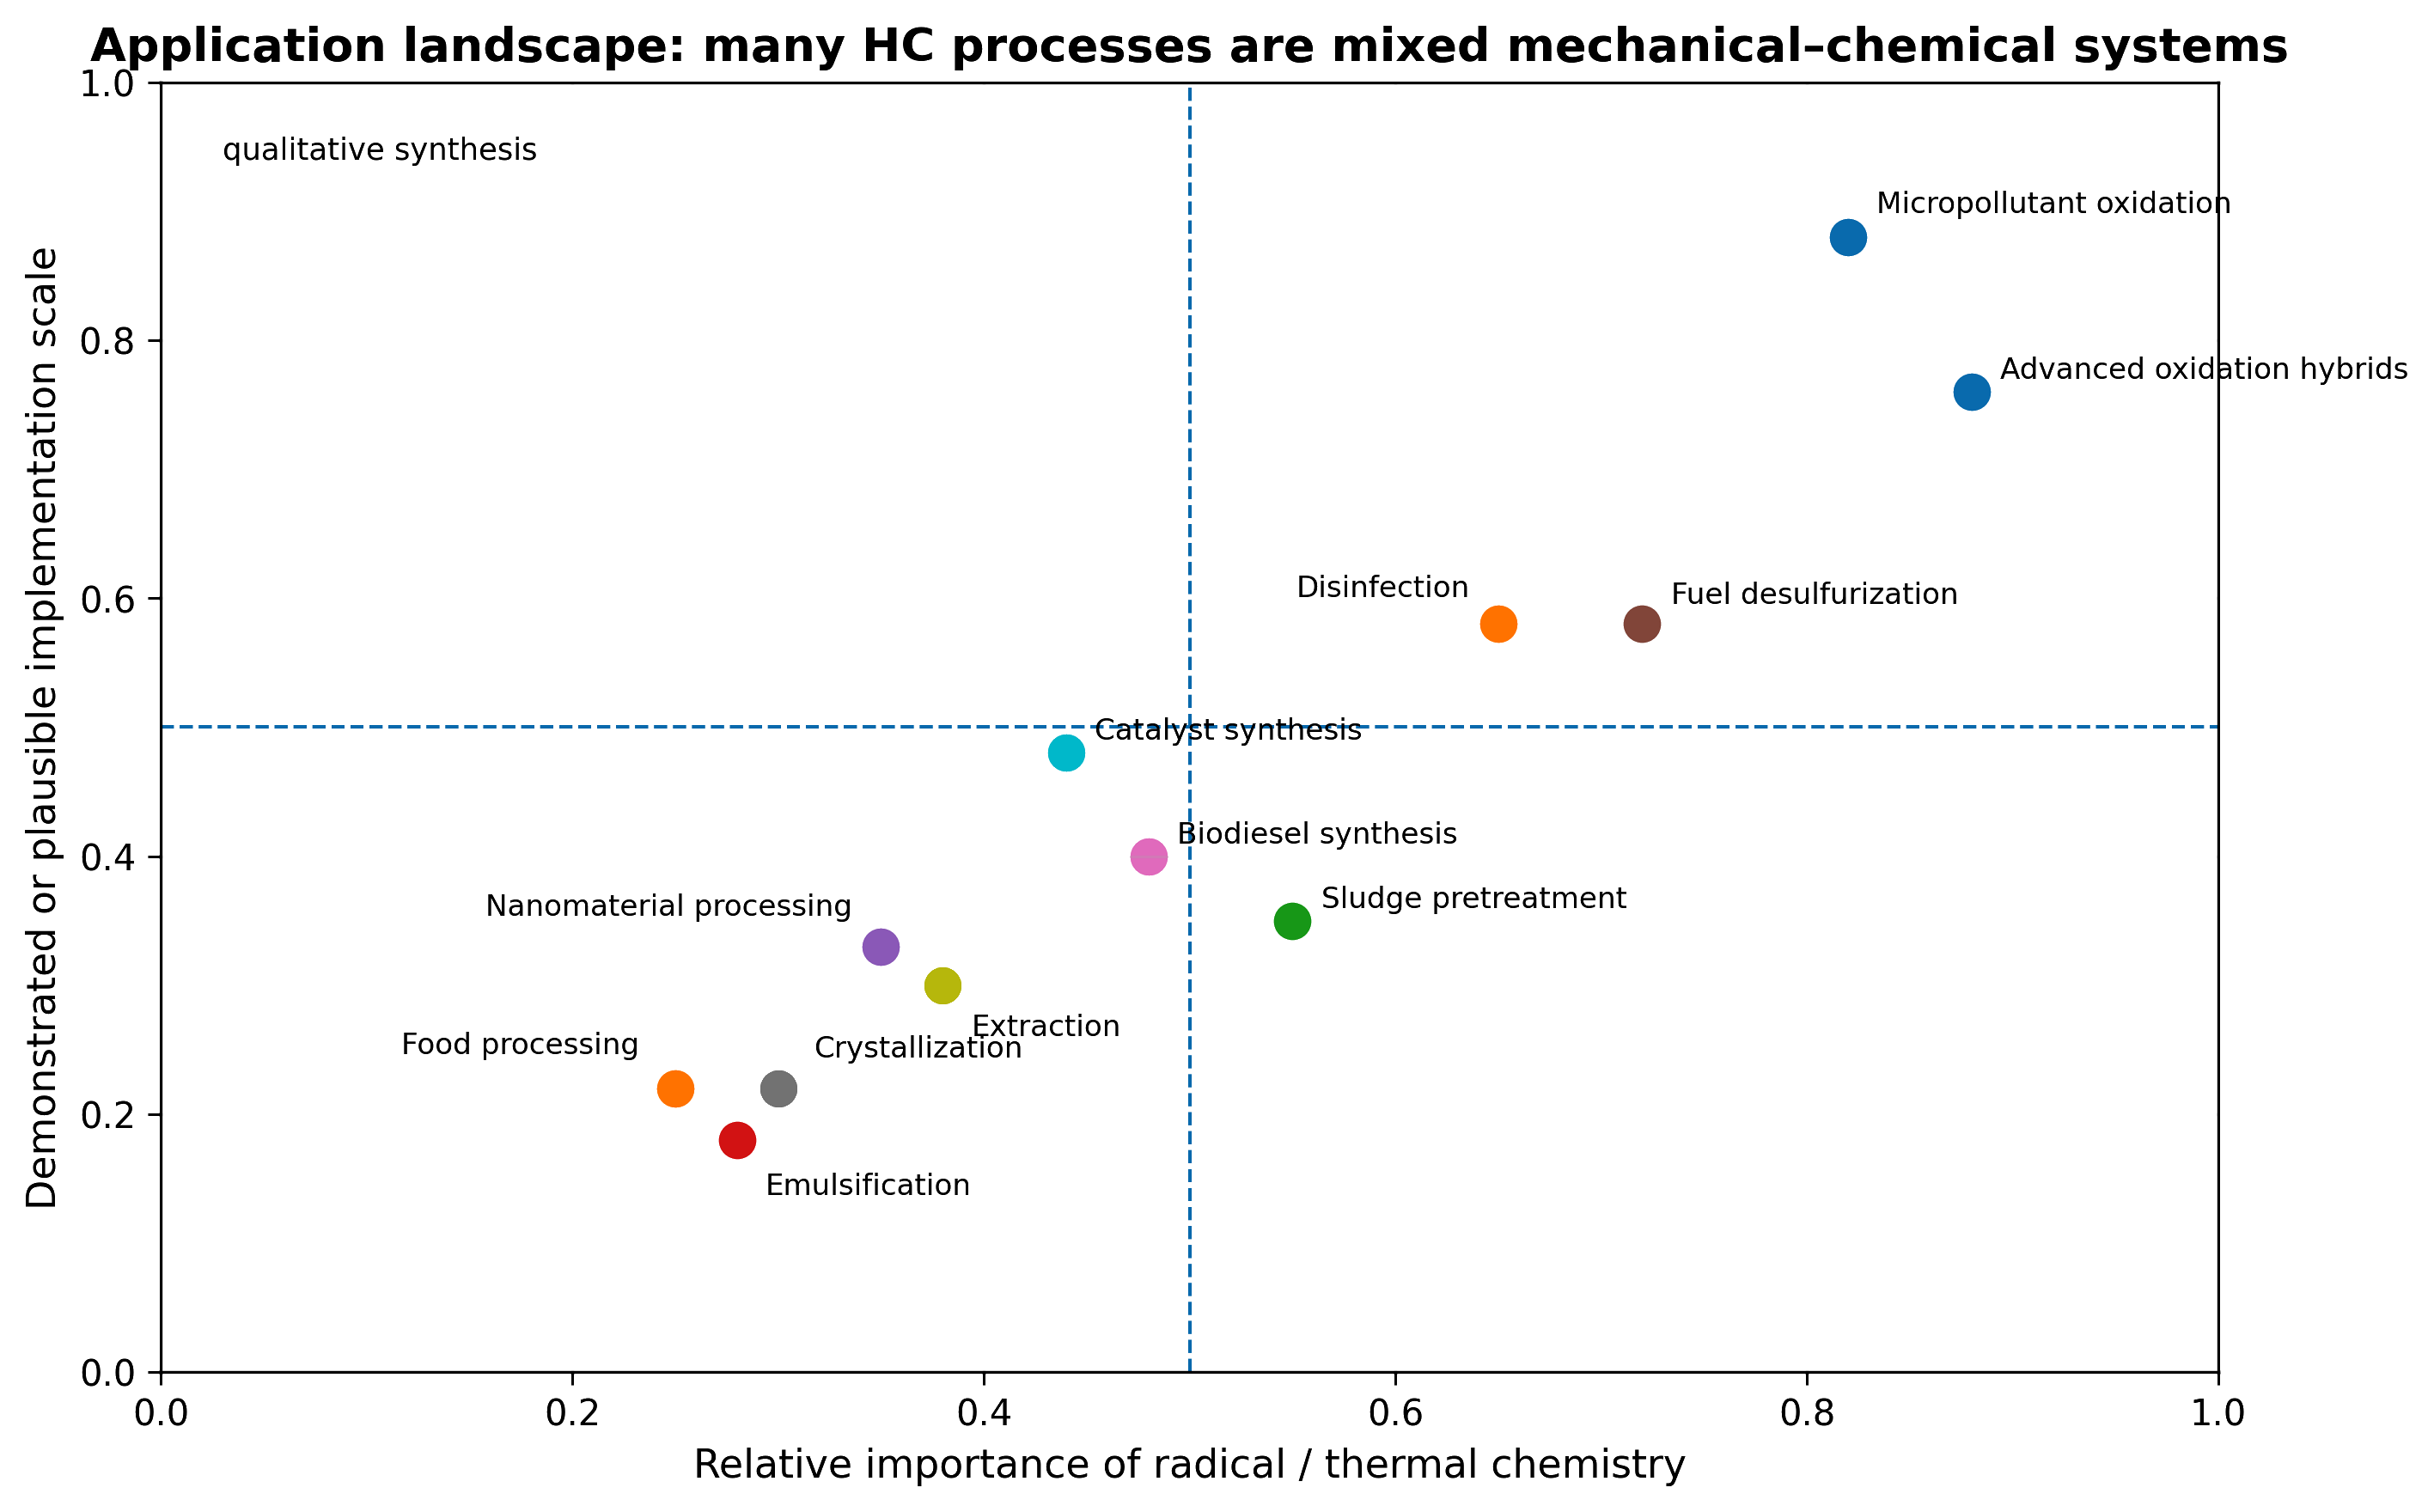
Figure 12.1. Application map for hydrodynamic cavitation. Position reflects the relative importance of radical/thermal chemistry and mechanical transport or disruption [81].
12.1 Water and wastewater treatment
For dissolved organic pollutants, direct hydrodynamic cavitation commonly provides partial conversion rather than complete mineralization. Performance improves when the target is interfacially enriched, the water matrix has low scavenging demand, or cavitation is combined with peroxide, ozone, Fenton chemistry, persulfate, aeration, photocatalysis, or electrochemistry [42,53-60]. p Nitrophenol, azo dyes, Rhodamine B, dichloroaniline, pharmaceuticals, surfactants, and many other compounds have been used as model or real targets. The design endpoint should include total organic carbon, chemical oxygen demand, toxicity, or biodegradability in addition to parent compound removal.
In real wastewater, bicarbonate, natural organic matter, chloride, suspended solids, and surfactants compete for radicals. Hydrodynamic cavitation can still be useful as pretreatment that breaks aggregates, improves biodegradability, or reduces the dose required in a downstream biological or oxidation step. The most economical configuration is often a short, high intensity cavitation stage followed by a lower energy residence or polishing process rather than attempting complete treatment in the cavitation device alone.
12.2 Disinfection and biological processing
Microorganism inactivation results from combined membrane stress, microjets, shear, shock waves, local pressure, and oxidative chemistry. Cell type, growth state, aggregation, and water matrix strongly affect sensitivity. Vortex based hydrodynamic cavitation has been demonstrated for pathogen reduction [61]. For sludge, biomass, and fermentation feedstocks, cell disruption or structural opening can improve solubilization and enzymatic accessibility [21-23,48-49,62]. Excessive treatment can release refractory material, inhibit enzymes, or consume more energy than the recovered product value.
12.3 Inorganic synthesis, crystallization, and catalysts
Cavitation can accelerate hydrolysis and precipitation, generate reducing radicals, produce unusual amorphous or nanostructured phases, and maintain dispersion during nucleation [19,45,63]. Controlled flow cavitation crystallization uses pressure cycling, micromixing, and mechanical stimulation to reduce induction time or control crystal size [43-44]. In catalyst fabrication, the same effects can increase precursor mixing, create defects, expose fresh surfaces, and reduce agglomeration. Product qualification must include phase composition, particle size distribution, surface area, impurity metals from erosion, and batch to batch reproducibility.
12.4 Organic synthesis, fuels, and multiphase reactions
Biodiesel and interesterification processes benefit primarily from intense dispersion between liquid phases and mass transfer, with possible contribution from local chemistry [46,64]. Deep desulfurization combines phase dispersion within situ oxidation of sulfur compounds [47]. Controlled flow cavitation has also been applied in commercial dry mill corn ethanol processing, where particle and cell structure changes improved conversion and ethanol yield [21-23]. In all such systems, downstream separation is part of reactor design. A stable emulsion can be beneficial during reaction but detrimental during decanting, centrifugation, or washing.
12.5 Food, beverage, and bioprocessing
Food and beverage applications exploit microbial reduction, extraction, emulsification, accelerated heating, particle reduction, and biochemical accessibility. Real scale beer brewing by controlled hydrodynamic cavitation demonstrates that industrial value can arise from the integrated thermal, mechanical, and chemical process rather than from radicals alone [65]. Oxidation sensitive foods require oxygen control because cavitation can initiate lipid oxidation or degrade flavors and vitamins. Sanitary design, clean in place compatibility, and low metal release are essential.
Table 12.1. Application matrix for hydrodynamic sonochemistry
| Application | Main cavitation mechanism | Useful performance metric | Critical constraint |
|---|---|---|---|
| Micropollutant oxidation | •OH and secondary oxidants | EEO, mineralization, toxicity | Water matrix scavenging |
| Hybrid ozone/peroxide/Fenton | Oxidant activation plus gas liquid transfer | Oxidant utilization and synergy | Residual reagent and pH control |
| Disinfection | Membrane disruption plus oxidative damage | Log reduction per kWh m⁻³ | Shielding by solids and regrowth |
| Sludge pretreatment | Cell disruption and solubilization | Soluble COD increase and net methane gain | Energy recovery and downstream inhibition |
| Nanoparticle synthesis | Hot spot chemistry and rapid quench | Yield, phase, size distribution | Contamination and scale up |
| Crystallization | Nucleation, attrition, and micromixing | Induction time, crystal size distribution | Over fragmentation and fouling |
| Emulsification | Microjets, shear, and interfacial renewal | Droplet size per energy | Recoalescence and separation |
| Biodiesel and liquid-liquid reaction | Mass transfer with possible local chemistry | Conversion and energy per mass product | Soap formation and phase recovery |
| Desulfurization | Oxidation plus phase dispersion | Sulfur removal and oxidant use | Solvent, phase ratio, extraction step |
| Biomass and ethanol | Particle disruption and accessibility | Product yield and net energy return | Feed variability and wear |
| Food and beverage | Mixing, extraction, microbial control | Quality adjusted throughput | Oxidation, sanitation, regulatory acceptance |
13 Materials, Safety, and Product Quality
The same collapse events that generate useful chemistry can damage equipment. Erosion is concentrated where bubbles collapse near a wall, particularly in abrupt recovery regions, downstream jet impingement zones, and narrow rotor stator gaps. Erosion changes geometry, pressure drop, and chemical performance over time. Released metal can contaminate product and may catalyze peroxide chemistry, creating an apparent increase in radical yield that is actually a wear artifact. Replaceable inserts, hard coatings, geometry that moves collapse away from walls, and routine metal analysis should be considered part of the chemical reactor design [1-2,36,52].
Organic liquid service adds flammability, vapor, static electricity, and peroxide hazards. The microscopic hot spot does not raise the entire liquid to ignition temperature, but cavitation can generate off gas, aerosols, and reactive intermediates. Systems handling fuels, solvents, hydrogen, oxygen enrichment, ozone, or concentrated peroxide require inerting or controlled gas composition, bonding and grounding, ventilation, compatible seals, pressure relief, and hazardous area electrical classification. Materials must be compatible with both the parent liquid and cavitation generated oxidants.
Table 13.1. Principal hazards and engineering controls
| Hazard | Mechanism | Potential consequence | Control strategy |
|---|---|---|---|
| Cavitation erosion | Microjets and shock loading at walls | Leak, geometry drift, metal contamination | Move collapse off wall, use replaceable liners, inspect and monitor metals |
| Overpressure | Blocked outlet, gas expansion, thermal rise | Rupture or seal failure | Relief valve, interlocks, rated piping, pressure transmitters |
| Flammable vapor | Organic vapor and off gas release | Fire or explosion | Closed system, inerting, ventilation, gas detection, classified equipment |
| Oxidizer exposure | Ozone, peroxide, persulfate, oxygen enrichment | Fire acceleration, burns, seal degradation | Compatible materials, staged dosing, residual monitoring |
| Noise and vibration | Bubble collapse and rotating equipment | Worker exposure and fatigue failure | Enclosure, isolation, acoustic survey, balancing |
| Aerosol generation | Gas disengagement and turbulent tank return | Exposure or product loss | Demister, closed vent, condenser, negative pressure |
| Biological aerosol | Treatment of pathogen containing liquids | Operator exposure | Closed loop, disinfection, filtered vent, PPE |
| Hot surfaces and bulk heating | Pump inefficiency and recirculation | Thermal degradation or burn | Heat exchanger, temperature interlock, insulation |
| Nanomaterial release | Particle synthesis or catalyst processing | Inhalation and environmental exposure | Closed handling, filtration, containment, waste plan |
| Unexpected byproducts | Radical and halogen chemistry | Toxicity or product quality failure | Transformation product analysis, quench, process limits |
14 Experimental Evidence and Design Validation
A rigorous analysis of hydrodynamic sonochemistry must distinguish a plausible mechanism from experimentally demonstrated chemistry. Bubble dynamics calculations can predict collapse intensity, but they do not by themselves establish the number of active bubbles, the survival of radicals, or the conversion achieved in the liquid. Conversely, target compound disappearance can be caused by adsorption, volatilization, thermal history, mechanical breakup, or analytical bias. The most credible studies combine hydraulic measurements, flow visualization, chemical dosimetry, product analysis, and a declared energy balance. The studies reviewed below illustrate this evidence hierarchy and provide quantitative design constraints for practical reactors.
14.1 Controlled flow apparatus and patent precedents
U.S. Patent 5,937,906 describes a continuous flow through method in which a local constriction produces a hydrodynamic cavitation cavern and a downstream pressure increase collapses the transported cavities [16]. The patent specifies a local liquid velocity of at least 16 m s⁻¹ and a downstream static pressure increase of at least 0.85 kg cm⁻², approximately 83 kPa. Its drawings include bluff body and baffle arrangements with transient passages, demonstrating that the invention is based on controlled pressure history rather than on a single nozzle shape. These values are design claims, not universal inception criteria; actual thresholds depend on vapor pressure, dissolved gas, nuclei population, viscosity, surface condition, and the absolute pressure level.
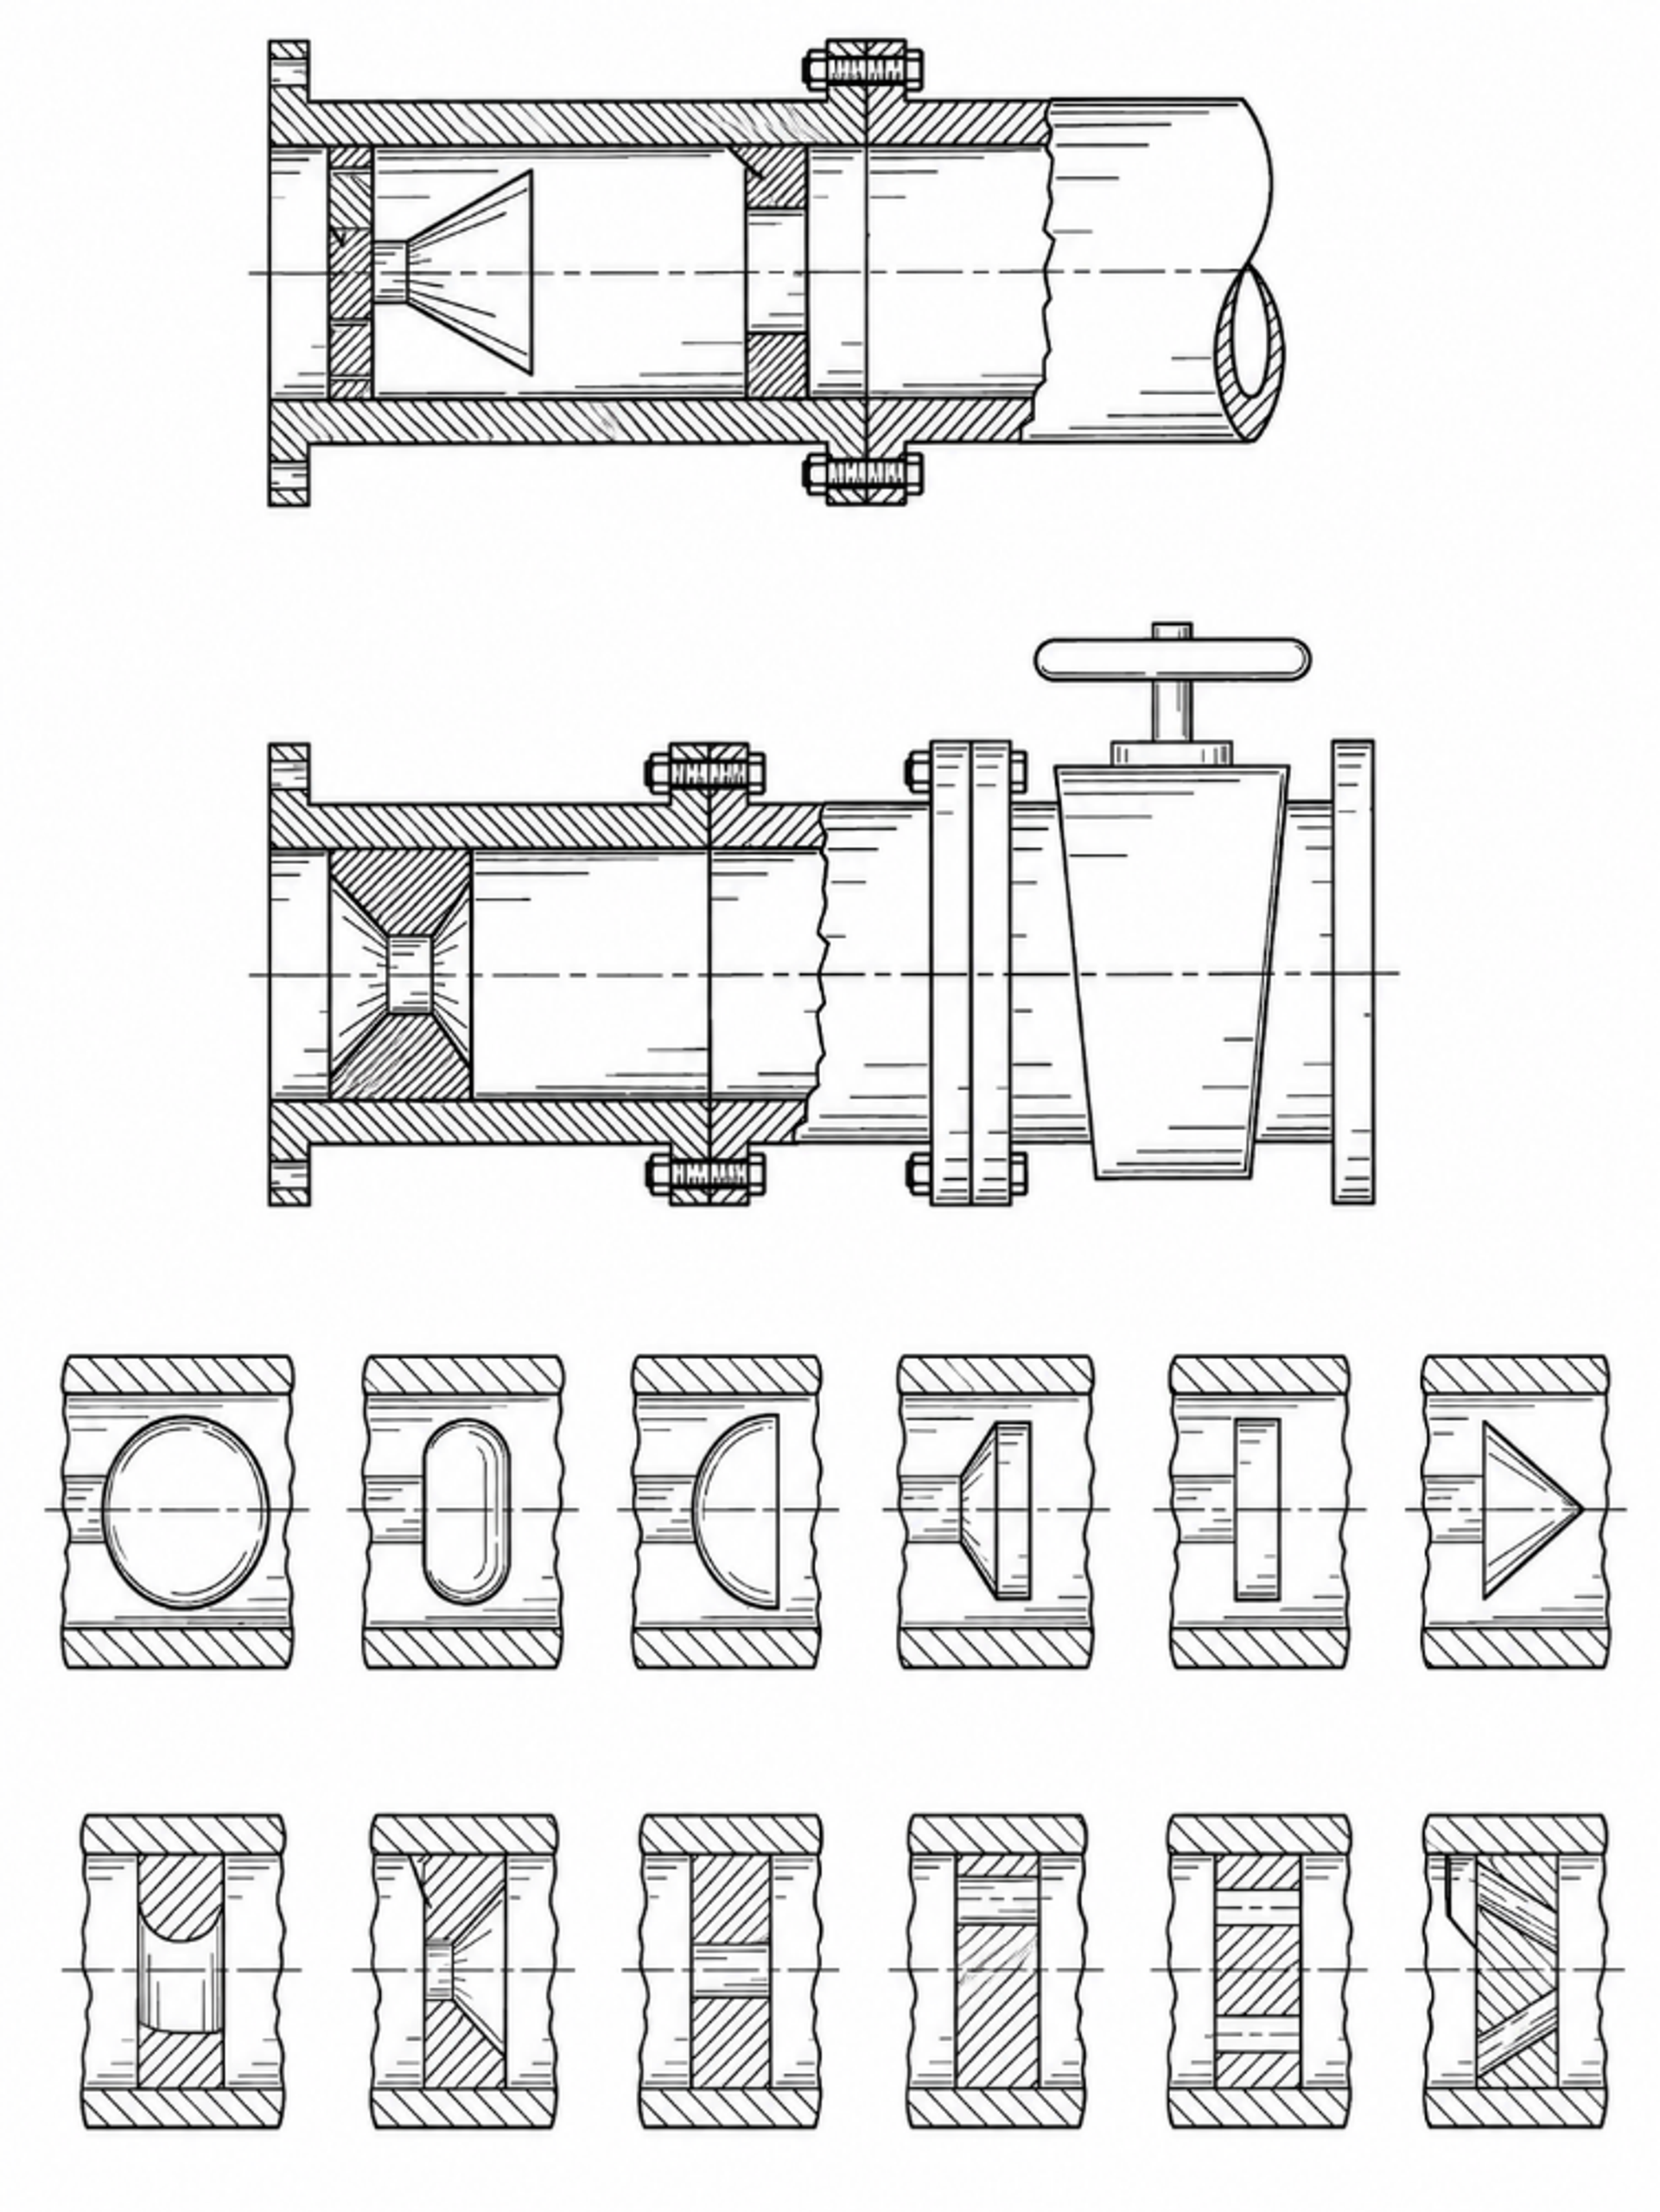
Figure 14.1. Controlled flow cavitation apparatus and alternative constriction elements. [16].
U.S. Patent 5,969,207 extends the controlled flow concept to liquid hydrocarbon mixtures [66]. The disclosure describes a baffle induced local restriction, an accelerated region, a cavitation field, and chemical transformations including decomposition, isomerization, cyclization, and synthesis. The patent also presents model estimates of very short collapse times and extreme internal states. Such estimates are useful for framing possible reaction pathways, but they should not be treated as direct thermometric measurements. Independent product analysis and controls without cavitation are required before assigning a hydrocarbon transformation to a hot spot mechanism.
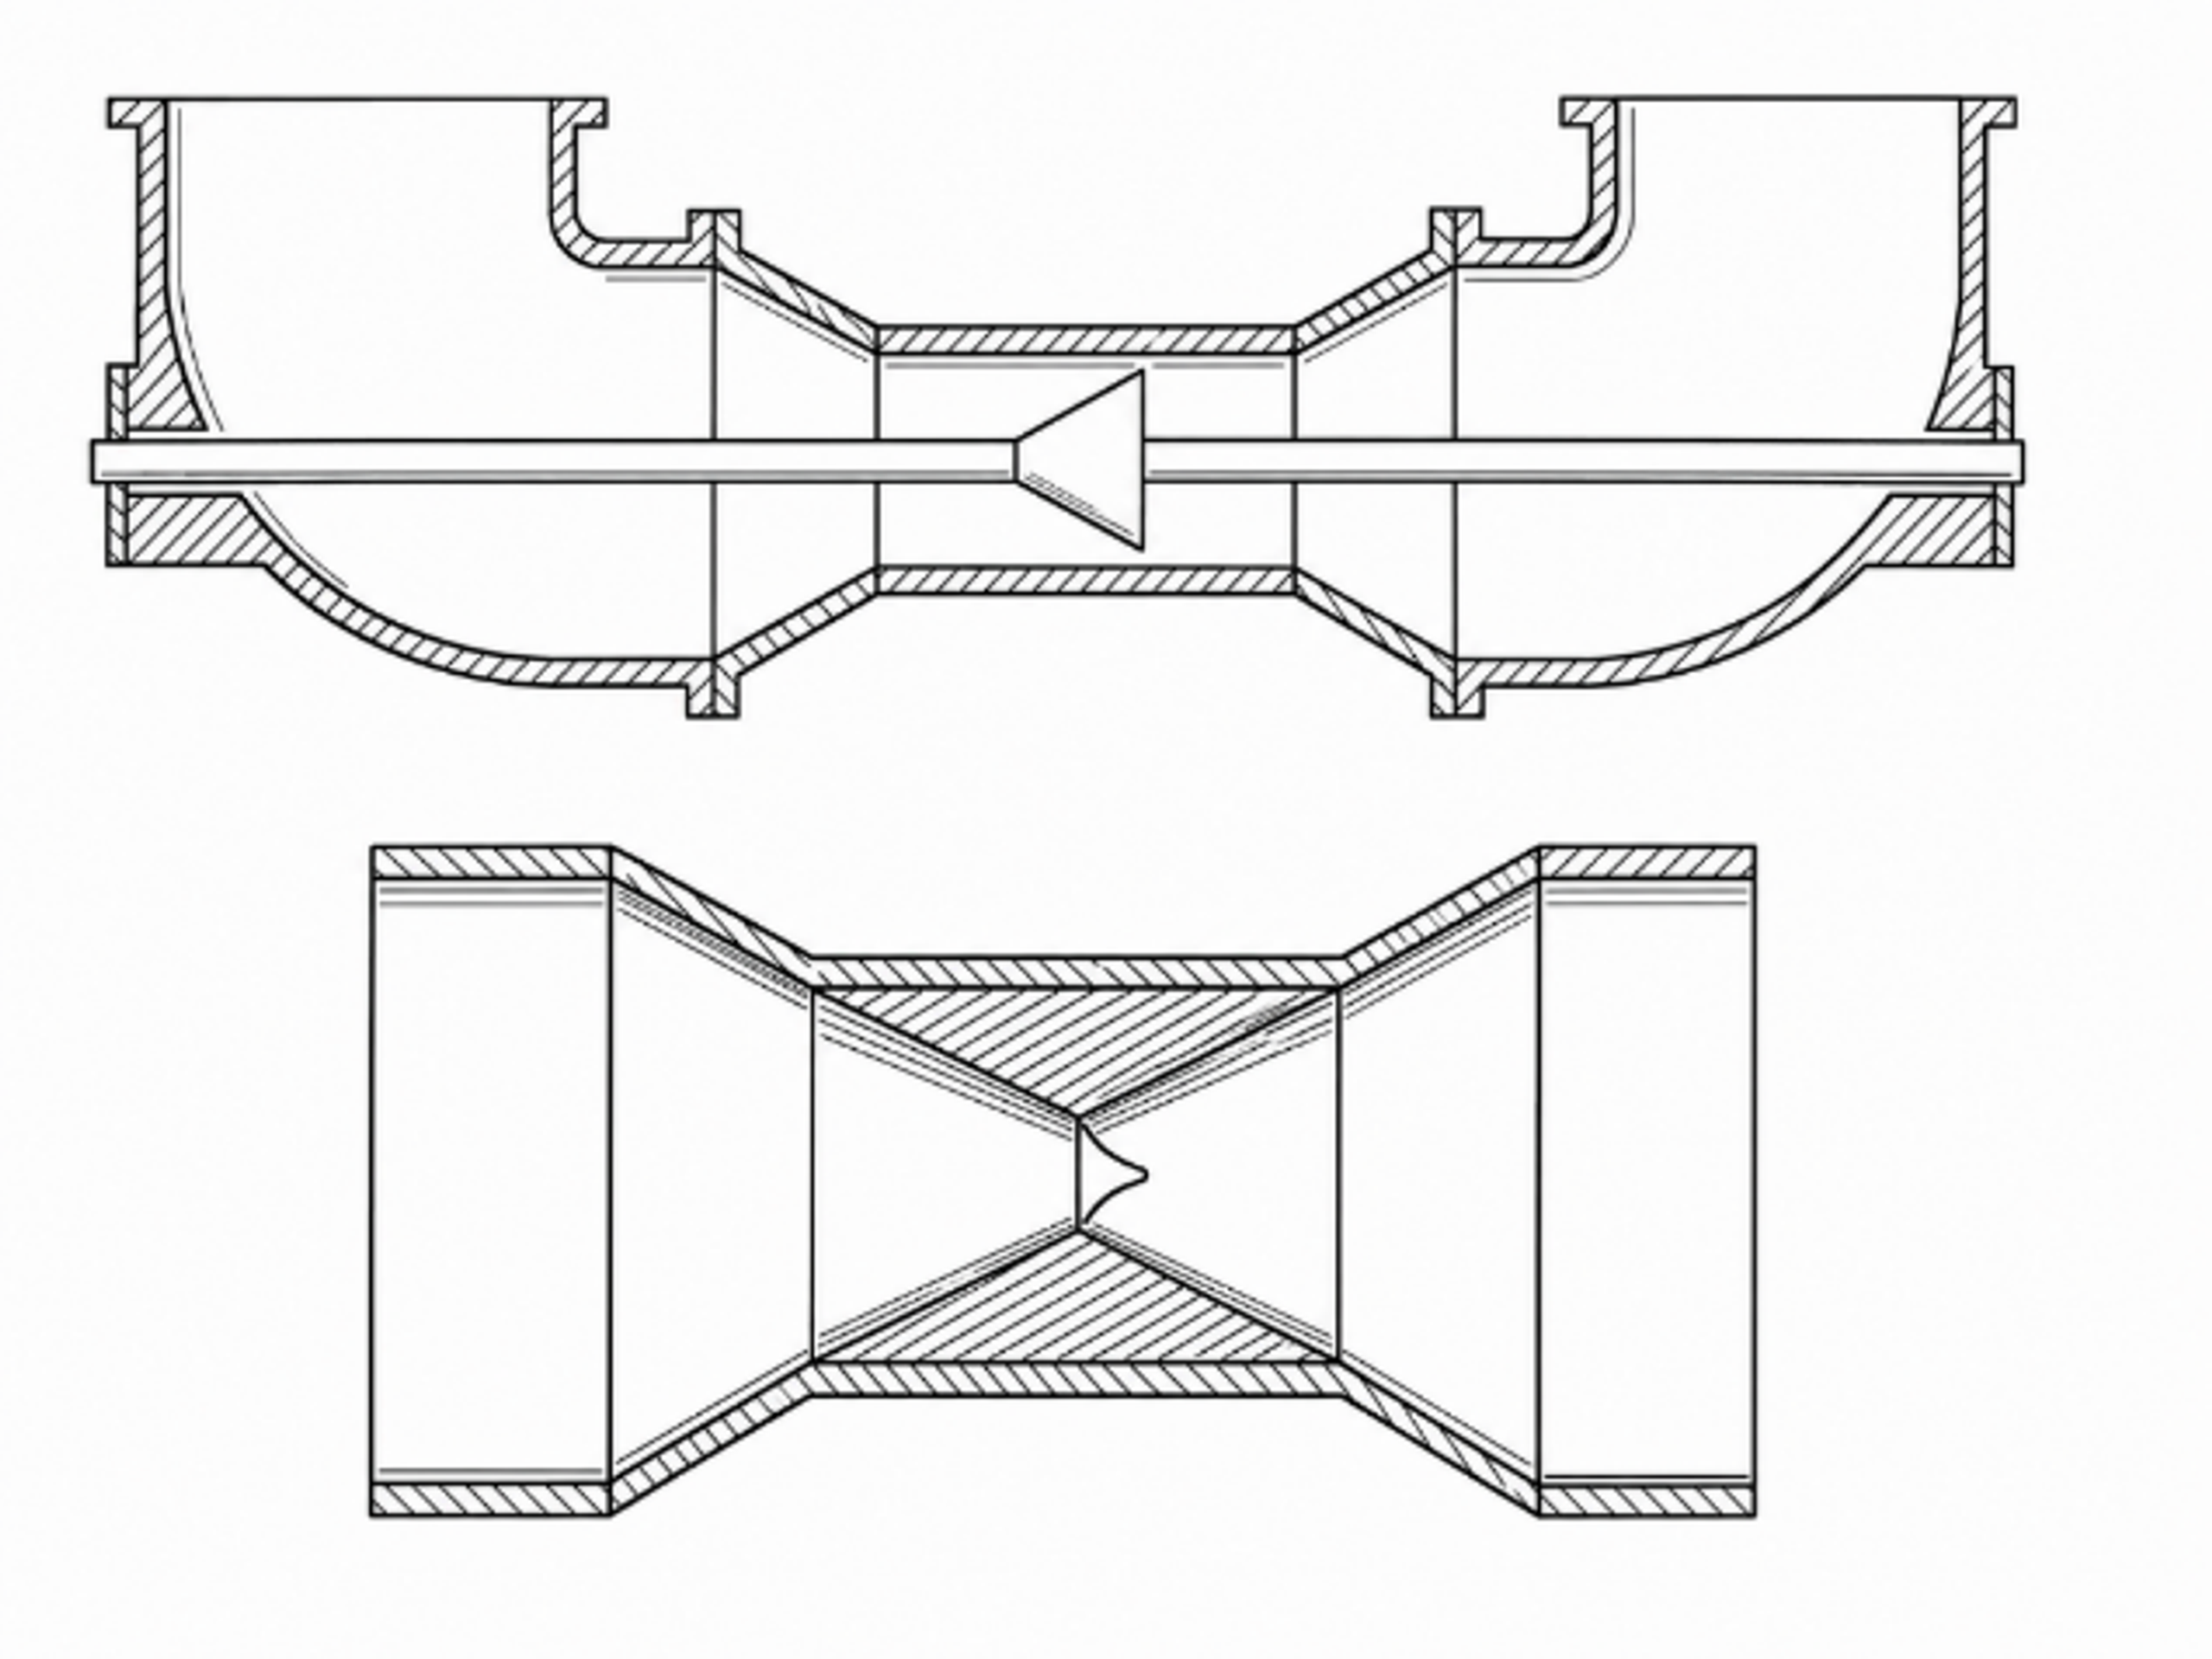
Figure 14.2. Hydrodynamic cavitation passage proposed for changing the composition of liquid hydrocarbon mixtures. [66].
14.2 Venturi and orifice geometry: multibubble effects control net yield
Pawar and coworkers compared three Venturi devices and one orifice using a four part methodology: single phase CFD, single bubble dynamics, high speed photography, and iodide oxidation [11]. This comparison is important because the single bubble calculations and the reactor scale chemistry did not rank the devices in the same order. The Venturi devices generated larger vapor clouds and, in some cases, stronger predicted individual bubble conditions. Nevertheless, the orifice produced the highest reported iodine liberation per unit dissipated energy.
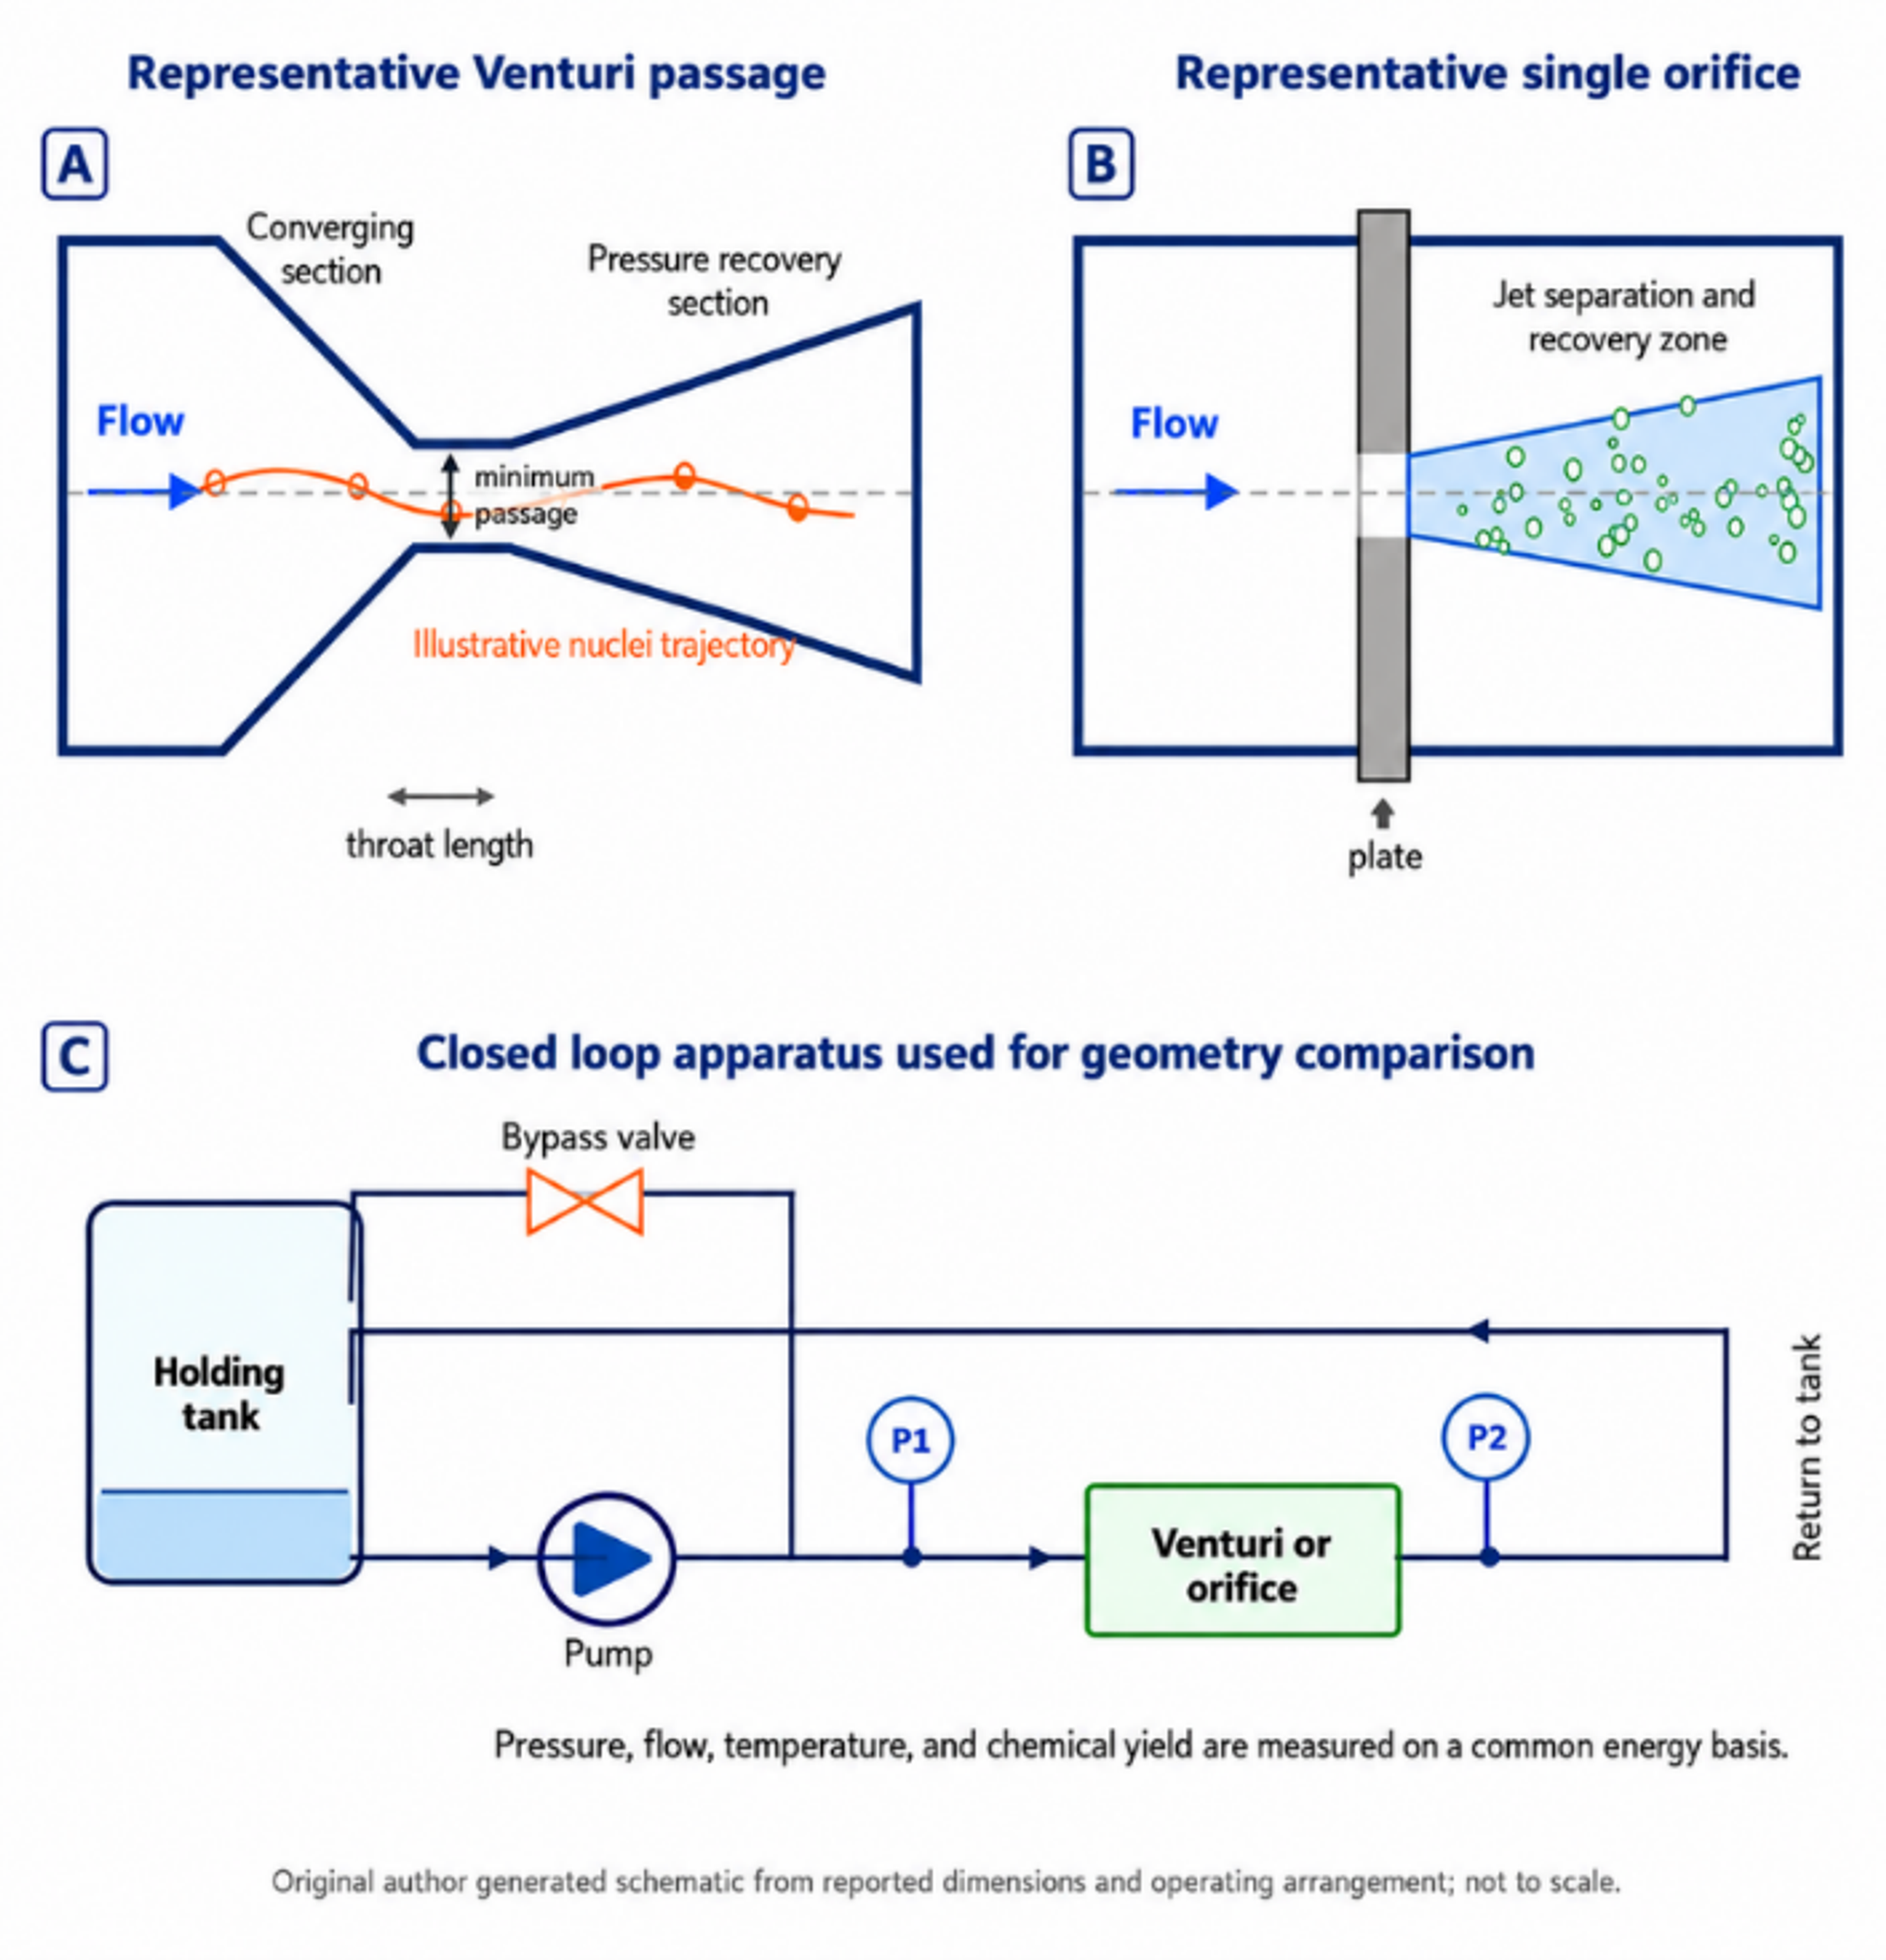
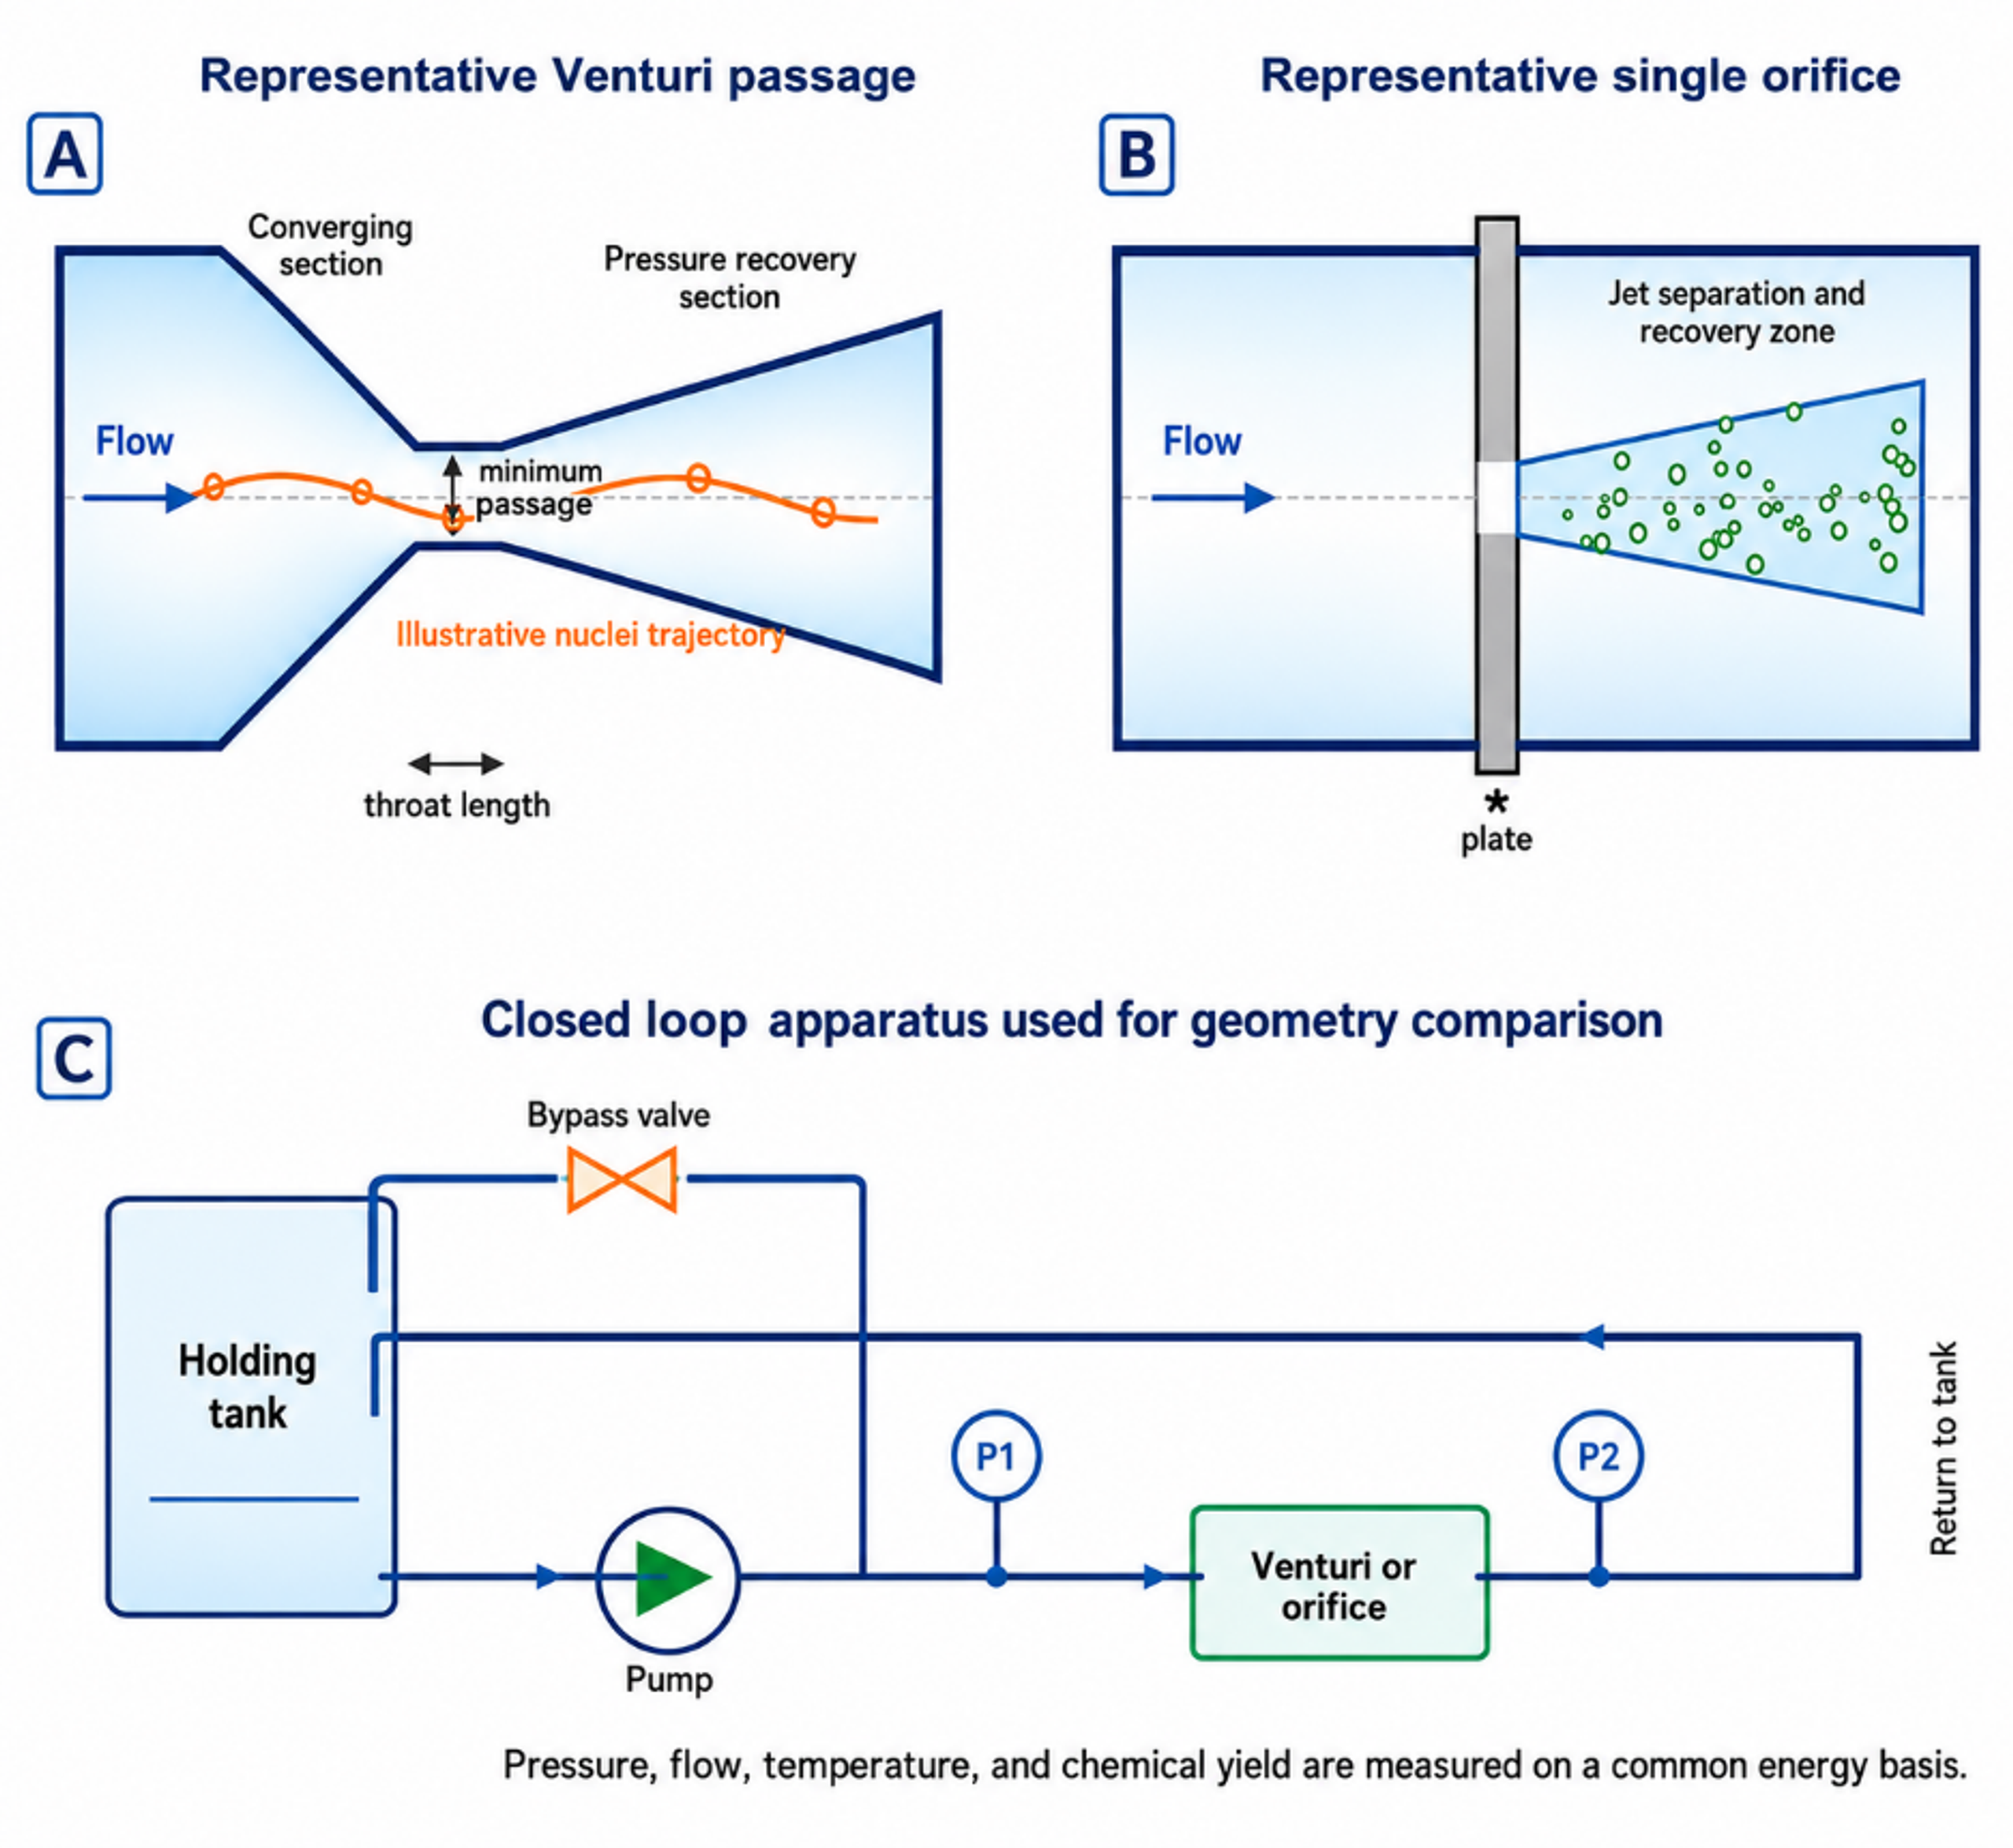
Figure 14.3. Original schematic of representative Venturi and single orifice passages and the closed loop geometry comparison apparatus. [11].
The reported average yields were 0.115, 0.106, 0.039, and 0.165 mg I₂ kJ⁻¹ for Venturi 1, Venturi 2, Venturi 3, and the orifice, respectively. The corresponding reported pump powers were 31.78, 36.31, 61.20, and 21.83 W. Figure 14.4 redraws these values on a common basis. The orifice result should not be generalized to every orifice. It demonstrates that the bubble population and collapse environment can outweigh nominal pressure or visible vapor volume.
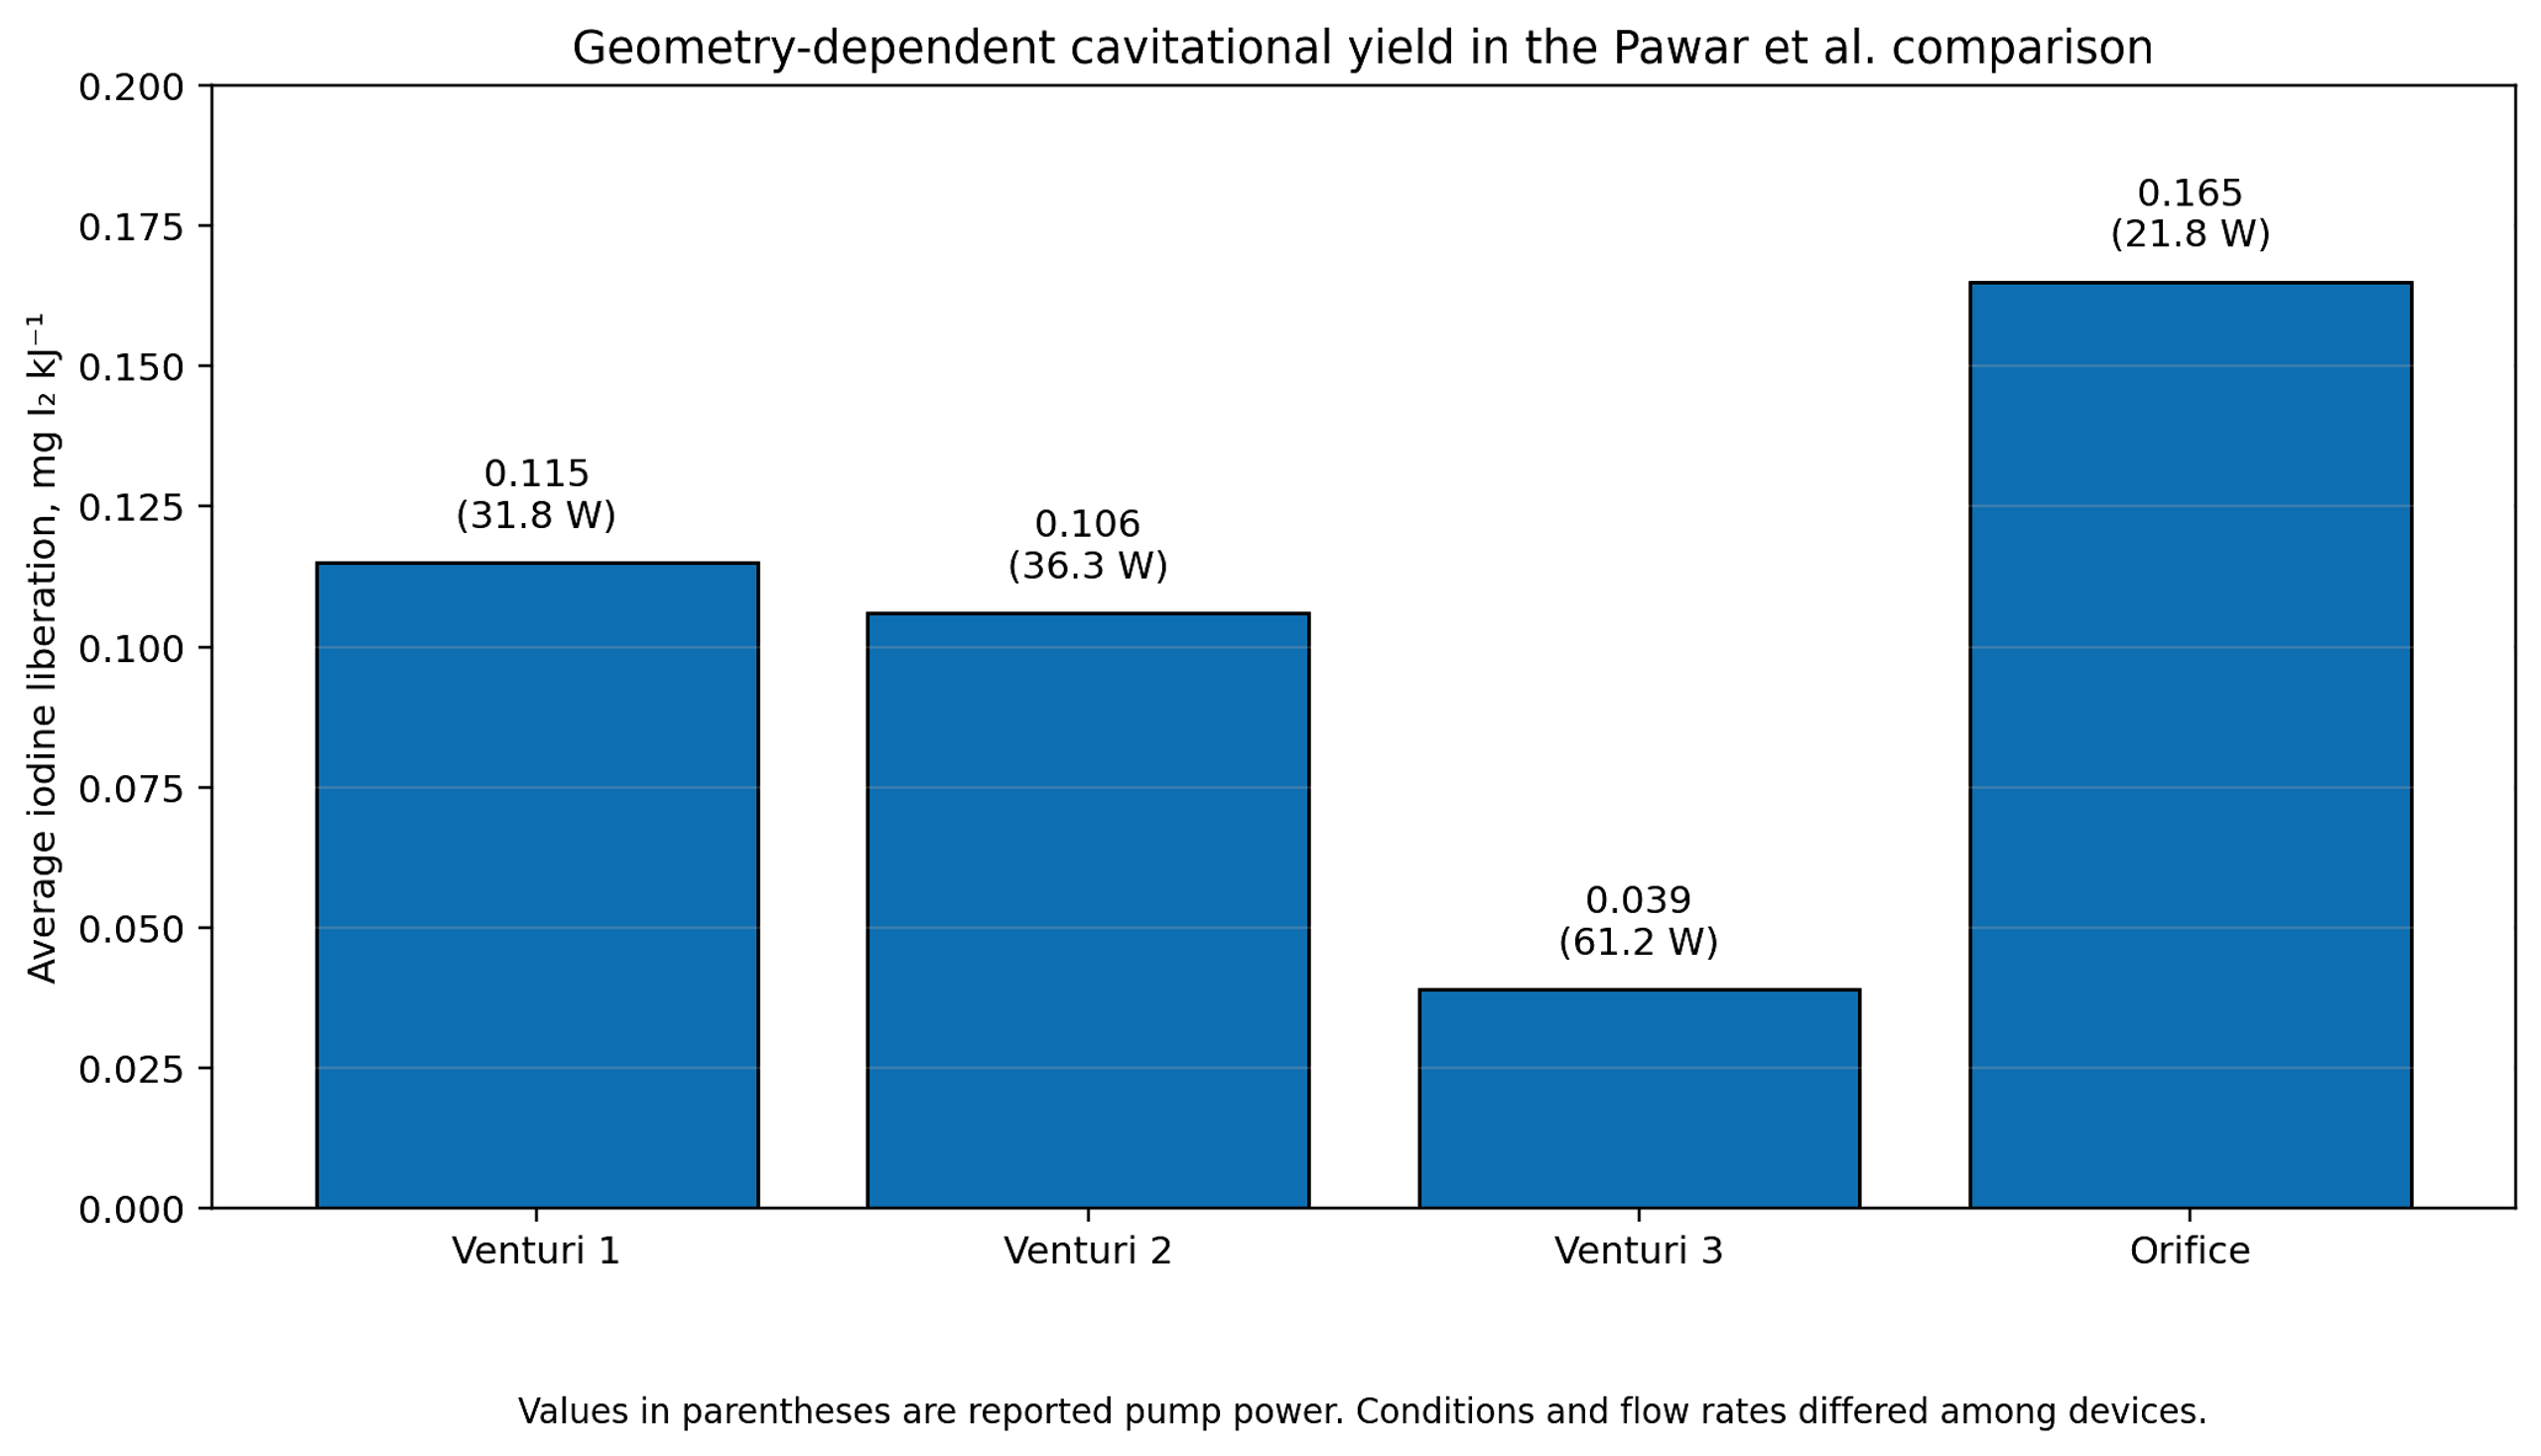
Figure 14.4. Average iodine liberation per unit energy for the four flow geometries evaluated by Pawar et al. [11].
The conceptual comparison in Figure 14.5 illustrates why chemical yield can decrease as a cavitation cloud becomes larger. Reported high speed observations show that dense clouds promote bubble interaction, coalescence, asymmetric collapse, shock shielding, and radical recombination. A smaller population of more isolated bubbles can therefore produce a higher net chemical yield even when total vapor volume is lower. For reactor design, void fraction and chemical yield must be optimized separately.
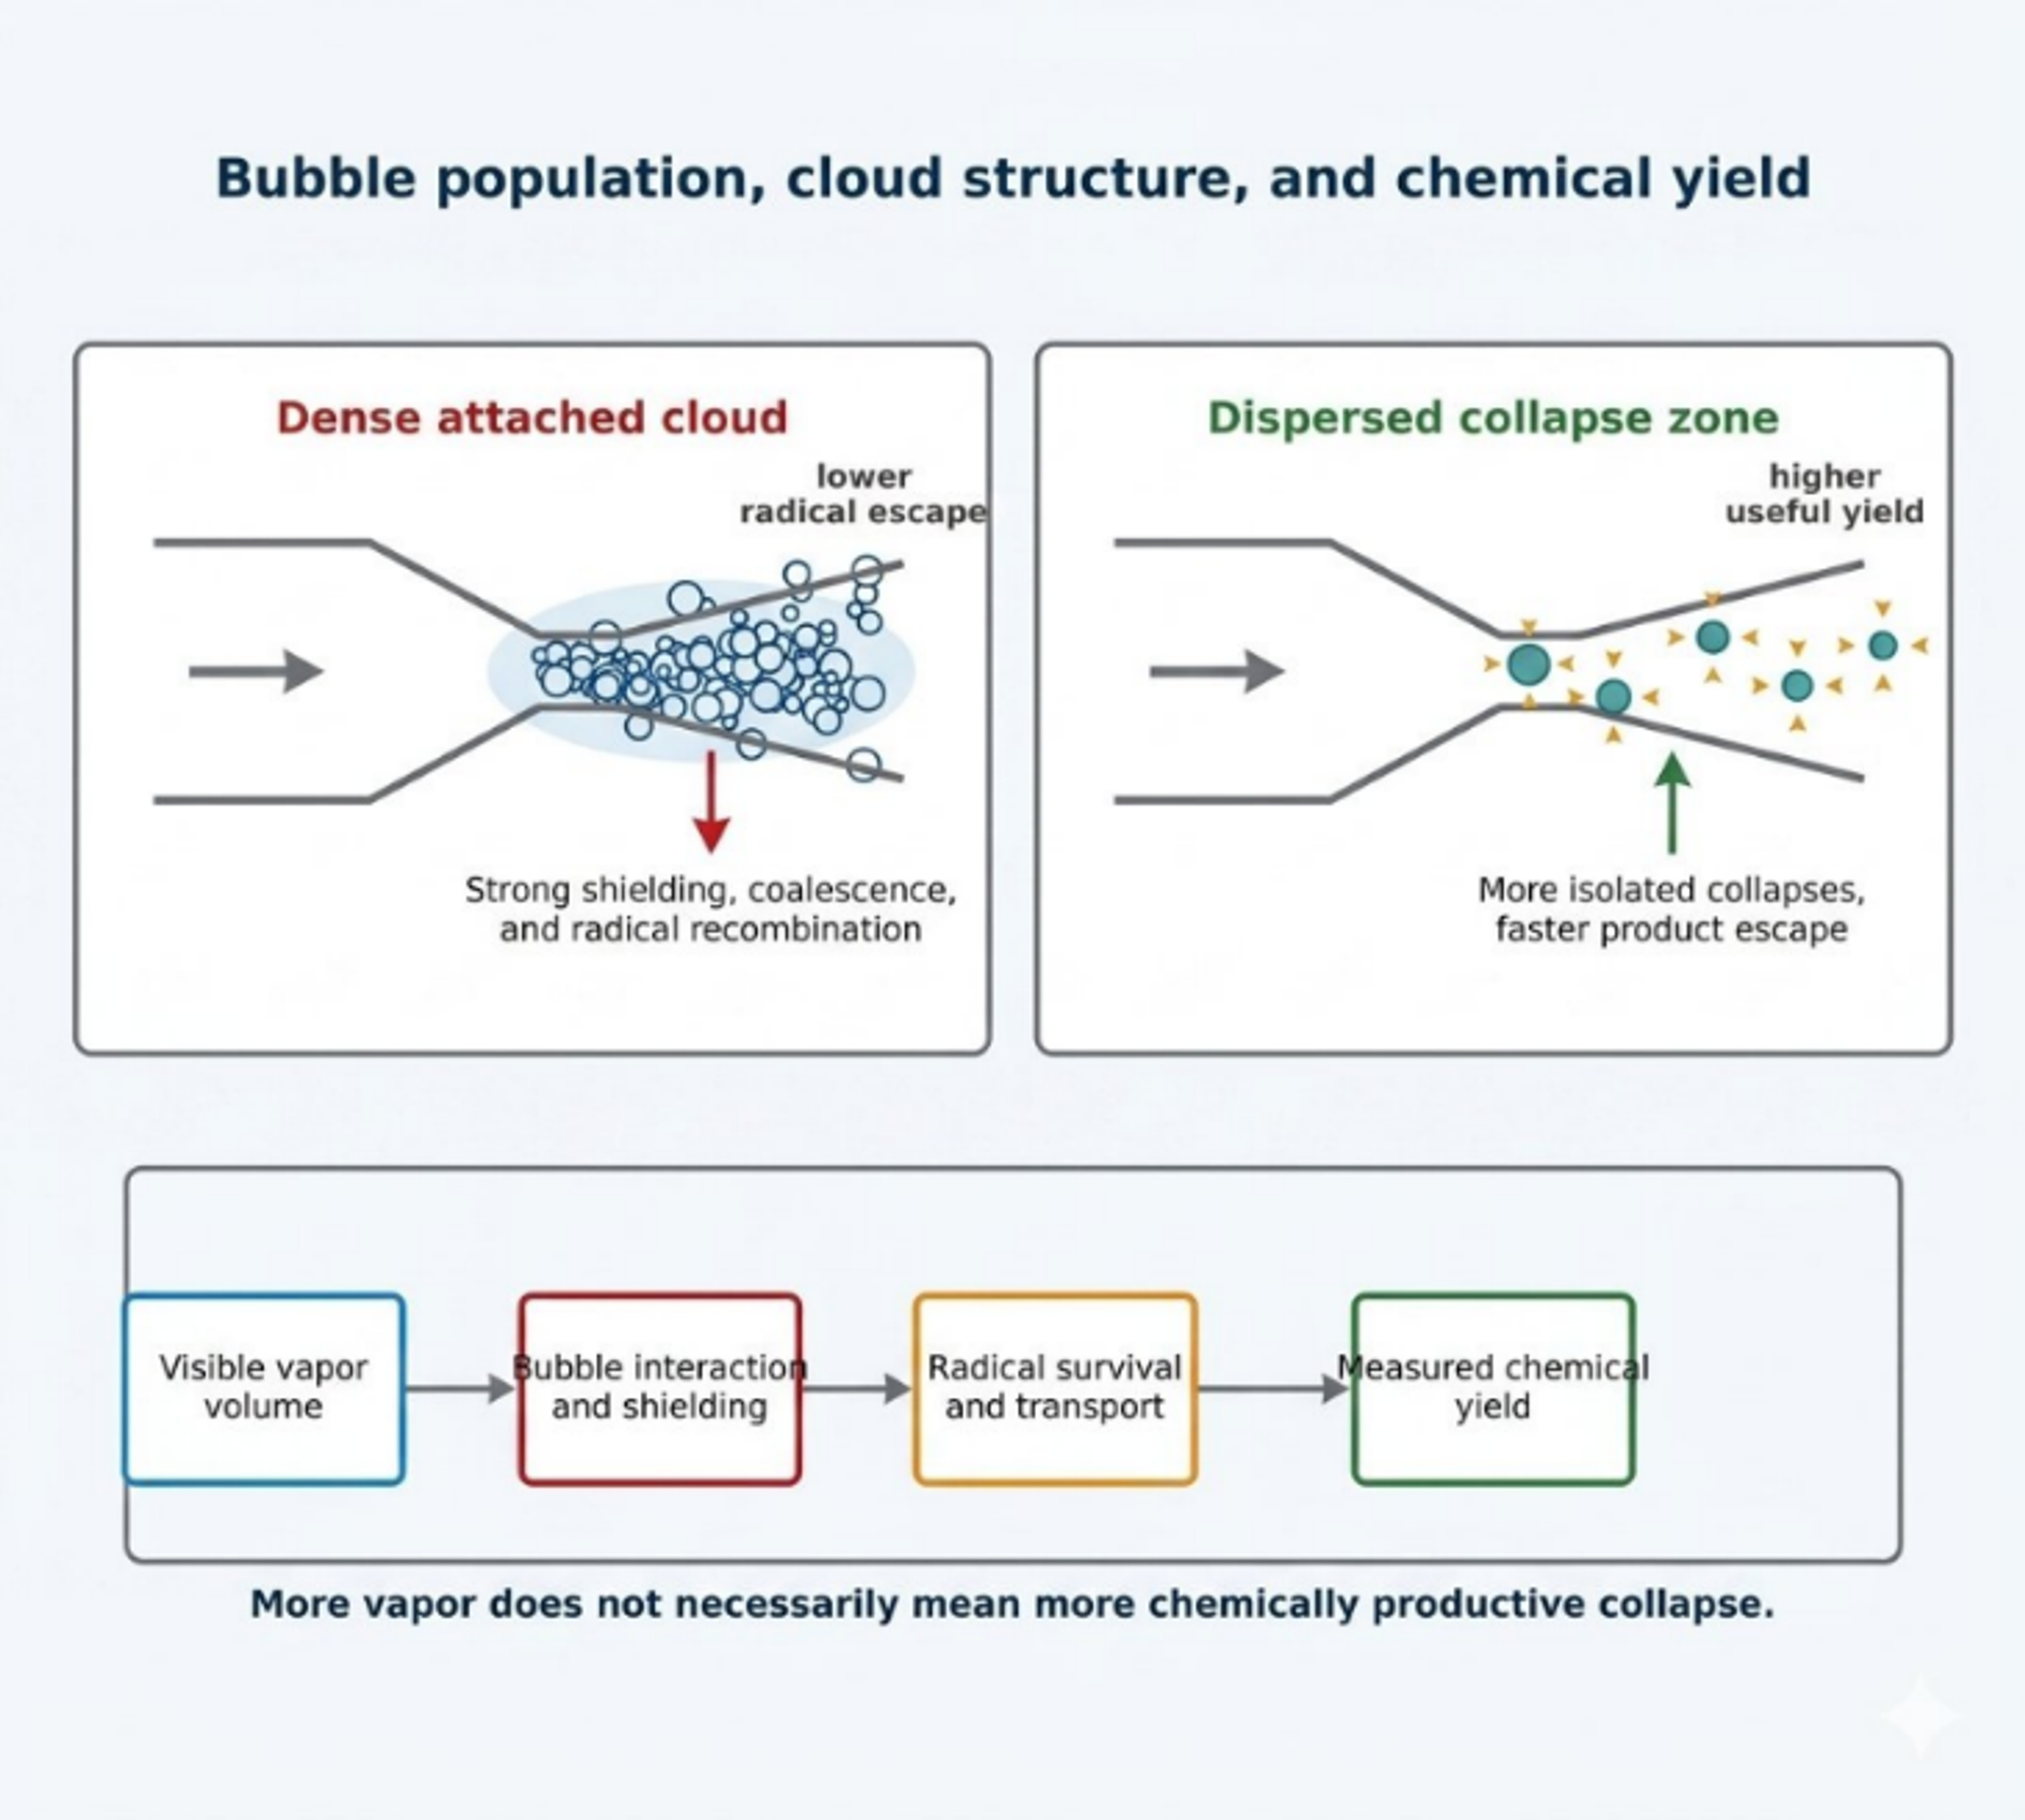
Figure 14.5. Conceptual comparison of a dense attached cavitation cloud and a dispersed collapse zone, showing the influence of bubble interaction, shielding, radical survival, and transport on measured chemical yield [81].
14.3 Chemical dosimetry and spatial radical diagnostics
Chemical dosimeters convert short lived radical chemistry into a stable or optically detectable product. No single dosimeter is universal. Iodide responds to hydroxyl radicals, peroxide, chlorine derived species, and other oxidants. Salicylic acid, coumarin, and terephthalic acid trap hydroxyl radicals through aromatic hydroxylation, but the measured yield depends on probe concentration, product branching, pH, and analytical recovery. Luminol provides valuable spatial information, although its emission depends on formulation, oxygen, pH, and camera integration time. Sulfite and Fricke systems measure integrated oxidation and require careful control of atmospheric oxygen.
Amin and coworkers used salicylic acid dosimetry in a high pressure recirculating hydrocavitator [67]. The reported hydroxylated product yield was maximal at an initial salicylic acid concentration of 750 ppm. No product was detected below 100 psi in their apparatus, whereas higher upstream pressure increased product formation. The study also reported that placing a 20 kHz ultrasonic probe downstream of the hydrodynamic device improved hydroxylated product formation by about 15 percent when the separation was 5 to 10 mm. These results show that a dosimeter must first be optimized for concentration and reactor geometry before it can be used to compare operating conditions.
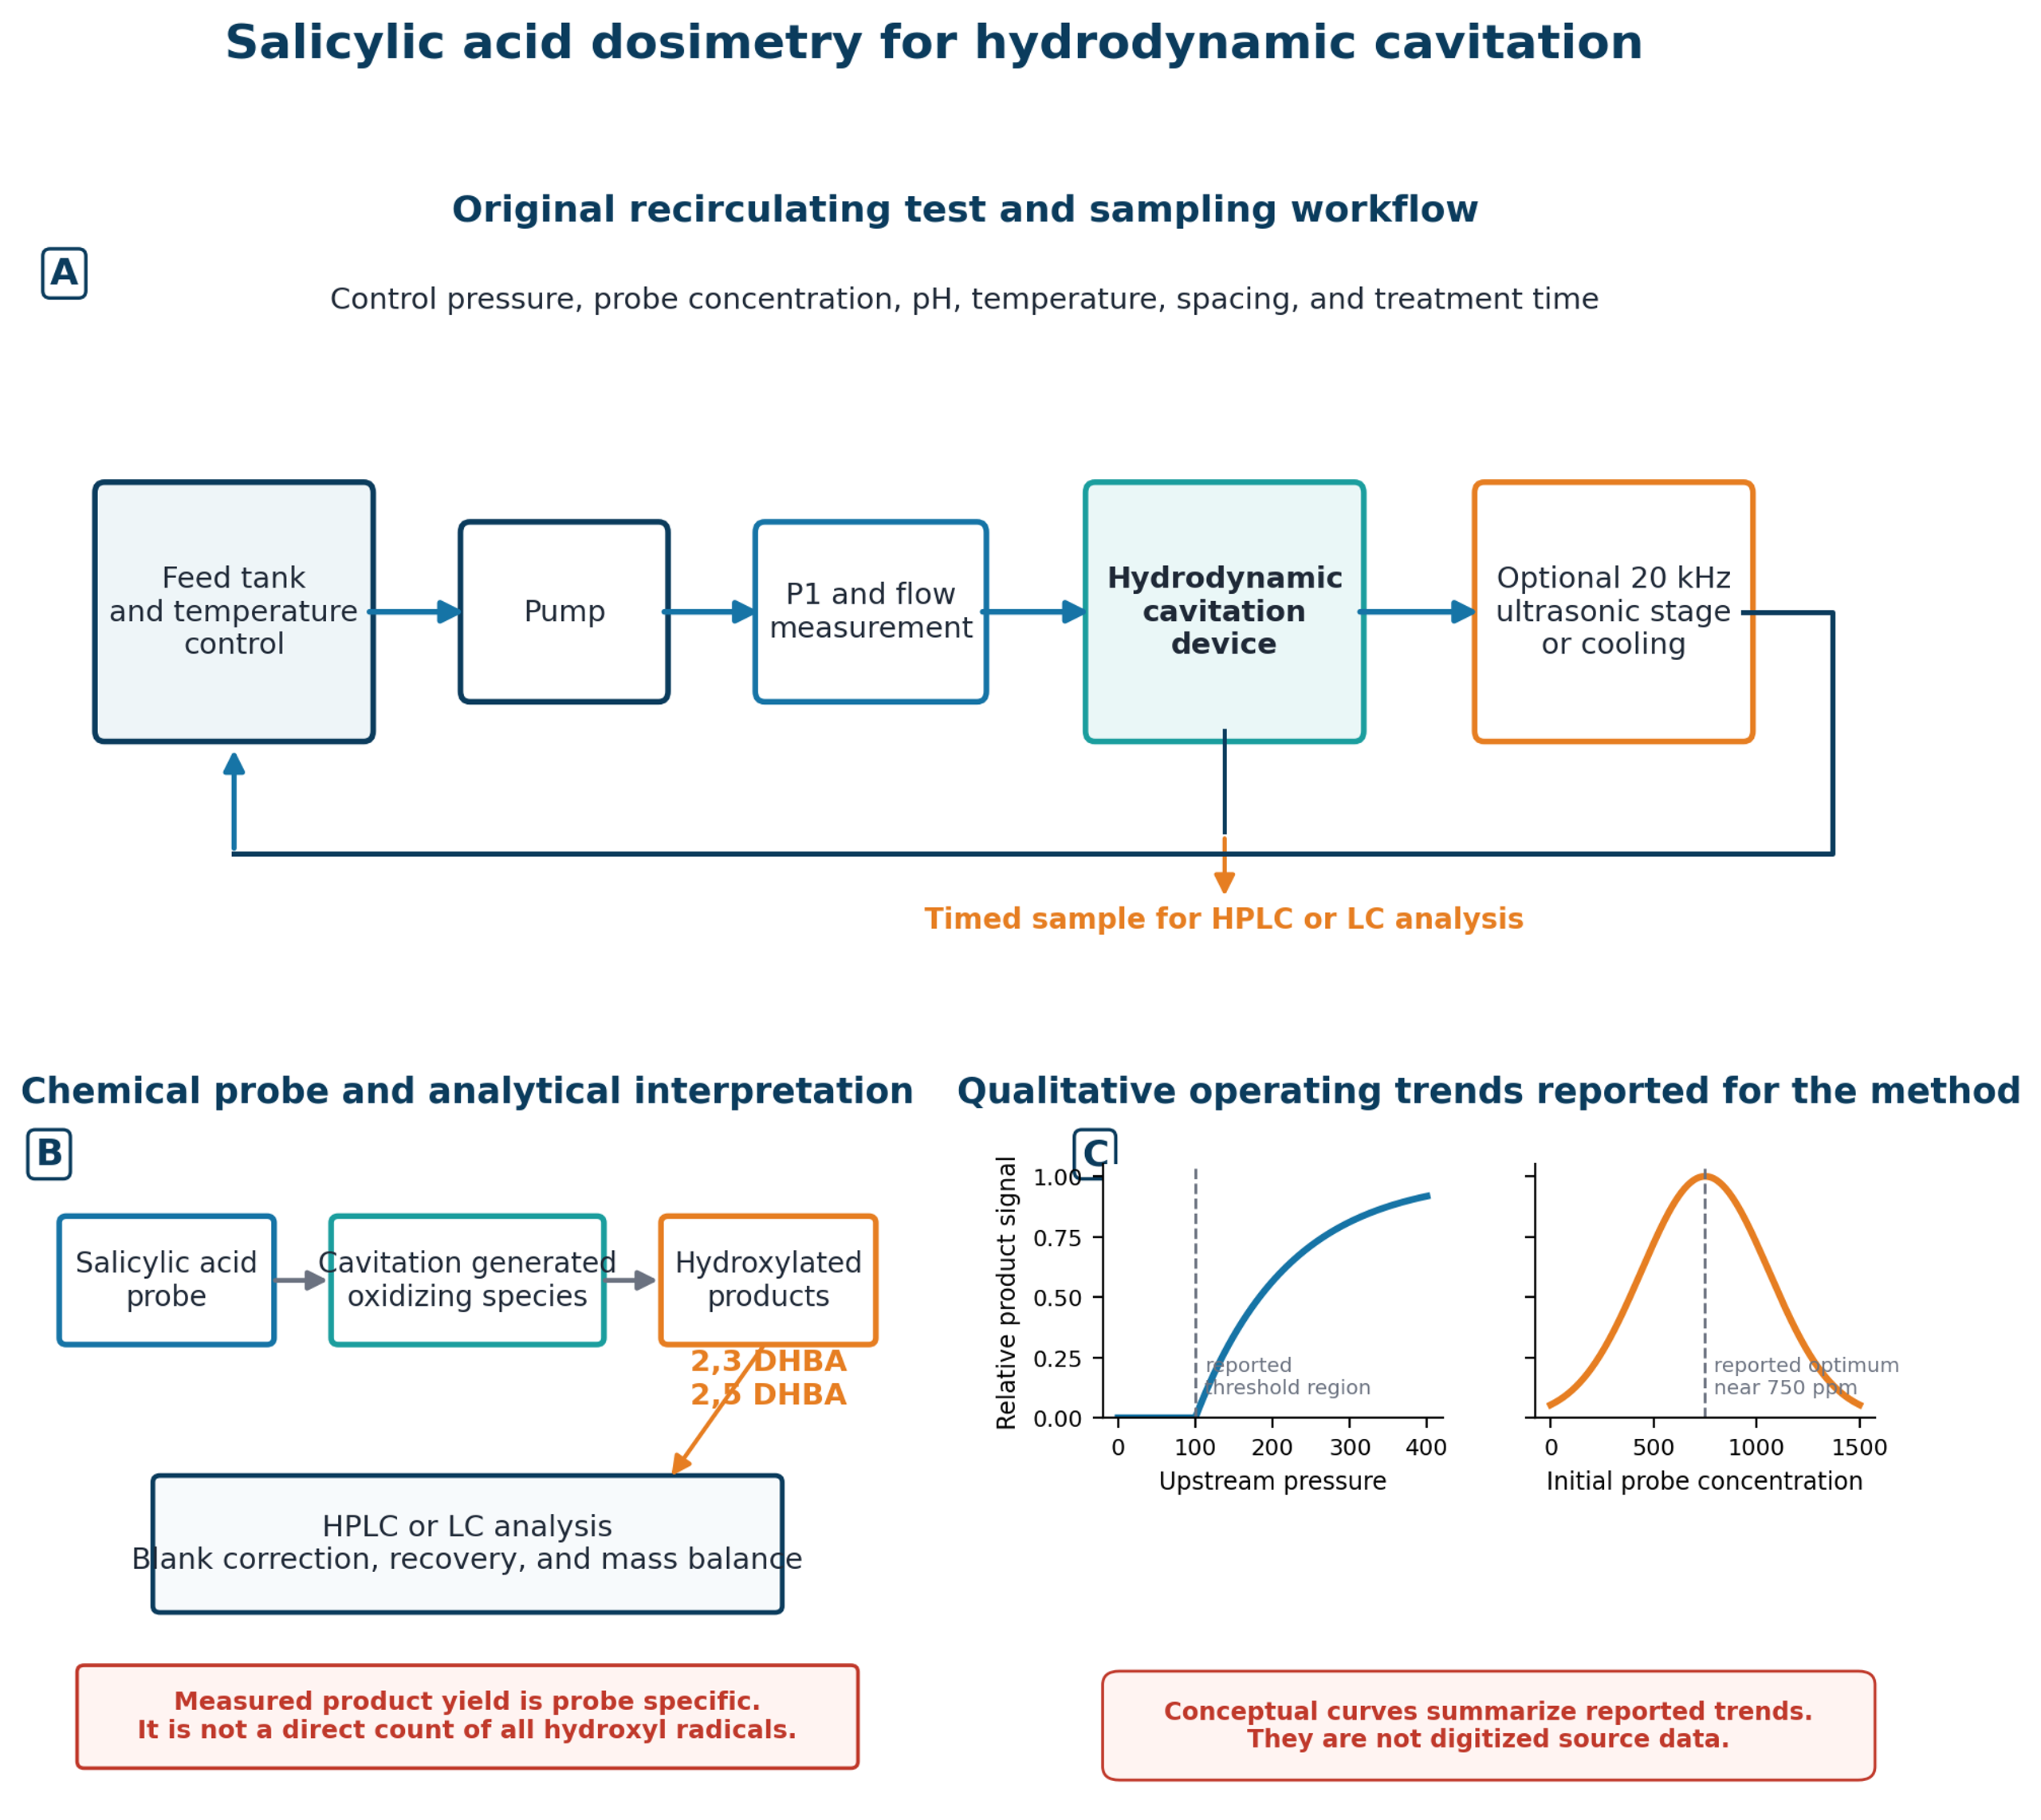
Figure 14.6. Salicylic acid dosimetry workflow, analytical interpretation, and qualitative operating trends for a hydrodynamic cavitation reactor with an optional downstream ultrasonic stage. Generated schematic based on experimental design and reported trends in Amin et al. [67].
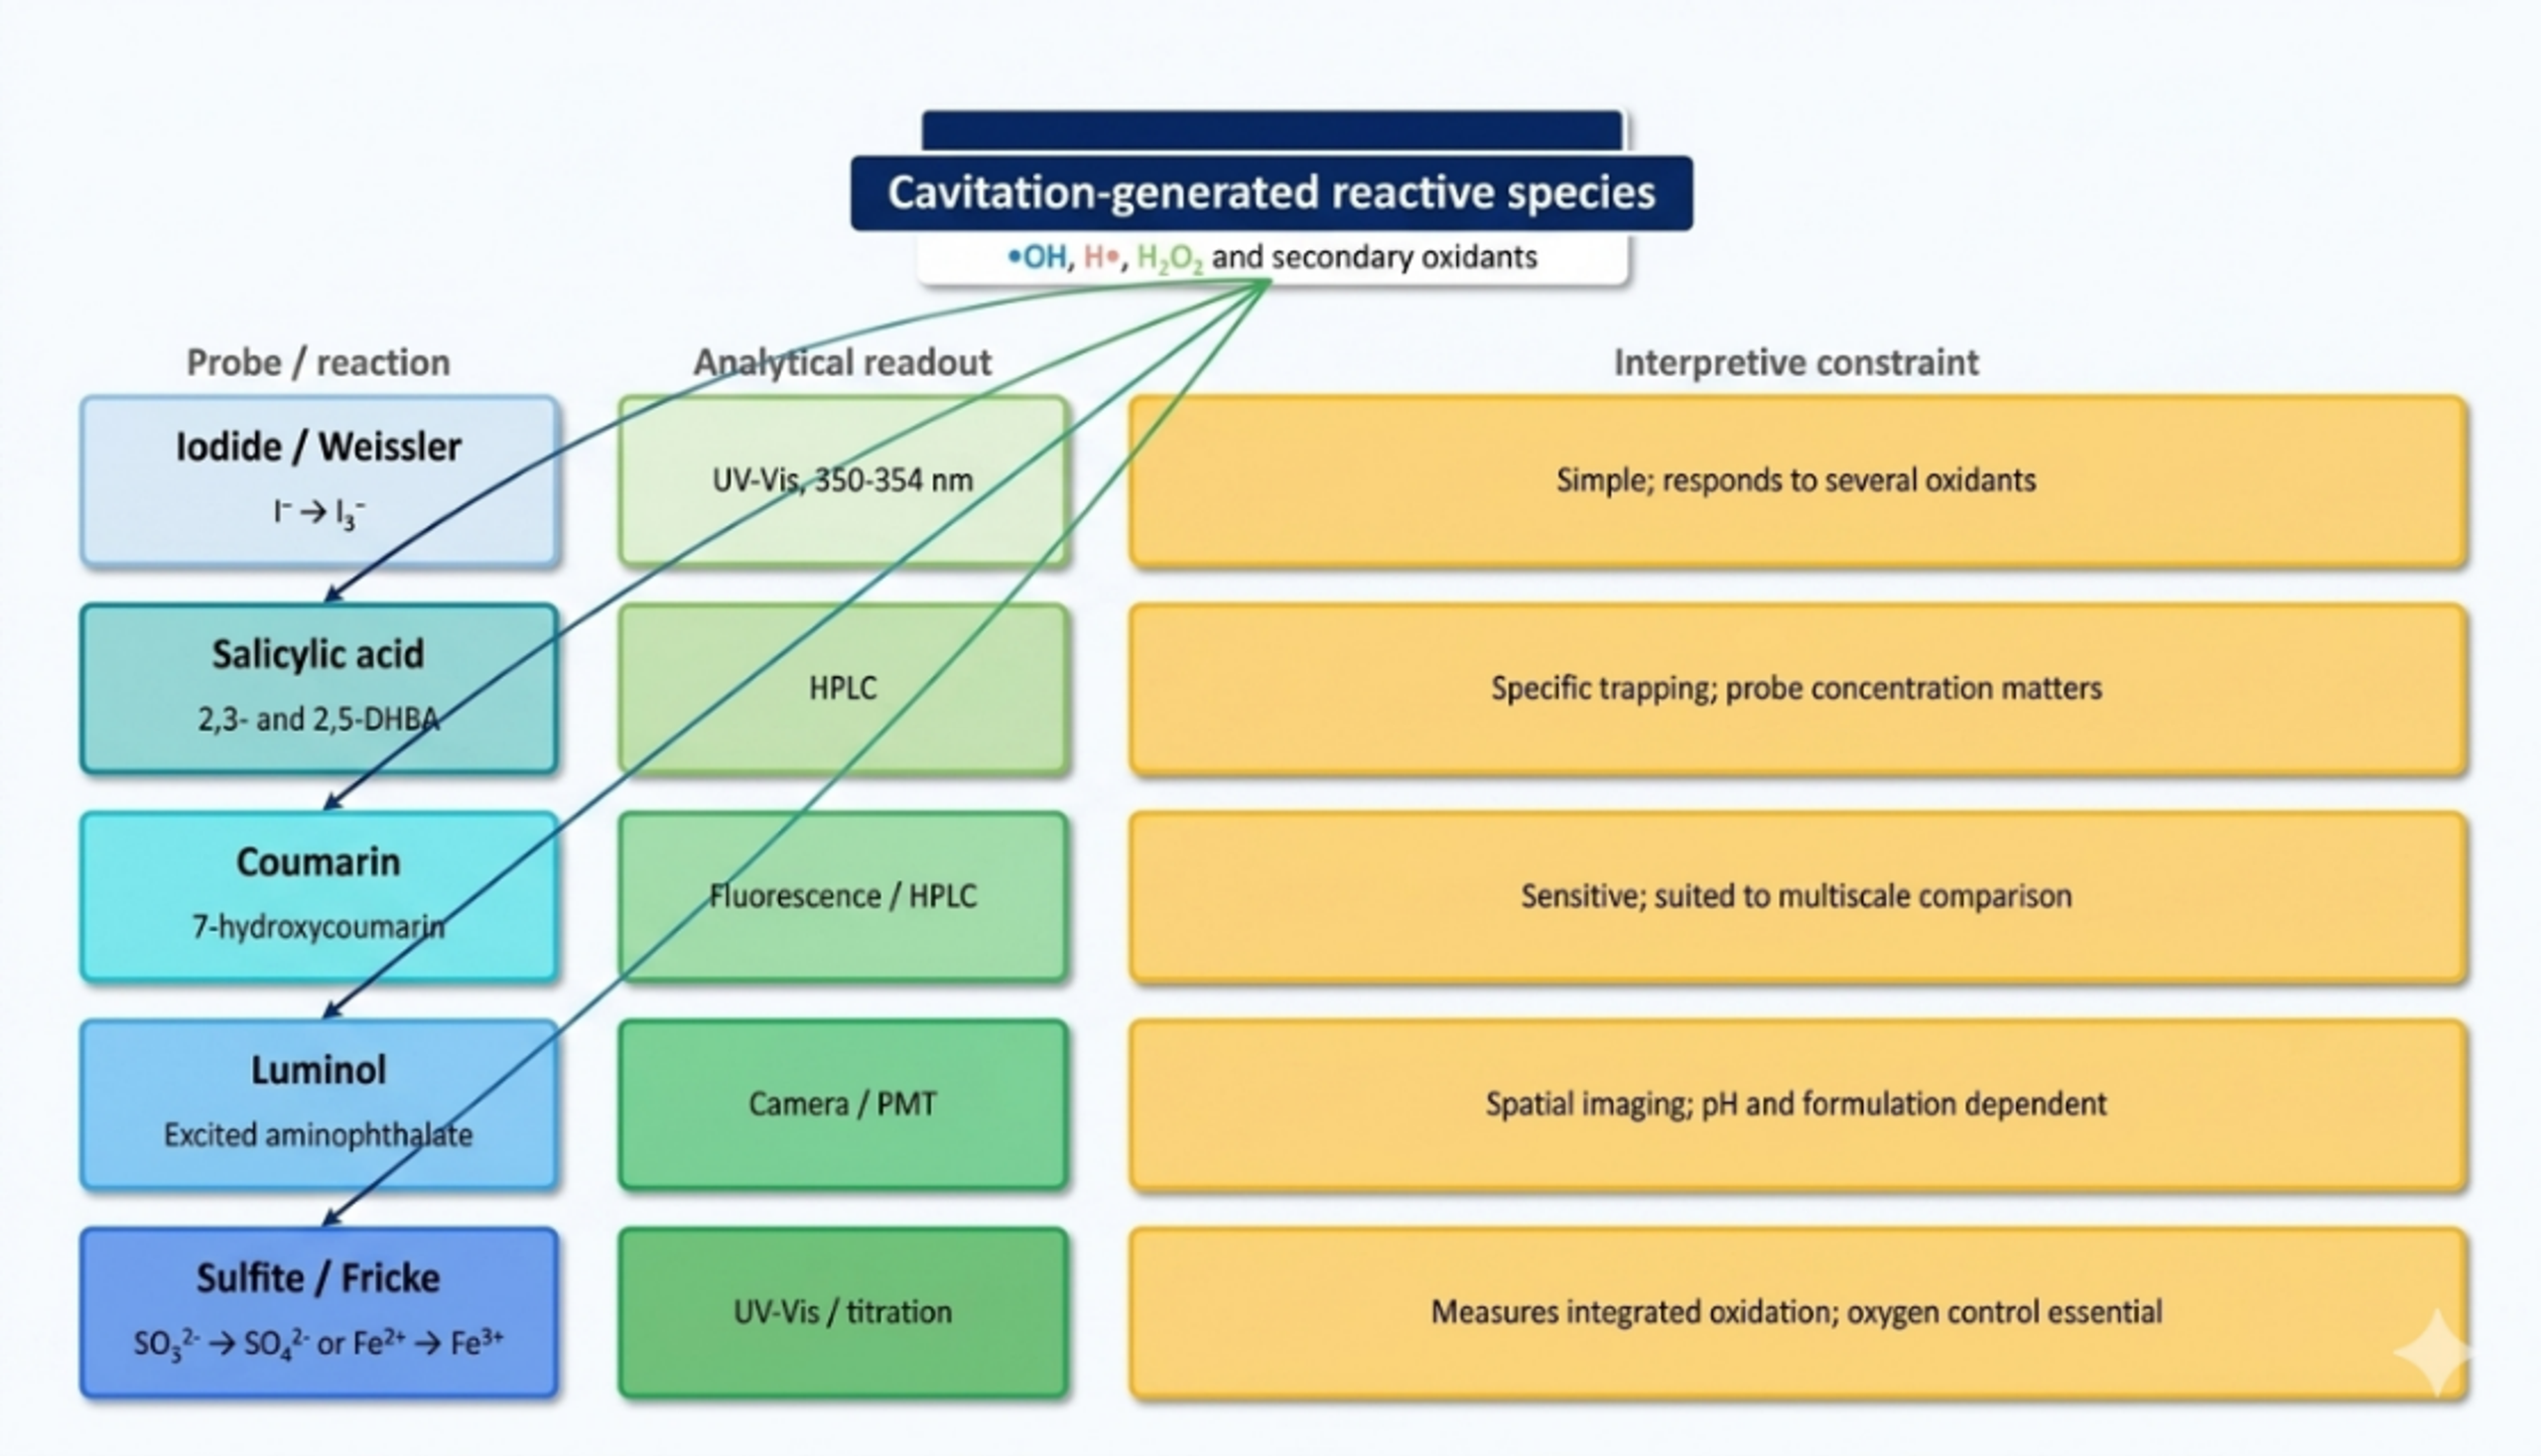
Figure 14.7. Selection logic for chemical dosimetry of hydrodynamic cavitation [81].
Spatially resolved luminol imaging provides an additional layer of evidence. Nöpel and coworkers examined a cavitating free jet from 1.0 and 1.7 mm orifices at 10 to 30 bar [68]. The luminous region expanded with inlet pressure and was substantially larger for the 1.7 mm orifice at the same pressure because of the higher flow rate. When the luminous volume was normalized by reactor volume and plotted against hydraulic power, the two orifices approached a common trend. This result indicates that hydraulic power can organize the gross spatial extent of chemistry, while local intensity and chemical yield still require a separate measurement.
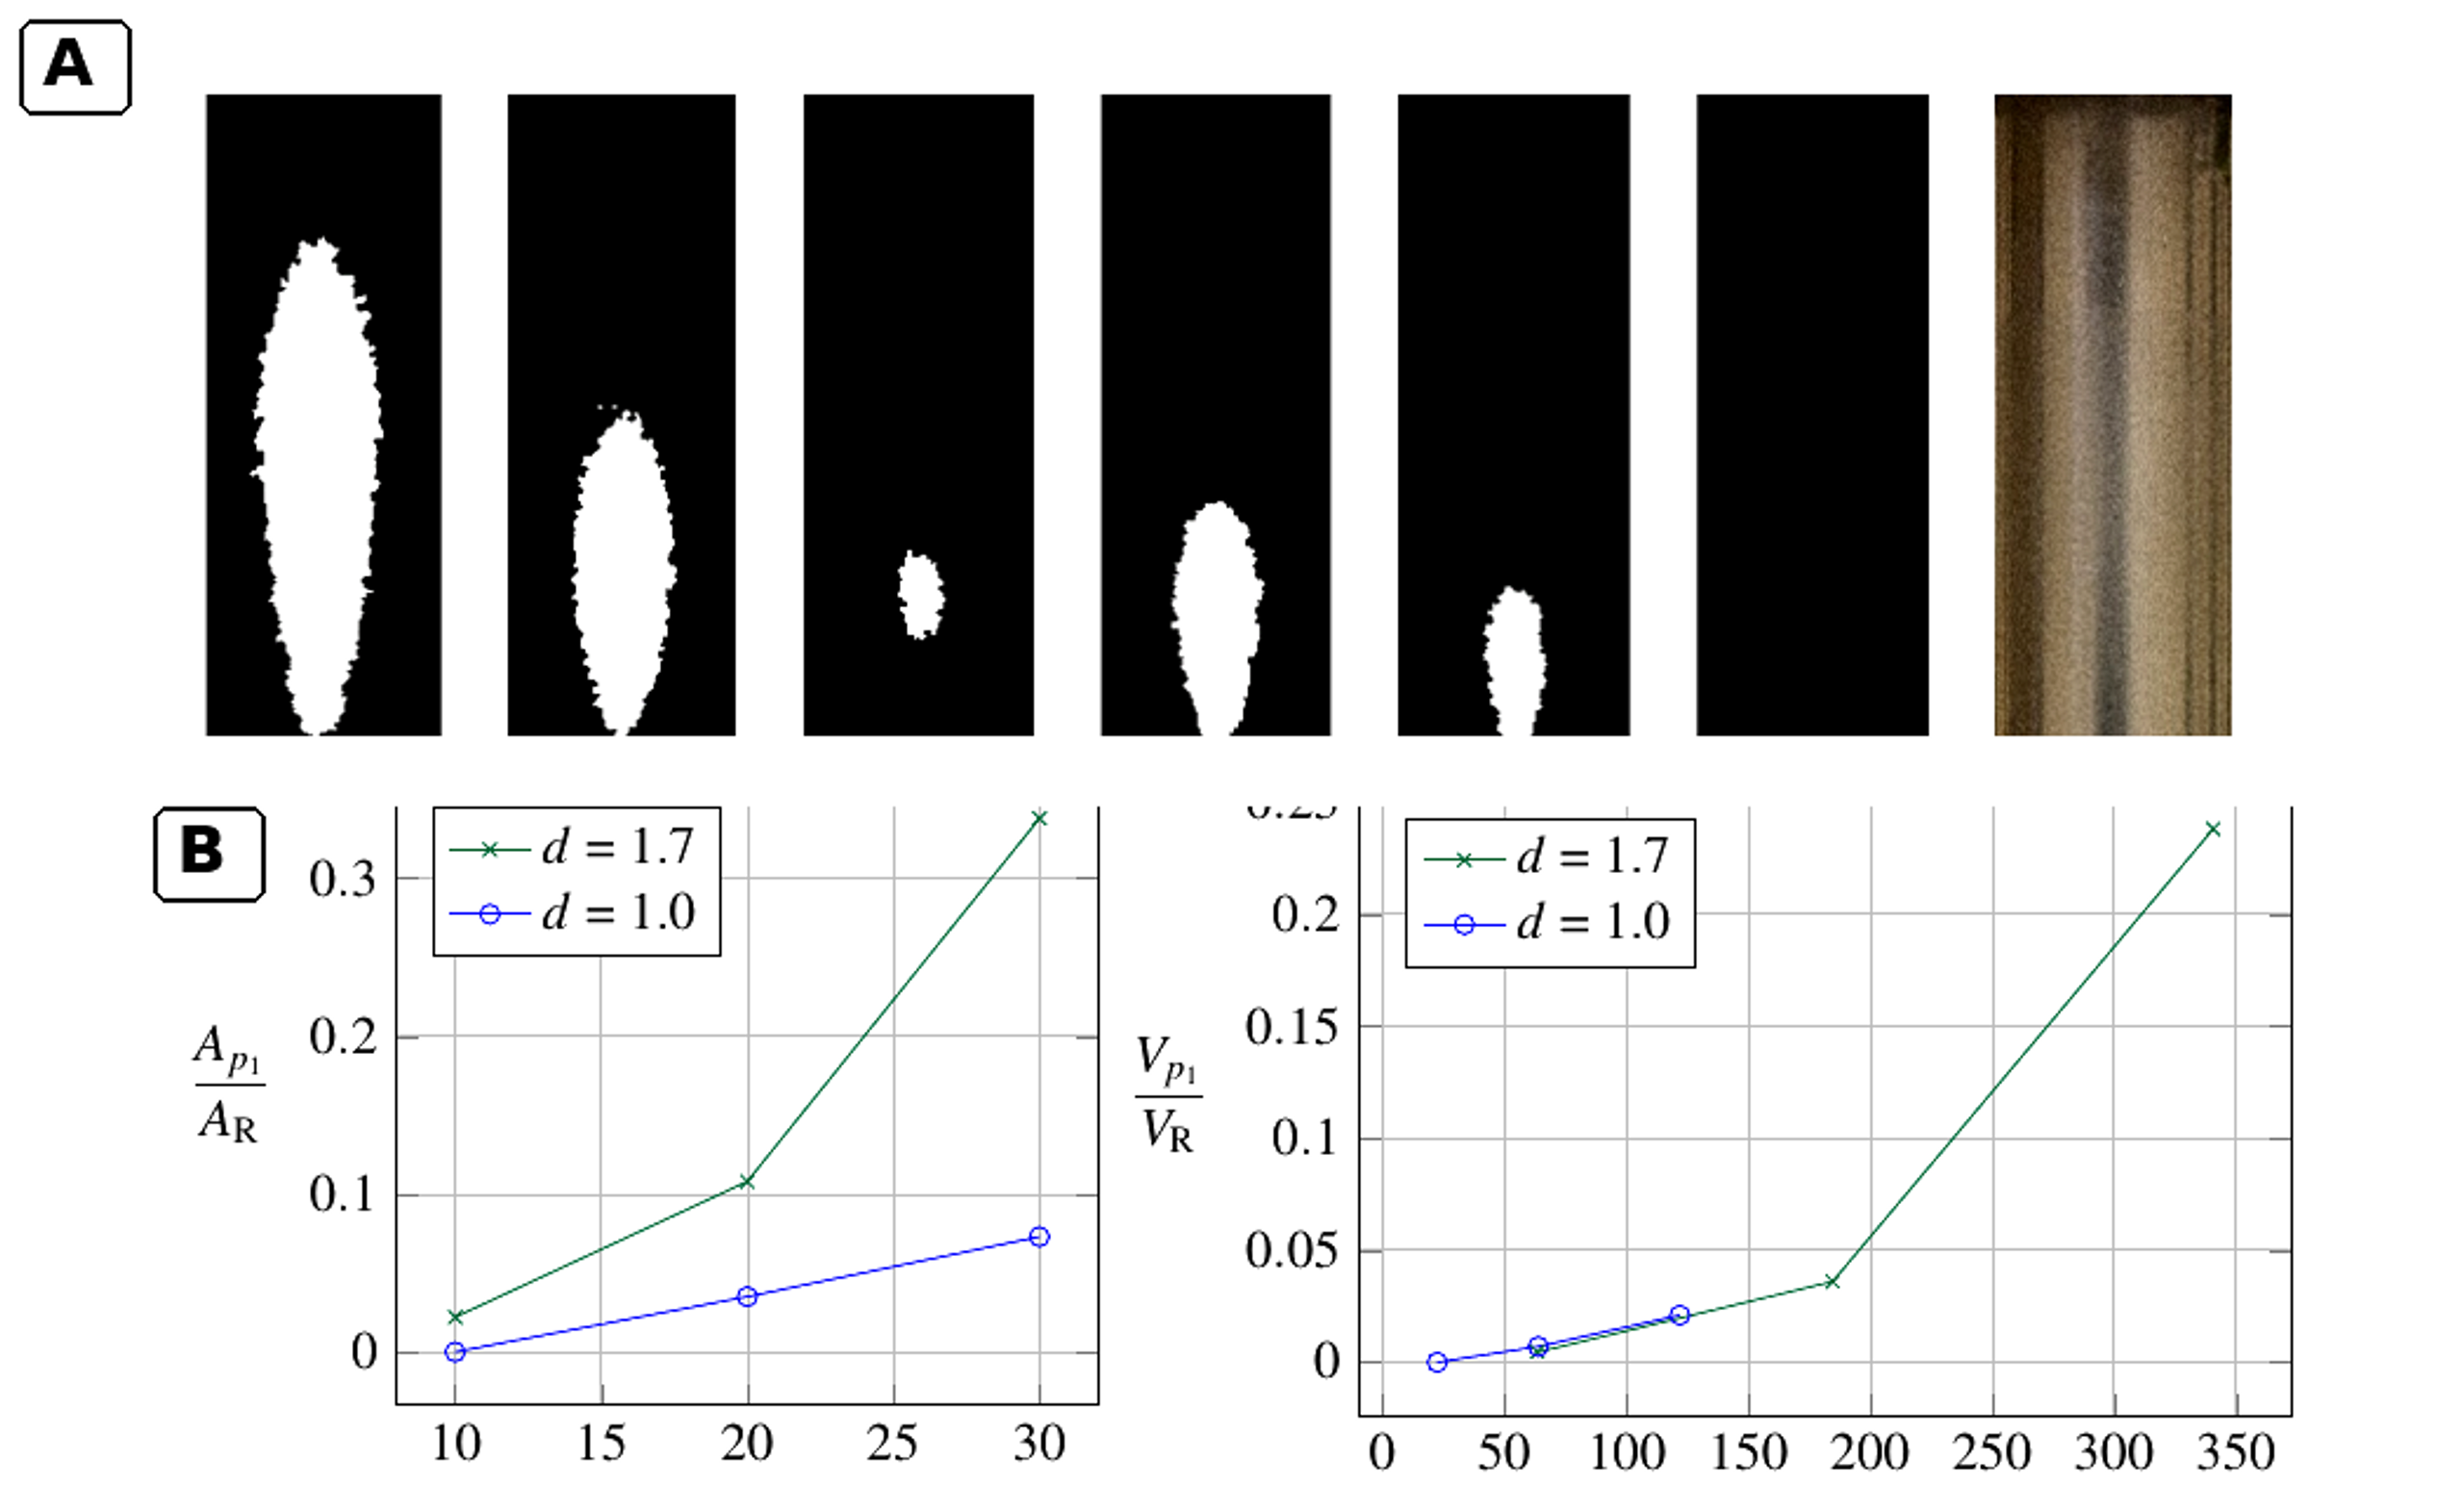
Figure 14.8. Spatial distribution of luminol chemiluminescence and normalized light emitting region in an orifice jet reactor [68].
Tandiono and coworkers demonstrated sonochemistry and sonoluminescence in microfluidic channels under acoustic excitation [69]. Although the forcing mechanism was acoustic, their observation that chemiluminescence was concentrated near gas liquid interfaces is directly relevant to hydrodynamic microdevices. It supports the three zone interpretation: reactant location relative to the bubble core and interface strongly controls which pathways are observed.
14.4 Coupling cavitation with oxidants: decolorization is not mineralization
Rajoriya, Bargole, and Saharan evaluated Rhodamine 6G degradation in circular and slit Venturi reactors and then coupled hydrodynamic cavitation with hydrogen peroxide and ozone [70]. Under their optimized HC only condition, the reported decolorization was 32.06 percent. Addition of hydrogen peroxide at a dye to peroxide molar ratio of 1:30 increased decolorization to 53.72 percent. The HC ozone combination achieved complete decolorization in about 10 min under the reported conditions, while 84 percent TOC removal was obtained at 20 bar with an ozone feed of 3 g h⁻¹ after 120 min. The difference between color removal and TOC removal is fundamental: cleavage of the chromophore can be rapid even when substantial organic carbon remains.
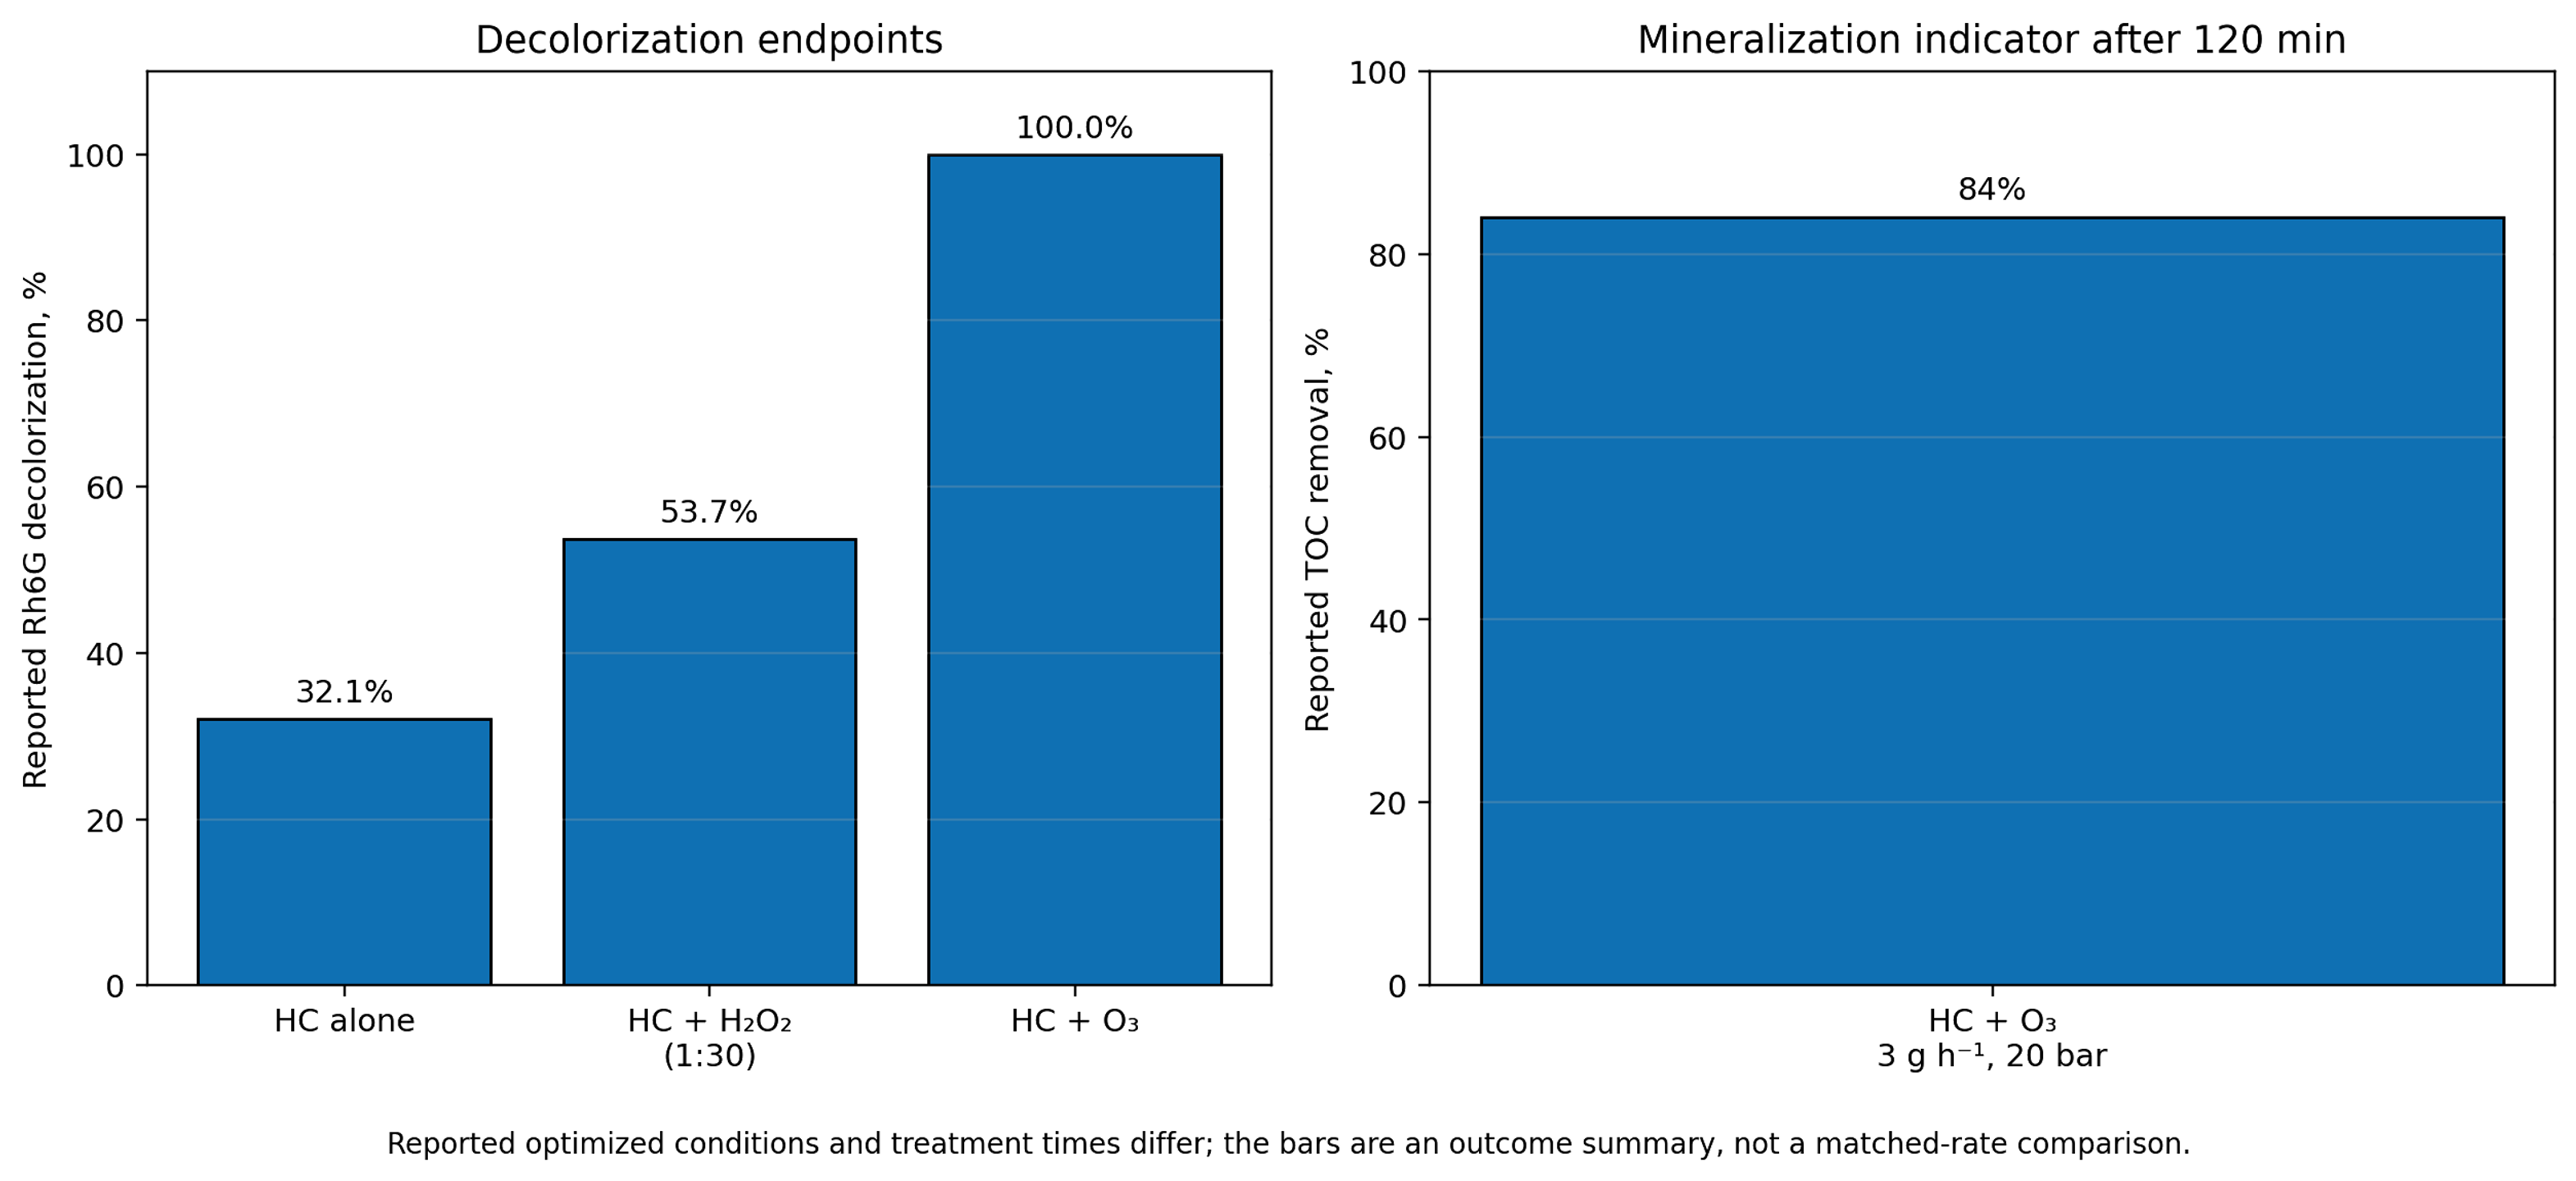
Figure 14.9. Reported Rhodamine 6G decolorization and mineralization indicators for selected optimized conditions. [70].
Hybrid process claims should be tested against component controls at matched temperature, reagent dose, gas transfer, residence time, and energy input. Ozone injected at or near the low pressure region can improve gas liquid transfer and expose ozone to radical generating collapse, but it also adds electrical energy for ozone generation. A whole process evaluation must therefore report both the cavitation loop power and the oxidant generation power.
14.5 Vortex devices and the scale dependence of radical efficiency
Vortex based devices generate a low pressure core through swirling motion rather than a narrow wall bound constriction. The configuration can keep the principal cavity away from solid surfaces, reduce clogging risk, and process liquids with suspended solids. Figure 14.10 shows the inlet, processing vortex core, inception zone, collapse zone, and pressure drop used in a recent multiscale analysis [71].
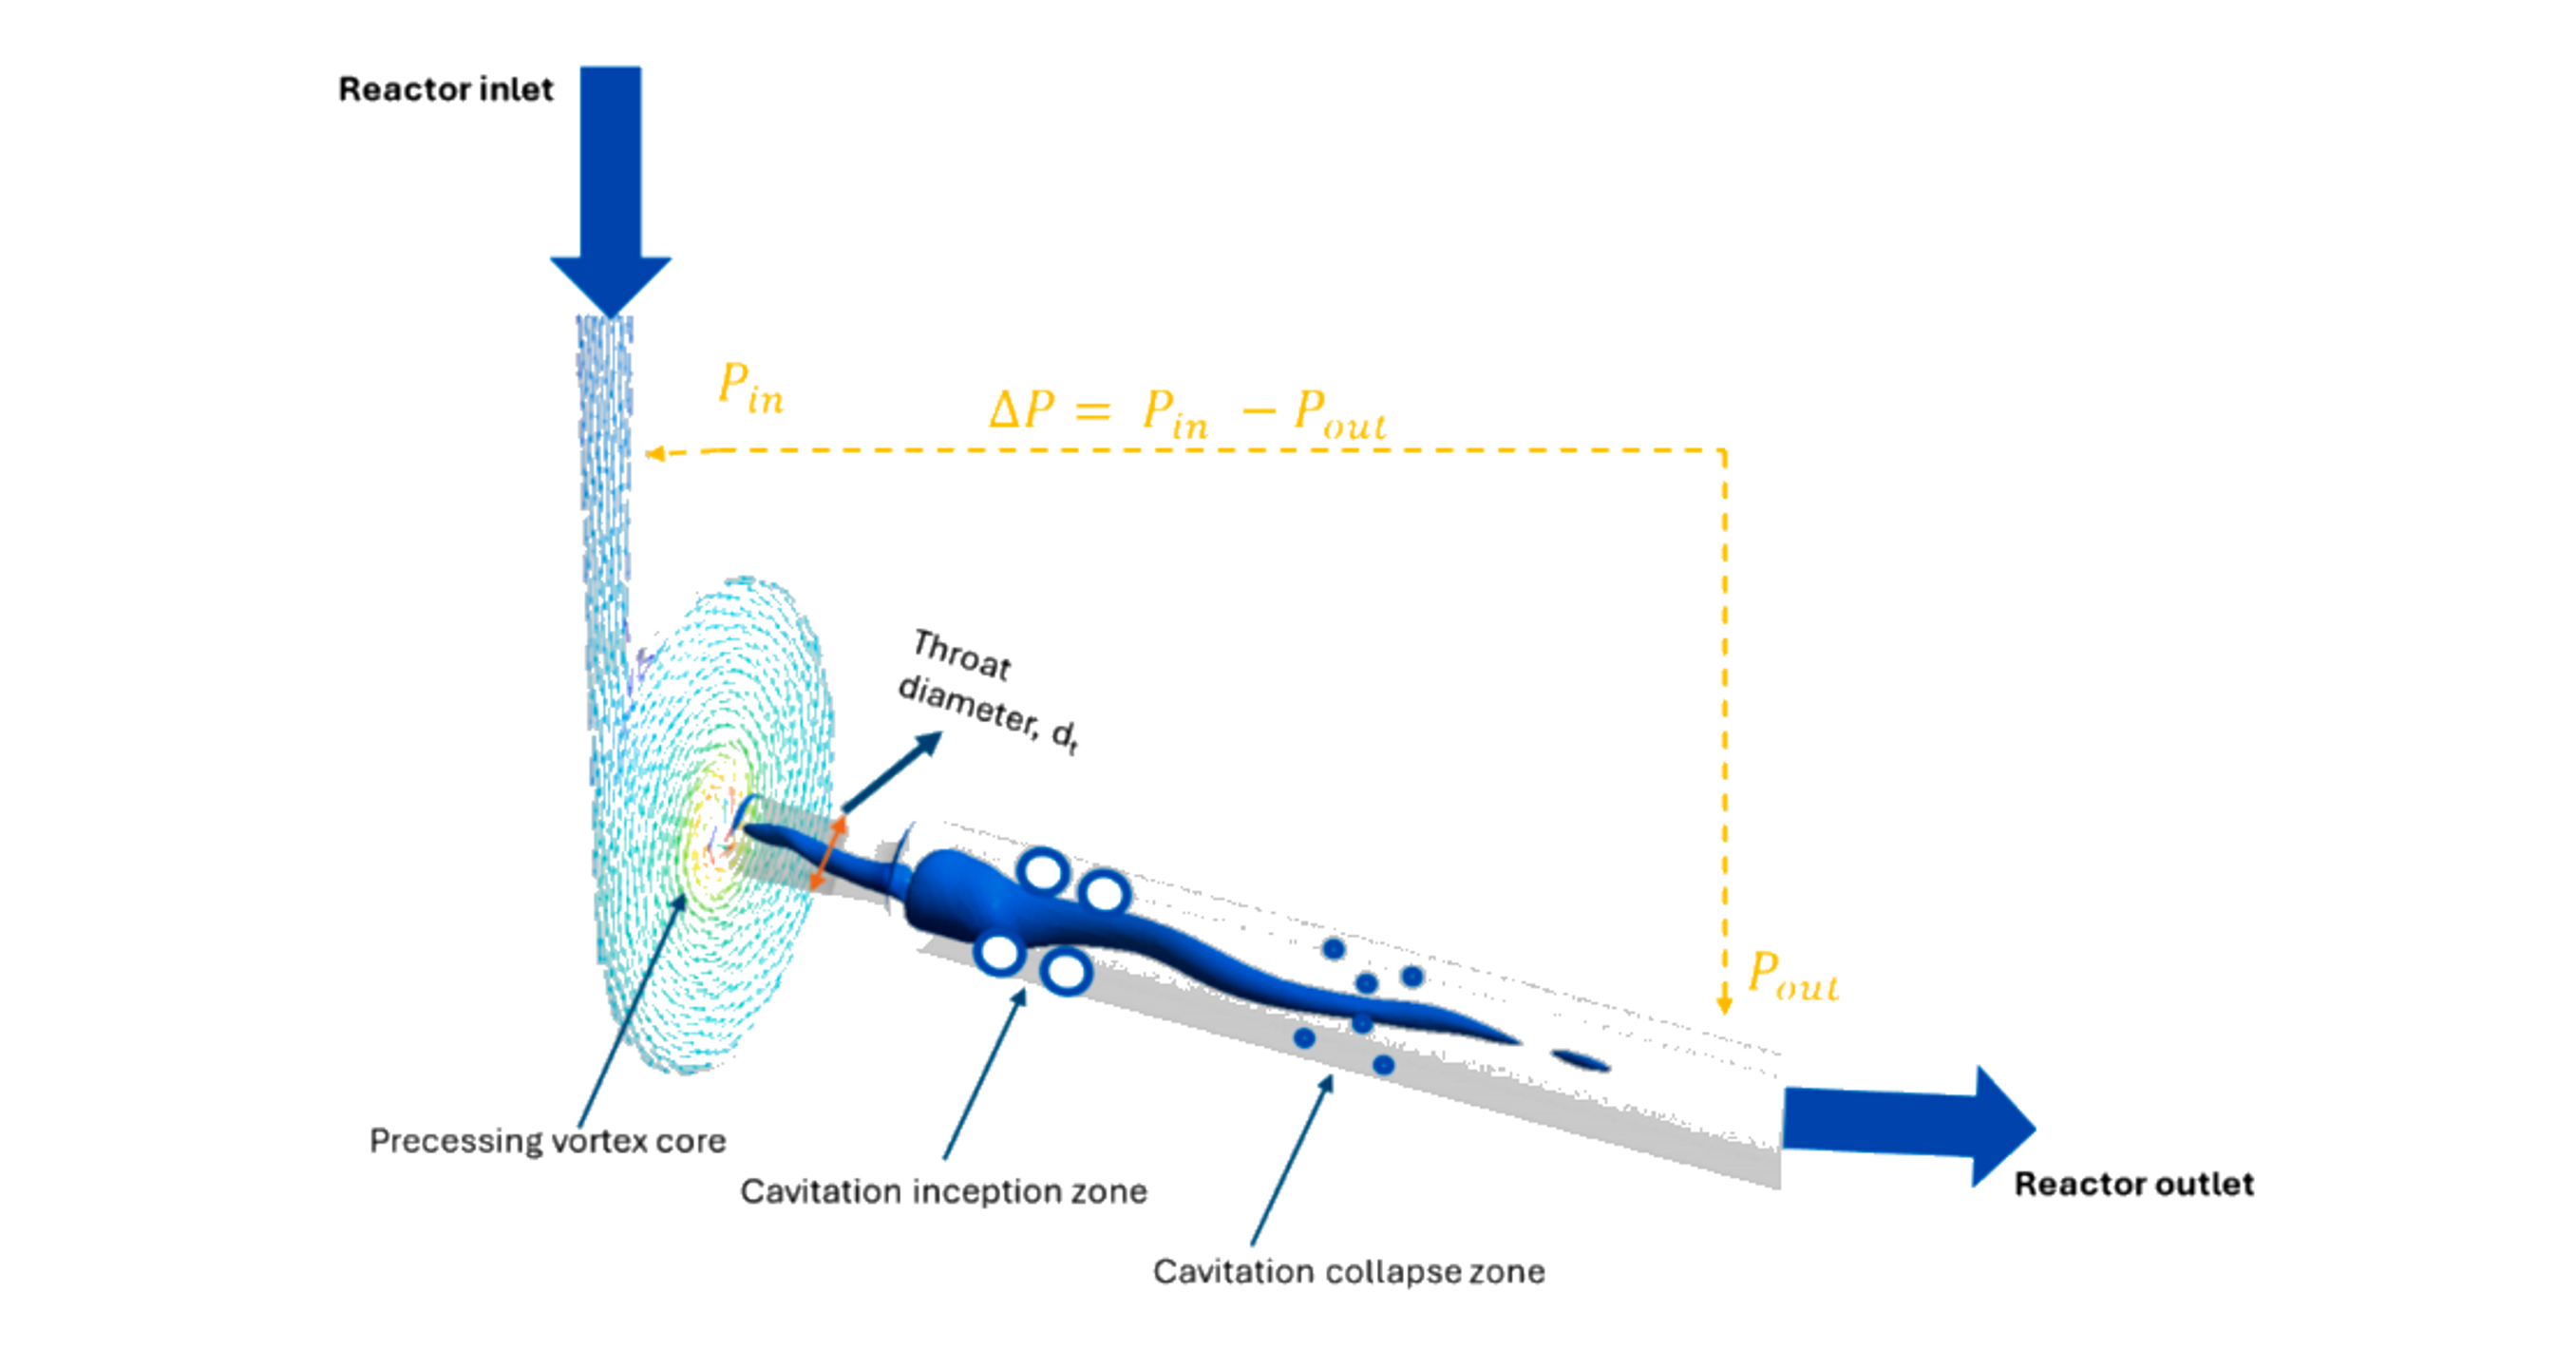
Figure 14.10. Vortex based hydrodynamic cavitation reactor and characteristic cavitation zones. [71].
Khare and Ranade used validated turbulence and cavitation models to study geometrically similar vortex devices over nearly three orders of magnitude in flow rate [72]. Their cavitation extent, defined as dimensionless vapor volume relative to input power, decreased strongly with throat diameter. The reduction persisted even when energy consumption per unit mass was held constant, because specific dissipation, pressure fluctuation amplitude, and characteristic turbulence frequency changed with scale. Figure 14.11 illustrates the decline in cavitation extent with increasing throat diameter and its nonlinear dependence on throat velocity.
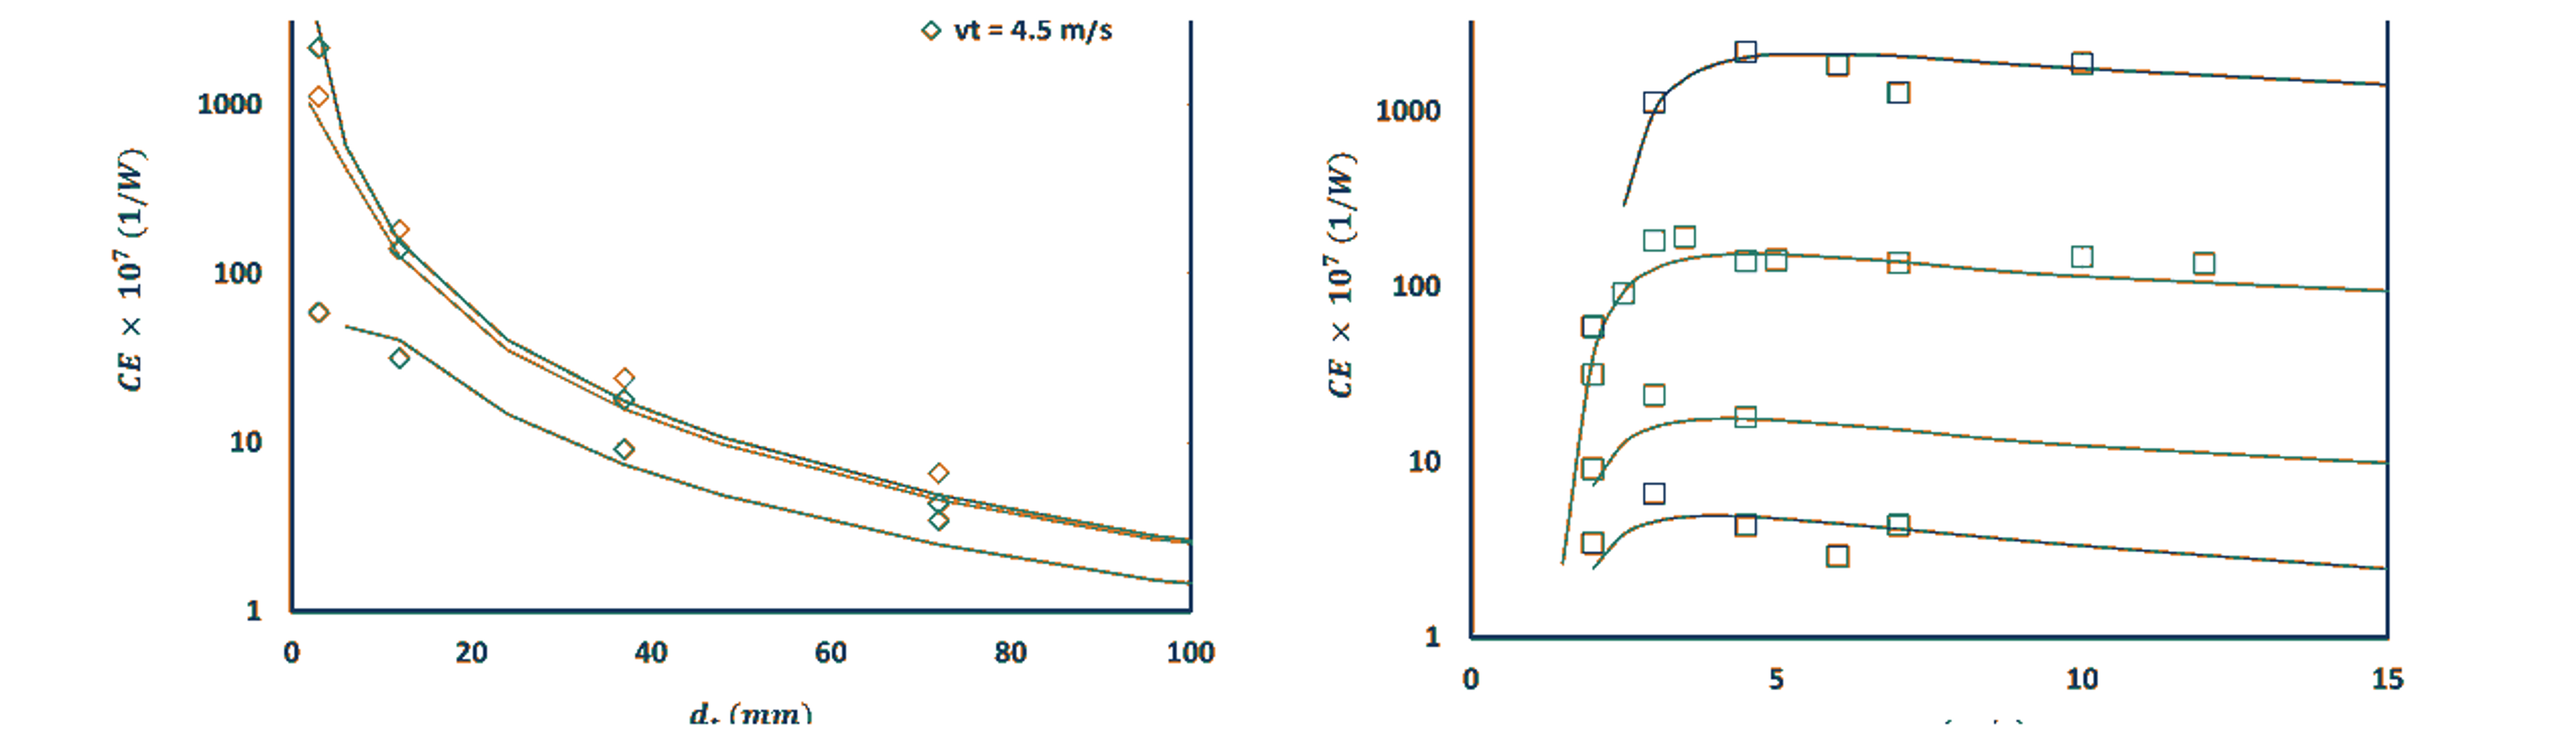
Figure 14.11. Scale and velocity dependence of cavitation extent in vortex devices. [72].
Pang and coworkers combined coumarin dosimetry datasets from 6, 12, and 38 mm vortex devices with machine learning models [71]. The XGB and ANN models reproduced experimental trends and predicted a general decline in radical yield per energy and throughput as throat diameter increased. Figure 14.12 compares model trends with experimental degradation data at a standardized number of passes. The result does not imply that a larger reactor produces fewer total radicals. It means that radical production does not scale proportionally with flow capacity or energy input.
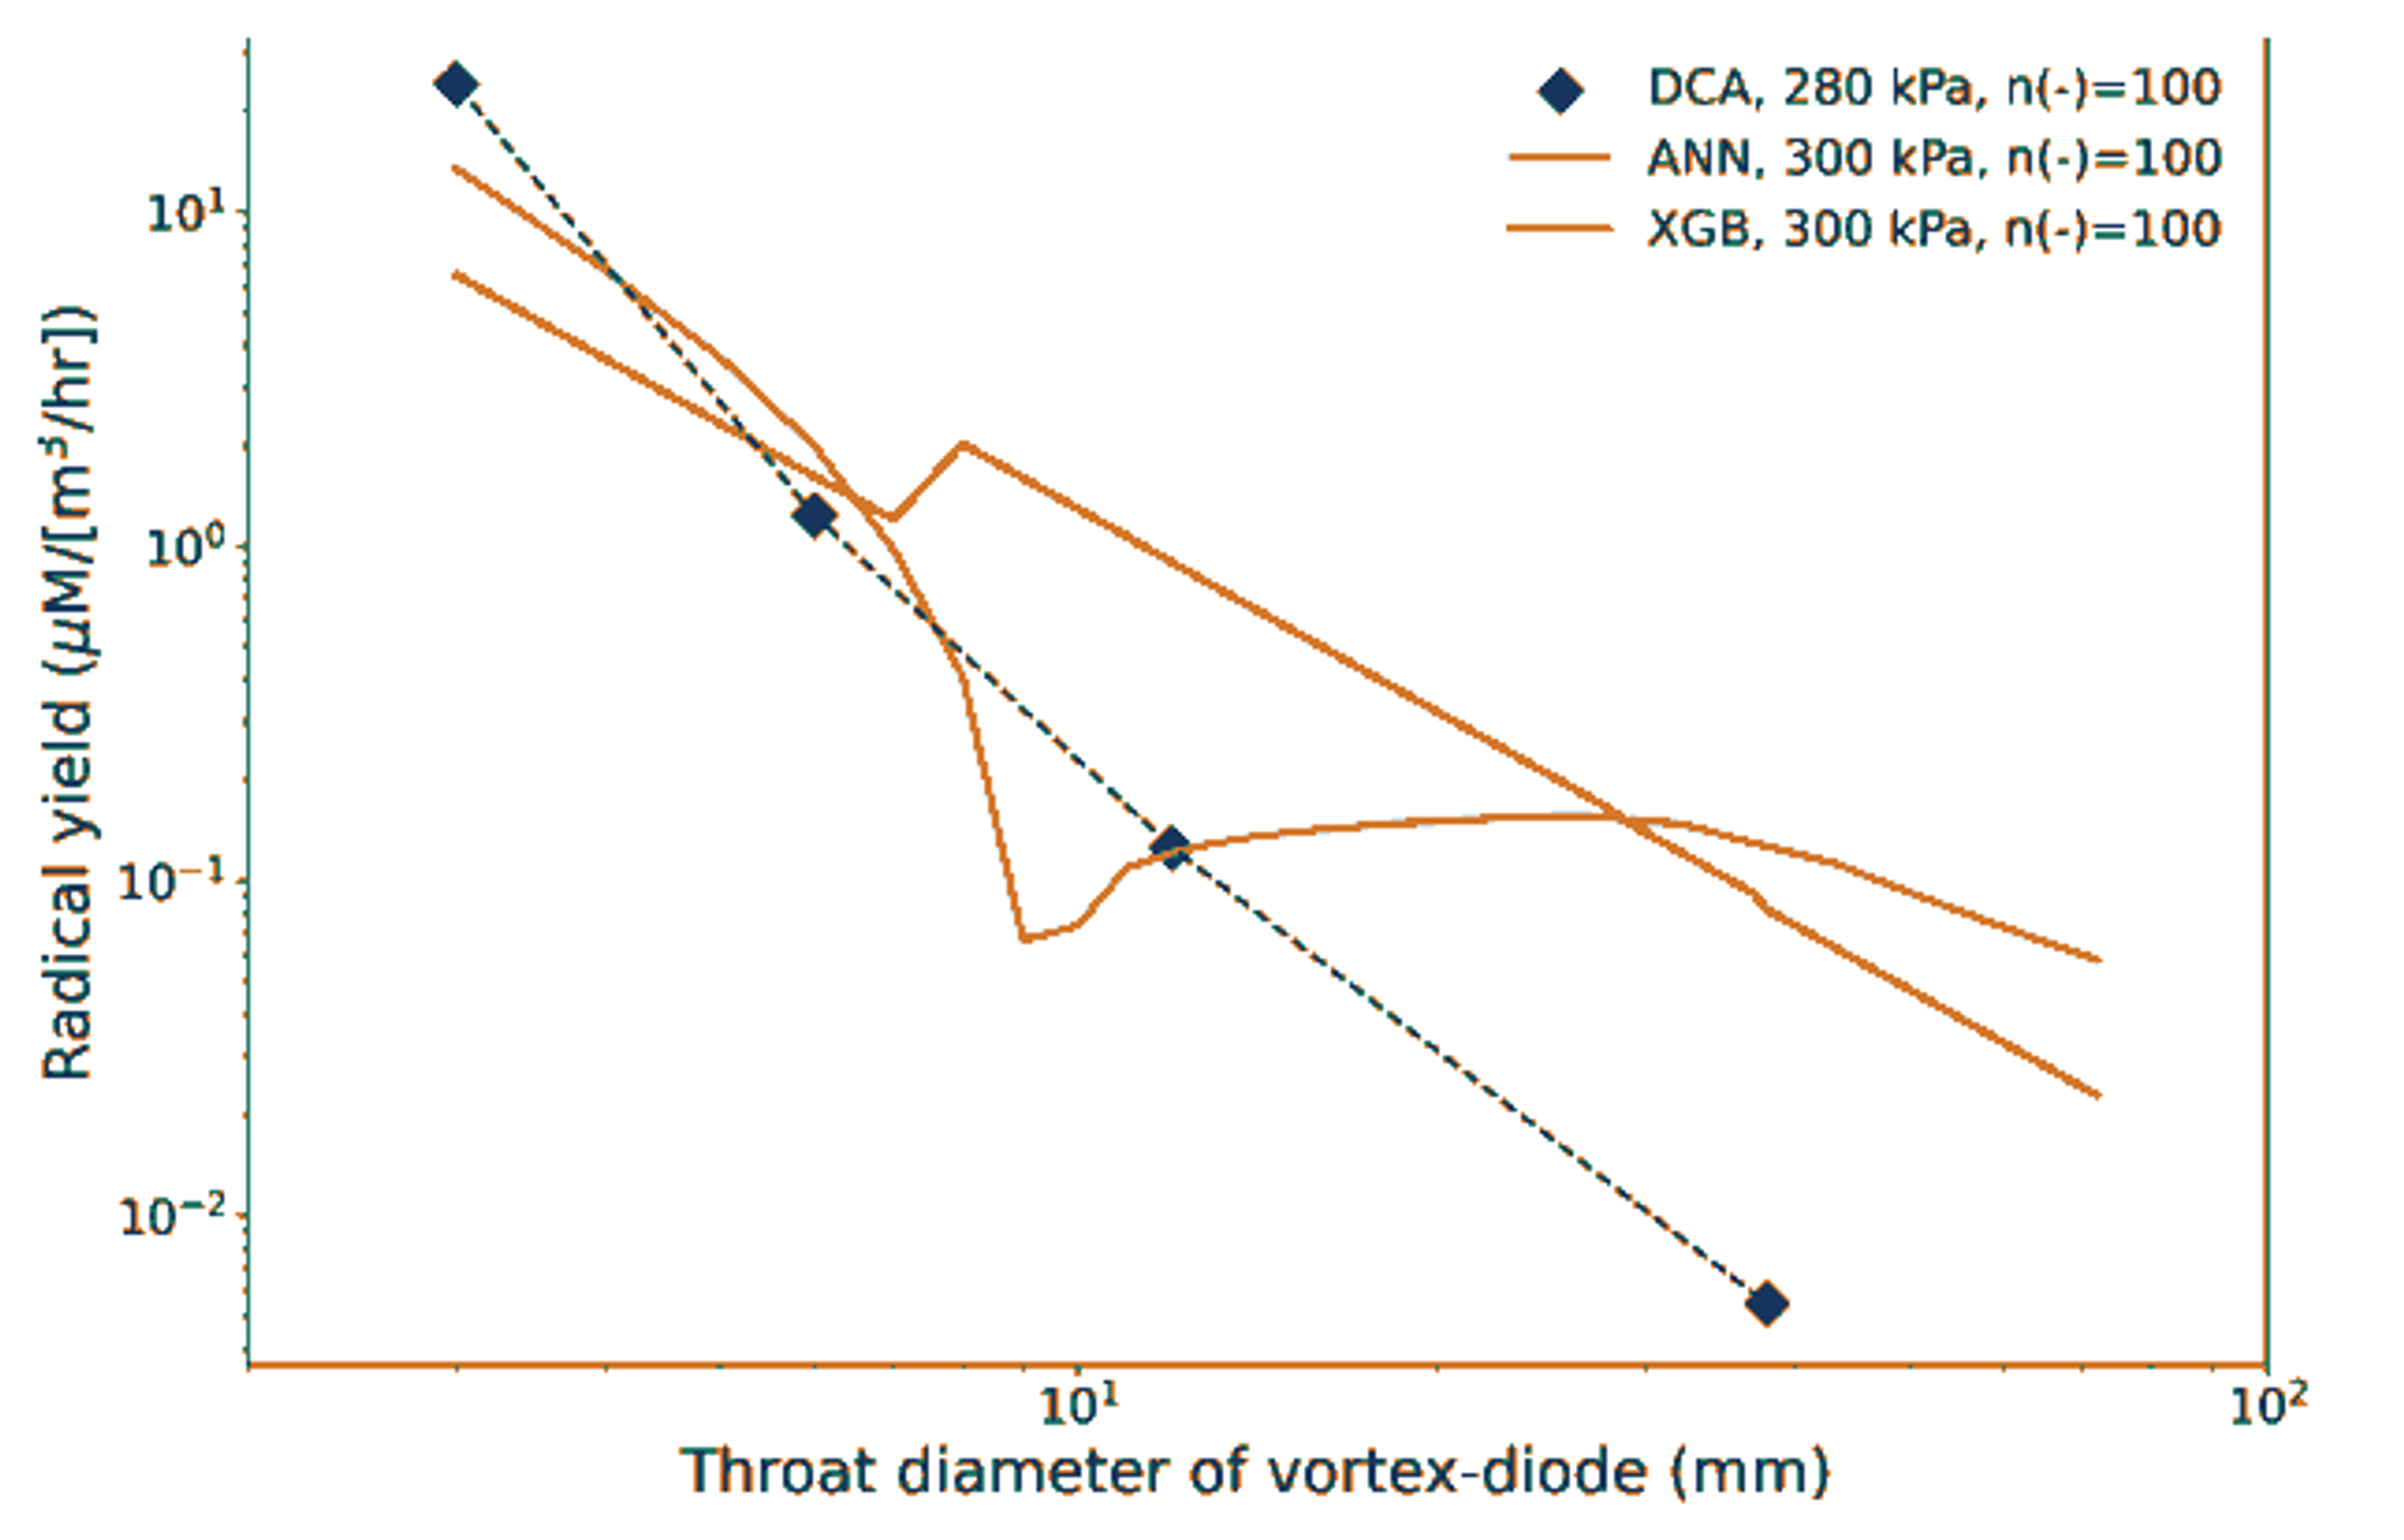
Figure 14.12. Relationship between vortex device throat diameter and radical yield. [71].
These studies establish a practical scale up rule: geometric similarity and constant pressure drop are insufficient. Scale up must preserve or compensate for the distributions of residence time, minimum pressure, pressure fluctuations, specific dissipation, bubble population, and collapse frequency. Numbering up smaller devices may be preferable when radical efficiency is the governing objective, while a larger unit may still be superior when solids handling, maintenance, and throughput dominate the process economics.
14.6 Luminescence and thermal diagnostics
Luminescence can indicate energetic excitation, but it must be interpreted cautiously. Lockett and Bonifacio observed a blue violet emission in an optically accessible model diesel injector return valve above an upstream pressure of about 180 bar and obtained a stable signal at 240 bar [73]. The mean spectrum contained broad maxima near 351, 370, 390, 410, 431, and 457 nm. The authors assigned contributions to aromatic electronic transitions and species including H, CH, C₂, and C₃, but they also argued that the steady spatial location was consistent with triboelectric or electrokinetic excitation rather than classical bubble cloud sonoluminescence. The observation therefore supports energetic chemistry in the high pressure nozzle while also demonstrating that visible light is not, by itself, proof of a hot bubble core.
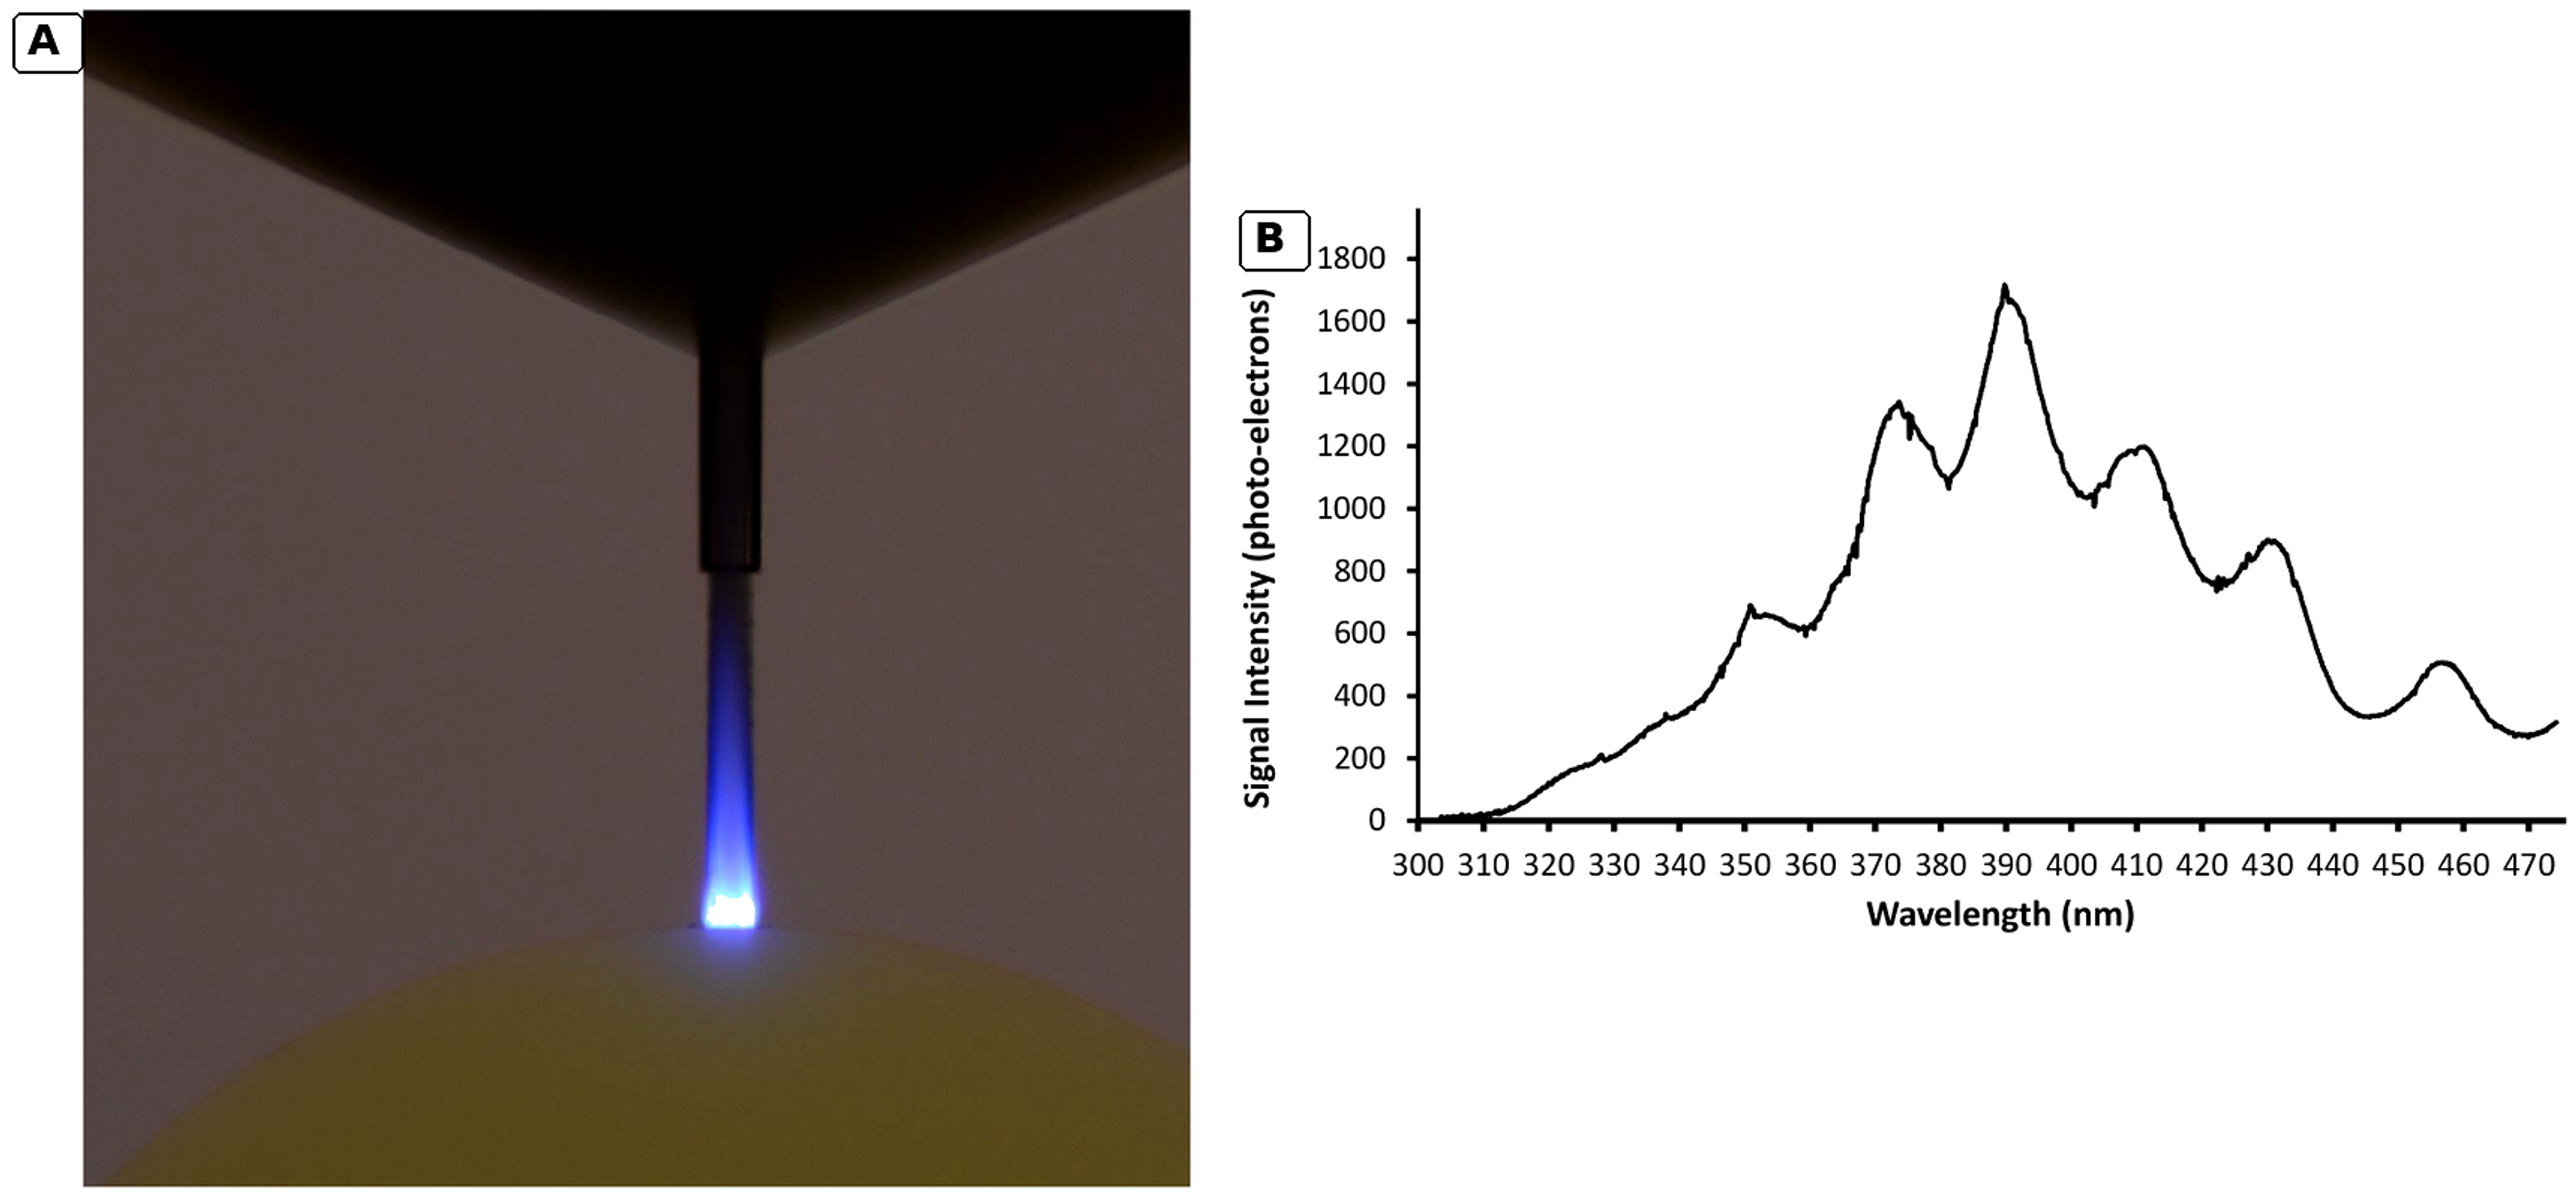
Figure 14.13. Hydrodynamic luminescence in a model diesel injector return valve and its mean spectrum. [73].
Thermal imaging can resolve a different part of the cavitation cycle. Osterman and coworkers used high speed infrared thermography at a water and silicon interface and measured local cooling associated with bubble growth [74]. The reported temperature depression reached approximately 0.3 K as a cold front developed and relaxed. This is a macroscopic interfacial thermal delay measurement, not a direct measurement of the nanosecond collapse temperature. It complements hot spot models by showing that evaporation removes latent heat before collapse and that the reactor can remain nearly isothermal in the bulk while containing extreme local events.
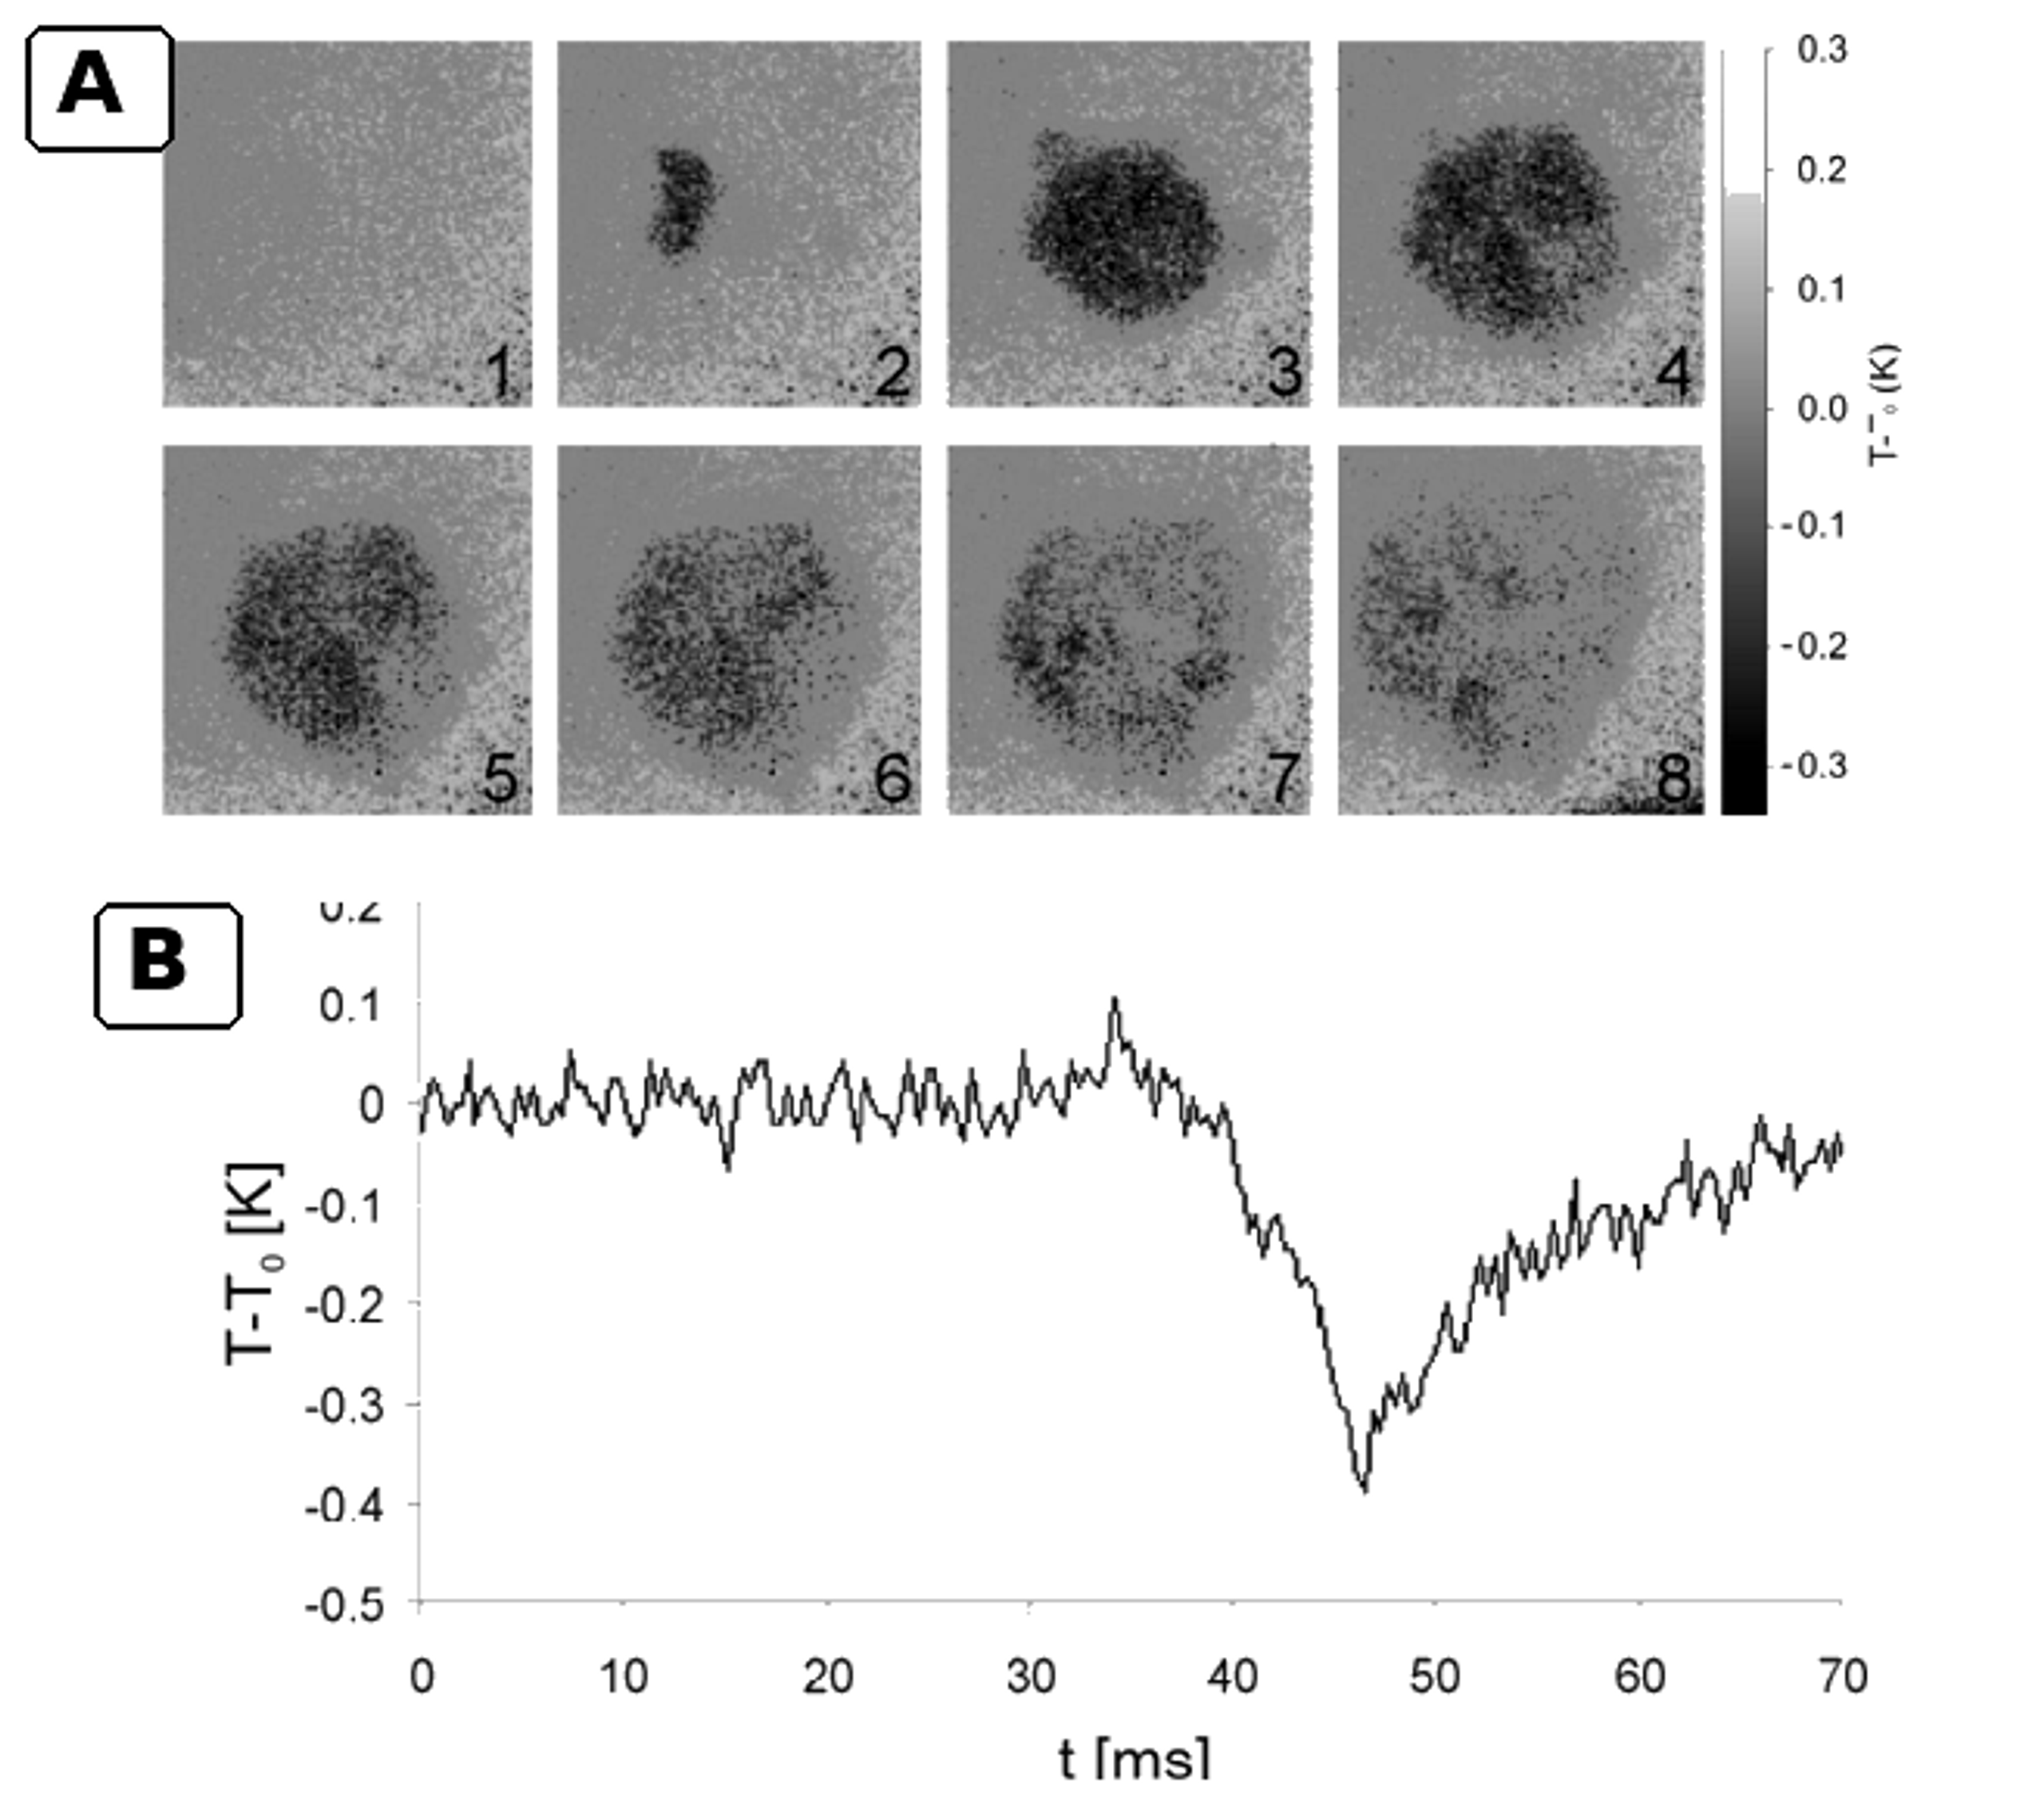
Figure 14.14. Infrared thermography of cavitation associated local cooling during bubble growth. [74].
14.7 Inorganic test programs supplied for this article
The provided technical reports [75-76] describe two complementary inorganic testing programs: iodide oxidation and sulfite oxidation. The iodide oxidation program employed UV visible spectral calibration of triiodide near 353 nm, multiple passes, controlled pressure, and energy normalized release calculations. The sulfite oxidation program utilized a nitrogen purged loop to suppress uncontrolled oxidation by atmospheric oxygen; residual sulfite was measured, and sulfate formation and oxidation efficiency were calculated. These reports are valuable for revealing practical issues often absent from journal reviews, including background signal correction, sampling, loop volume changes, heat exchanger loading, filtration, calibration drift, gas purging, and the distinction between per pass rates and rates per unit time.
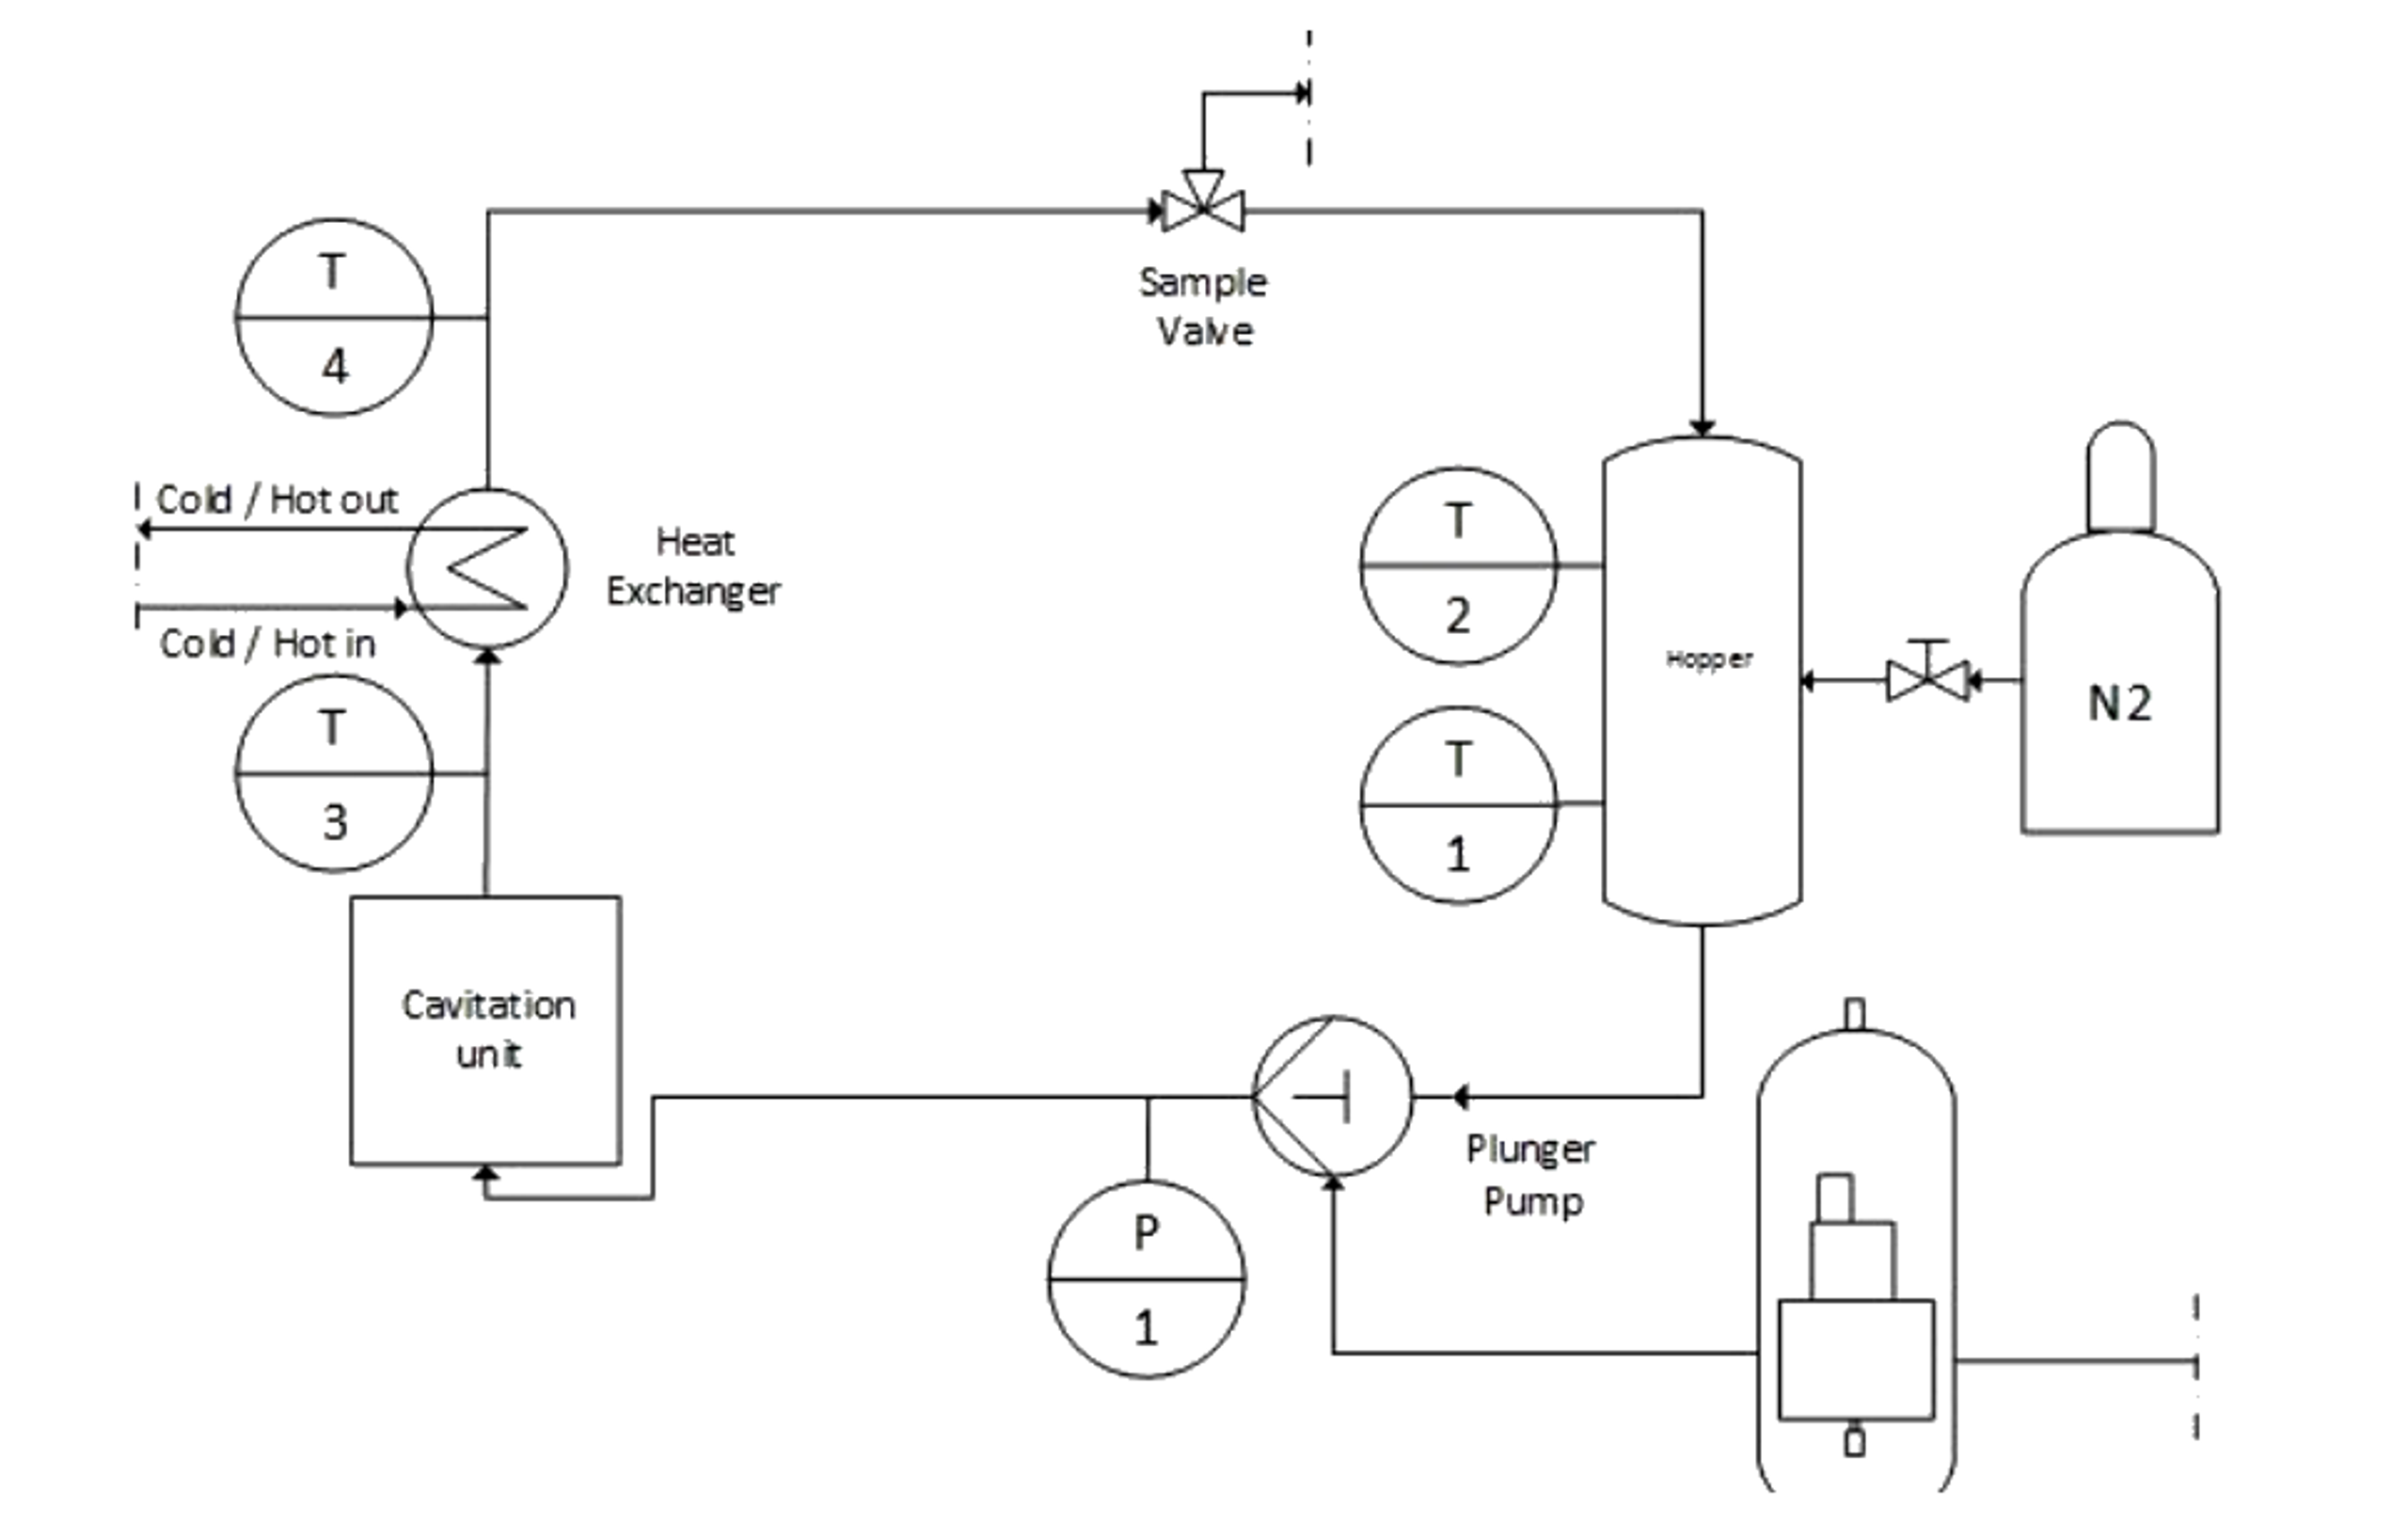
Figure 14.15. Nitrogen purged hydrodynamic cavitation loop used for sulfite oxidation measurements [76].
The supplied cavitating jet studies by Hutli and coworkers provide high speed and intensified camera records of jet morphology, cloud breakup, and discrete luminescence spots associated with bubble collapse [77-78]. Figure 14.16 presents a high contrast grayscale composite prepared from those records. The image processing removes the blue display background and increases contrast without adding, deleting, or relocating flow or luminescence features. These observations remain qualitative and should be related to chemical measurements only when pressure, nozzle geometry, exposure time, dissolved gas condition, and liquid temperature are matched.
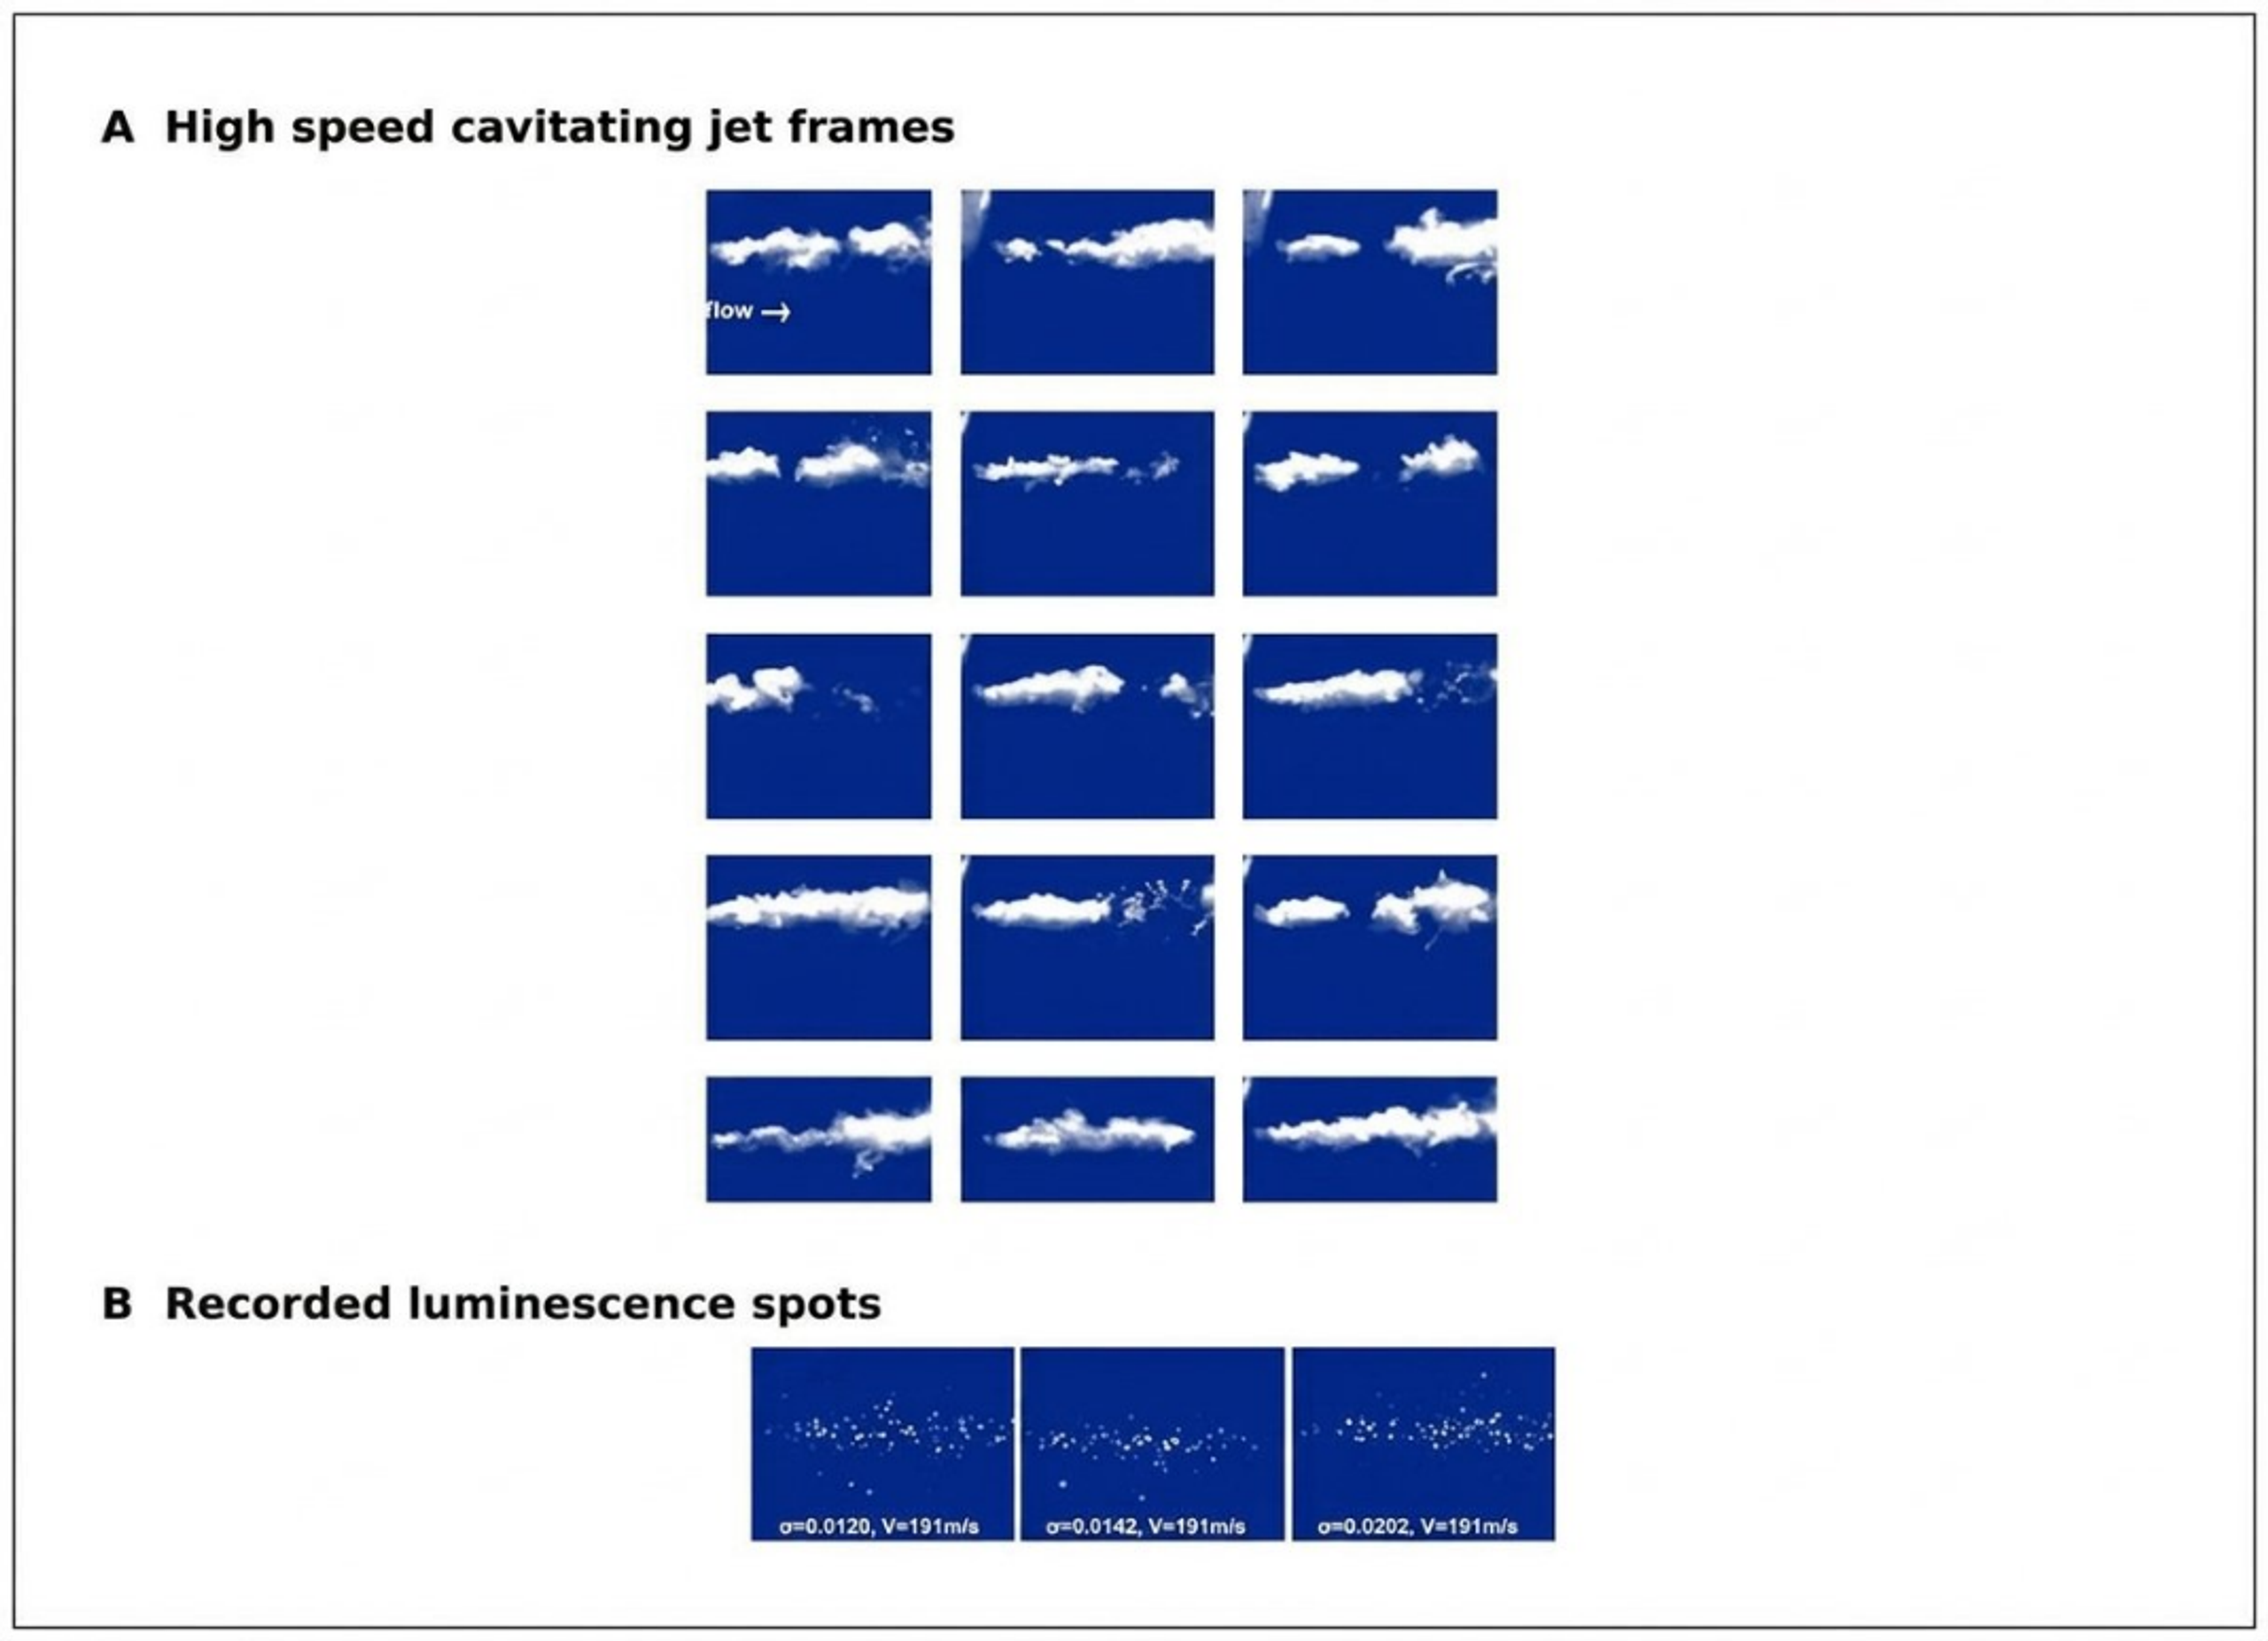
Figure 14.16. High speed cavitating jet frames and discrete luminescence spots recorded under submerged jet operation. [77], [78].
Table 14.1. Experimental evidence relevant to the design and validation of hydrodynamic sonochemical reactors
| Source and system | Measured evidence | Representative result | Engineering interpretation |
|---|---|---|---|
| Suslick et al. [4], high pressure microfluidizer | Iodide oxidation versus pressure, gas composition, and temperature | Threshold near 150 bar; rate decreased as gas thermal conductivity and liquid temperature increased | Supports hot spot analogy and demonstrates gas and vapor control |
| Kozyuk [16], controlled flow patent | Defined constriction and downstream pressure recovery zone | Local velocity at least 16 m s⁻¹ and pressure recovery claim of at least 0.85 kg cm⁻² | Separates cavity generation from collapse and supports multistage design |
| Pawar et al. [11], three Venturis and an orifice | CFD, single bubble model, high speed imaging, iodide dosimetry | Highest yield for orifice, 0.165 mg I₂ kJ⁻¹ | Dense cloud interaction can reduce net chemistry despite high vapor volume |
| Amin et al. [67], high pressure nozzle reactor | Salicylic acid hydroxylation by HPLC | Optimum probe concentration 750 ppm; no detected product below 100 psi | Probe concentration and apparatus threshold must be calibrated |
| Nöpel et al. [68], free jet reactor | Spatial luminol chemiluminescence | Luminous area increased with pressure and orifice diameter; volume organized by hydraulic power | Optical imaging locates chemistry but does not replace chemical yield |
| Rajoriya et al. [70], Venturi plus oxidants | Rh6G decolorization, TOC, LC MS | 100% decolorization with HC ozone; 84% TOC removal under a higher pressure, longer run | Distinguish chromophore destruction from mineralization and include oxidant energy |
| Khare and Ranade [72], vortex device scale study | Validated CFD across throat diameters and velocities | Cavitation extent and specific dissipation decreased with scale | Constant energy per mass does not preserve local cavitation conditions |
| Pang et al. [71], multiscale coumarin datasets | 7-hydroxycoumarin and ML interpretation | Radical yield per energy generally decreased as throat diameter increased | Use number of passes and scale aware models; consider numbering up |
| Lockett and Bonifacio [73], diesel nozzle | High speed luminescence and spectroscopy | Blue violet emission above about 180 bar with multiple spectral maxima | Luminescence may include electrokinetic excitation; do not equate all light with sonoluminescence |
| Osterman et al. [74], infrared thermography | Local interfacial temperature field | Cooling up to about 0.3 K during bubble growth | Quantifies thermal delay, not collapse core temperature |
| Technical iodide report [75] | Triiodide UV Vis calibration, passes, pressure, energy calculations | Documents blank correction, sample loss, and energy normalization | Useful protocol template; independent replication and uncertainty analysis required |
| Technica sulfite report [76] | Nitrogen purged loop, residual sulfite, sulfate production | Controls atmospheric oxygen and reports oxidation per pass and per joule | Gas exclusion and closed sampling are essential for oxidation dosimetry |
14.8 Integrated validation protocol
The preceding evidence supports a minimum validation protocol for a new hydrodynamic sonochemical reactor. First, characterize the hydraulic field with pressure, flow, temperature, and a stated cavitation number definition. Second, confirm the location and extent of the cavity population using imaging, acoustics, or void fraction measurements. Third, apply a chemically appropriate dosimeter at a validated concentration and include blanks, radical scavengers, and noncavitating hydraulic controls. Fourth, quantify the target compound, intermediates, mineralization, and off gas when relevant. Fifth, report hydraulic energy, electrical energy, auxiliary oxidant energy, and treatment throughput. Finally, repeat the experiment across the proposed scale up variable and report uncertainty. A reactor that satisfies only one or two of these steps may still be useful, but its mechanism and transferability remain uncertain.
15 Conclusions
Hydrodynamic cavitation can induce the same fundamental sonochemical reactions associated with acoustic cavitation because both methods create bubbles that grow under reduced pressure and collapse under pressure recovery. In water, the core chemistry begins with water vapor dissociation to H• and •OH, followed by oxygen, peroxide, nitrogen, inorganic ion, and organic radical networks. The forcing mechanism is different, however. Acoustic cavitation uses periodic sound pressure, whereas hydrodynamic cavitation convects bubbles through a spatial pressure field. This distinction changes bubble exposure, cloud structure, residence time, energy delivery, and scale up.
The experimental record summarized in Section 14 confirms that no single pressure, cavitation number, or visible cloud criterion can predict chemical performance across geometries and scales. Productive operation requires an evidence chain from pressure history to bubble population, collapse, chemical signal, process conversion, and energy normalized yield.
Ideal adiabatic relations demonstrate the enormous potential for compression heating and the sensitivity to the heat capacity ratio of the gas. They are upper bounds. Water vapor, heat transfer, condensation, dissociation, finite molecular volume, internal shocks, and nonspherical collapse lower and redistribute the peak state. Gas type and gas concentration affect both the intensity of each collapse and the number of active bubbles. Argon can support strong hot spots, helium can conduct heat away rapidly, oxygen promotes oxidative pathways, nitrogen creates competing high temperature chemistry, carbon dioxide damps collapse and changes carbonate chemistry, and excessive gas loading cushions the event.
The most productive hydrodynamic cavitation regime is generally an intermediate process window rather than maximum visible vapor. Device geometry determines pressure minimum, residence below vapor pressure, bubble density, recovery gradient, and collapse location. Orifices, Venturis, vortex devices, rotor stator machines, microfluidic channels, and multistage controlled flow devices can all be effective when matched to the required mechanism. Chemical yield must be measured with a defined dosimeter and normalized to a clearly stated energy boundary. Hydraulic measurements, gas condition, temperature, bubble field observations, and product analysis are required for credible interpretation.
In inorganic systems, cavitation activates peroxide and persulfate, modifies halide and carbonate chemistry, assists reduction and precipitation, and can intensify crystallization and materials synthesis. In organic systems, volatility and interfacial location determine whether pyrolysis, radical oxidation, or bulk reaction dominates. Many industrial applications, including water treatment, disinfection, sludge and biomass pretreatment, emulsification, biodiesel, desulfurization, brewing, ethanol production, crystallization, and catalyst fabrication, derive their value from coupled mechanical and chemical effects rather than from radicals alone.
Future progress depends on standardized reporting, multiscale modeling, controlled gas composition, quantitative bubble population measurements, erosion and contamination control, and whole process energy analysis. The central design objective is not to create the largest cavitation cloud. It is to produce the greatest number of chemically productive collapses at the required throughput, transfer the resulting species or interfacial work to the target before recombination, and integrate the cavitation stage with the reaction, separation, and safety requirements of the complete process.
Table 15.1. Condensed design rules for sonochemical hydrodynamic cavitation
| Design rule | Rationale |
|---|---|
| Define the pressure time history, not only the inlet pressure | Bubble growth and collapse depend on minimum pressure, duration, fluctuations, and recovery. |
| Optimize chemical yield rather than vapor volume | Dense clouds can shield bubbles and increase radical recombination. |
| Control gas composition and temperature | Gas heat capacity, thermal conductivity, vapor loading, and oxygen chemistry set the hot spot. |
| Use at least one chemical dosimeter and one physical cavitation indicator | Neither pressure drop nor target conversion alone proves radical activity. |
| Report hydraulic and whole system energy | Device mol/J and plant economics use different boundaries. |
| Separate direct chemistry from mechanical process intensification | Emulsification, cell disruption, and surface renewal may dominate conversion. |
| Place collapse in a durable and replaceable zone | Off wall recovery reduces erosion, contamination, and geometry drift. |
| Evaluate hybrid reagents with matched component controls | Apparent synergy can result from unequal energy, temperature, or dose. |
| Scale by pressure history, exposure distribution, gas condition, and energy density | Geometric similarity or cavitation number alone is insufficient. |
| Design downstream hold, quench, and separation with the cavitation device | Long lived oxidants and unstable emulsions continue to affect product after collapse. |
Nomenclature
Symbols are listed in the form used in this article. Where a symbol can carry more than one conventional meaning, the applicable definition is stated immediately after the equation in which it appears.
| Symbol | Definition | SI unit |
|---|---|---|
| A | Pre exponential factor in the Arrhenius equation | varies |
| Optical absorbance at wavelength λ | dimensionless | |
| Radiating area of an acoustic source | m² | |
| b | Optical path length | m or cm |
| C | Concentration; context specific | mol m⁻³ or kg m⁻³ |
| C* | Equilibrium solubility | mol m⁻³ or kg m⁻³ |
| Concentration of target species A | mol m⁻³ | |
| Triiodide concentration | mol m⁻³ | |
| Dc | Conceptual collapse exposure density | J m⁻³ |
| E(t) | Residence time distribution function | s⁻¹ |
| Activation energy | J mol⁻¹ | |
| Mean energy associated with one active collapse | J | |
| Energy supplied within the stated system boundary | J | |
| Mass specific energy dose | J kg⁻¹ | |
| Volumetric energy dose | J m⁻³ | |
| EEO | Electrical energy per order | kWh m⁻³ order⁻¹ |
| Eu | Euler number | dimensionless |
| Fractional removal per pass | dimensionless | |
| g | Gravitational acceleration | m s⁻² |
| HA | Henry law constant under the stated convention | varies |
| h | Effective hard core radius of compressed gas | m |
| Iac | Nominal acoustic intensity | W m⁻² |
| J | Nucleation rate | m⁻³ s⁻¹ |
| J₀ | Nucleation pre exponential factor | m⁻³ s⁻¹ |
| Bubble to liquid distribution factor | dimensionless | |
| k | Reaction rate constant | varies |
| Apparent rate constant | s⁻¹ for first order form | |
| Boltzmann constant | J K⁻¹ | |
| Observed pseudo first order rate constant | s⁻¹ | |
| m | Treated liquid or slurry mass | kg |
| M | Third body in gas phase reaction | - |
| n | Polytropic exponent or amount of substance, as defined locally | dimensionless or mol |
| Moles of noncondensable gas in a bubble | mol | |
| Moles of vapor in a bubble | mol | |
| Moles of chemical product j | mol | |
| N | Number of passes or events, as defined | dimensionless |
| Number of chemically active collapses | dimensionless | |
| Mean number of loop passes | dimensionless | |
| p | Static pressure | Pa |
| Total pressure inside a bubble | Pa | |
| Selected downstream or reference pressure | Pa | |
| Noncondensable gas partial pressure | Pa | |
| Vapor pressure or vapor partial pressure | Pa | |
| Far field liquid pressure | Pa | |
| P | Power on the stated basis | W |
| Acoustic power delivered to the liquid | W | |
| Electrical power | W | |
| Hydraulic power dissipated across the cavitating element | W | |
| Q | Volumetric flow rate | m³ s⁻¹ |
| Heat transfer rate into the bubble gas | W | |
| R | Instantaneous bubble radius | m |
| R₀ | Reference or initial bubble radius | m |
| Maximum bubble radius | m | |
| Minimum bubble radius | m | |
| Universal gas constant | J mol⁻¹ K⁻¹ | |
| r | Reaction rate or radial coordinate, as defined locally | varies |
| Effective gas core reaction rate | mol m⁻³ s⁻¹ | |
| Effective interfacial reaction rate | mol m⁻³ s⁻¹ | |
| Effective bulk liquid reaction rate | mol m⁻³ s⁻¹ | |
| Supersaturation ratio | dimensionless | |
| S | Surface tension when used in the bubble equation | N m⁻¹ |
| Hybrid process synergy factor | dimensionless | |
| t | Time or treatment time | s |
| Rayleigh collapse time | s | |
| T | Temperature | K |
| T₀ | Initial or reference temperature | K |
| Peak idealized bubble temperature | K | |
| u | Characteristic liquid velocity | m s⁻¹ |
| U | Internal energy of bubble contents | J |
| V | Volume | m³ |
| Working liquid volume in a recirculating loop | m³ | |
| Selected reactor volume | m³ | |
| Treated liquid volume | m³ | |
| Molecular volume in nucleation theory | m³ molecule⁻¹ | |
| W | Compression work | J |
| Liquid phase mole fraction of species A | dimensionless | |
| Gas phase mole fraction of species i | dimensionless | |
| Cavitational chemical yield | mol J⁻¹ or stated product mass J⁻¹ | |
| z | Elevation | m |
| Throat or minimum passage flow area | m² | |
| CE | Cavitation extent, defined on the stated vapor volume and power basis | W⁻¹ or stated dimensionless form |
| Characteristic throat diameter | m or mm | |
| Eu | Euler number on the stated pressure and velocity basis | dimensionless |
| Characteristic turbulence or pressure fluctuation frequency in the cavitation zone | s⁻¹ or kHz | |
| Inlet pressure to the hydrodynamic cavitation device | Pa | |
| Downstream or outlet pressure from the device | Pa | |
| Reynolds number based on throat diameter and velocity | dimensionless | |
| or | Characteristic throat velocity | m s⁻¹ |
| Maximum tangential velocity in a vortex device | m s⁻¹ | |
| Vapor volume within the defined cavitation zone | m³ | |
| [7OHC] | Concentration of 7-hydroxycoumarin used as a hydroxyl radical indicator | mol m⁻³ or µM |
Units shown are the preferred SI form. Analytical conventions such as L mol⁻¹ cm⁻¹ may be retained when standard for the method.
Greek Letters
| Symbol | Name | Definition | SI unit |
|---|---|---|---|
| alpha | Gas thermal diffusivity | m² s⁻¹ | |
| γ | gamma | Heat capacity ratio c_p/c_v or polytropic exponent when specified | dimensionless |
| gamma | Effective heat capacity ratio of a gas mixture | dimensionless | |
| gamma | Solid liquid interfacial energy | J m⁻² | |
| delta | Gibbs energy change associated with product or useful reaction j | J mol⁻¹ | |
| delta | Enthalpy change of reaction r | J mol⁻¹ | |
| Δp | delta | Pressure drop or collapse driving pressure | Pa |
| epsilon | Molar absorptivity at wavelength λ | m² mol⁻¹ or L mol⁻¹ cm⁻¹ | |
| eta | Chemical energy efficiency | dimensionless | |
| eta | Motor efficiency | dimensionless | |
| eta | Pump efficiency | dimensionless | |
| λ | lambda | Optical wavelength | m or nm |
| μ | mu | Dynamic viscosity | Pa s |
| ρ | rho | Liquid density | kg m⁻³ |
| σ | sigma | Cavitation number | dimensionless |
| Σ | sigma | Summation over species or reactions | - |
| chi | Mole fraction of noncondensable gas in gas plus vapor bubble contents | dimensionless | |
| alpha | Local vapor volume fraction | dimensionless | |
| ΔT | delta | Temperature change relative to a reference condition | K |
| epsilon | Dimensionless vapor volume or vapor volume scaling quantity | dimensionless | |
| θ | theta | Characteristic vibrational temperature when used in molecular heat capacity models | K |
| omega | Volume averaged specific dissipation frequency or modeled turbulence frequency in the cavitation zone | s⁻¹ |
A dot above a variable denotes a time derivative. A superscript dot before a chemical species denotes an unpaired electron and therefore a radical.
Bibliography
[1] Brennen, C. E. Cavitation and Bubble Dynamics. New York: Oxford University Press; 1995.
[2] Franc, J.-P., and Michel, J.-M. Fundamentals of Cavitation. Dordrecht: Kluwer Academic Publishers; 2004. doi: 10.1007/1-4020-2233-6.
[3] Suslick, K. S. Sonochemistry. Science. 1990;247(4949):1439-1445. doi: 10.1126/science.247.4949.1439.
[4] Suslick, K. S., Mdleleni, M. M., and Ries, J. T. Chemistry induced by hydrodynamic cavitation. Journal of the American Chemical Society. 1997;119(39):9303-9304. doi: 10.1021/ja972171i.
[5] Moholkar, V. S., Senthil Kumar, P., and Pandit, A. B. Hydrodynamic cavitation for sonochemical effects. Ultrasonics Sonochemistry. 1999;6(1-2):53-65. doi: 10.1016/S1350-4177(98)00030-3.
[6] Senthil Kumar, P., Kumar, M. S., and Pandit, A. B. Experimental quantification of chemical effects of hydrodynamic cavitation. Chemical Engineering Science. 2000;55(9):1633-1639. doi: 10.1016/S0009-2509(99)00435-2.
[7] Gogate, P. R., and Pandit, A. B. Engineering design methods for cavitation reactors II: hydrodynamic cavitation. AIChE Journal. 2000;46(8):1641-1649. doi: 10.1002/aic.690460815.
[8] Gogate, P. R., and Pandit, A. B. Hydrodynamic cavitation reactors: a state of the art review. Reviews in Chemical Engineering. 2001;17(1):1-85. doi: 10.1515/REVCE.2001.17.1.1.
[9] Gogate, P. R. Cavitation: an auxiliary technique in wastewater treatment schemes. Advances in Environmental Research. 2002;6(3):335-358. doi: 10.1016/S1093-0191(01)00067-3.
[10] Gogate, P. R., and Pandit, A. B. A review and assessment of hydrodynamic cavitation as a technology for the future. Ultrasonics Sonochemistry. 2005;12(1-2):21-27. doi: 10.1016/j.ultsonch.2004.03.007.
[11] Pawar, S. K., Mahulkar, A. V., Pandit, A. B., Roy, K., and Moholkar, V. S. Sonochemical effect induced by hydrodynamic cavitation: comparison of Venturi/orifice flow geometries. AIChE Journal. 2017;63(10):4705-4716. doi: 10.1002/aic.15812.
[12] Capocelli, M., Musmarra, D., Prisciandaro, M., and Lancia, A. Chemical effect of hydrodynamic cavitation: simulation and experimental comparison. AIChE Journal. 2014;60(7):2566-2572. doi: 10.1002/aic.14472.
[13] Sarvothaman, V. P., Simpson, A., and Ranade, V. V. Comparison of hydrodynamic cavitation devices based on linear and swirling flows: degradation of dichloroaniline in water. Industrial & Engineering Chemistry Research. 2020;59(30):13841-13847. doi: 10.1021/acs.iecr.0c02125.
[14] Ranade, V. V., Sarvothaman, V. P., Simpson, A., and Nagarajan, S. Scale up of vortex based hydrodynamic cavitation devices: a case of degradation of dichloroaniline in water. Ultrasonics Sonochemistry. 2021;70:105295. doi: 10.1016/j.ultsonch.2020.105295.
[15] Golshaei, R., Davoudian, S. H., Toyran, E., Kestek, E., Kaur, A., Priyadarshi, A., Kosar, A., Tzanakis, I., and Ghorbani, M. Novel concept of hydroxyl radical generation in hydrodynamic cavitation on a chip. Chemical Engineering Journal. 2025;517:164356. doi: 10.1016/j.cej.2025.164356.
[16] Kozyuk, O. V. Method and apparatus for conducting sonochemical reactions and processes using hydrodynamic cavitation. U.S. Patent 5,937,906. Issued August 17, 1999.
[17] Kozyuk, O. V. Device and method for creating hydrodynamic cavitation in fluids. US Patent 7,207,712 B2. Issued April 24, 2007.
[18] Panda, D., Saharan, V. K., and Manickam, S. Controlled hydrodynamic cavitation: a review of recent advances and perspectives for greener processing. Processes. 2020;8(2):220. doi: 10.3390/pr8020220.
[19] Bang, J. H., and Suslick, K. S. Applications of ultrasound to the synthesis of nanostructured materials. Advanced Materials. 2010;22(10):1039-1059. doi: 10.1002/adma.200904093.
[20] Carpenter, J., George, S., and Saharan, V. K. Low pressure hydrodynamic cavitating device for producing highly stable oil in water emulsion: effect of geometry and cavitation number. Chemical Engineering and Processing, Process Intensification. 2017;116:97-104. doi: 10.1016/j.cep.2017.02.013.
[21] Ramirez Cadavid, D. A., Kozyuk, O., and Michel, F. C. Jr. Improvement in commercial scale dry mill corn ethanol production using controlled flow cavitation and cellulose hydrolysis. Biomass Conversion and Biorefinery. 2014;4:211-224. doi: 10.1007/s13399-013-0103-5.
[22] Ramirez Cadavid, D. A., Kozyuk, O., Lyle, P., and Michel, F. C. Jr. Effects of hydrodynamic cavitation on dry mill corn ethanol production. Process Biochemistry. 2016;51(4):500-508. doi: 10.1016/j.procbio.2016.01.001.
[23] Michel, F. C. Jr., and Kozyuk, O. Hydrodynamic cavitation processing. In: Letcher, T. M., Scott, J. L., and Patterson, D. A., editors. Chemical Processes for a Sustainable Future. Cambridge: Royal Society of Chemistry; 2015. p. 84-142. doi: 10.1039/BK9781849739757-00084.
[24] Storey, B. D., and Szeri, A. J. Water vapor, sonoluminescence and sonochemistry. Proceedings of the Royal Society A. 2000;456(1999):1685-1709. doi: 10.1098/rspa.2000.0582.
[25] McNamara, W. B. III, Didenko, Y. T., and Suslick, K. S. Sonoluminescence temperatures during multi bubble cavitation. Nature. 1999;401:772-775. doi: 10.1038/44536.
[26] Didenko, Y. T., and Suslick, K. S. The energy efficiency of formation of photons, radicals and ions during single bubble cavitation. Nature. 2002;418:394-397. doi: 10.1038/nature00895.
[27] Yasui, K., Tuziuti, T., Sivakumar, M., and Iida, Y. Optimum bubble temperature for the sonochemical production of oxidants. Ultrasonics. 2004;42(1-9):579-584. doi: 10.1016/j.ultras.2003.12.005.
[28] Okitsu, K., Suzuki, T., Takenaka, N., Bandow, H., Nishimura, R., and Maeda, Y. Acoustic multibubble cavitation in water: a new aspect of the effect of a rare gas atmosphere on bubble temperature and its relevance to sonochemistry. Journal of Physical Chemistry B. 2006;110(41):20081-20084. doi: 10.1021/jp064598u.
[29] Suslick, K. S., Eddingsaas, N. C., Flannigan, D. J., Hopkins, S. D., and Xu, H. Extreme conditions during multibubble cavitation: sonoluminescence as a spectroscopic probe. Ultrasonics Sonochemistry. 2011;18(4):842-846.
[30] Fang, X., Mark, G., and von Sonntag, C. OH radical formation by ultrasound in aqueous solutions. Part I: the chemistry underlying the terephthalate dosimeter. Ultrasonics Sonochemistry. 1996;3(1):57-63. doi: 10.1016/1350-4177(95)00032-1.
[31] McLean, J. R., and Mortimer, A. J. A cavitation and free radical dosimeter for ultrasound. Ultrasound in Medicine & Biology. 1988;14(1):59-64. doi: 10.1016/0301-5629(88)90164-0.
[32] Merouani, S., Ferkous, H., Hamdaoui, O., Rezgui, Y., and Guemini, M. A method for predicting the number of active bubbles in sonochemical reactors. Ultrasonics Sonochemistry. 2015;22:51-58. doi: 10.1016/j.ultsonch.2014.07.015.
[33] Rayleigh, Lord. On the pressure developed in a liquid during the collapse of a spherical cavity. Philosophical Magazine. 1917;34(200):94-98. doi: 10.1080/14786440808635681.
[34] Plesset, M. S. The dynamics of cavitation bubbles. Journal of Applied Mechanics. 1949;16(3):277-282. doi: 10.1115/1.4009975.
[35] Ranade, V. V. Modeling of hydrodynamic cavitation reactors: reflections on present status and path forward. ACS Engineering Au. 2022;2(6):461-476. doi: 10.1021/acsengineeringau.2c00025.
[36] Luo, J., and Niu, Z. Jet and shock wave from collapse of two cavitation bubbles. Scientific Reports. 2019;9:1352. doi: 10.1038/s41598-018-37868-x.
[37] Fattahi, K., Boffito, D. C., and Robert, E. Quantifying the chemical activity of cavitation bubbles in a cluster. Scientific Reports. 2024;14:7978. doi: 10.1038/s41598-024-56906-5.
[38] Koda, S., Kimura, T., Kondo, T., and Mitome, H. A standard method to calibrate sonochemical efficiency of an individual reaction system. Ultrasonics Sonochemistry. 2003;10(3):149-156. doi: 10.1016/S1350-4177(03)00084-1.
[39] Suslick, K. S., Hammerton, D. A., and Cline, R. E. The sonochemical hot spot. Journal of the American Chemical Society. 1986;108(18):5641-5642. doi: 10.1021/ja00278a055.
[40] Suslick, K. S., and Flint, E. B. Sonoluminescence from non-aqueous liquids. Nature. 1987;330:553-555. doi: 10.1038/330553a0.
[41] Flint, E. B., and Suslick, K. S. The temperature of cavitation. Science. 1991;253(5026):1397-1399. doi: 10.1126/science.253.5026.1397.
[42] Ye, Y. F., Zhu, Y., Lu, N., Wang, X., and Su, Z. Treatment of rhodamine B with cavitation technology: comparison of hydrodynamic cavitation with ultrasonic cavitation. RSC Advances. 2021;11:5096-5106. doi: 10.1039/D0RA07727E.
[43] Kozyuk, O. V. Hydrodynamic cavitation crystallization process. US Patent 7,041,144 B2. Issued May 9, 2006.
[44] Kozyuk, O. V., Myerson, A. S., and Weinberg, R. Hydrodynamic cavitation crystallization device and process. US Patent 7,314,516 B2. Issued January 1, 2008.
[45] Suslick, K. S., Choe, S.-B., Cichowlas, A. A., and Grinstaff, M. W. Sonochemical synthesis of amorphous iron. Nature. 1991;353:414-416. doi: 10.1038/353414a0.
[46] Maddikeri, G. L., Gogate, P. R., and Pandit, A. B. Intensified synthesis of biodiesel using hydrodynamic cavitation reactors based on the interesterification of waste cooking oil. Fuel. 2014;137:285-292. doi: 10.1016/j.fuel.2014.08.013.
[47] Suryawanshi, N. B., Bhandari, V. M., Sorokhaibam, L. G., and Ranade, V. V. A non-catalytic deep desulphurization process using hydrodynamic cavitation. Scientific Reports. 2016;6:33021. doi: 10.1038/srep33021.
[48] Hilares, R. T., dos Santos, J. C., Ahmed, M. A., Jeon, S. H., da Silva, S. S., and Han, J.-I. Hydrodynamic cavitation assisted alkaline pretreatment as a new approach for sugarcane bagasse biorefineries. Bioresource Technology. 2016;214:609-614. doi: 10.1016/j.biortech.2016.05.004.
[49] Petkovsek, M., Mlakar, M., Levstek, M., Strazar, M., Sirok, B., and Dular, M. A novel rotation generator of hydrodynamic cavitation for waste activated sludge disintegration. Ultrasonics Sonochemistry. 2015;26:408-414. doi: 10.1016/j.ultsonch.2015.01.006.
[50] Simpson, A., and Ranade, V. V. Modeling hydrodynamic cavitation in Venturi: influence of Venturi configuration on inception and extent of cavitation. AIChE Journal. 2019;65(1):421-433. doi: 10.1002/aic.16411.
[51] Simpson, A., and Ranade, V. V. 110th anniversary: comparison of cavitation devices based on linear and swirling flows: hydrodynamic characteristics. Industrial & Engineering Chemistry Research. 2019;58(31):14488-14509. doi: 10.1021/acs.iecr.9b02757.
[52] Zheng, H., Zheng, Y., and Zhu, J. Recent developments in hydrodynamic cavitation reactors: cavitation mechanism, reactor design, and applications. Engineering. 2022;19:180-198. doi: 10.1016/j.eng.2022.04.027.
[53] Thanekar, P., and Gogate, P. R. Application of hydrodynamic cavitation reactors for treatment of wastewater containing organic pollutants: intensification using hybrid approaches. Fluids. 2018;3(4):98. doi: 10.3390/fluids3040098.
[54] Pradhan, A. A., and Gogate, P. R. Removal of p nitrophenol using hydrodynamic cavitation and Fenton chemistry at pilot scale operation. Chemical Engineering Journal. 2010;156(1):77-82. doi: 10.1016/j.cej.2009.09.042.
[55] Cao, Y. Synergistic degradation of methylene blue by hydrodynamic cavitation combined with hydrogen peroxide/vitamin C system. ACS Omega. 2024;9(38):39997-40009. doi: 10.1021/acsomega.4c05815.
[56] Bodawar, N., et al. Enhanced degradation of ciprofloxacin hydrochloride using a hybrid advanced oxidation process of hydrodynamic cavitation and ozonation. Chemical Engineering & Technology. 2024. doi: 10.1002/ceat.202300469.
[57] Dular, M., Griessler Bulc, T., Gutierrez Aguirre, I., Heath, E., Kosjek, T., Klemencic, A. K., Oder, M., Petkovsek, M., Racki, N., Ravnikar, M., Sirok, B., Zupanc, M., Zitnik, M., and Kompare, B. Use of hydrodynamic cavitation in (waste)water treatment. Ultrasonics Sonochemistry. 2016;29:577-588. doi: 10.1016/j.ultsonch.2015.10.010.
[58] Saharan, V. K., Badve, M. P., and Pandit, A. B. Degradation of Reactive Red 120 dye using hydrodynamic cavitation. Chemical Engineering Journal. 2011;178:100-107. doi: 10.1016/j.cej.2011.10.018.
[59] Saharan, V. K., Rizwani, M. A., Malani, A. A., and Pandit, A. B. Effect of geometry of hydrodynamically cavitating device on degradation of Orange G. Ultrasonics Sonochemistry. 2013;20(1):345-353. doi: 10.1016/j.ultsonch.2012.08.011.
[60] Lebiocka, M., Montusiewicz, A., Grzadka, E., Pasieczna Patkowska, S., Montusiewicz, J., and Szaja, A. Hydrodynamic cavitation as a method of removing surfactants from real carwash wastewater. Molecules. 2024;29(20):4791. doi: 10.3390/molecules29204791.
[61] Jain, P., Bhandari, V. M., Balapure, K., Jena, J., Ranade, V. V., and Killedar, D. J. Hydrodynamic cavitation using vortex diode: an efficient approach for elimination of pathogenic bacteria from water. Journal of Environmental Management. 2019;242:210-219. doi: 10.1016/j.jenvman.2019.04.057.
[62] Patil, P. N., Gogate, P. R., Csoka, L., Dregelyi Kiss, A., and Horvath, M. Intensification of biogas production using pretreatment based on hydrodynamic cavitation. Ultrasonics Sonochemistry. 2016;30:79-86. doi: 10.1016/j.ultsonch.2015.11.009.
[63] Gedanken, A. Using sonochemistry for the fabrication of nanomaterials. Ultrasonics Sonochemistry. 2004;11(2):47-55. doi: 10.1016/j.ultsonch.2004.01.037.
[64] Kozyuk, O. V. Apparatus and method for producing biodiesel from fatty acid feedstock. US Patent 7,754,905 B2. Issued July 13, 2010.
[65] Albanese, L., Ciriminna, R., Meneguzzo, F., and Pagliaro, M. Beer brewing powered by controlled hydrodynamic cavitation: theory and real scale experiments. Journal of Cleaner Production. 2017;142:1457-1470. doi: 10.1016/j.jclepro.2016.11.162.
[66] Kozyuk, O. V. Method for changing the qualitative and quantitative composition of a mixture of liquid hydrocarbons based on the effects of cavitation. U.S. Patent 5,969,207. Issued October 19, 1999.
[67] Amin, L. P., Gogate, P. R., Burgess, A. E., and Bremner, D. H. Optimization of a hydrodynamic cavitation reactor using salicylic acid dosimetry. Chemical Engineering Journal. 2010;156(1):165-169. doi: 10.1016/j.cej.2009.09.043.
[68] Nöpel, J.-A., Zedler, P., Deggelmann, M., Braeutigam, P., Fröhlich, J., and Rüdiger, F. Experimental investigation of the bubble distribution and chemical reactions induced by hydrodynamic cavitation inside a reactor: a preliminary study. Proceedings of the 5th International Conference on Experimental Fluid Mechanics, Munich, Germany; 2018.
[69] Tandiono, Ohl, S.-W., Ow, D. S. W., Klaseboer, E., Wong, V. V., Dumke, R., and Ohl, C.-D. Sonochemistry and sonoluminescence in microfluidics. Proceedings of the National Academy of Sciences. 2011;108(15):5996-5998. doi: 10.1073/pnas.1019623108.
[70] Rajoriya, S., Bargole, S., and Saharan, V. K. Degradation of a cationic dye, Rhodamine 6G, using hydrodynamic cavitation coupled with other oxidative agents: reaction mechanism and pathway. Ultrasonics Sonochemistry. 2017;34:183-194. doi: 10.1016/j.ultsonch.2016.05.028.
[71] Pang, X., Sarvothaman, V. P., Kulkarni, S. R., Roberts, W. L., and Ranade, V. V. Scale dependent hydroxyl radical generation and energy efficiency in vortex diode hydrodynamic cavitation: machine learning insights toward industrial scale applications in water treatment. Ultrasonics Sonochemistry. 2026;131:107932. doi: 10.1016/j.ultsonch.2026.107932.
[72] Khare, O. V., and Ranade, V. V. Influence of scale on flow and cavitation characteristics of vortex based hydrodynamic cavitation devices. Chemical Engineering Science. 2026;331:124032. doi: 10.1016/j.ces.2026.124032.
[73] Lockett, R. D., and Bonifacio, A. Hydrodynamic luminescence in a model diesel injector return valve. Preprint; 2019. doi: 10.13140/RG.2.2.19156.45447.
[74] Osterman, A., Dular, M., Hočevar, M., and Širok, B. Infrared thermography of cavitation thermal effects in water. Strojniški vestnik, Journal of Mechanical Engineering. 2010;56(9):527-534.
[75] Liberation of iodine by hydrodynamic and ultrasonic cavitation. [Unpublished technical manuscript and supporting data] 2026.
[76] Oxidation of sulfite to sulfate by hydrodynamic and ultrasonic cavitation.[Unpublished technical manuscript and supporting data] 2026.
[77] Hutli, E. A., Nedeljkovic, M., and Ilic, V. Visualization of submerged cavitating jet: Part One, the phenomenon, time synchronization, photo objectives and sonoluminescence. Proceedings of the 16th Australasian Fluid Mechanics Conference, Gold Coast, Australia; 2007:876-880.
[78] Hutli, E., Alteash, O., Ben Raghisa, M., Nedeljkovic, M. S., and Ilic, V. Appearance of high submerged cavitating jet: the cavitation phenomenon and sono luminescence. Thermal Science. 2013;17(4):1151-116
[79] Thaker, A. H., and Ranade, V. V. Emulsions using a vortex based cavitation device: influence of number of passes, pressure drop, and device scale on droplet size distributions. Industrial & Engineering Chemistry Research. 2023;62(45):18837-18851. doi: 10.1021/acs.iecr.2c03714.
[80] Namli, I., Sarraf, S. S., Aghdam, A. S., et al. Hydrodynamic cavitation on a chip: a tool to detect circulating tumor cells. ACS Applied Materials & Interfaces. 2022;14(36):40666-40677. doi: 10.1021/acsami.2c12356.
[81] Kozyuk O. Hydrodynamic Cavitation. [Unpublished technical manuscript and supporting data] 2026.