
Technical publication
Back to publications
Fundamentals
Single Cavitation Bubble Collapse: Phenomena, Theoretical Models, and Thermodynamic Effects
okozyuk.com
Published
Read complete publication for whole-document Find and printing. Browser Find and native printing on this reader include only loaded content.
2. Phenomena Occurring at the Collapse of a Single Cavitation Bubble
2.1 Inertial Focusing, Minimum Volume, and Rebound
At maximum radius, a transient cavitation bubble is nearly at rest, while its internal pressure is generally lower than the recovered pressure of the surrounding liquid. This pressure difference accelerates a substantial mass of liquid toward the bubble center. Because the same radial flow passes through progressively smaller spherical surfaces, the interface speed increases rapidly as the radius decreases. The local kinetic energy density therefore becomes concentrated in a thin region surrounding the bubble.
The ideal Rayleigh solution gives the characteristic collapse velocity scale:
where is the pressure difference available to drive collapse. The mean collapse velocity is of order , which is proportional to . The instantaneous wall velocity can greatly exceed this mean value near the end of collapse. In a real bubble, the minimum radius is established by the rapid rise of internal gas and vapor pressure, liquid compressibility, and deviations from spherical geometry. Pressure work that is not radiated acoustically or transferred to vortical motion is stored temporarily in the compressed bubble contents and subsequently drives rebound [3,4,31].
Rebound is therefore a useful indicator of the energy state at collapse. A large rebound indicates that appreciable energy remains as internal energy or reversible compression. A small rebound is consistent with stronger acoustic radiation, jet formation, fragmentation, viscous loss, or thermal loss. Noncondensable gas has a particularly strong influence because it cannot disappear by condensation on the collapse time scale. Even a small quantity can arrest collapse at a larger radius and strengthen the rebound. Vapor can also cushion collapse when condensation and heat transfer are too slow to remove it.
Collapse and rebound are not exactly periodic. Acoustic radiation removes energy abruptly near the minimum volume, whereas viscosity and thermal conduction dissipate energy throughout the oscillation. Each subsequent rebound is therefore smaller. Laser induced bubbles may undergo several cycles, but the first collapse commonly produces the strongest pressure impulse and the greatest topological change [12,31].
2.2 Shock Wave Emission
A rapidly collapsing spherical bubble behaves approximately as a monopole acoustic source. For small acoustic amplitudes and an observation distance much greater than , the radiated pressure can be estimated by:
The retarded time accounts for propagation at the sound speed. The expression shows that acoustic output depends on wall acceleration as well as wall velocity. During mild oscillation, the acoustic response is a smooth pressure pulse. During violent collapse, nonlinear steepening can transform this pulse into a shock wave, so a linear far field expression becomes only an estimate [3,4].
Several distinct pressure transients may occur. The bubble generation event can produce an initial shock, especially during optical breakdown or electric discharge. A second, and often stronger, transient is emitted at the first collapse. Additional shocks can originate from rebound collapse and from microjet impact on the opposite bubble wall or on a nearby solid boundary. Combined high speed optical and acoustic measurements show that the timing and amplitude of these peaks depend on bubble sphericity and the location of jet impact [12,24,31].
For a nearly spherical collapse, the source is compact and the shock is emitted approximately in all directions. In a nonspherical collapse, several spatially separated shock sources can develop along a toroidal bubble or around fragmented lobes. The measured peak pressure then depends strongly on observation direction and distance. Supponen and coauthors showed that increasing collapse anisotropy redistributes energy away from one strong spherical shock and toward jets and multiple weaker shock sources [24].
Peak shock pressure alone does not determine damaging capability. Material response also depends on pulse duration, loaded area, incidence angle, repeated loading, and solid acoustic impedance. A very high peak acting over a microscopic area can initiate a pit, whereas a lower repeated pressure can contribute to fatigue. The water hammer estimate is frequently used as an upper scale for jet impact pressure:
where is the jet velocity. This estimate should not be interpreted as a universal measured pressure because compliance, entrapped gas, finite impact area, and shock propagation can reduce or redistribute the actual load.
2.3 Asymmetric Collapse and Microjet Formation
Any pressure anisotropy produces a net Kelvin impulse in the surrounding liquid. During bubble growth, the interface may remain nearly spherical because its velocity is modest. During collapse, the same weak asymmetry is amplified as the interface accelerates. The side exposed to the greater pressure impulse indents first, and a reentrant liquid jet crosses the bubble. Near a rigid wall, the jet generally points toward the wall. Near a free surface, it points away from the surface. Buoyancy and externally imposed pressure gradients likewise determine the jet direction [5,6,19-21,23].
Two nondimensional parameters are particularly useful. The standoff parameter for a bubble near a flat wall is:
where is the distance from the bubble center at maximum volume to the wall. A small indicates a strong wall influence. A more general measure of weak pressure gradient anisotropy is:
The parameter is proportional to the normalized Kelvin impulse for several common forcing fields. It enables comparison of bubbles influenced by gravity, nearby boundaries, and imposed pressure gradients on a common basis [20,23]. Supponen and coauthors identified approximate jet regimes corresponding to weak jets for , intermediate jets for , and strong jets for [23]. These thresholds are scaling guides rather than sharp universal boundaries.
When the jet penetrates the opposite side of the bubble, the bubble becomes toroidal. Jet impact can launch a local shock and generate a vortex ring. The toroidal bubble may collapse around its circumference, break into daughter bubbles, or rebound while remaining connected to a wall. These topology changes invalidate a purely spherical radius model, even when an equivalent radius can still be extracted from optical images.
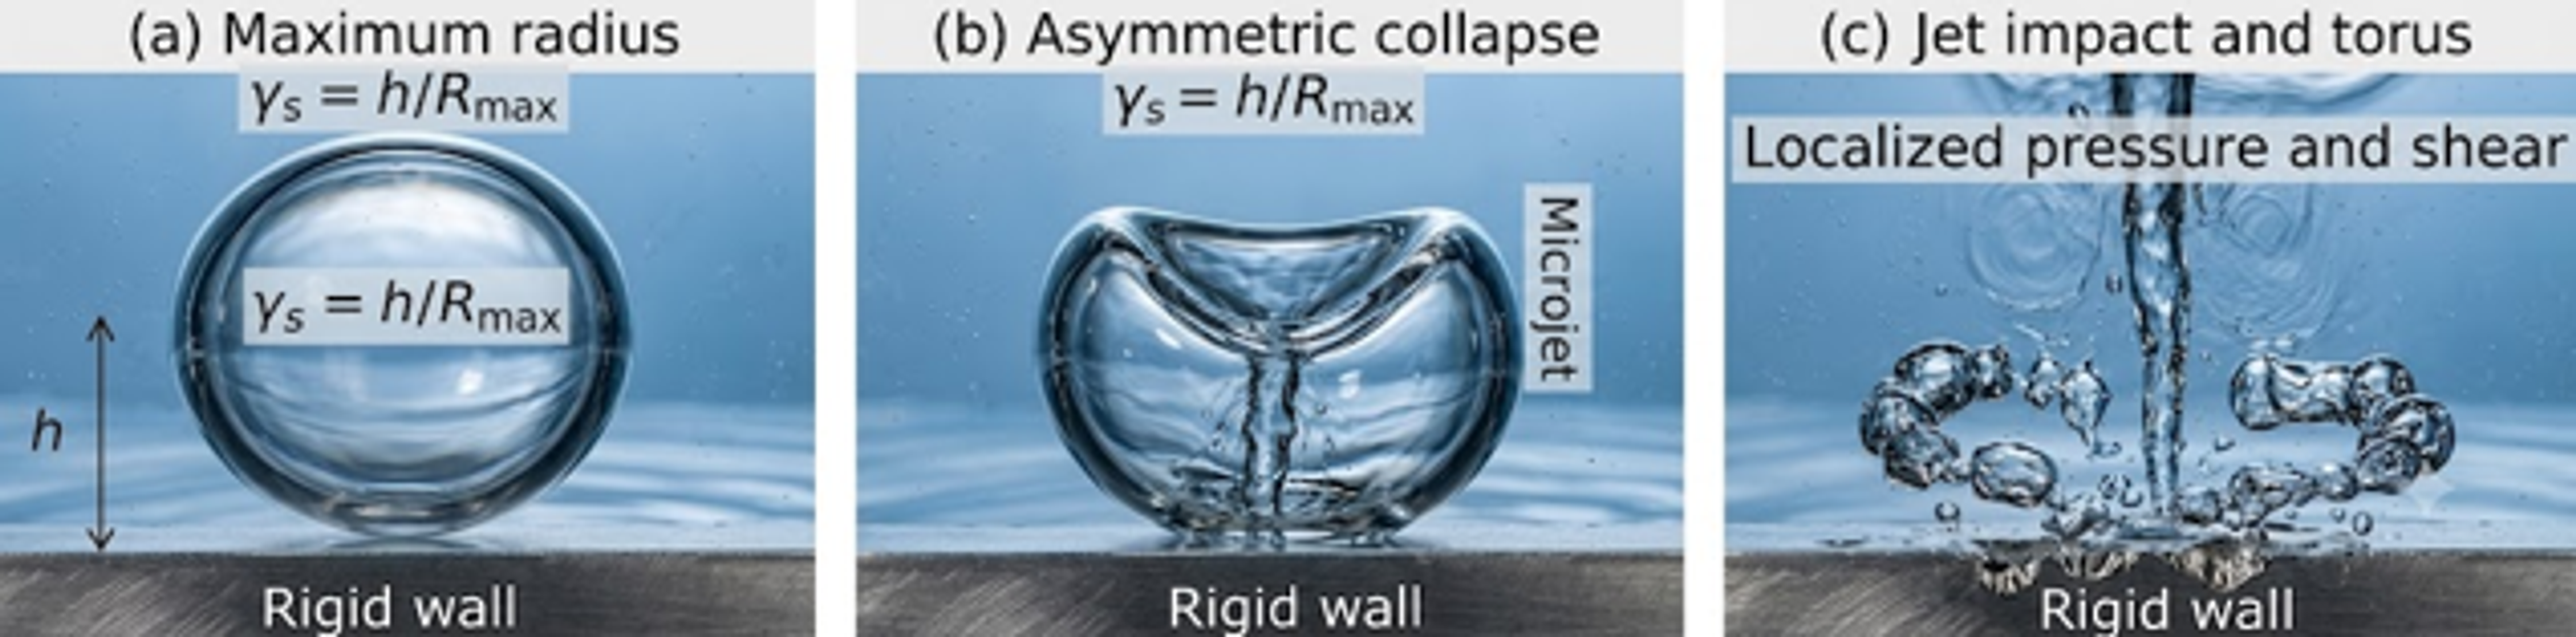
Figure 2. Schematic sequence for a cavitation bubble near a rigid wall. The pressure field drives a jet toward the wall, followed by toroidal collapse and localized loading.[32]
2.4 Material Loading and Cavitation Erosion
Single bubble experiments are valuable because they isolate elementary erosion mechanisms that are obscured in a cavitating cloud. Benjamin and Ellis related bubble collapse near a solid boundary to impulsive pressure [5]. Lauterborn and Bolle resolved the deformation and jetting sequence optically [6]. Philipp and Lauterborn then mapped pit formation as a function of bubble size and standoff distance for individual laser induced bubbles [14]. These studies showed that the most damaging condition is not necessarily the most spherical collapse or the smallest standoff distance. Damage depends on the combined effects of jet impact, toroidal collapse, shock focusing, and the area over which the load acts.
A representative erosion sequence contains several stages. First, the bubble collapses asymmetrically and a jet accelerates toward the wall. Second, the jet penetrates the bubble and impacts either the wall or the liquid layer separating the bubble from the wall. Third, the remaining toroidal bubble collapses and produces additional pressure peaks around an annular region. Fourth, rebound and secondary collapse may impose further loads. If the local stress exceeds the yield strength, a plastic pit can form. Repetition then promotes work hardening, cracking, grain removal, and measurable mass loss.
The bubble scale controls the energy available for loading. The potential energy at maximum radius is approximately:
At fixed pressure, the available energy therefore increases with the cube of . Peak stress and pit geometry, however, also depend on collapse distance and time. Small bubbles can generate intense microscopic loads, whereas larger bubbles affect a wider area. Surface roughness, elastic modulus, yield strength, residual stress, and liquid temperature further modify the resulting damage.
2.5 Thermal, Optical, and Chemical Events
The final compression of a sufficiently spherical bubble can create extreme internal conditions. For an ideal gas undergoing adiabatic compression:
This relation is only a limiting estimate. In real cavitation bubbles, water vapor can dissociate, heat is conducted into the surrounding liquid, shocks can form inside the gas, and composition changes through condensation and chemical reaction. Detailed models consequently predict lower temperatures than a simple adiabatic relation and show strong sensitivity to vapor content [13,16].
Sonoluminescence is a short flash emitted near the minimum radius. Pecha and Gompf measured light pulses on a picosecond time scale, demonstrating that the luminous state is much shorter than the overall bubble oscillation [15]. Flannigan and Suslick observed plasma related emission from single bubbles under suitable conditions [18]. The occurrence and spectrum of the flash depend on gas species, dissolved gas concentration, drive amplitude, water vapor, and bubble stability. Strongly deformed bubbles generally emit less light because the collapse energy is not focused into one compact volume.
Chemical activity develops because high temperature and pressure can dissociate water vapor and dissolved species, producing radicals and reaction products. Didenko and Suslick compared the energy associated with photons, radicals, and mechanical effects and showed that only a fraction of bubble energy appears as chemical or optical output [17]. Storey and Szeri demonstrated theoretically that water vapor can reduce peak temperature substantially through heat capacity, dissociation, and nonequilibrium transport [16]. These processes are directly related to the thermodynamic effects examined in Section 4.
2.6 Energy Partition at Collapse
The initial potential energy is distributed among several outputs rather than converted into a single form. A useful bookkeeping relation is:
The terms cannot always be separated uniquely without a model, and a small residual kinetic energy may remain in the surrounding liquid. Nevertheless, the relation clarifies why reduced shock energy can coincide with a larger rebound or a stronger jet. Tinguely and coauthors measured shock and rebound energies for nearly spherical collapses and identified systematic energy partitioning [22]. Obreschkow and coauthors and Supponen and coauthors extended this framework to jets and anisotropic collapse [20,23,24].
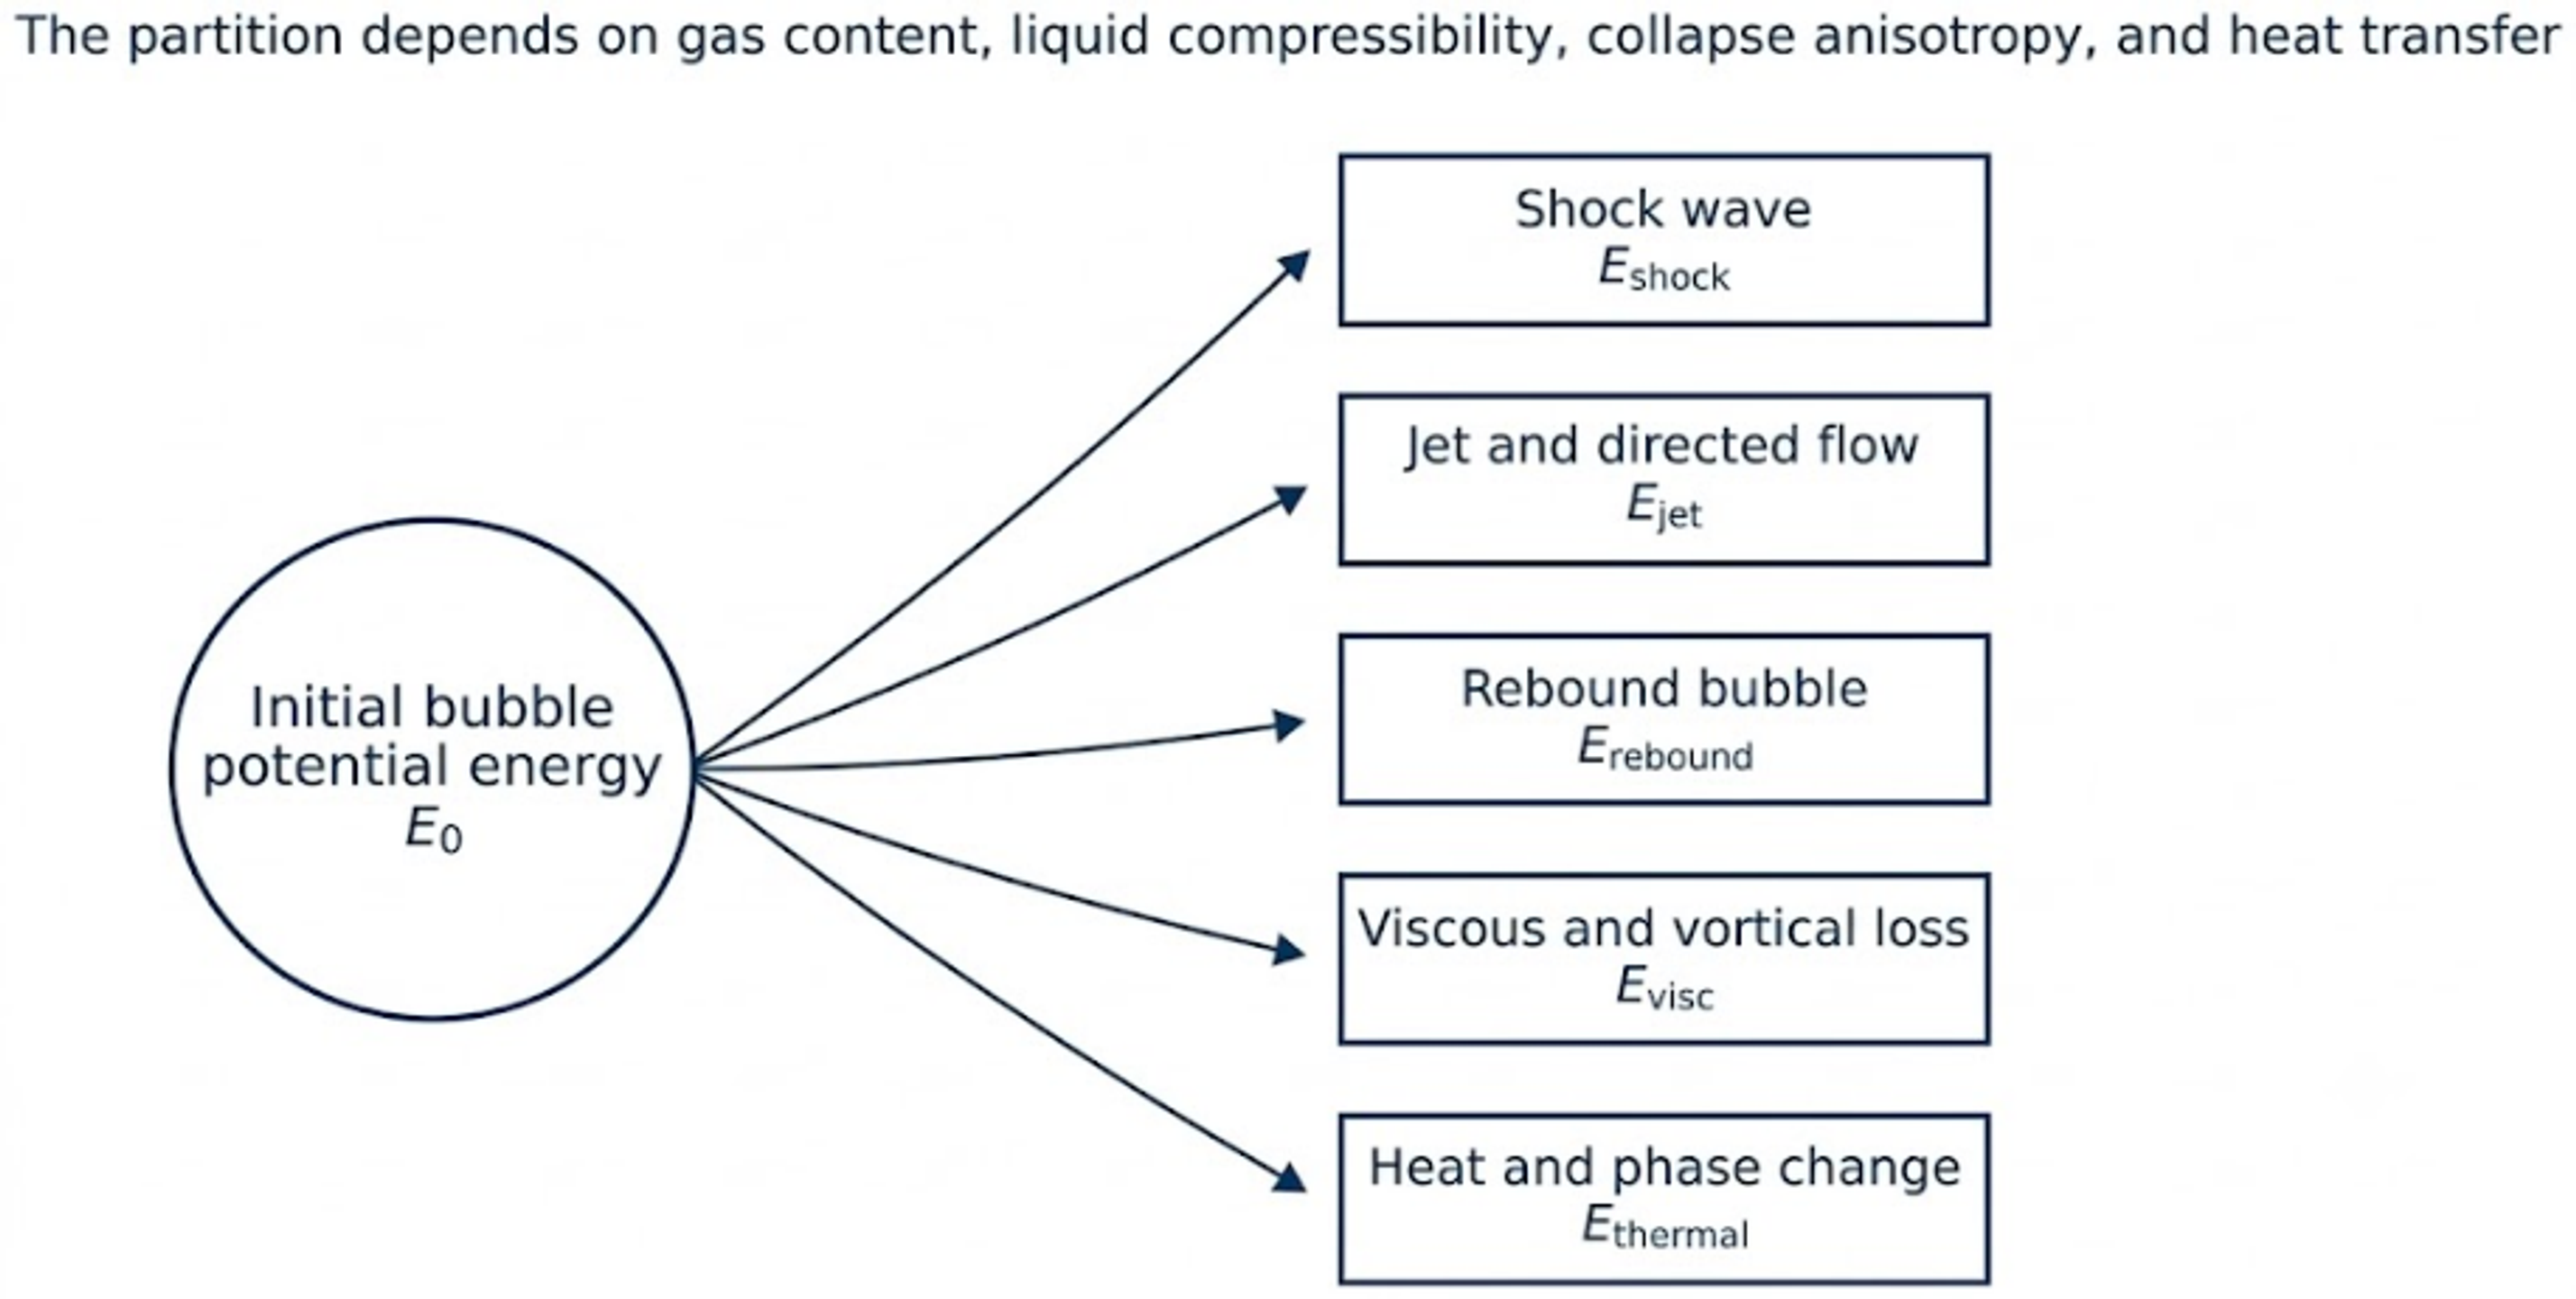
Figure 3. Principal energy pathways during the first collapse. The diagram is conceptual.[32]
Table 1. Main collapse phenomena and their physical consequences.
| Phenomenon | Primary mechanism | Main observable | Engineering or scientific consequence |
|---|---|---|---|
| Rapid radial acceleration | Pressure work and geometric focusing | Strong decrease of and high wall speed | Sets collapse time and velocity scale [1,2] |
| Shock emission | Liquid compressibility and rapid volume acceleration | Short pressure pulse or shock front | Noise, structural loading, energy loss [3,4,12,24,31] |
| Microjet | Collapse anisotropy and Kelvin impulse | Reentrant jet and toroidal bubble | Local impact, shear, pumping, erosion [5,6,14,20,23] |
| Rebound | Compression of permanent gas and retained vapor | Secondary bubble growth | Indicates residual internal energy [4,22,31] |
| Fragmentation | Jet penetration and interface instability | Daughter bubbles and multiple shocks | Distributed loading and enhanced mixing [12,21,24] |
| Heating and chemistry | Rapid gas compression and nonequilibrium reactions | Light emission and radical production | Sonochemistry and material modification [13,15–18] |
| Interfacial cooling or heating | Evaporation, condensation, and latent heat | Local temperature change | Modifies vapor pressure and collapse intensity [25–29] |