Technical publication
Back to publications
Single Cavitation Bubble Collapse: Phenomena, Theoretical Models, and Thermodynamic Effects
okozyuk.com
Published
Single Cavitation Bubble Collapse: Phenomena, Theoretical Models, and Thermodynamic Effects
Abstract
The collapse of a single cavitation bubble is a fundamental hydrodynamic event in which pressure work is concentrated into rapid liquid motion, compression of the bubble contents, shock emission, jet formation, rebound, heat transfer, and phase change. This article reviews the principal collapse phenomena, the governing theoretical models, and the thermodynamic mechanisms that modify bubble dynamics. Classical Rayleigh and Rayleigh Plesset formulations establish the inertial collapse scale, whereas Keller Miksis, Gilmore, and Prosperetti Lezzi equations account for liquid compressibility with increasing physical detail. Boundary integral formulations and compressible multiphase computational fluid dynamics extend the analysis to nonspherical collapse, jet penetration, topology change, and local wall loading. Particular attention is given to thermodynamic feedback caused by evaporation, condensation, latent heat exchange, and temperature dependent saturation pressure. Experimental observations in water, aqueous ammonia, and liquid nitrogen demonstrate that increased vapor content and finite rate phase change can increase minimum bubble radius, reduce collapse velocity, weaken shock and jet intensity, and alter rebound and stability. The analysis emphasizes that model selection must be tied to the required observable and that validation against radius history alone is insufficient when energy partition, peak pressure, interfacial temperature, or material loading is of interest.
1. Introduction
Cavitation is the formation and subsequent evolution of vapor or gas vapor cavities in a liquid when the local pressure becomes sufficiently low. A single cavitation bubble is the simplest experimentally accessible unit of this process. It can be generated by a focused laser pulse, an electric discharge, a rapid pressure reduction, a tensile acoustic pulse, or localized heating. When the pressure recovers, the surrounding liquid accelerates inward and the cavity collapses. The term cavitation bubble is appropriate because a substantial portion of the bubble volume is commonly produced by vaporization of the liquid, although permanent gas and products of the generation process may also be present.
The classical theoretical foundation begins with Rayleigh's analysis of an empty spherical cavity in an incompressible inviscid liquid [1]. Plesset extended the radial dynamics to include bubble pressure, viscosity, and surface tension [2]. These models establish the characteristic inertial time scale and explain the rapid acceleration that occurs during the final stage of collapse. They also contain an ideal mathematical singularity. If the cavity were empty, perfectly spherical, and surrounded by an incompressible liquid, the interface velocity and pressure would diverge as the radius approached zero. Real bubbles are regularized by liquid compressibility, gas compression, vapor condensation, heat transfer, viscosity, and loss of spherical symmetry. Gilmore and Hickling and Plesset demonstrated how compressibility permits pressure wave emission and rebound dynamics to be represented [3,4].
A bubble seldom collapses in a perfectly uniform environment. Gravity, background pressure gradients, neighboring interfaces, and especially nearby solid boundaries introduce anisotropy. The side exposed to the larger pressure impulse moves faster, and a high speed liquid microjet can penetrate the bubble. Early boundary studies established the relation among collapse asymmetry, impulsive pressure, and material damage [5,6]. Thermal theory also showed that the gas response cannot always be represented by a constant polytropic exponent and that heat transfer contributes both stiffness and damping [7]. Compressible radial equations developed by Keller and Miksis, Fujikawa and Akamatsu, and Prosperetti and Lezzi improved the treatment of acoustic radiation, nonequilibrium condensation, and finite sound speed [8-11].
High speed optical and acoustic experiments have resolved the sequence of bubble growth, inertial collapse, shock emission, jetting, rebound, and fragmentation [12]. Under sufficiently strong compression, the bubble interior can reach temperatures and pressures that produce sonoluminescence and chemical reactions. Models and measurements by Yasui, Pecha and Gompf, Storey and Szeri, Didenko and Suslick, and Flannigan and Suslick established that the peak internal state depends strongly on water vapor, heat transfer, ionization, and the duration of the final compression [13-18].
Theoretical analysis has also progressed beyond spherical symmetry. Weakly compressible boundary integral formulations describe bubble migration, deformation, jet penetration, and repeated topology changes [19-21]. Energy measurements and scaling laws relate shock, rebound, and jet energies to the initial potential energy and to a nondimensional anisotropy parameter [20,22-24]. More recent experiments have measured thermal fields around individual bubbles and quantified the effects of ambient temperature, vapor pressure, and cryogenic fluids [25-29]. Saturation property correlations issued by the International Association for the Properties of Water and Steam provide the thermodynamic basis for quantifying the strong increase in water vapor pressure with temperature [30].
The central premise of this article is that bubble collapse is an energy focusing process governed by five coupled mechanisms: inertial liquid motion, liquid compressibility, bubble contents, geometric asymmetry, and thermodynamic exchange. These mechanisms determine how the initial bubble energy is partitioned among shock waves, jets, rebound, vortical motion, heat transfer, phase change, and chemical or optical effects.
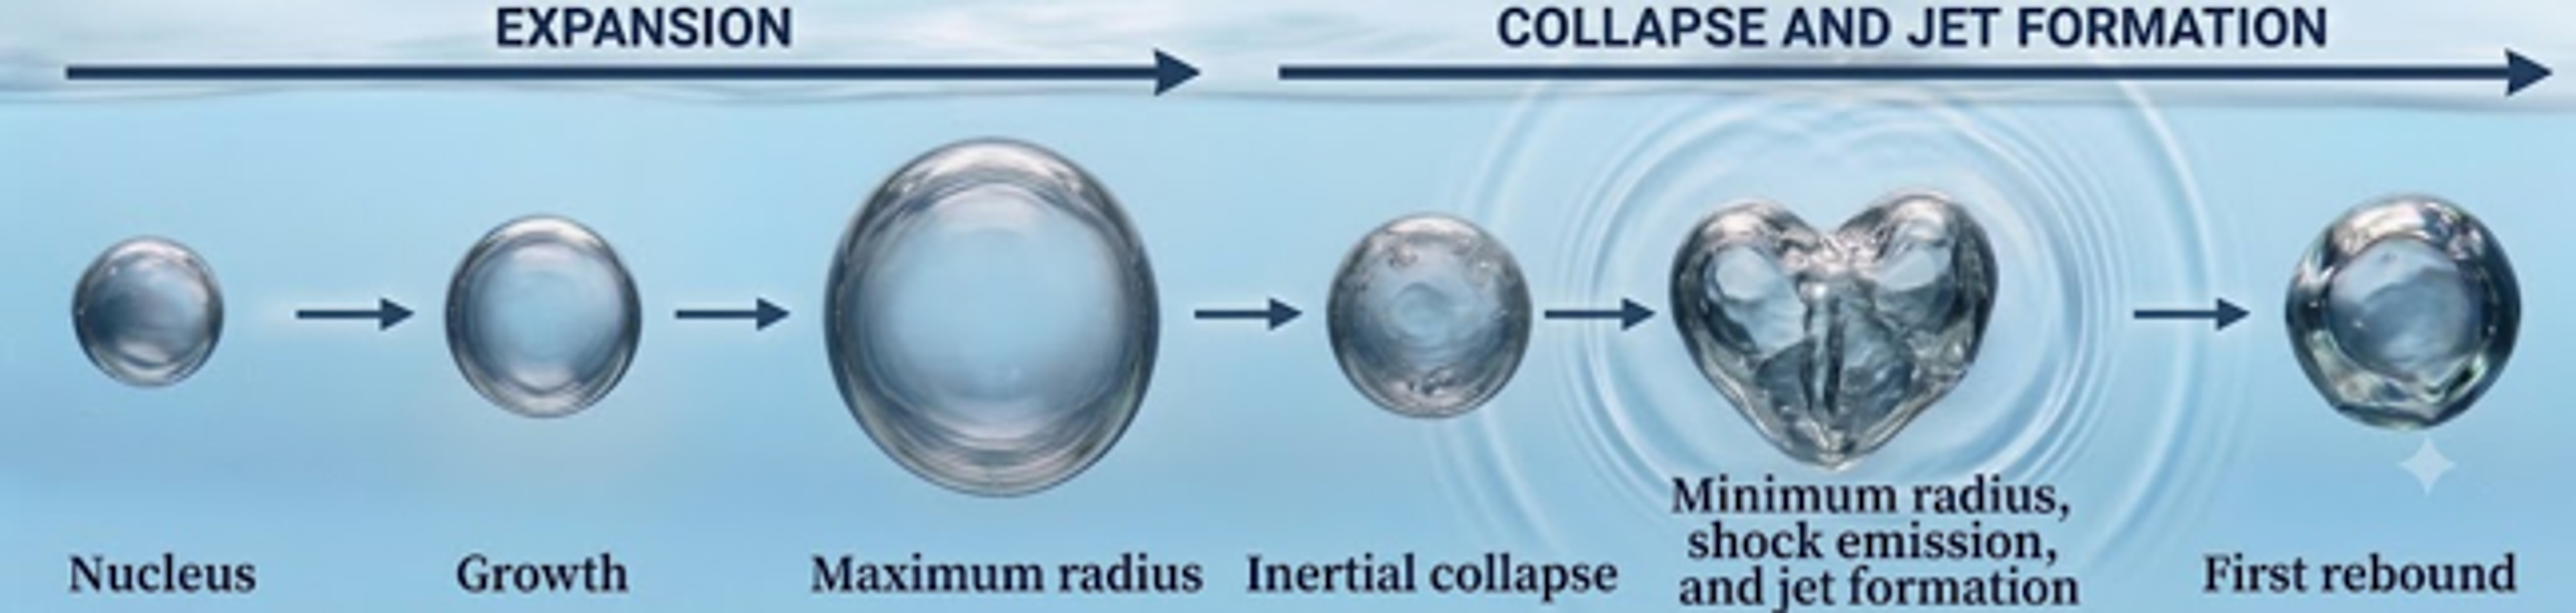
Figure 1. Idealized life cycle of an isolated cavitation bubble.[32]
2. Phenomena Occurring at the Collapse of a Single Cavitation Bubble
2.1 Inertial Focusing, Minimum Volume, and Rebound
At maximum radius, a transient cavitation bubble is nearly at rest, while its internal pressure is generally lower than the recovered pressure of the surrounding liquid. This pressure difference accelerates a substantial mass of liquid toward the bubble center. Because the same radial flow passes through progressively smaller spherical surfaces, the interface speed increases rapidly as the radius decreases. The local kinetic energy density therefore becomes concentrated in a thin region surrounding the bubble.
The ideal Rayleigh solution gives the characteristic collapse velocity scale:
where is the pressure difference available to drive collapse. The mean collapse velocity is of order , which is proportional to . The instantaneous wall velocity can greatly exceed this mean value near the end of collapse. In a real bubble, the minimum radius is established by the rapid rise of internal gas and vapor pressure, liquid compressibility, and deviations from spherical geometry. Pressure work that is not radiated acoustically or transferred to vortical motion is stored temporarily in the compressed bubble contents and subsequently drives rebound [3,4,31].
Rebound is therefore a useful indicator of the energy state at collapse. A large rebound indicates that appreciable energy remains as internal energy or reversible compression. A small rebound is consistent with stronger acoustic radiation, jet formation, fragmentation, viscous loss, or thermal loss. Noncondensable gas has a particularly strong influence because it cannot disappear by condensation on the collapse time scale. Even a small quantity can arrest collapse at a larger radius and strengthen the rebound. Vapor can also cushion collapse when condensation and heat transfer are too slow to remove it.
Collapse and rebound are not exactly periodic. Acoustic radiation removes energy abruptly near the minimum volume, whereas viscosity and thermal conduction dissipate energy throughout the oscillation. Each subsequent rebound is therefore smaller. Laser induced bubbles may undergo several cycles, but the first collapse commonly produces the strongest pressure impulse and the greatest topological change [12,31].
2.2 Shock Wave Emission
A rapidly collapsing spherical bubble behaves approximately as a monopole acoustic source. For small acoustic amplitudes and an observation distance much greater than , the radiated pressure can be estimated by:
The retarded time accounts for propagation at the sound speed. The expression shows that acoustic output depends on wall acceleration as well as wall velocity. During mild oscillation, the acoustic response is a smooth pressure pulse. During violent collapse, nonlinear steepening can transform this pulse into a shock wave, so a linear far field expression becomes only an estimate [3,4].
Several distinct pressure transients may occur. The bubble generation event can produce an initial shock, especially during optical breakdown or electric discharge. A second, and often stronger, transient is emitted at the first collapse. Additional shocks can originate from rebound collapse and from microjet impact on the opposite bubble wall or on a nearby solid boundary. Combined high speed optical and acoustic measurements show that the timing and amplitude of these peaks depend on bubble sphericity and the location of jet impact [12,24,31].
For a nearly spherical collapse, the source is compact and the shock is emitted approximately in all directions. In a nonspherical collapse, several spatially separated shock sources can develop along a toroidal bubble or around fragmented lobes. The measured peak pressure then depends strongly on observation direction and distance. Supponen and coauthors showed that increasing collapse anisotropy redistributes energy away from one strong spherical shock and toward jets and multiple weaker shock sources [24].
Peak shock pressure alone does not determine damaging capability. Material response also depends on pulse duration, loaded area, incidence angle, repeated loading, and solid acoustic impedance. A very high peak acting over a microscopic area can initiate a pit, whereas a lower repeated pressure can contribute to fatigue. The water hammer estimate is frequently used as an upper scale for jet impact pressure:
where is the jet velocity. This estimate should not be interpreted as a universal measured pressure because compliance, entrapped gas, finite impact area, and shock propagation can reduce or redistribute the actual load.
2.3 Asymmetric Collapse and Microjet Formation
Any pressure anisotropy produces a net Kelvin impulse in the surrounding liquid. During bubble growth, the interface may remain nearly spherical because its velocity is modest. During collapse, the same weak asymmetry is amplified as the interface accelerates. The side exposed to the greater pressure impulse indents first, and a reentrant liquid jet crosses the bubble. Near a rigid wall, the jet generally points toward the wall. Near a free surface, it points away from the surface. Buoyancy and externally imposed pressure gradients likewise determine the jet direction [5,6,19-21,23].
Two nondimensional parameters are particularly useful. The standoff parameter for a bubble near a flat wall is:
where is the distance from the bubble center at maximum volume to the wall. A small indicates a strong wall influence. A more general measure of weak pressure gradient anisotropy is:
The parameter is proportional to the normalized Kelvin impulse for several common forcing fields. It enables comparison of bubbles influenced by gravity, nearby boundaries, and imposed pressure gradients on a common basis [20,23]. Supponen and coauthors identified approximate jet regimes corresponding to weak jets for , intermediate jets for , and strong jets for [23]. These thresholds are scaling guides rather than sharp universal boundaries.
When the jet penetrates the opposite side of the bubble, the bubble becomes toroidal. Jet impact can launch a local shock and generate a vortex ring. The toroidal bubble may collapse around its circumference, break into daughter bubbles, or rebound while remaining connected to a wall. These topology changes invalidate a purely spherical radius model, even when an equivalent radius can still be extracted from optical images.
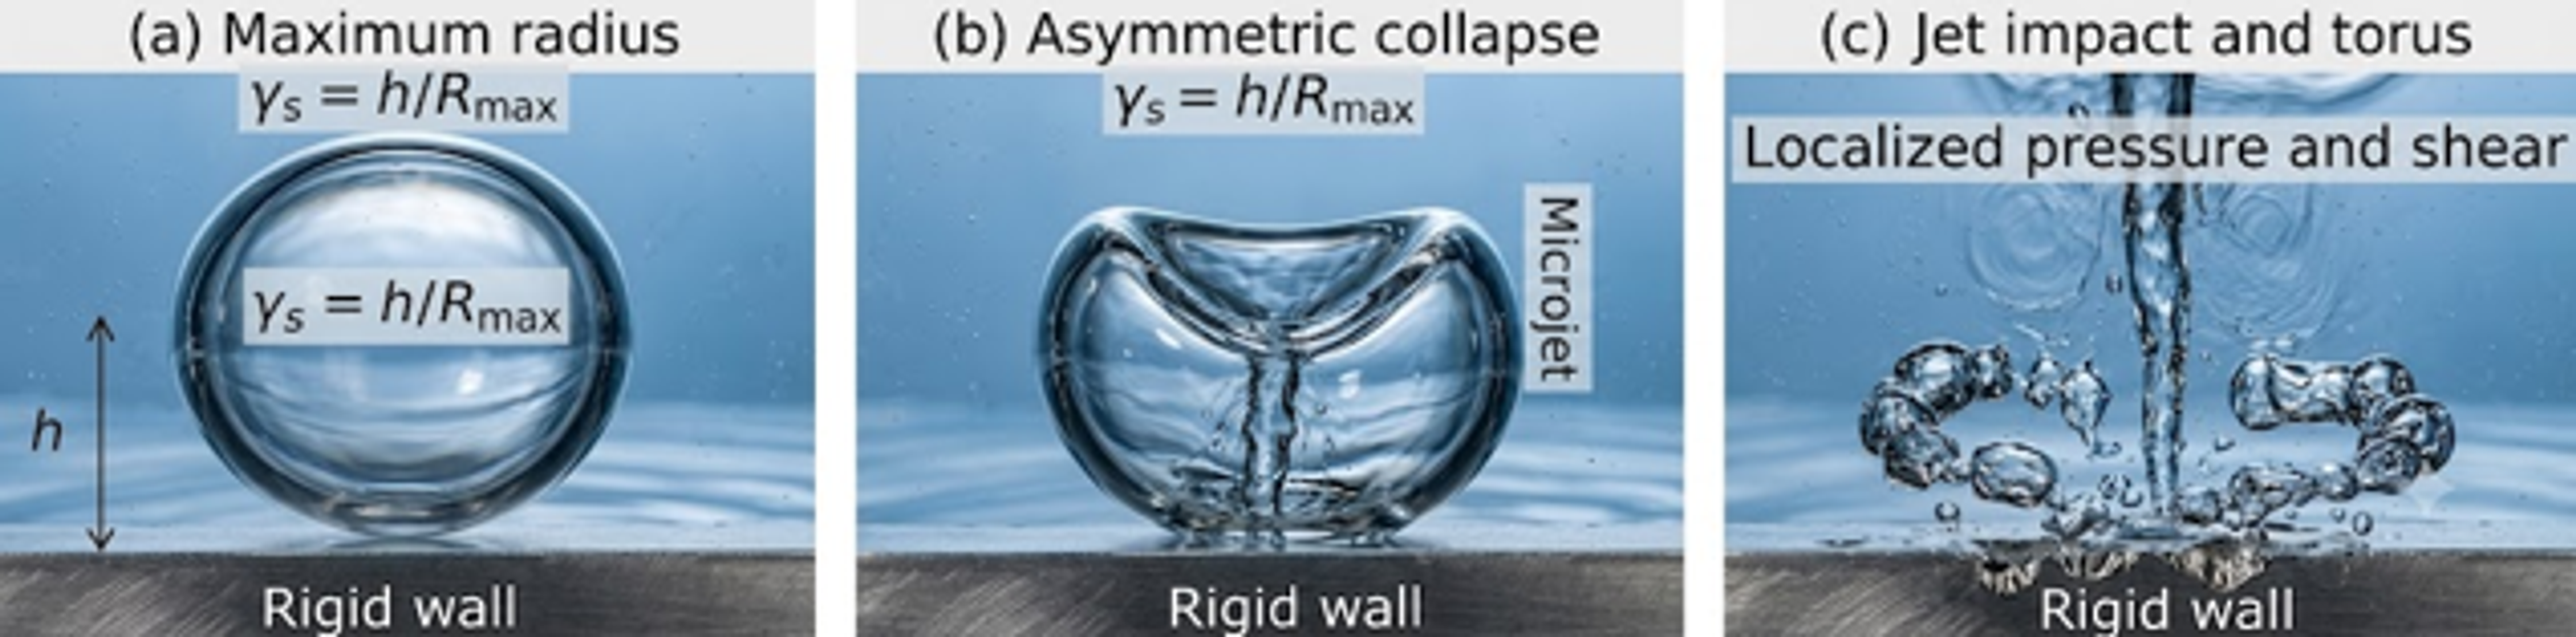
Figure 2. Schematic sequence for a cavitation bubble near a rigid wall. The pressure field drives a jet toward the wall, followed by toroidal collapse and localized loading.[32]
2.4 Material Loading and Cavitation Erosion
Single bubble experiments are valuable because they isolate elementary erosion mechanisms that are obscured in a cavitating cloud. Benjamin and Ellis related bubble collapse near a solid boundary to impulsive pressure [5]. Lauterborn and Bolle resolved the deformation and jetting sequence optically [6]. Philipp and Lauterborn then mapped pit formation as a function of bubble size and standoff distance for individual laser induced bubbles [14]. These studies showed that the most damaging condition is not necessarily the most spherical collapse or the smallest standoff distance. Damage depends on the combined effects of jet impact, toroidal collapse, shock focusing, and the area over which the load acts.
A representative erosion sequence contains several stages. First, the bubble collapses asymmetrically and a jet accelerates toward the wall. Second, the jet penetrates the bubble and impacts either the wall or the liquid layer separating the bubble from the wall. Third, the remaining toroidal bubble collapses and produces additional pressure peaks around an annular region. Fourth, rebound and secondary collapse may impose further loads. If the local stress exceeds the yield strength, a plastic pit can form. Repetition then promotes work hardening, cracking, grain removal, and measurable mass loss.
The bubble scale controls the energy available for loading. The potential energy at maximum radius is approximately:
At fixed pressure, the available energy therefore increases with the cube of . Peak stress and pit geometry, however, also depend on collapse distance and time. Small bubbles can generate intense microscopic loads, whereas larger bubbles affect a wider area. Surface roughness, elastic modulus, yield strength, residual stress, and liquid temperature further modify the resulting damage.
2.5 Thermal, Optical, and Chemical Events
The final compression of a sufficiently spherical bubble can create extreme internal conditions. For an ideal gas undergoing adiabatic compression:
This relation is only a limiting estimate. In real cavitation bubbles, water vapor can dissociate, heat is conducted into the surrounding liquid, shocks can form inside the gas, and composition changes through condensation and chemical reaction. Detailed models consequently predict lower temperatures than a simple adiabatic relation and show strong sensitivity to vapor content [13,16].
Sonoluminescence is a short flash emitted near the minimum radius. Pecha and Gompf measured light pulses on a picosecond time scale, demonstrating that the luminous state is much shorter than the overall bubble oscillation [15]. Flannigan and Suslick observed plasma related emission from single bubbles under suitable conditions [18]. The occurrence and spectrum of the flash depend on gas species, dissolved gas concentration, drive amplitude, water vapor, and bubble stability. Strongly deformed bubbles generally emit less light because the collapse energy is not focused into one compact volume.
Chemical activity develops because high temperature and pressure can dissociate water vapor and dissolved species, producing radicals and reaction products. Didenko and Suslick compared the energy associated with photons, radicals, and mechanical effects and showed that only a fraction of bubble energy appears as chemical or optical output [17]. Storey and Szeri demonstrated theoretically that water vapor can reduce peak temperature substantially through heat capacity, dissociation, and nonequilibrium transport [16]. These processes are directly related to the thermodynamic effects examined in Section 4.
2.6 Energy Partition at Collapse
The initial potential energy is distributed among several outputs rather than converted into a single form. A useful bookkeeping relation is:
The terms cannot always be separated uniquely without a model, and a small residual kinetic energy may remain in the surrounding liquid. Nevertheless, the relation clarifies why reduced shock energy can coincide with a larger rebound or a stronger jet. Tinguely and coauthors measured shock and rebound energies for nearly spherical collapses and identified systematic energy partitioning [22]. Obreschkow and coauthors and Supponen and coauthors extended this framework to jets and anisotropic collapse [20,23,24].
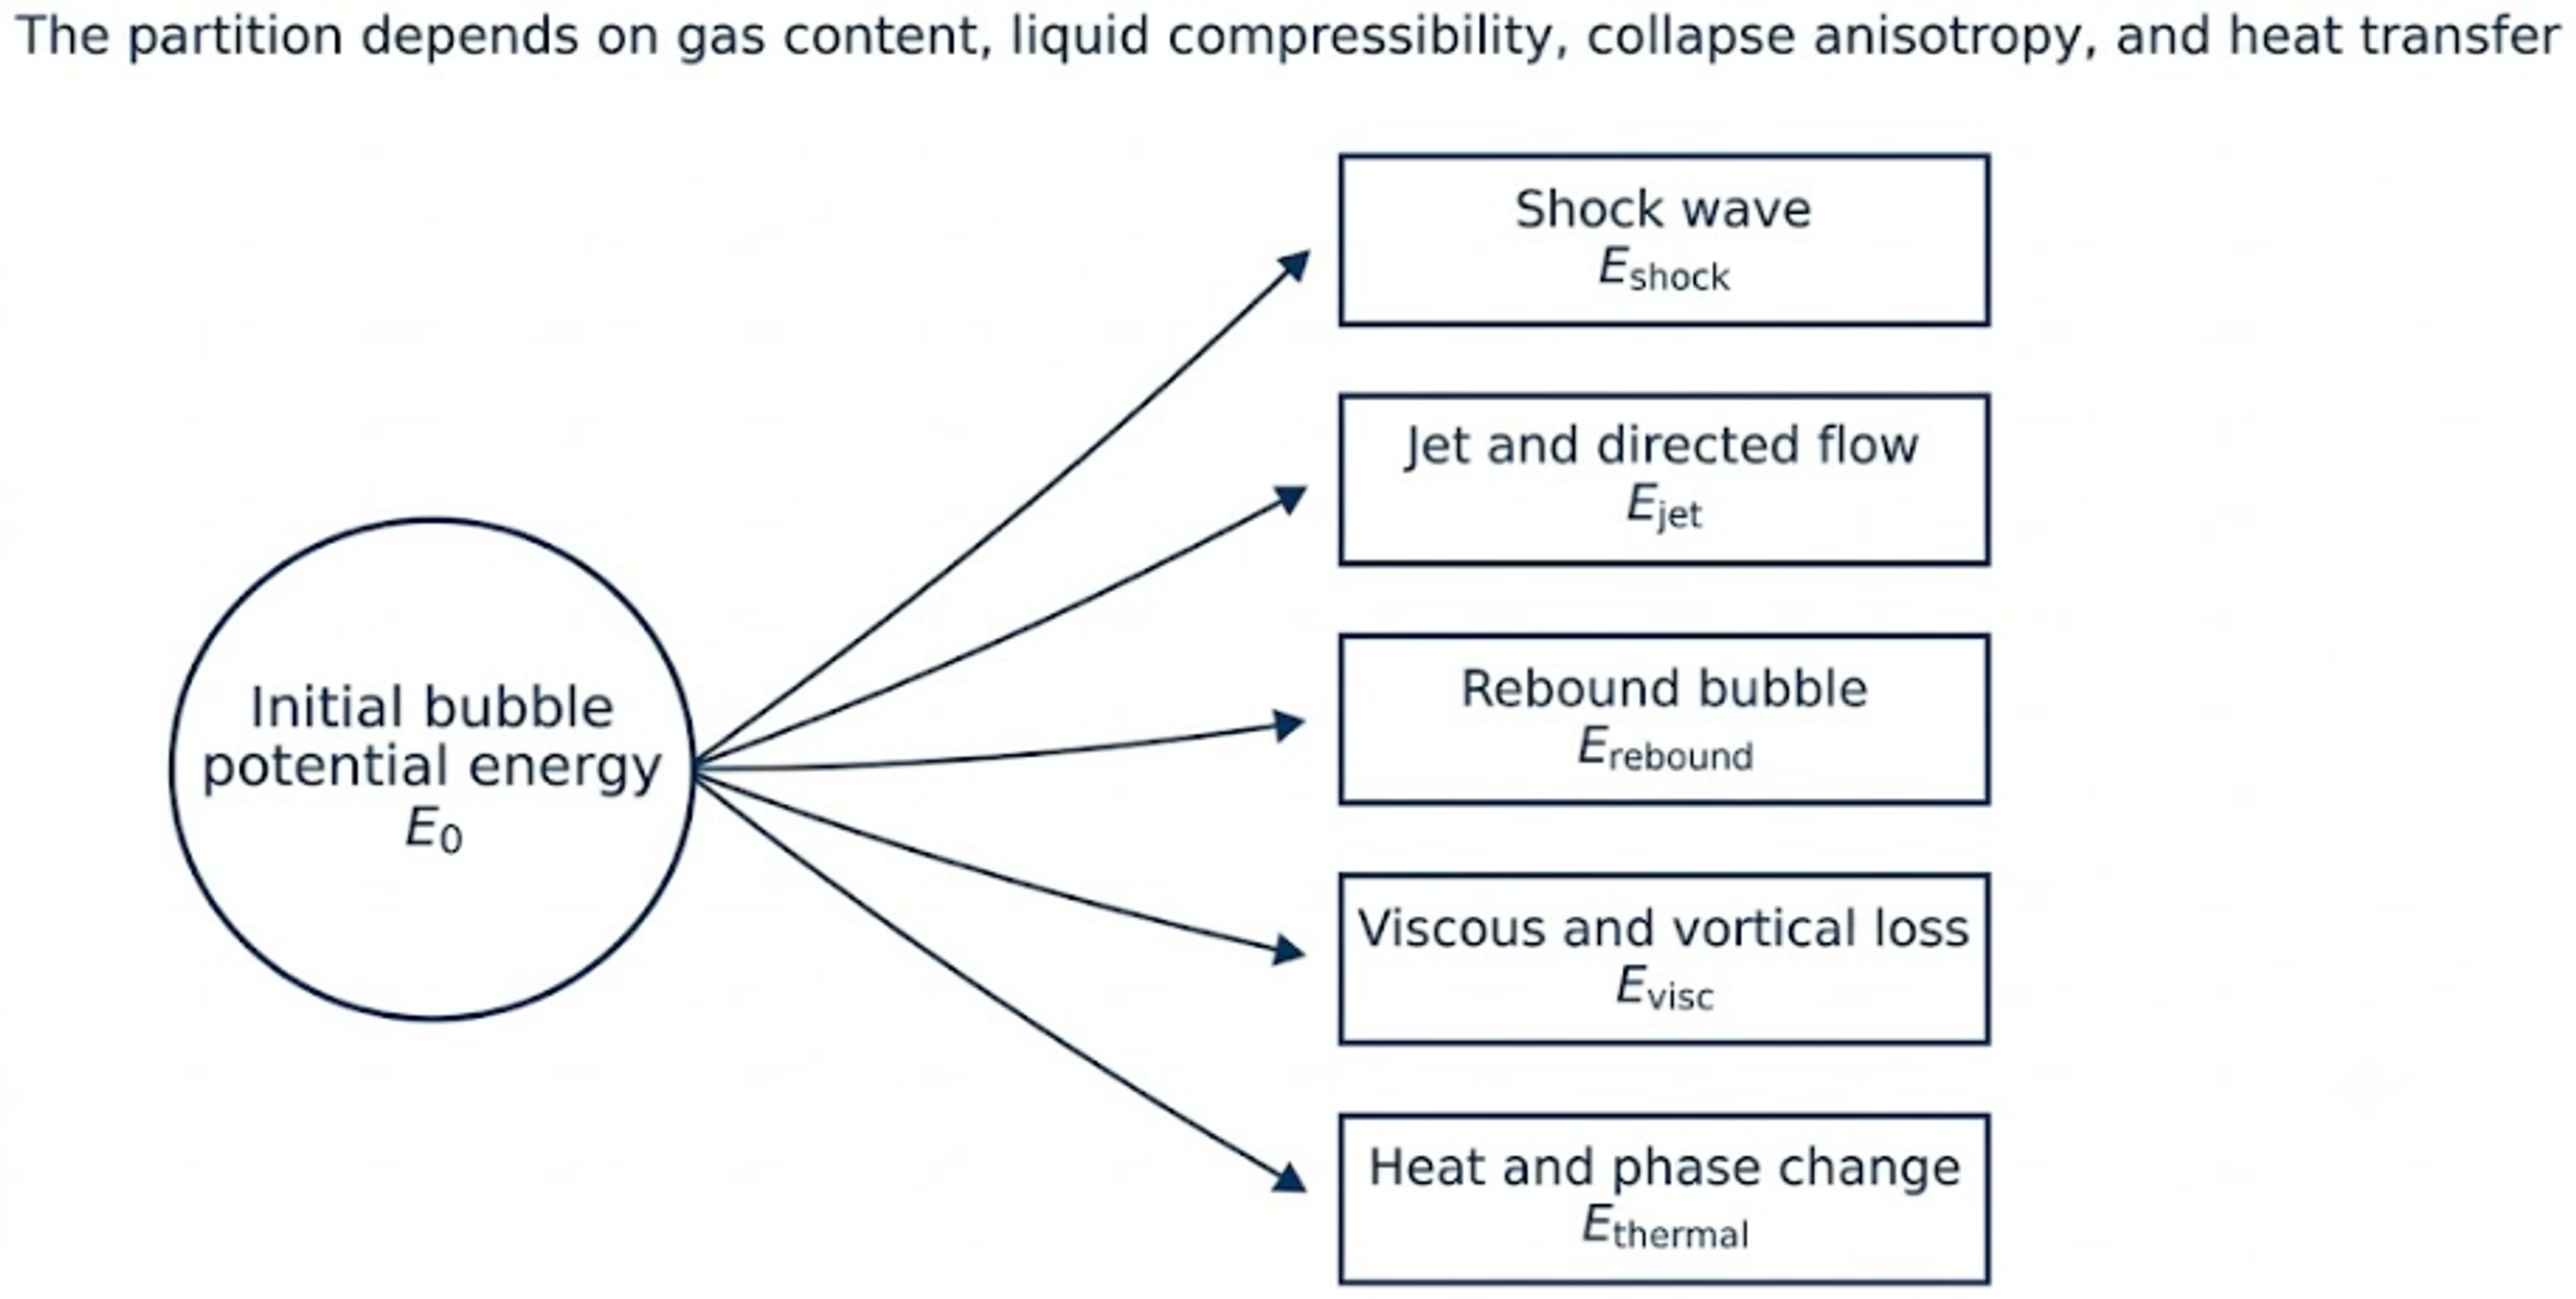
Figure 3. Principal energy pathways during the first collapse. The diagram is conceptual.[32]
Table 1. Main collapse phenomena and their physical consequences.
| Phenomenon | Primary mechanism | Main observable | Engineering or scientific consequence |
|---|---|---|---|
| Rapid radial acceleration | Pressure work and geometric focusing | Strong decrease of and high wall speed | Sets collapse time and velocity scale [1,2] |
| Shock emission | Liquid compressibility and rapid volume acceleration | Short pressure pulse or shock front | Noise, structural loading, energy loss [3,4,12,24,31] |
| Microjet | Collapse anisotropy and Kelvin impulse | Reentrant jet and toroidal bubble | Local impact, shear, pumping, erosion [5,6,14,20,23] |
| Rebound | Compression of permanent gas and retained vapor | Secondary bubble growth | Indicates residual internal energy [4,22,31] |
| Fragmentation | Jet penetration and interface instability | Daughter bubbles and multiple shocks | Distributed loading and enhanced mixing [12,21,24] |
| Heating and chemistry | Rapid gas compression and nonequilibrium reactions | Light emission and radical production | Sonochemistry and material modification [13,15–18] |
| Interfacial cooling or heating | Evaporation, condensation, and latent heat | Local temperature change | Modifies vapor pressure and collapse intensity [25–29] |
3. Theoretical Models
3.1 Spherical Kinematics and the Pressure Field
The simplest derivation assumes a spherical bubble in an incompressible liquid of constant density. Conservation of liquid volume gives the radial velocity:
A corresponding velocity potential is . Substitution into the unsteady Bernoulli equation gives the liquid pressure field:
At the interface, , the pressure relation reduces to:
where is the liquid pressure immediately outside the bubble. This relation is the inertial core of the Rayleigh and Rayleigh Plesset equations.
The assumptions are restrictive. Incompressibility implies instantaneous pressure communication and therefore cannot represent shock radiation. Spherical symmetry excludes jets, translation, and topology change. Even so, the formulation remains valuable because it isolates the balance among interface acceleration, convective inertia, and pressure.
3.2 Rayleigh Empty Cavity Model
Rayleigh considered an empty cavity for which vapor pressure is neglected relative to the external pressure [1]. More generally, define the constant collapse driving pressure as:
The radial equation is:
Multiplication by and integration from the maximum radius, where , gives:
The wall speed therefore diverges as in the ideal model. A second integration gives the collapse time:
This relation is one of the most useful scaling laws in cavitation. It predicts that collapse time is proportional to bubble size, increases with liquid density, and decreases with the square root of the pressure difference. It is commonly used to normalize experimental time histories and to define a Rayleigh factor based on the ratio of measured collapse time to .
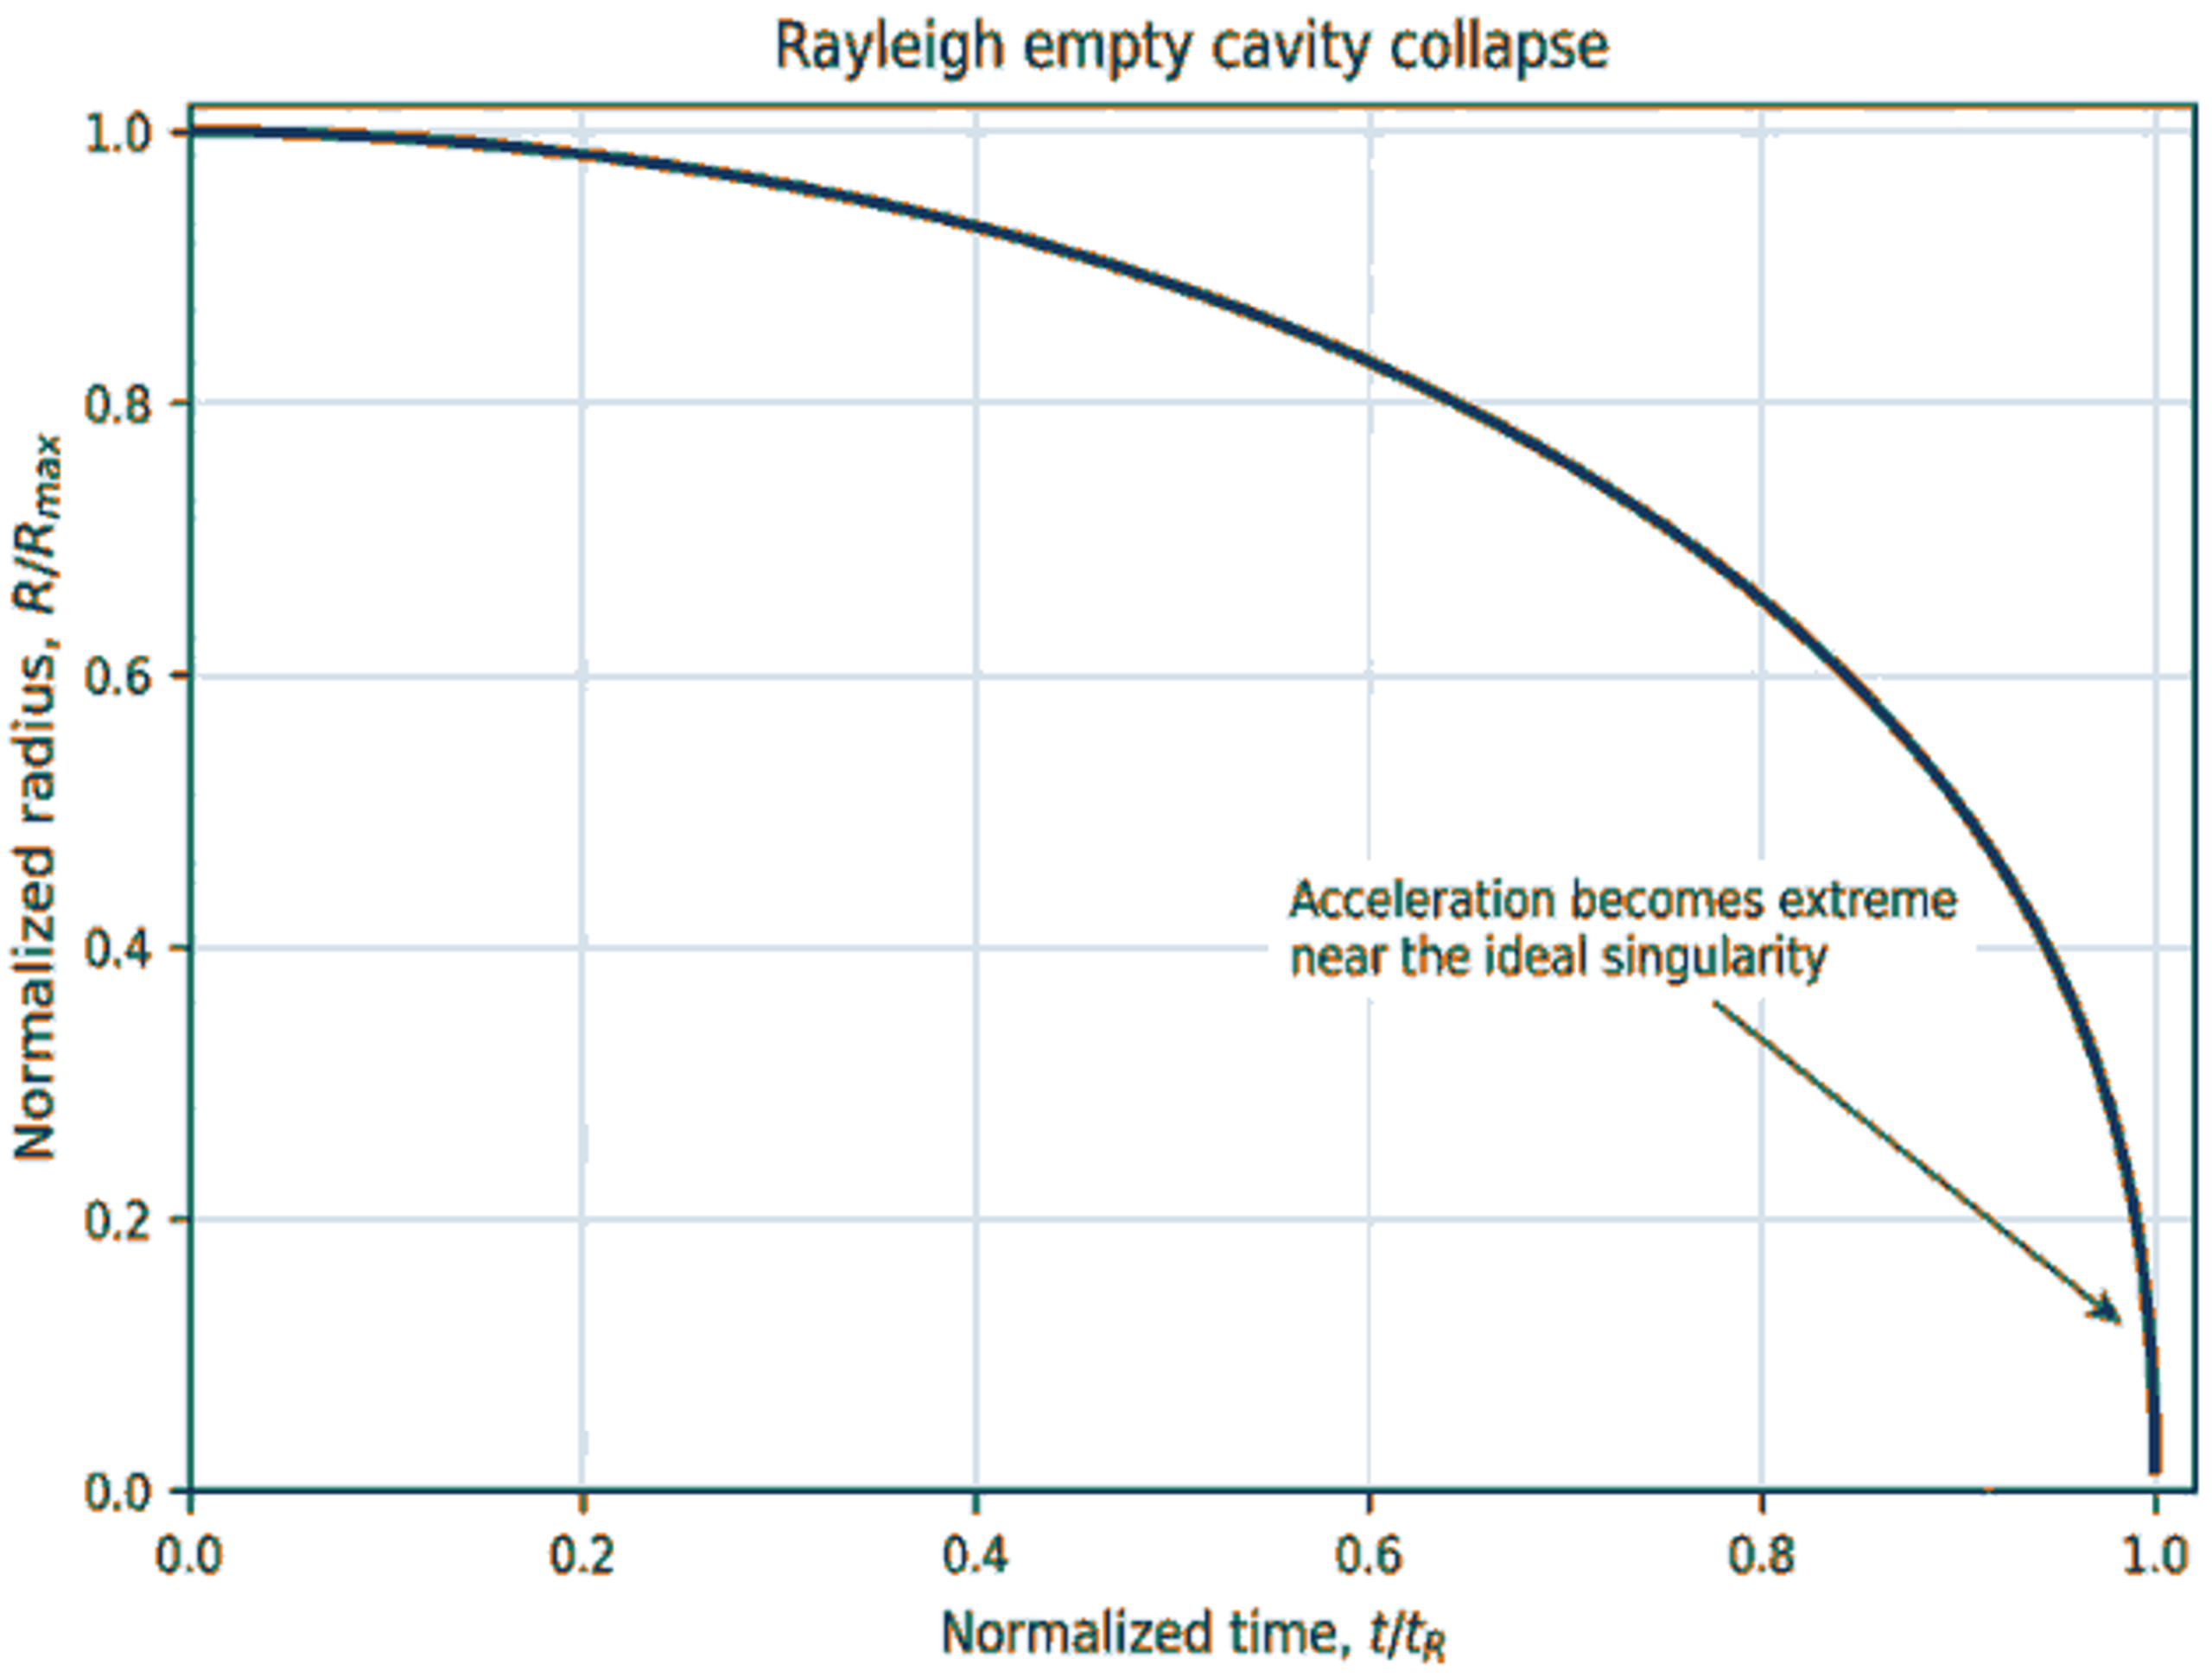
Figure 4. Dimensionless Rayleigh collapse trajectory obtained by numerical integration of the empty cavity equation [1]. The ideal model reaches zero radius at the nominal collapse time with a divergent wall speed.
The model predicts first order collapse time remarkably well for large vapor cavities when viscosity and surface tension are small and the bubble remains nearly spherical. It fails near the minimum radius, where compressibility and internal pressure dominate, and it cannot predict rebound, shock amplitude, or jet formation.
3.3 Rayleigh Plesset Equation
For a spherical bubble containing gas and vapor, the normal stress condition is:
Combining this condition with the inertial pressure balance gives the Rayleigh Plesset equation [2]:
An acoustically driven far field pressure can be represented as:
where is the acoustic pressure amplitude. For a transient cavitation bubble, can instead be specified as a pressure step, a measured waveform, or a computed local pressure history.
A common closure for the bubble pressure is:
with the equilibrium gas pressure:
This closure treats vapor pressure as spatially uniform and permanent gas as polytropic. It is adequate for many moderate oscillations but becomes unreliable during violent collapse because and vapor mass change rapidly, the gas can become spatially nonuniform, and chemical reactions may occur [7,9,13,16].
Surface tension is most important for small bubbles, whereas viscosity becomes significant at small radii and lower Reynolds number. For a millimeter scale transient cavity in water, both effects are usually secondary through most of the first collapse but can become important near the minimum radius.
3.4 Interior Thermodynamic Closures
The principal uncertainty in a spherical bubble equation often lies not in liquid inertia but in the representation of . Several levels of thermodynamic closure are commonly used.
Constant vapor pressure and polytropic gas. This is the closure used above. The condition represents isothermal gas behavior, whereas equal to the heat capacity ratio represents ideal adiabatic behavior. Real bubble oscillations generally lie between these limits, and the effective exponent depends on frequency and radius [7].
Uniform temperature energy model. The bubble contents are treated as well mixed. An energy equation determines the time dependent gas temperature, and the vapor mass changes through an interfacial flux. This formulation captures latent heat and variable pressure at moderate computational cost.
Radially resolved gas vapor model. Conservation equations for species, momentum or low Mach number flow, and energy are solved within the bubble. This approach resolves thermal boundary layers, vapor diffusion, nonequilibrium condensation, and chemical reactions [9,13,16]. It is required when accurate peak temperature or sonochemical predictions are needed.
Equation of state closure. At very high pressure, ideal gas behavior can become inadequate. A real gas equation of state and variable transport properties may be required. For cryogenic fluids or mixtures, phase equilibrium and fluid properties must be evaluated at the local composition and temperature [27,28].
The selected closure can materially change the predicted minimum radius, peak pressure, rebound energy, and radiated shock. Agreement with a measured radius history does not by itself establish that the internal temperature or composition is correct.
3.5 Keller Miksis Equation
The Rayleigh Plesset equation neglects the finite propagation speed of pressure disturbances. The Keller Miksis equation retains first order terms in the bubble wall Mach number [8]. Its compact form is:
where:
The additional terms represent acoustic radiation and the delay associated with liquid compressibility. The equation is widely used because it is only modestly more expensive to integrate than Rayleigh Plesset while providing more realistic damping and collapse pressure when remains moderate. It becomes less reliable as the wall Mach number approaches unity or when the liquid equation of state becomes strongly nonlinear.
A practical advantage is that measured or prescribed acoustic pressure waveforms can be introduced directly. A practical limitation is numerical stiffness near collapse. The internal pressure model and its time derivative must also be implemented consistently. Discontinuous forcing or an overly crude vapor pressure closure can generate unphysical pressure spikes.
3.6 Gilmore Equation
Gilmore formulated spherical bubble dynamics in terms of the enthalpy and local sound speed of a compressible liquid [3]. The governing equation is:
where:
is the liquid enthalpy difference, and is the sound speed evaluated at the liquid pressure adjacent to the wall. A liquid equation of state, commonly a Tait type relation for water, supplies the required relations for and density as functions of pressure.
The Gilmore equation is preferred when the pressure near the bubble wall is sufficiently high that sound speed and density differ substantially from their ambient values. It can represent strong compression and shock emission more robustly than a constant sound speed equation. It remains a spherical model and cannot resolve the propagated shock profile after the wave leaves the bubble. Far field pressure must therefore be obtained from an acoustic propagation relation or a separate compressible flow calculation.
3.7 Prosperetti Lezzi and Related Compressible Equations
Prosperetti and Lezzi derived a systematic family of compressible bubble equations by expansion in a small Mach number parameter [10,11]. The first order theory contains a free parameter that recovers several earlier formulations for particular choices, while the second order theory retains additional compressibility terms. This analysis is important because it distinguishes approximations that are formally equivalent to first order from differences that become significant at the next order.
In practical calculations, selection among Keller Miksis, Gilmore, and Prosperetti Lezzi formulations should be based on the pressure range, expected wall Mach number, and required output. First order equations are often sufficient for radius histories and moderate acoustic radiation. Very high pressures favor a variable property formulation or direct compressible simulation. No radial equation can predict a wall directed microjet.
3.8 Nonequilibrium Condensation and Phase Change Models
Fujikawa and Akamatsu showed that nonequilibrium condensation can alter the pressure wave generated by bubble collapse [9]. In a pure vapor cavity, instantaneous equilibrium would impose at every instant. In reality, condensation is limited by molecular accommodation, diffusion, and heat removal. Vapor can therefore remain supersaturated or undergo substantial compression before condensation.
A simplified kinetic relation for the interfacial vapor mass flux is the Hertz Knudsen form:
where is the mass accommodation coefficient and is the specific gas constant of the vapor. Positive denotes net evaporation into the bubble. The relation is useful as a closure, although is often treated as an effective parameter because interface kinetics, contamination, and temperature nonuniformity are not fully resolved.
Phase change models become especially important for high vapor pressure liquids, hot water, cryogenic propellants, and mixtures. Under these conditions, vapor mass is not merely a passive pressure offset. It acts as a dynamic reservoir of energy and momentum.
3.9 Nonspherical Potential Flow and Boundary Integral Models
When viscosity and vorticity are confined to thin regions, the external liquid can be approximated as potential flow:
The bubble surface moves with the liquid according to:
The velocity potential on the interface satisfies:
A boundary integral formulation converts the Laplace problem into an integral over the bubble and solid boundaries. Only the surfaces require discretization, making the method efficient for large interface deformation. Image systems or explicit boundary panels can enforce rigid wall or free surface conditions. Weak compressibility corrections can also be introduced, as in the formulations of Wang and Blake [19,21].
Boundary integral methods predict migration, jet formation, toroidal transition, and the dependence of jet direction on the forcing field. Their principal limitations arise from the assumptions of irrotational flow and a single valued interface representation. Jet impact creates a topological change that requires special reconnection algorithms. After impact, vortex rings, splashing, and fragmentation become increasingly important, while strong shock propagation lies outside the scope of incompressible potential flow.
3.10 Compressible Multiphase Computational Fluid Dynamics
Direct numerical simulation solves conservation equations in both phases or within a mixture formulation. Interface capturing methods such as volume of fluid, level set, and diffuse interface schemes can represent jet impact, toroidal bubbles, breakup, and shock interaction. A general compressible two phase formulation includes:
and:
The equation of state, interface method, surface tension treatment, and phase change source terms determine the physical fidelity of the calculation. The computational challenge is severe because the bubble radius, thermal boundary layer, jet tip, and shock thickness occupy very different length scales. Numerical diffusion can smear the interface and reduce peak pressure, whereas insufficient spatial resolution can delay jet impact or alter fragmentation.
Compressible multiphase computational fluid dynamics is most appropriate when the research question concerns shock structure, topology change, interaction with complex geometry, or local wall loading. Validation should include radius history, jet velocity, shock arrival time, and energy conservation rather than a single output alone.
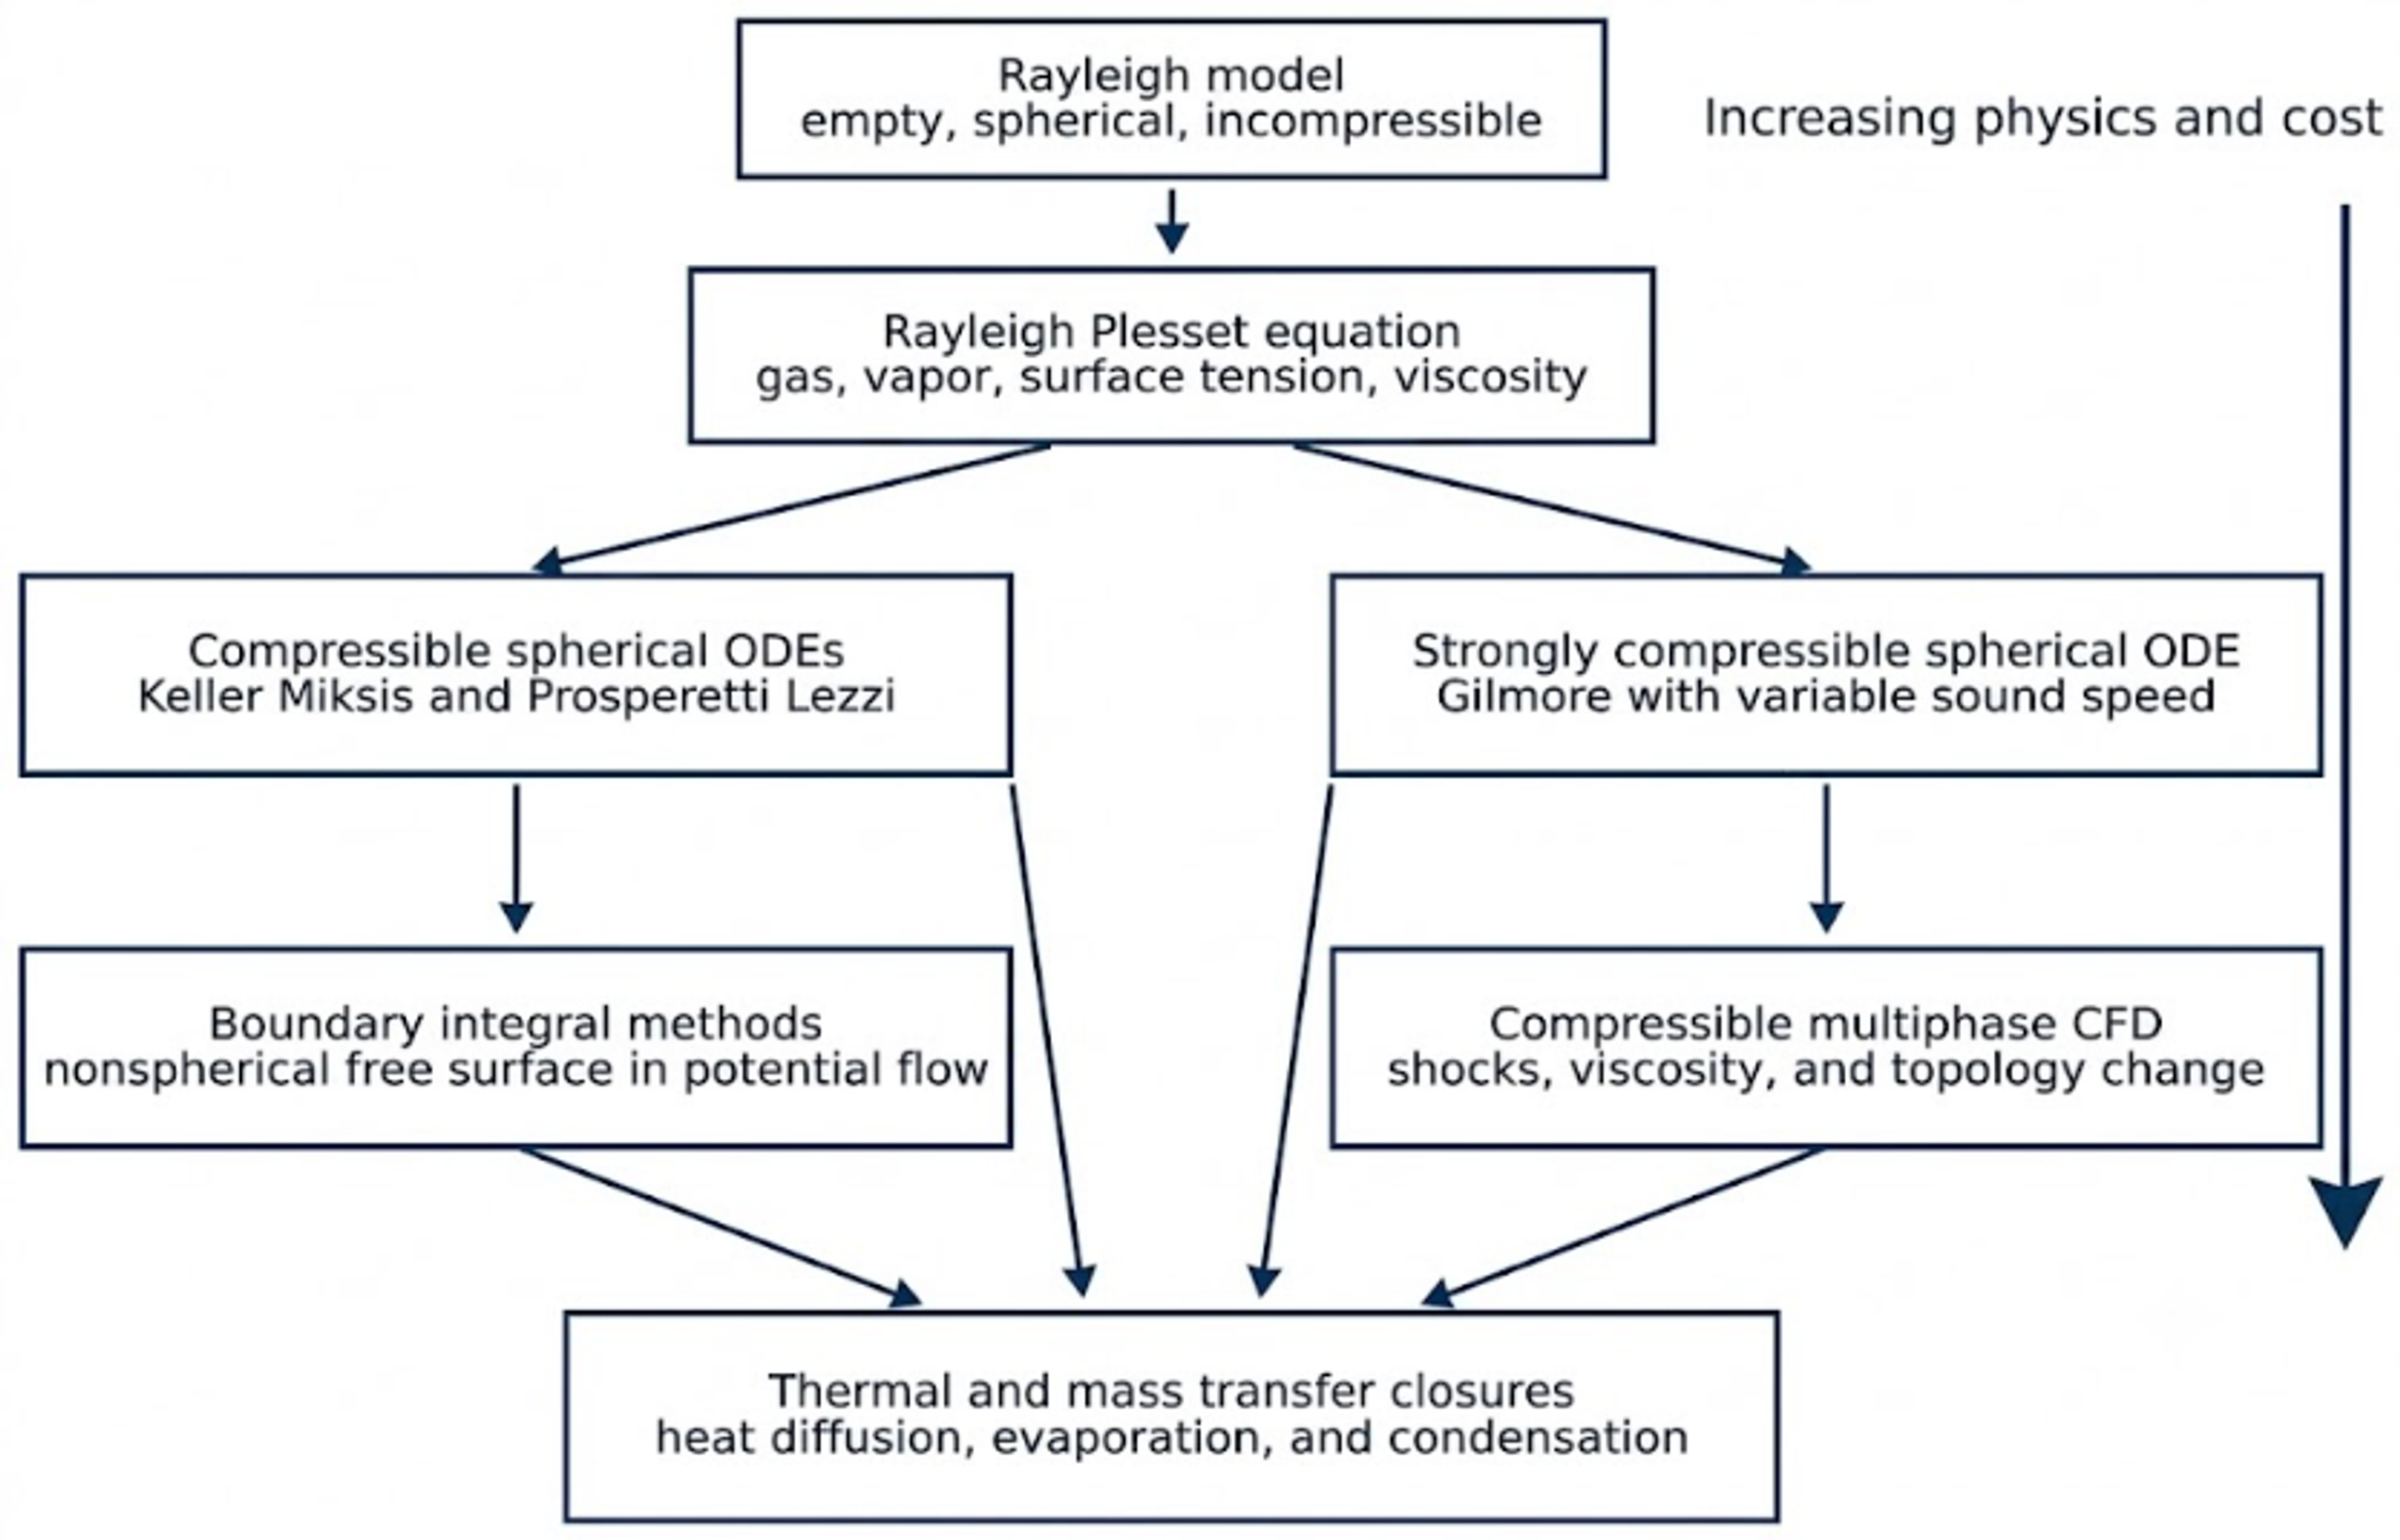
Figure 5. Hierarchy of common single bubble models. Increasing physical completeness generally requires increasing computational cost. [32]
3.11 Dimensionless Groups and Model Selection
Using the characteristic velocity and characteristic length , the following dimensionless groups indicate the relative importance of the principal physical mechanisms.
Table 2. Dimensionless groups for single bubble dynamics.
| Group | Definition | Physical interpretation |
|---|---|---|
| Mach number | or | Importance of liquid compressibility and shock formation |
| Reynolds number | Ratio of inertia to viscosity | |
| Weber number | Ratio of inertia to surface tension | |
| Thermal Peclet number | Ratio of advection time to thermal diffusion time | |
| Fourier number | Fraction of the radius reached by thermal diffusion | |
| Jakob number | Sensible heat available relative to latent heat demand | |
| Standoff parameter | Strength of a nearby wall influence | |
| Anisotropy parameter | Normalized pressure gradient or Kelvin impulse scale |
A practical model selection sequence is as follows:
-
Use the Rayleigh model for an initial estimate of collapse time and characteristic velocity.
-
Use Rayleigh Plesset for spherical motion when liquid compressibility is weak and shock amplitude is not required.
-
Use Keller Miksis or a first order Prosperetti Lezzi equation when acoustic radiation and moderate wall Mach number are important.
-
Use Gilmore when liquid properties vary strongly with pressure or when the collapse is very violent.
-
Use a boundary integral method for nonspherical deformation and jetting when shocks and viscosity are secondary.
-
Use compressible multiphase computational fluid dynamics when shocks, jets, topology change, and complex boundary interactions must be resolved simultaneously.
-
Add coupled heat and mass transfer whenever vapor pressure, condensation rate, or peak temperature is central to the analysis.
Table 3. Comparison of principal theoretical models.
| Model | Included physics | Best use | Main limitation |
|---|---|---|---|
| Rayleigh [1] | Spherical inertia and constant pressure difference | Collapse time and scaling | Empty cavity, no rebound, no shock physics |
| Rayleigh Plesset [2] | Gas pressure, vapor pressure, surface tension, viscosity | Moderate spherical oscillations | Incompressible liquid |
| Keller Miksis [8] | First order liquid compressibility | Acoustic driving and radiative damping | Constant reference sound speed, spherical shape |
| Gilmore [3] | Variable density, sound speed, and enthalpy | Strong spherical collapse | Requires liquid equation of state, no jets |
| Prosperetti Lezzi [10,11] | Systematic first and second order compressibility | Error controlled radial modeling | More complex implementation |
| Boundary integral [19,21] | Nonspherical potential flow and boundaries | Migration, jetting, topology studies | Weak shock and viscous capability |
| Compressible multiphase CFD | Shocks, viscosity, complex geometry, topology change | Local loads and coupled flow structure | High computational cost and resolution sensitivity |
| Thermal phase change model [9,13,16] | Heat transfer, vapor transport, reactions | Vapor rich, hot, cryogenic, or luminous collapse | Property data and closure uncertainty |
4. The Thermodynamic Effect
4.1 Meaning of the Thermodynamic Effect
In cavitation research, the thermodynamic effect is the feedback of evaporation, condensation, latent heat, and temperature dependent material properties on bubble dynamics. It is sometimes described only as suppression of cavitation in cryogenic liquids, but the mechanism is broader and operates during both bubble growth and collapse.
During growth, liquid evaporates into the bubble. Vaporization consumes latent heat from the interface and adjacent liquid, causing the interfacial temperature to decrease. The resulting reduction in opposes further evaporation and can limit bubble growth.
During collapse, vapor condenses and releases latent heat. The interface can become warmer than the surrounding liquid. When condensation and heat removal are rapid, vapor mass decreases and the event approaches inertial cavity collapse. When these processes are slow, vapor is compressed and maintains a higher internal pressure. This vapor cushioning increases the minimum radius, reduces wall velocity, weakens the collapse shock, and can increase bubble symmetry by reducing the time available for an anisotropic jet to develop [9,25-29].
The thermodynamic effect therefore has two coupled components: a local temperature effect on phase equilibrium and a finite rate effect on mass transfer. Treating vapor pressure as a constant equal to the ambient saturation pressure does not fully represent either mechanism.
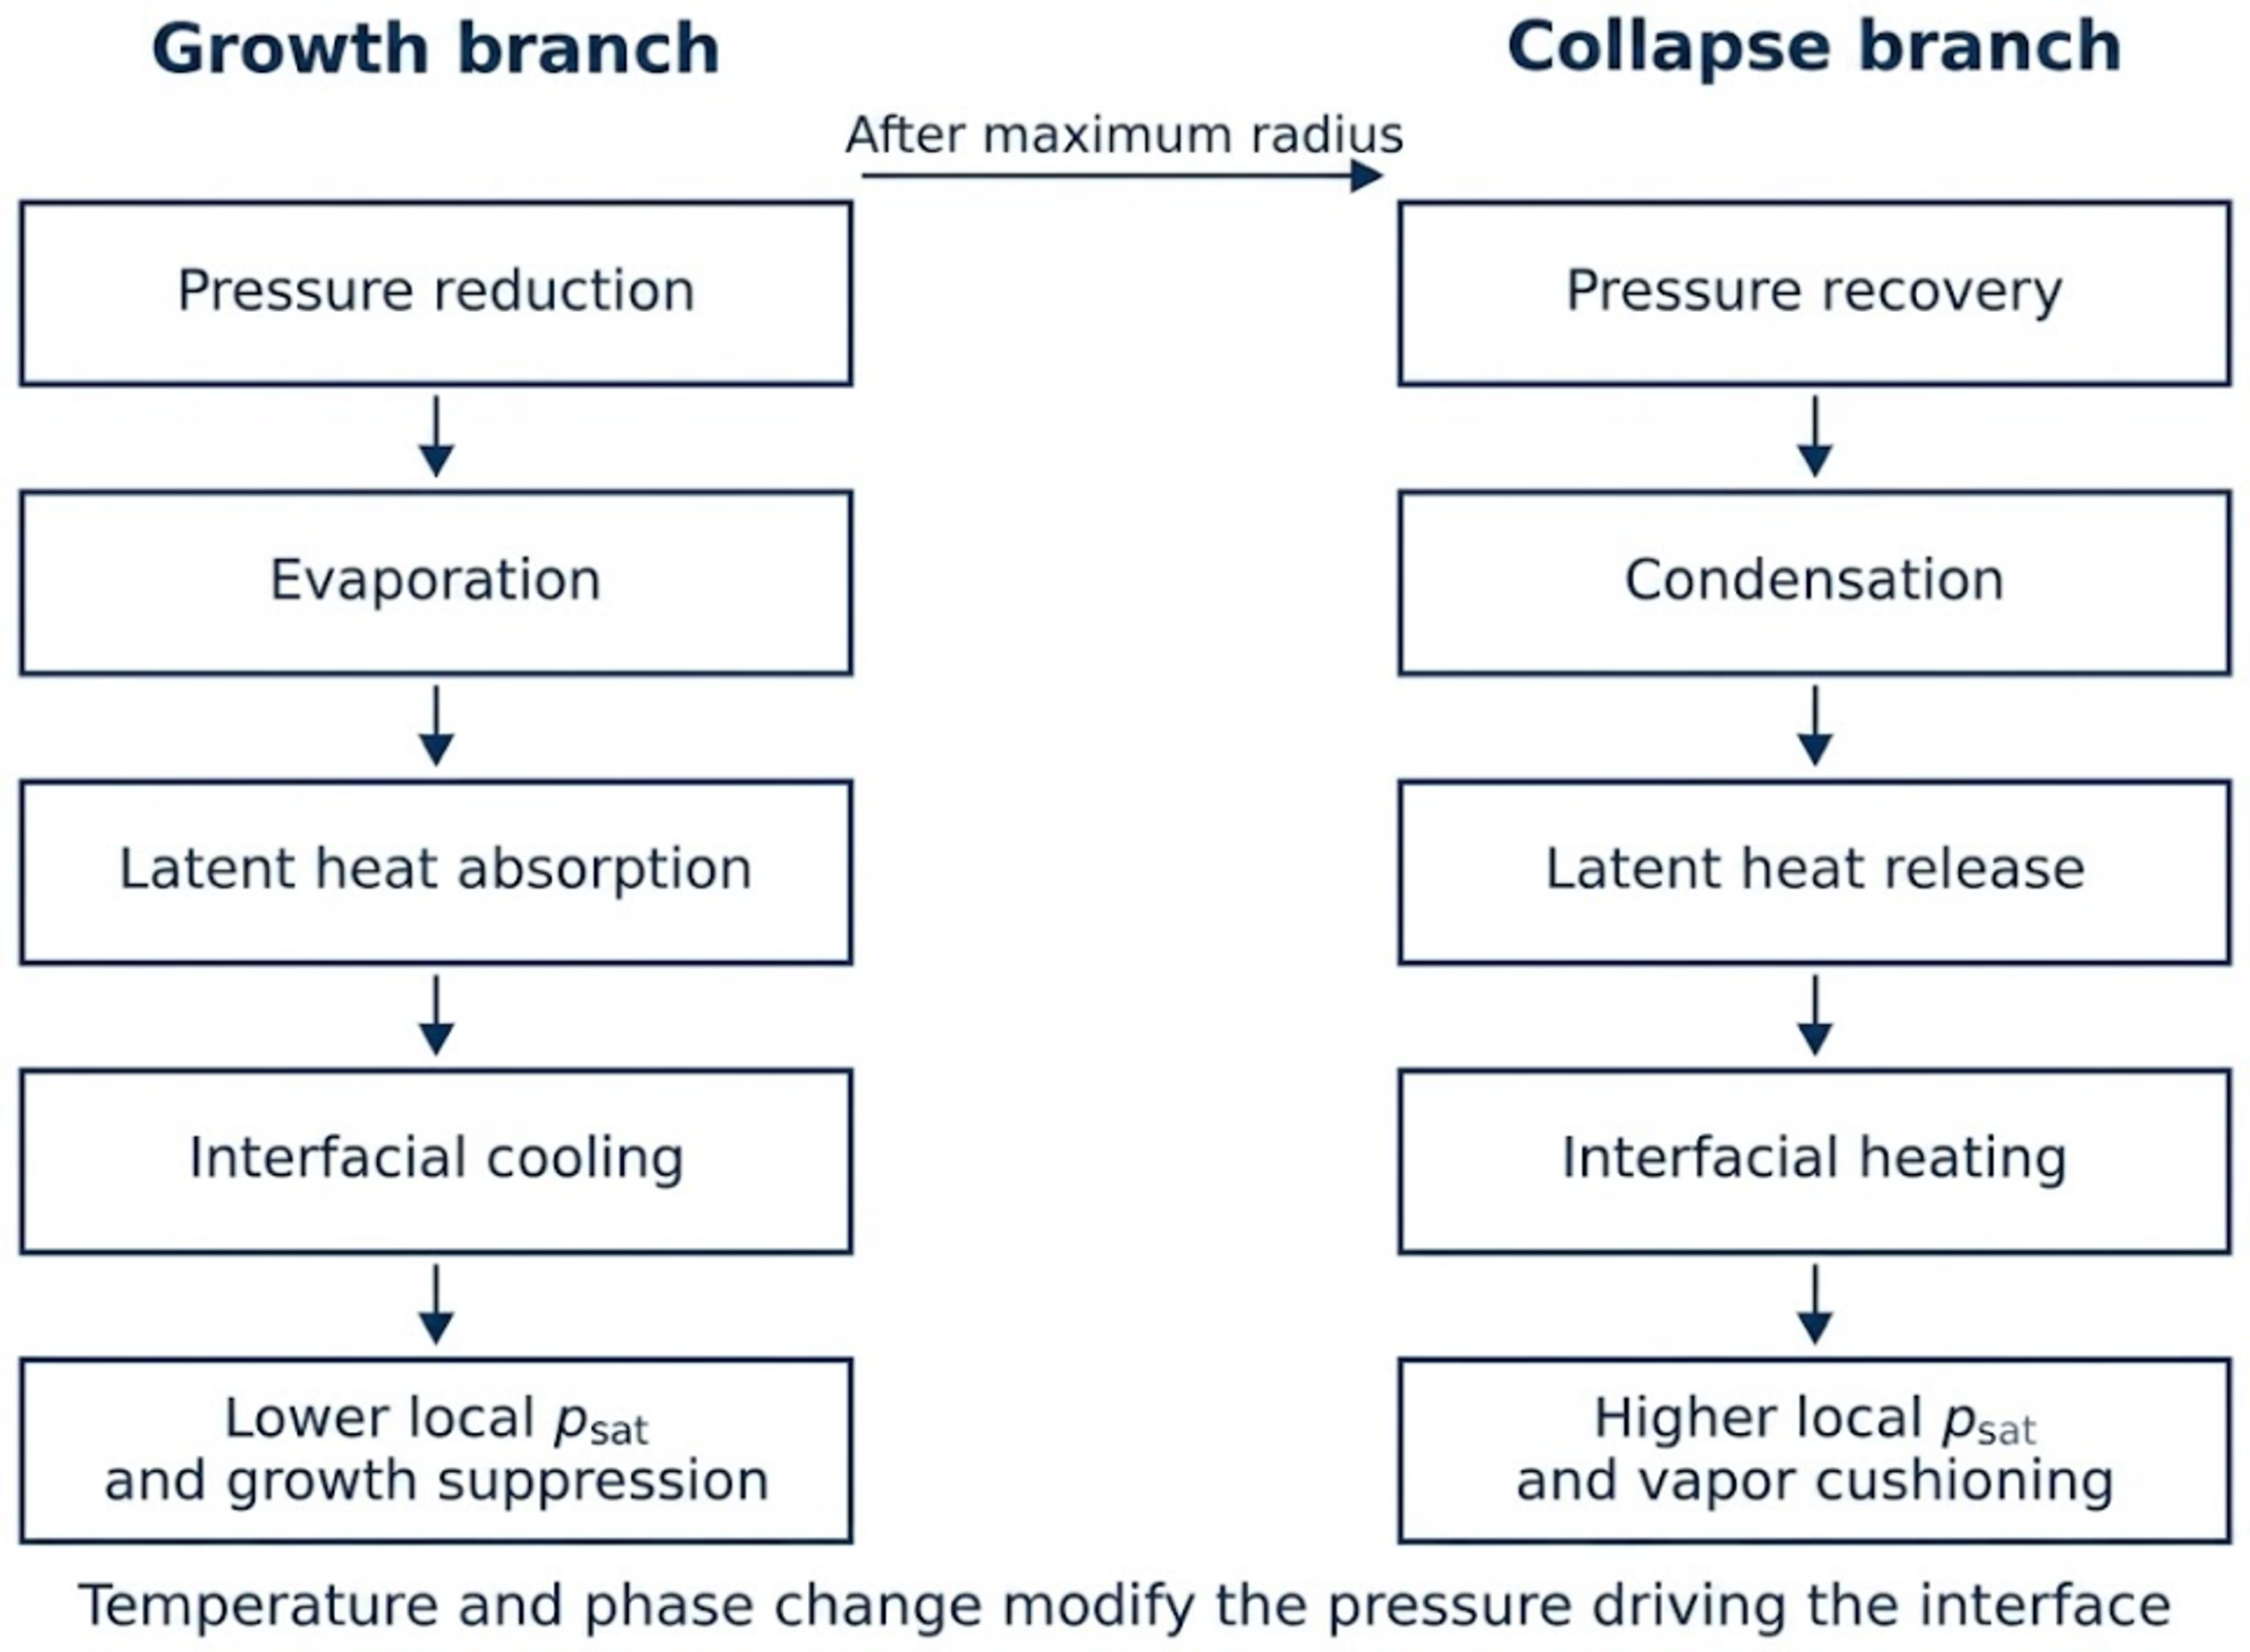
Figure 6. Thermodynamic feedback during bubble growth and collapse. [32]
4.2 Heat and Mass Balances
For a spherical bubble, the temperature field in the surrounding liquid can be written in simplified constant property form as:
The radial velocity advects the thermal boundary layer. A characteristic thermal penetration thickness is:
If , only a thin layer of liquid participates in rapid heat exchange. The bulk liquid can remain close to while the interface becomes several kelvin colder or hotter.
For a spatially uniform bubble interior, a useful energy balance is:
where is the heat transferred into the bubble and is positive for vapor entering the bubble. The final term carries the enthalpy associated with phase changing mass. A detailed model instead solves separate gas and vapor species equations and couples the work term to an appropriate real gas or mixture equation of state.
At the interface, conductive heat flux and latent heat must balance. Independent of sign convention, the magnitude of the latent heat demand is of order:
This scaling explains why a large latent heat combined with a limited conductive heat flux can produce a substantial local temperature departure. It also explains why thermodynamic effects can be strong even when the measured bulk liquid temperature remains nearly uniform.
4.3 Saturation Pressure Feedback
The Clausius Clapeyron relation connects phase equilibrium with temperature:
The approximation treats the vapor as ideal and neglects the specific volume of the liquid. Because the derivative increases with saturation pressure, the same interfacial temperature change has a much greater pressure effect at high temperature or in a volatile liquid.
For water, the IAPWS saturation correlation can be written as:
with coefficients specified in the IAPWS release [30]. Between 20 °C and 90 °C, the saturation pressure of water rises from approximately 2.34 kPa to 70.2 kPa. At one atmosphere, the nominal Rayleigh collapse driving pressure therefore decreases from about 99.0 kPa to 31.1 kPa.
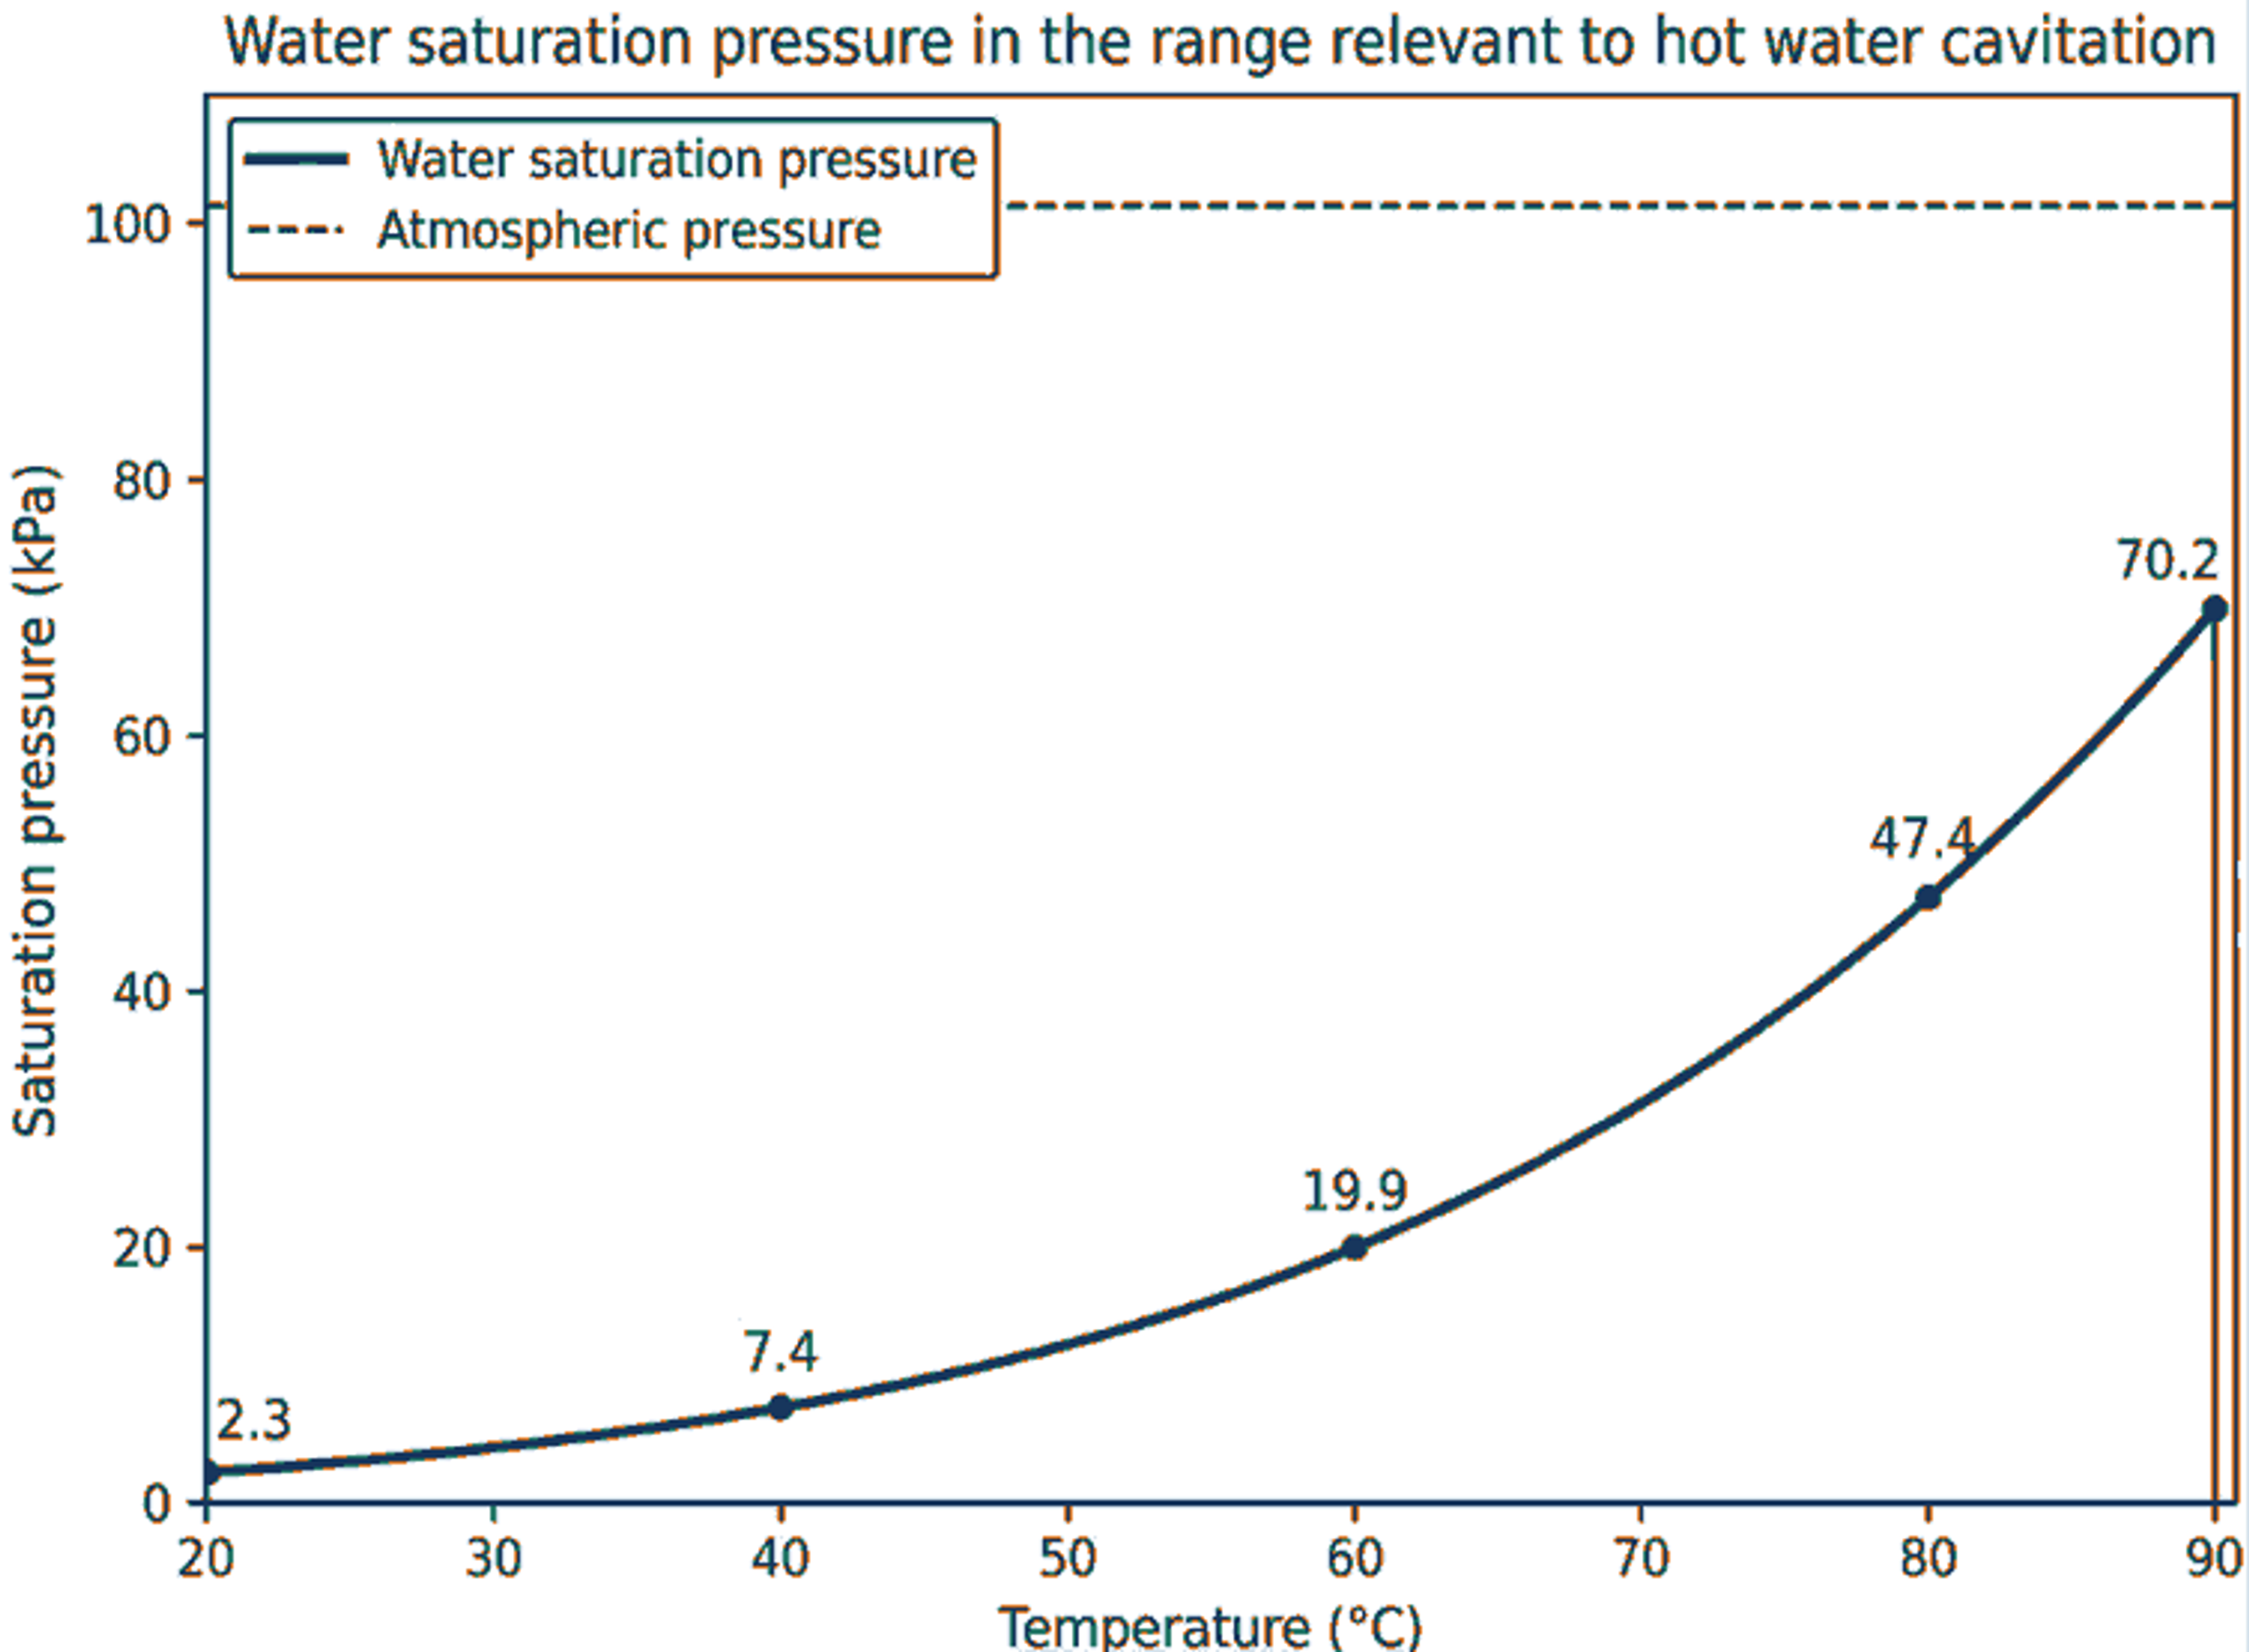
Figure 7. Saturation pressure of water calculated from the IAPWS correlation [30]. The dashed line represents standard atmospheric pressure.
The contribution of the pressure difference to collapse time follows:
Relative to 20 °C and assuming constant liquid density:
The calculated ratio reaches approximately 1.78 at 90 °C. This result isolates only the effect of the reduced pressure drive. Real bubble dynamics also depend on temperature dependent density, viscosity, surface tension, dissolved gas, heat transfer, and nonequilibrium phase change.
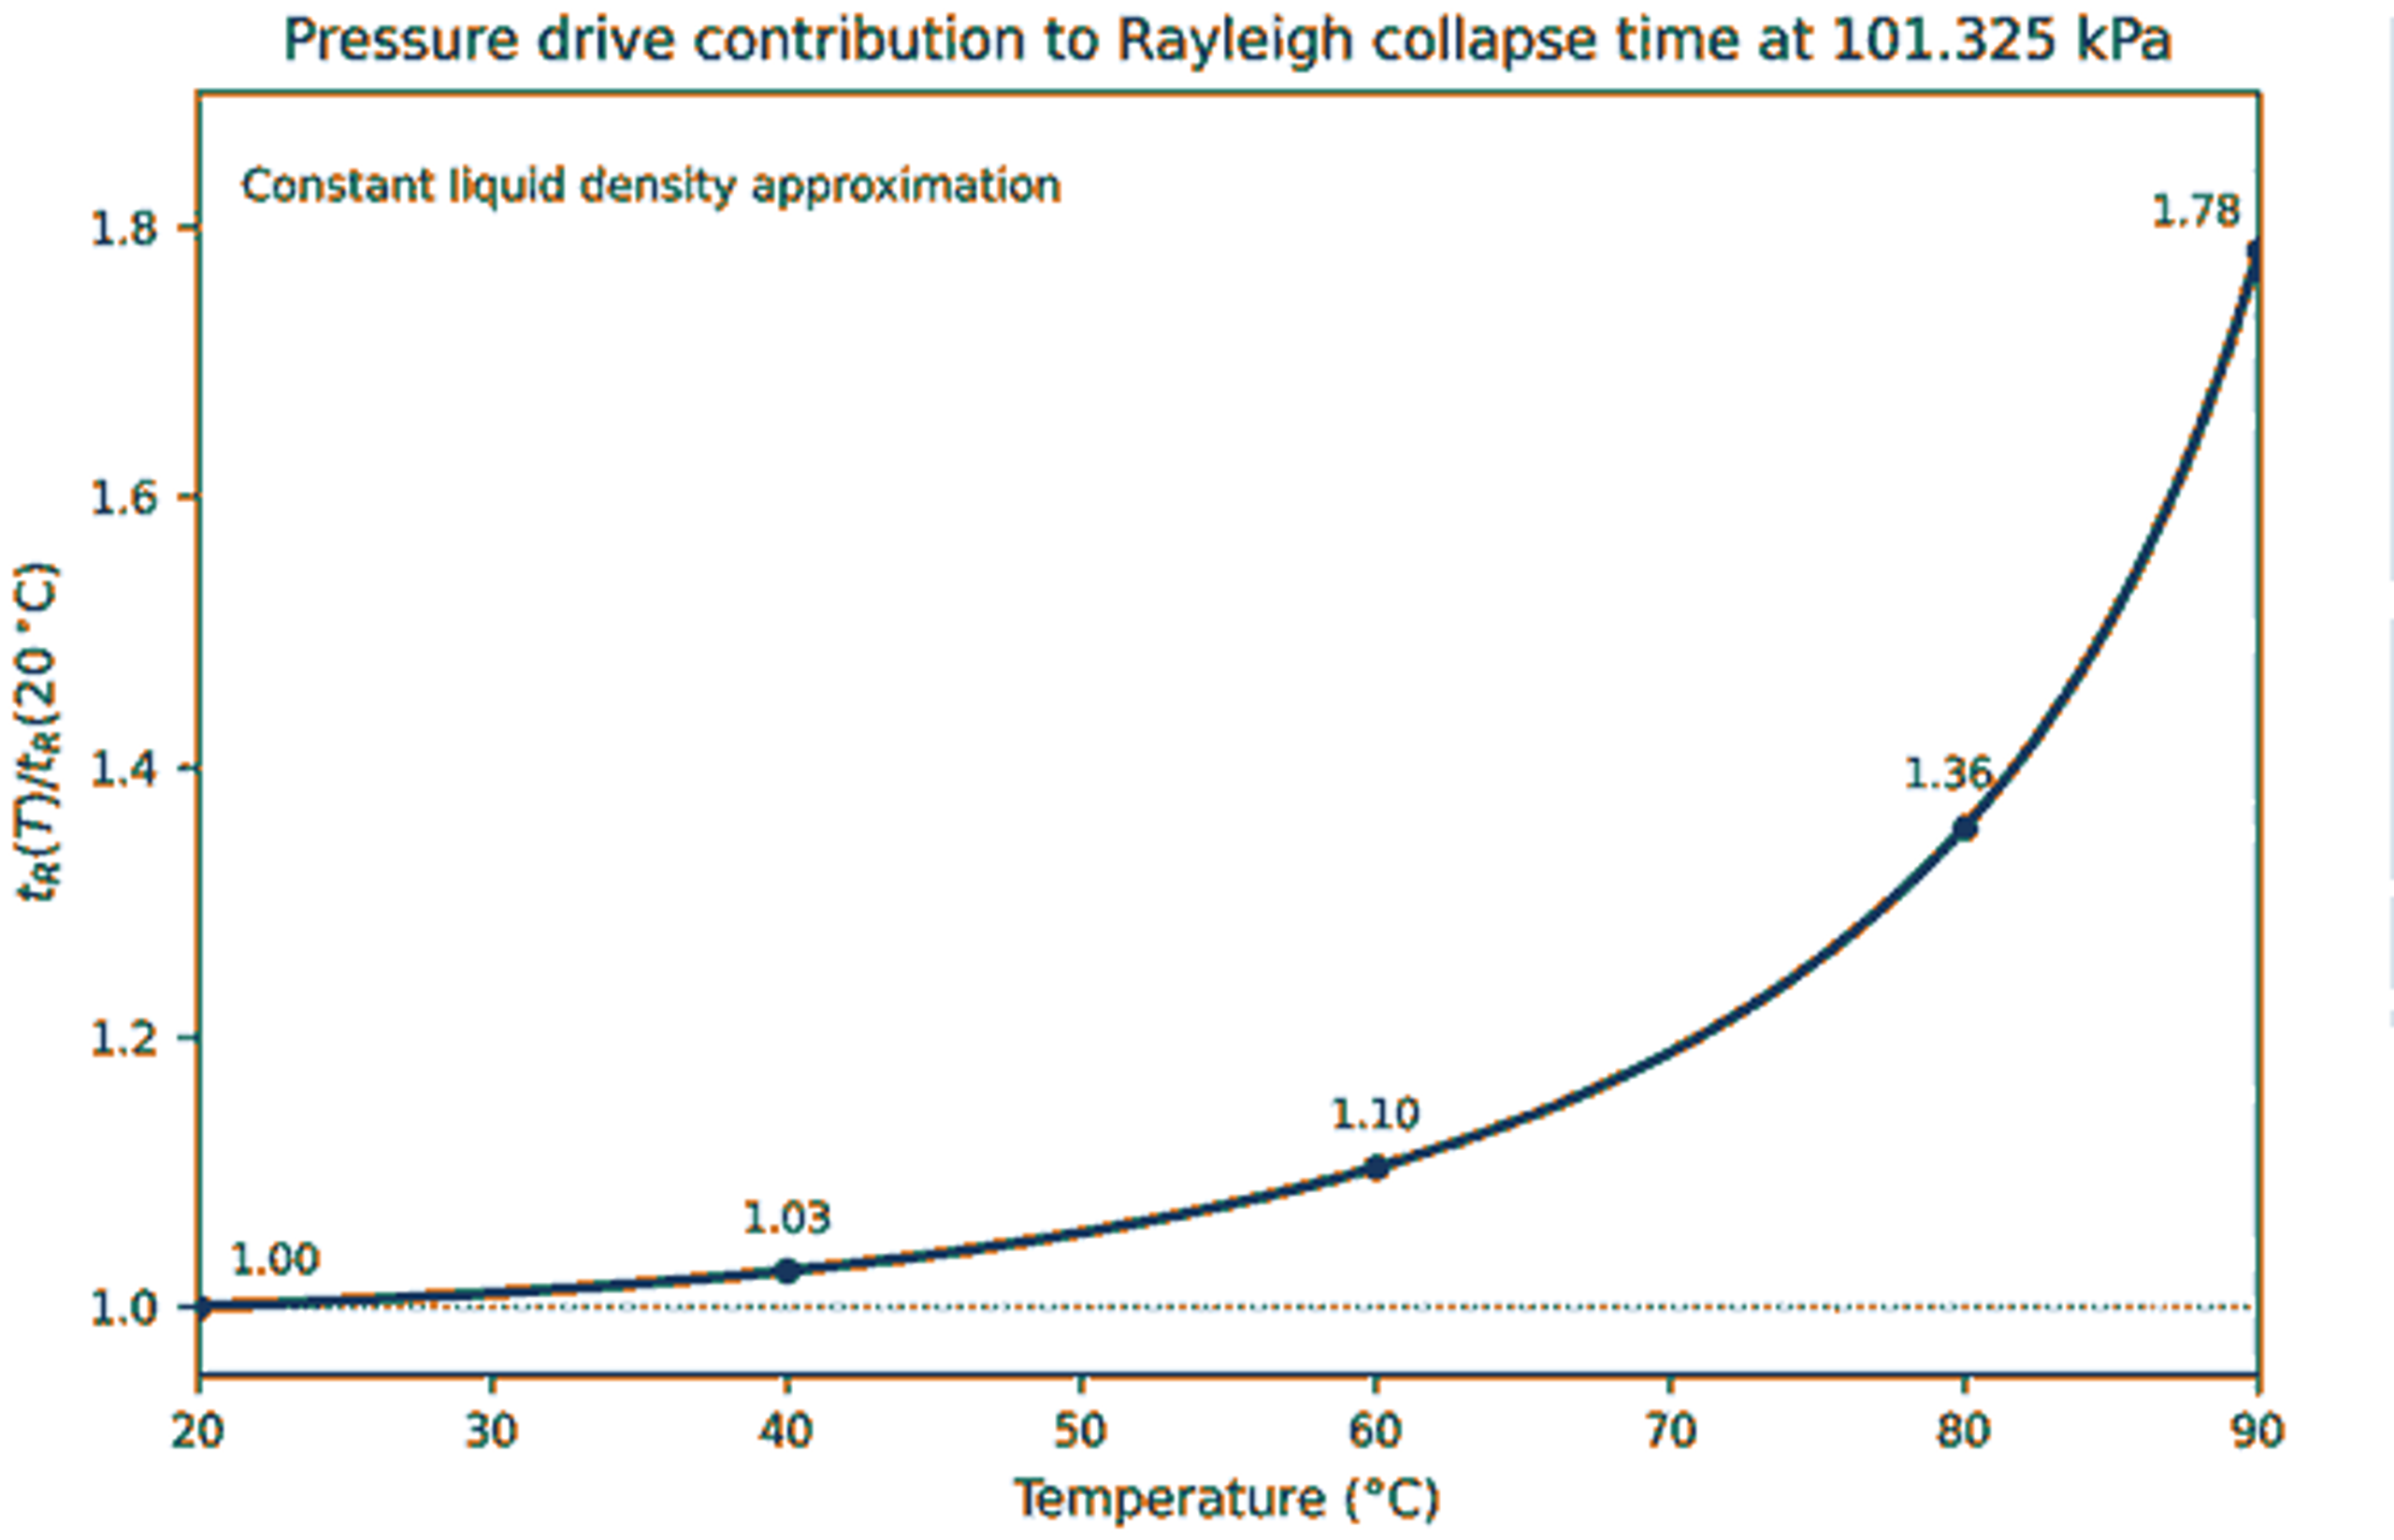
Figure 8. Normalized Rayleigh collapse time for water at 101.325 kPa, calculated using the IAPWS saturation pressure [30] and constant liquid density. The curve represents only the pressure drive contribution to the thermodynamic effect.
4.4 Effective Gas Behavior and Thermal Damping
The polytropic relation , where is constant for a prescribed polytropic process, provides an economical representation of gas thermodynamics. The exponent is not universal for an oscillating bubble. Prosperetti showed that thermal conduction makes the effective exponent and damping frequency dependent [7]. A slowly oscillating gas bubble approaches isothermal behavior because heat has time to cross the gas. During sufficiently rapid compression, the core tends toward adiabatic behavior while a thermal boundary layer persists near the interface.
A thermal Peclet number is:
The parameter compares interface motion with liquid thermal diffusion. Large values indicate that the interface moves faster than heat can diffuse across the bubble radius, producing a thin thermal layer. The Fourier number provides a complementary measure of diffusion. These groups can vary by orders of magnitude during one collapse because both and its rate of change vary rapidly.
Vapor introduces an additional relaxation process. If the condensation time is short compared with the collapse time, vapor pressure remains near equilibrium and vapor mass decreases rapidly. If condensation is slow, vapor behaves more like a compressible gas. This transition modifies both the effective stiffness and the energy dissipation and explains why the same radial equation can predict different shock amplitudes for different phase change closures [9,16].
4.5 Direct Measurements of Interfacial Temperature Change
Dular and Coutier Delgosha experimentally measured temperature variations around a single cavitation bubble [25]. They reported approximately 3 K of cooling in the liquid near the bubble during growth and up to approximately 4 K of heating during collapse. These measurements provide direct evidence that latent heat generates a transient thermal boundary layer even in room temperature water.
The reversal in sign is physically consistent. Evaporation during growth removes energy from the neighboring liquid, whereas condensation and compression during collapse return energy. Such measurements are experimentally difficult because the thermal layer is thin, the interface moves rapidly, and the curved surface distorts optical access. Measured temperature excursions should therefore be interpreted as spatially and temporally resolved values over a finite sensing volume rather than exact molecular interface temperatures.
These measurements also demonstrate why bulk temperature alone is insufficient. A liquid bath can remain nearly isothermal while the bubble interface undergoes a substantially larger transient temperature excursion. Models that impose at all times cannot capture this local feedback.
4.6 Ambient Temperature Effects in Water
Phan and coauthors examined single bubble dynamics in water across a broad ambient temperature range [26]. They found that maximum radius, first minimum radius, and collapse time increased with temperature, while predicted peak internal pressure and temperature decreased. The trend is consistent with a smaller collapse driving pressure and stronger vapor cushioning as saturation pressure increases.
Pei and coauthors extended the measurements to 23 °C through 90 °C in free field and near wall configurations [29]. They reported a monotonic weakening of collapse with temperature, reflected in the Rayleigh factor, minimum bubble volume, maximum collapse velocity, jet velocity, and bubble migration. Above approximately 70 °C, secondary cavitation nuclei appeared near the primary bubble surface around maximum expansion and subsequently contributed to surface wrinkling, instability, and fission.
Several mechanisms act simultaneously as water temperature increases:
-
increases sharply, thereby reducing at fixed ambient pressure.
-
A larger quantity of vapor can be present in the bubble at maximum radius.
-
Condensation must remove a greater vapor mass during collapse.
-
Latent heat exchange produces stronger coupling between pressure and temperature.
-
Viscosity and surface tension decrease, which can promote deformation even as radial collapse weakens.
-
Dissolved gas solubility and nucleation conditions change.
The resulting collapse is generally slower and less intense, but not necessarily simpler. Elevated temperature can reduce peak shock pressure and jet velocity while increasing instability, secondary cavitation, and fragmentation. A model that changes only captures the leading pressure effect but not the complete behavior.
4.7 Cryogenic Liquids
Cryogenic cavitation frequently exhibits strong thermodynamic effects because vapor density is relatively high and latent heat consumption can cool the liquid appreciably. Chen and coauthors compared single bubbles in liquid nitrogen with bubbles in room temperature water at similar ambient pressure [28]. Their experiments and model indicated a weaker collapse in liquid nitrogen. In the reported comparison, the minimum bubble radius was more than three times the value in water, and the maximum wall Mach number was approximately one fifth of the water value. The authors attributed the difference to the smaller effective pressure difference and to strong heat and mass transfer.
This result illustrates an important distinction. A cryogenic liquid can exhibit a large thermodynamic effect despite its low absolute temperature. The controlling factors are the saturation pressure slope, vapor density, latent heat, thermal conductivity, heat capacity, and available thermal subcooling. Cavitation in cryogenic pumps and rocket propellants therefore cannot be extrapolated directly from room temperature water experiments by matching only a conventional cavitation number.
A useful qualitative parameter is the Jakob number:
A small indicates that limited sensible heat is available relative to the latent heat required to create vapor, so local cooling can strongly suppress evaporation. Definitions vary across the cavitation literature, and comparisons require consistent reference temperatures and vapor density conventions.
4.8 High Vapor Pressure Mixtures
Preso and coauthors used aqueous ammonia to vary condensable vapor pressure while retaining a water based liquid system [27]. Increasing ammonia concentration increased vapor pressure and modified the collapse. Bubbles with higher vapor pressure resisted collapse, dissipated less total energy, and remained more spherical. The experiments also showed that vapor can be compressed far from equilibrium during collapse.
Mixtures introduce additional physical processes. Vapor composition can differ from liquid composition, individual species have different volatilities, diffusion rates can differ, and condensation can preferentially enrich one component. A single saturation pressure relation is therefore insufficient. Vapor liquid equilibrium, species diffusion, and mixture thermodynamics must be coupled to the bubble dynamics. The aqueous ammonia experiments are particularly useful because they separate vapor pressure effects from a simple change in bulk liquid temperature.
4.9 Consequences for Shock, Jet, Rebound, and Erosion
Thermodynamic effects modify every major output of bubble collapse.
Shock wave. Higher retained vapor pressure limits the maximum inward velocity and moderates the pressure rise near minimum radius. The principal collapse shock is therefore generally weaker. Nonequilibrium condensation can nevertheless generate a sharp pressure transient when vapor is compressed and then condenses rapidly [9].
Microjet. A lower pressure difference reduces the characteristic jet velocity. Pei and coauthors observed lower near wall jet velocity and reduced migration as temperature increased [29]. However, a longer collapse time can allow some perturbations to grow, while reduced surface tension can increase interface distortion. Jet strength and jet geometry must therefore be evaluated together.
Rebound. Retained vapor and permanent gas increase the minimum radius and can supply energy to the rebound. At the same time, a weaker collapse can reduce shock energy loss. A comparatively large rebound does not necessarily indicate a more violent collapse and may instead reflect stronger cushioning.
Erosion. Lower shock pressure and jet velocity generally reduce the severity of individual impacts. This mechanism contributes to the reduction of cavitation erosion that can occur at elevated temperature or in cryogenic liquids. Material properties also vary with temperature, and cloud scale cavitation can differ from single bubble behavior. Single bubble measurements isolate the hydrodynamic contribution but do not independently predict component service life.
Optical and chemical output. Additional vapor increases heat capacity and endothermic dissociation, reducing peak temperature and potentially suppressing light emission or altering radical yields [13,16-18]. A more spherical but vapor rich bubble can therefore produce weaker luminescence than a drier bubble having the same maximum radius.
4.10 Modeling Recommendations for Thermodynamic Regimes
A thermodynamically consistent single bubble calculation should include, at minimum:
-
A compressible radial equation, normally Keller Miksis or Gilmore, when collapse shock or rebound is required.
-
Separate partial pressures for permanent gas and vapor.
-
An energy equation for the bubble contents, with temperature dependent heat capacities when required.
-
A liquid thermal diffusion model or a validated thermal boundary layer approximation.
-
A phase change law driven by .
-
Temperature dependent liquid density, viscosity, surface tension, sound speed, latent heat, and saturation pressure.
-
A real fluid equation of state for cryogenic liquids or very high pressure collapse.
-
Validation against and at least one energy related quantity, such as rebound radius, shock pressure, or interfacial temperature.
A constant vapor pressure Rayleigh Plesset model remains useful for preliminary estimates, but its limitations should be stated explicitly. In water at atmospheric pressure, this limitation becomes increasingly important above approximately 60 °C to 70 °C because saturation pressure becomes a large fraction of ambient pressure. In cryogenic liquids and volatile mixtures, a phase change model is part of the primary force balance rather than an optional refinement.
Table 4. Representative experimental observations of thermodynamic effects in single bubbles.
| Study | Liquid and condition | Main observation | Modeling implication |
|---|---|---|---|
| Dular and Coutier Delgosha [25] | Water near ambient conditions | About 3 K cooling during growth and up to about 4 K heating during collapse | Resolve a transient liquid thermal layer and local temperature feedback |
| Phan et al. [26] | Water, 20 to 80 degrees Celsius | Longer collapse and larger minimum radius at higher temperature; lower predicted peak pressure and temperature | Include temperature dependent saturation pressure and heat transfer |
| Preso et al. [27] | Water and aqueous ammonia | Higher vapor pressure resisted collapse and reduced total energy dissipation | Model mixture vapor composition and nonequilibrium compression |
| Chen et al. [28] | Liquid nitrogen compared with water | Larger minimum radius and much lower maximum Mach number in liquid nitrogen | Use cryogenic properties, phase change, and variable compressibility |
| Pei et al. [29] | Water, 23 to 90 degrees Celsius | Monotonic collapse weakening, lower jet speed, secondary cavitation above about 70 degrees Celsius | Couple thermal attenuation with instability and nucleation behavior |
5. Conclusions
A single cavitation bubble provides a controlled system for investigating one of the strongest forms of hydrodynamic energy focusing. The bubble grows when local pressure decreases or energy is deposited, reaches a maximum volume, and collapses when the surrounding pressure recovers. During collapse, liquid inertia produces rapid radial acceleration, while finite sound speed, bubble contents, geometry, and thermodynamic exchange determine how the available energy is partitioned.
The principal collapse phenomena include shock wave emission, rebound, microjet formation, toroidal transition, fragmentation, localized wall loading, heating, light emission, and chemical activity. A spherical collapse concentrates energy into internal compression and a compact pressure wave. A nonspherical collapse diverts part of that energy into a jet, translation, vortex motion, and multiple shock sources. Near a rigid wall, the bubble generally migrates toward the boundary and the jet is directed toward it, but erosion is governed by the complete jet and toroidal collapse sequence rather than by one pressure peak.
The Rayleigh model remains the appropriate starting point because it provides the collapse time and the fundamental inertial scale. The Rayleigh Plesset equation adds gas pressure, vapor pressure, viscosity, and surface tension. Keller Miksis and Prosperetti Lezzi formulations introduce first order compressibility, while the Gilmore equation accounts for pressure dependent liquid density and sound speed. Boundary integral methods are required for strong deformation and jetting. Compressible multiphase computational fluid dynamics is required when shocks, viscosity, topology change, and complex wall geometry must be resolved simultaneously.
The thermodynamic effect is a dynamic feedback mechanism rather than a simple correction to vapor pressure. Evaporation cools the interface and suppresses further growth. Condensation releases latent heat, while finite condensation rates can retain vapor within the bubble and cushion collapse. As water temperature rises, saturation pressure increases sharply and collapse driving pressure decreases. Experiments in hot water, liquid nitrogen, and aqueous ammonia confirm larger minimum radii, reduced collapse velocity, weaker shocks or jets, and changes in rebound and stability. Direct measurements also demonstrate transient cooling and heating of several kelvin in the liquid immediately surrounding the bubble.
For engineering prediction, the model must be matched to the required output. Collapse time can often be estimated from Rayleigh scaling. Shock amplitude requires a compressible formulation. Jet loading requires nonspherical dynamics. Peak temperature, vapor content, and cryogenic behavior require coupled heat and mass transfer. Reliable simulations should be validated against multiple observables because agreement with radius history alone does not establish the accuracy of energy partition, internal pressure, thermal behavior, or material loading.
Nomenclature
The following nomenclature defines the symbols and abbreviations used in this article. Unless otherwise stated, quantities are expressed in SI units.
| Symbol | Definition | SI unit or status |
|---|---|---|
| c | Small signal sound speed in the liquid | m s⁻¹ |
| C | Local sound speed at the bubble wall in the Gilmore model | m s⁻¹ |
| Initial bubble potential energy | J | |
| Energy in the liquid jet and directed flow | J | |
| Rebound bubble energy | J | |
| Radiated shock wave energy | J | |
| Energy transferred by heat and phase change | J | |
| Viscous and vortical energy loss | J | |
| h | Distance from the bubble center to a nearby wall | m |
| H | Liquid enthalpy difference | m² s⁻² |
| j | Interfacial vapor mass flux, positive into the bubble | kg m⁻² s⁻¹ |
| Ja | Jakob number | dimensionless |
| Latent heat of vaporization | J kg⁻¹ | |
| Ma | Mach number | dimensionless |
| Total pressure inside the bubble | Pa | |
| Noncondensable gas partial pressure | Pa | |
| Saturation vapor pressure | Pa | |
| Far field liquid pressure | Pa | |
| Pe | Thermal Peclet number | dimensionless |
| R | Equivalent bubble radius | m |
| Reference or equilibrium radius | m | |
| Maximum bubble radius | m | |
| Minimum bubble radius | m | |
| r | Radial coordinate from the bubble center | m |
| Rayleigh collapse time | s | |
| Interfacial temperature | K | |
| Ambient liquid temperature | K | |
| Microjet velocity | m s⁻¹ | |
| Rayleigh velocity scale | m s⁻¹ | |
| Bubble volume | m³ |
Greek Letters
| Symbol | Letter name | Meaning in this chapter |
|---|---|---|
| Alpha | Liquid thermal diffusivity | |
| γ | Gamma | Surface tension |
| Gamma | Bubble standoff parameter relative to a wall | |
| κ | Kappa | Polytropic exponent of the bubble gas |
| μ | Mu | Dynamic viscosity |
| ρ | Rho | Liquid density |
| ζ | Zeta | Collapse anisotropy parameter |
| φ | Phi | Velocity potential in potential flow models |
| τ | Tau | Viscous stress tensor in multiphase flow equations |
| Δ | Delta | Collapse driving pressure difference |
Bibliography
[1] Rayleigh, Lord. On the Pressure Developed in a Liquid during the Collapse of a Spherical Cavity. The London, Edinburgh, and Dublin Philosophical Magazine and Journal of Science. 1917;34(200):94-98. https://doi.org/10.1080/14786440808635681.
[2] Plesset MS. The Dynamics of Cavitation Bubbles. Journal of Applied Mechanics. 1949;16(3):277-282. https://doi.org/10.1115/1.4009975.
[3] Gilmore FR. The Growth or Collapse of a Spherical Bubble in a Viscous Compressible Liquid. Hydrodynamics Laboratory Report 26-4. Pasadena, CA: California Institute of Technology; 1952.
[4] Hickling R, Plesset MS. Collapse and Rebound of a Spherical Bubble in Water. Physics of Fluids. 1964;7(1):7-14. https://doi.org/10.1063/1.1711058.
[5] Benjamin TB, Ellis AT. The Collapse of Cavitation Bubbles and the Pressures Thereby Produced against Solid Boundaries. Philosophical Transactions of the Royal Society of London. Series A. 1966;260:221-240. https://doi.org/10.1098/rsta.1966.0046.
[6] Lauterborn W, Bolle H. Experimental Investigations of Cavitation Bubble Collapse in the Neighborhood of a Solid Boundary. Journal of Fluid Mechanics. 1975;72(2):391-399. https://doi.org/10.1017/S0022112075003448.
[7] Prosperetti A. Thermal Effects and Damping Mechanisms in the Forced Radial Oscillations of Gas Bubbles in Liquids. Journal of the Acoustical Society of America. 1977;61(1):17-27. https://doi.org/10.1121/1.381252.
[8] Keller JB, Miksis M. Bubble Oscillations of Large Amplitude. Journal of the Acoustical Society of America. 1980;68(2):628-633. https://doi.org/10.1121/1.384720.
[9] Fujikawa S, Akamatsu T. Effects of the Nonequilibrium Condensation of Vapor on the Pressure Wave Produced by the Collapse of a Bubble in a Liquid. Journal of Fluid Mechanics. 1980;97(3):481-512. https://doi.org/10.1017/S0022112080002662.
[10] Prosperetti A, Lezzi A. Bubble Dynamics in a Compressible Liquid. Part 1. First Order Theory. Journal of Fluid Mechanics. 1986;168:457-478. https://doi.org/10.1017/S0022112086000460.
[11] Lezzi A, Prosperetti A. Bubble Dynamics in a Compressible Liquid. Part 2. Second Order Theory. Journal of Fluid Mechanics. 1987;185:289-321. https://doi.org/10.1017/S0022112087003185.
[12] Vogel A, Lauterborn W, Timm R. Optical and Acoustic Investigations of the Dynamics of Laser Produced Cavitation Bubbles near a Solid Boundary. Journal of Fluid Mechanics. 1989;206:299-338. https://doi.org/10.1017/S0022112089002314.
[13] Yasui K. Alternative Model of Single Bubble Sonoluminescence. Journal of the Acoustical Society of America. 1995;98(5):2772-2782. https://doi.org/10.1121/1.413242.
[14] Philipp A, Lauterborn W. Cavitation Erosion by Single Laser Produced Bubbles. Journal of Fluid Mechanics. 1998;361:75-116. https://doi.org/10.1017/S0022112098008738.
[15] Pecha R, Gompf B. Microimplosions: Cavitation Collapse and Shock Wave Emission on a Nanosecond Time Scale. Physical Review Letters. 2000;84(6):1328-1330. https://doi.org/10.1103/PhysRevLett.84.1328.
[16] Storey BD, Szeri AJ. Water Vapor, Sonoluminescence and Sonochemistry. Proceedings of the Royal Society A. 2000;456(1999):1685-1709. https://doi.org/10.1098/rspa.2000.0582.
[17] Didenko YT, Suslick KS. The Energy Efficiency of Formation of Photons, Radicals and Ions during Single Bubble Cavitation. Nature. 2002;418:394-397.
[18] Flannigan DJ, Suslick KS. Plasma Formation and Temperature Measurement during Single Bubble Cavitation. Nature. 2005;434:52-55.
[19] Wang QX, Blake JR. Nonspherical Bubble Dynamics in a Compressible Liquid. Part 1. Travelling Acoustic Wave. Journal of Fluid Mechanics. 2010;659:191-224. https://doi.org/10.1017/S0022112010002430.
[20] Obreschkow D, Tinguely M, Dorsaz N, Kobel P, de Bosset A, Farhat M. A Universal Scaling Law for Jets of Collapsing Bubbles. Physical Review Letters. 2011;107:204501.
[21] Wang QX, Blake JR. Nonspherical Bubble Dynamics in a Compressible Liquid. Part 2. Acoustic Standing Wave. Journal of Fluid Mechanics. 2011;679:559-581.
[22] Tinguely M, Obreschkow D, Kobel P, Dorsaz N, de Bosset A, Farhat M. Energy Partition at Spherical Bubble Collapse. Physical Review E. 2012;86:046315.
[23] Supponen O, Obreschkow D, Tinguely M, Kobel P, Dorsaz N, Farhat M. Scaling Laws for Jets of Single Cavitation Bubbles. Journal of Fluid Mechanics. 2016;802:263-293.
[24] Supponen O, Obreschkow D, Kobel P, Tinguely M, Dorsaz N, Farhat M. Shock Waves from Nonspherical Cavitation Bubbles. Physical Review Fluids. 2017;2(9):093601. https://doi.org/10.1103/PhysRevFluids.2.093601.
[25] Dular M, Coutier Delgosha O. Thermodynamic Effects during Growth and Collapse of a Single Cavitation Bubble. Journal of Fluid Mechanics. 2013;736:44-66. https://doi.org/10.1017/jfm.2013.525.
[26] Phan TH, Kadivar E, Nguyen VT, el Moctar O, Park WG. Thermodynamic Effects on Single Cavitation Bubble Dynamics under Various Ambient Temperature Conditions. Physics of Fluids. 2022;34(2):023318. https://doi.org/10.1063/5.0076913.
[27] Preso DB, Fuster D, Sieber AB, Obreschkow D, Farhat M. Vapor Compression and Energy Dissipation in a Collapsing Laser Induced Bubble. Physics of Fluids. 2024;36(3):033342. https://doi.org/10.1063/5.0200361.
[28] Chen J, Chen T, Geng H, Huang B, Cao Z. Investigation on Dynamic Characteristics and Thermal Effects of Single Cavitation Bubble in Liquid Nitrogen. Physics of Fluids. 2024;36(2):023325.
[29] Pei S, Zhang AM, Liu C, Zhang T, Han R, Li S. Influence of Ambient Temperature on Cavitation Bubble Dynamics. Journal of Fluid Mechanics. 2025;1023:A28. https://doi.org/10.1017/jfm.2025.10838.
[30] International Association for the Properties of Water and Steam. SR1-86(1992): Revised Supplementary Release on Saturation Properties of Ordinary Water Substance. IAPWS; 1992.
[31] Liang XX, Linz N, Freidank S, Paltauf G, Vogel A. Comprehensive Analysis of Spherical Bubble Oscillations and Shock Wave Emission in Laser Induced Cavitation. Journal of Fluid Mechanics. 2022;940:A5.
[32] Kozyuk O. Hydrodynamic Cavitation. [Unpublished technical manuscript and supporting data] 2026.