
Technical publication
Back to publications
Fundamentals
Physical Basis of Hydrodynamic Cavitation Generation
okozyuk.com
Published
Read complete publication for whole-document Find and printing. Browser Find and native printing on this reader include only loaded content.
2.2 Pressure Recovery and Cavitation Regime
Collapse severity depends on both the minimum pressure reached during cavity growth and the pressure recovered downstream. Low downstream pressure can sustain a long attached cavity that collapses weakly or outside the intended treatment zone. Stronger pressure recovery can shorten the cavity and increase collapse frequency, although excessive recovery can intensify wall erosion if collapse occurs adjacent to a solid boundary. Cavitation intensity should therefore be characterized using both a cavitation index and a measure of pressure recovery. A convenient pressure recovery ratio is:
where is the upstream pressure and is the downstream pressure. A coefficient based explicitly on the local minimum pressure may instead be defined as:
The first ratio is readily obtained from bulk measurements. The second is more directly related to the local recovery process but generally requires local pressure measurements or a validated flow model. Figure 2.1 illustrates the resulting qualitative regime structure. Incipient cavitation, developed cloud cavitation, transient cavity shedding, and supercavitation can occur at comparable nominal pressure drops when geometry, nuclei, and pressure recovery differ.
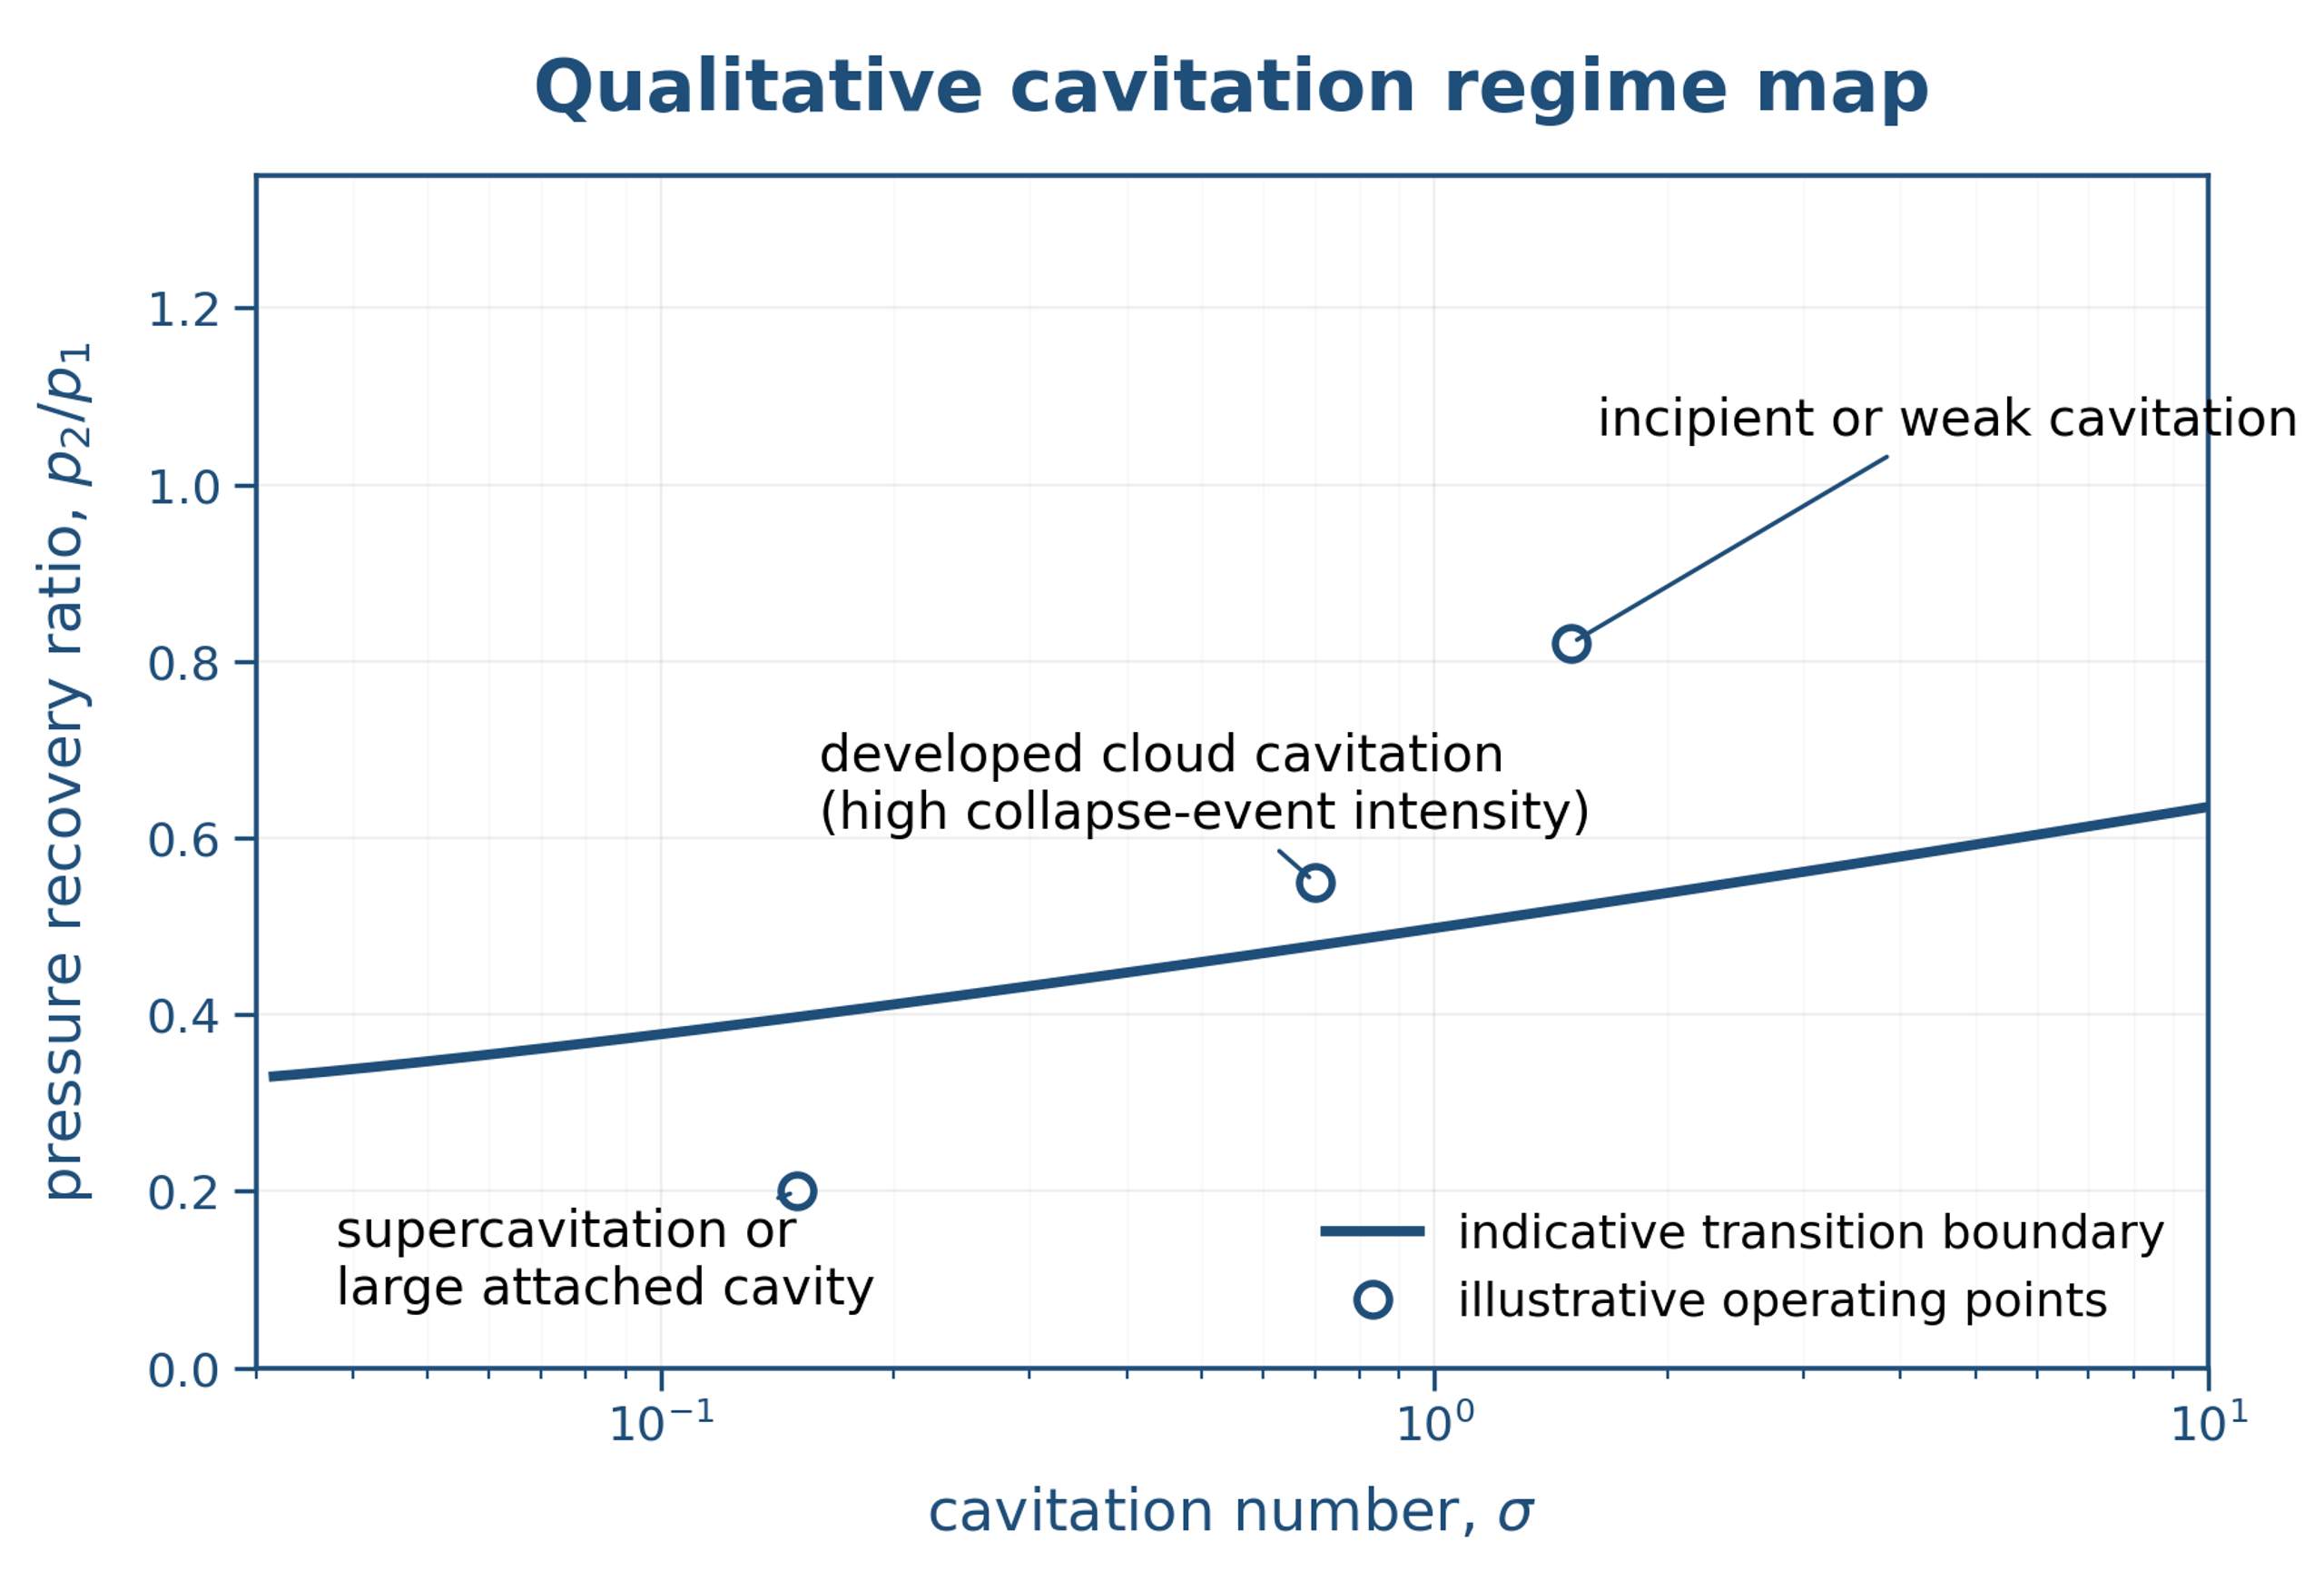
Figure 2.1. Qualitative cavitation regime map using cavitation number and pressure recovery ratio. Boundaries are device and liquid dependent and are shown only to organize the discussion. [1,2,3]