
Technical publication
Back to publications
Physical Basis of Hydrodynamic Cavitation Generation
okozyuk.com
Published
Physical Basis of Hydrodynamic Cavitation Generation
Abstract
Hydrodynamic cavitation is generated when flow acceleration or vortical motion reduces local static pressure sufficiently to permit the formation of vapor and gas cavities, followed by pressure recovery and collapse. This article examines the physical basis of cavitation inception and hydrodynamic generation, with emphasis on conservation of flow, mechanical energy balance, cavitation number, pressure recovery, liquid properties, and the role of nuclei. The principal families of static and dynamic cavitation devices are compared, including orifice plates, multihole plates, Venturi restrictions, vortex chambers, rotor stator systems, and multistage baffles. The analysis shows that cavitation intensity cannot be characterized by pressure drop or cavitation number alone. Collapse behavior also depends on downstream pressure recovery, gas content, temperature, viscosity, interfacial tension, residence time, void fraction, and cavity transport. Collective cloud behavior further limits the applicability of single bubble descriptions. A physically meaningful engineering assessment therefore requires explicit definition of reference pressures and velocities together with complementary dimensionless groups and process performance metrics. These considerations provide a consistent framework for comparing cavitation devices, identifying operating regimes, and controlling the location and intensity of cavity collapse.
2.1 Pressure, Velocity, and Cavitation Inception
For steady incompressible flow through a hydrodynamic cavitation device, conservation of volume gives the volumetric flow rate as:
where denotes the volumetric flow rate, the local cross sectional area, and the area averaged liquid velocity. Consequently, a reduction in flow area increases the mean velocity. Along a streamline, the mechanical energy balance can be expressed as:
where is static pressure, is liquid density, is gravitational acceleration, is elevation, is the kinetic energy correction factor, and is the irreversible head loss. For a short horizontal restriction, the elevation term is generally negligible. Flow acceleration converts static pressure into kinetic energy, whereas separation, turbulence, two phase flow, and downstream mixing dissipate part of the recoverable pressure.
Cavitation inception becomes possible when the local pressure approaches an effective inception pressure. In an ideal pure liquid at a defect free interface, the tensile limit can lie below the equilibrium vapor pressure. Practical process liquids, however, contain microscopic nuclei, dissolved gas, suspended particles, surface roughness, and surfactants, and these features promote inception before the ideal tensile limit is reached. The saturation vapor pressure is therefore a necessary thermodynamic parameter but is not, by itself, sufficient to predict inception. Increasing temperature raises , while increased dissolved gas content generally increases the population of available nuclei.
The cavitation number is the most widely used dimensionless index for characterizing the relation between pressure level and dynamic pressure:
where and denote the selected reference pressure and velocity. A smaller generally corresponds to a greater tendency toward cavitation. Because the definition is not universal, studies may use upstream or downstream pressure and may define velocity at the throat or from a bulk flow estimate. Therefore, a reported value of is interpretable only when the pressure location and velocity definition are specified [1,2,3].
For geometrically similar restrictions, Reynolds, Weber, and Euler numbers provide additional scaling measures:
where is a characteristic hydraulic diameter, is dynamic viscosity, is surface or interfacial tension, and is pressure drop. Reynolds number compares inertial and viscous effects, Weber number compares inertial loading with interfacial tension, and Euler number relates pressure loss to dynamic pressure. These parameters do not uniquely determine the cavity field, but they provide a consistent basis for comparing geometrically related devices and operating scales.
2.2 Pressure Recovery and Cavitation Regime
Collapse severity depends on both the minimum pressure reached during cavity growth and the pressure recovered downstream. Low downstream pressure can sustain a long attached cavity that collapses weakly or outside the intended treatment zone. Stronger pressure recovery can shorten the cavity and increase collapse frequency, although excessive recovery can intensify wall erosion if collapse occurs adjacent to a solid boundary. Cavitation intensity should therefore be characterized using both a cavitation index and a measure of pressure recovery. A convenient pressure recovery ratio is:
where is the upstream pressure and is the downstream pressure. A coefficient based explicitly on the local minimum pressure may instead be defined as:
The first ratio is readily obtained from bulk measurements. The second is more directly related to the local recovery process but generally requires local pressure measurements or a validated flow model. Figure 2.1 illustrates the resulting qualitative regime structure. Incipient cavitation, developed cloud cavitation, transient cavity shedding, and supercavitation can occur at comparable nominal pressure drops when geometry, nuclei, and pressure recovery differ.
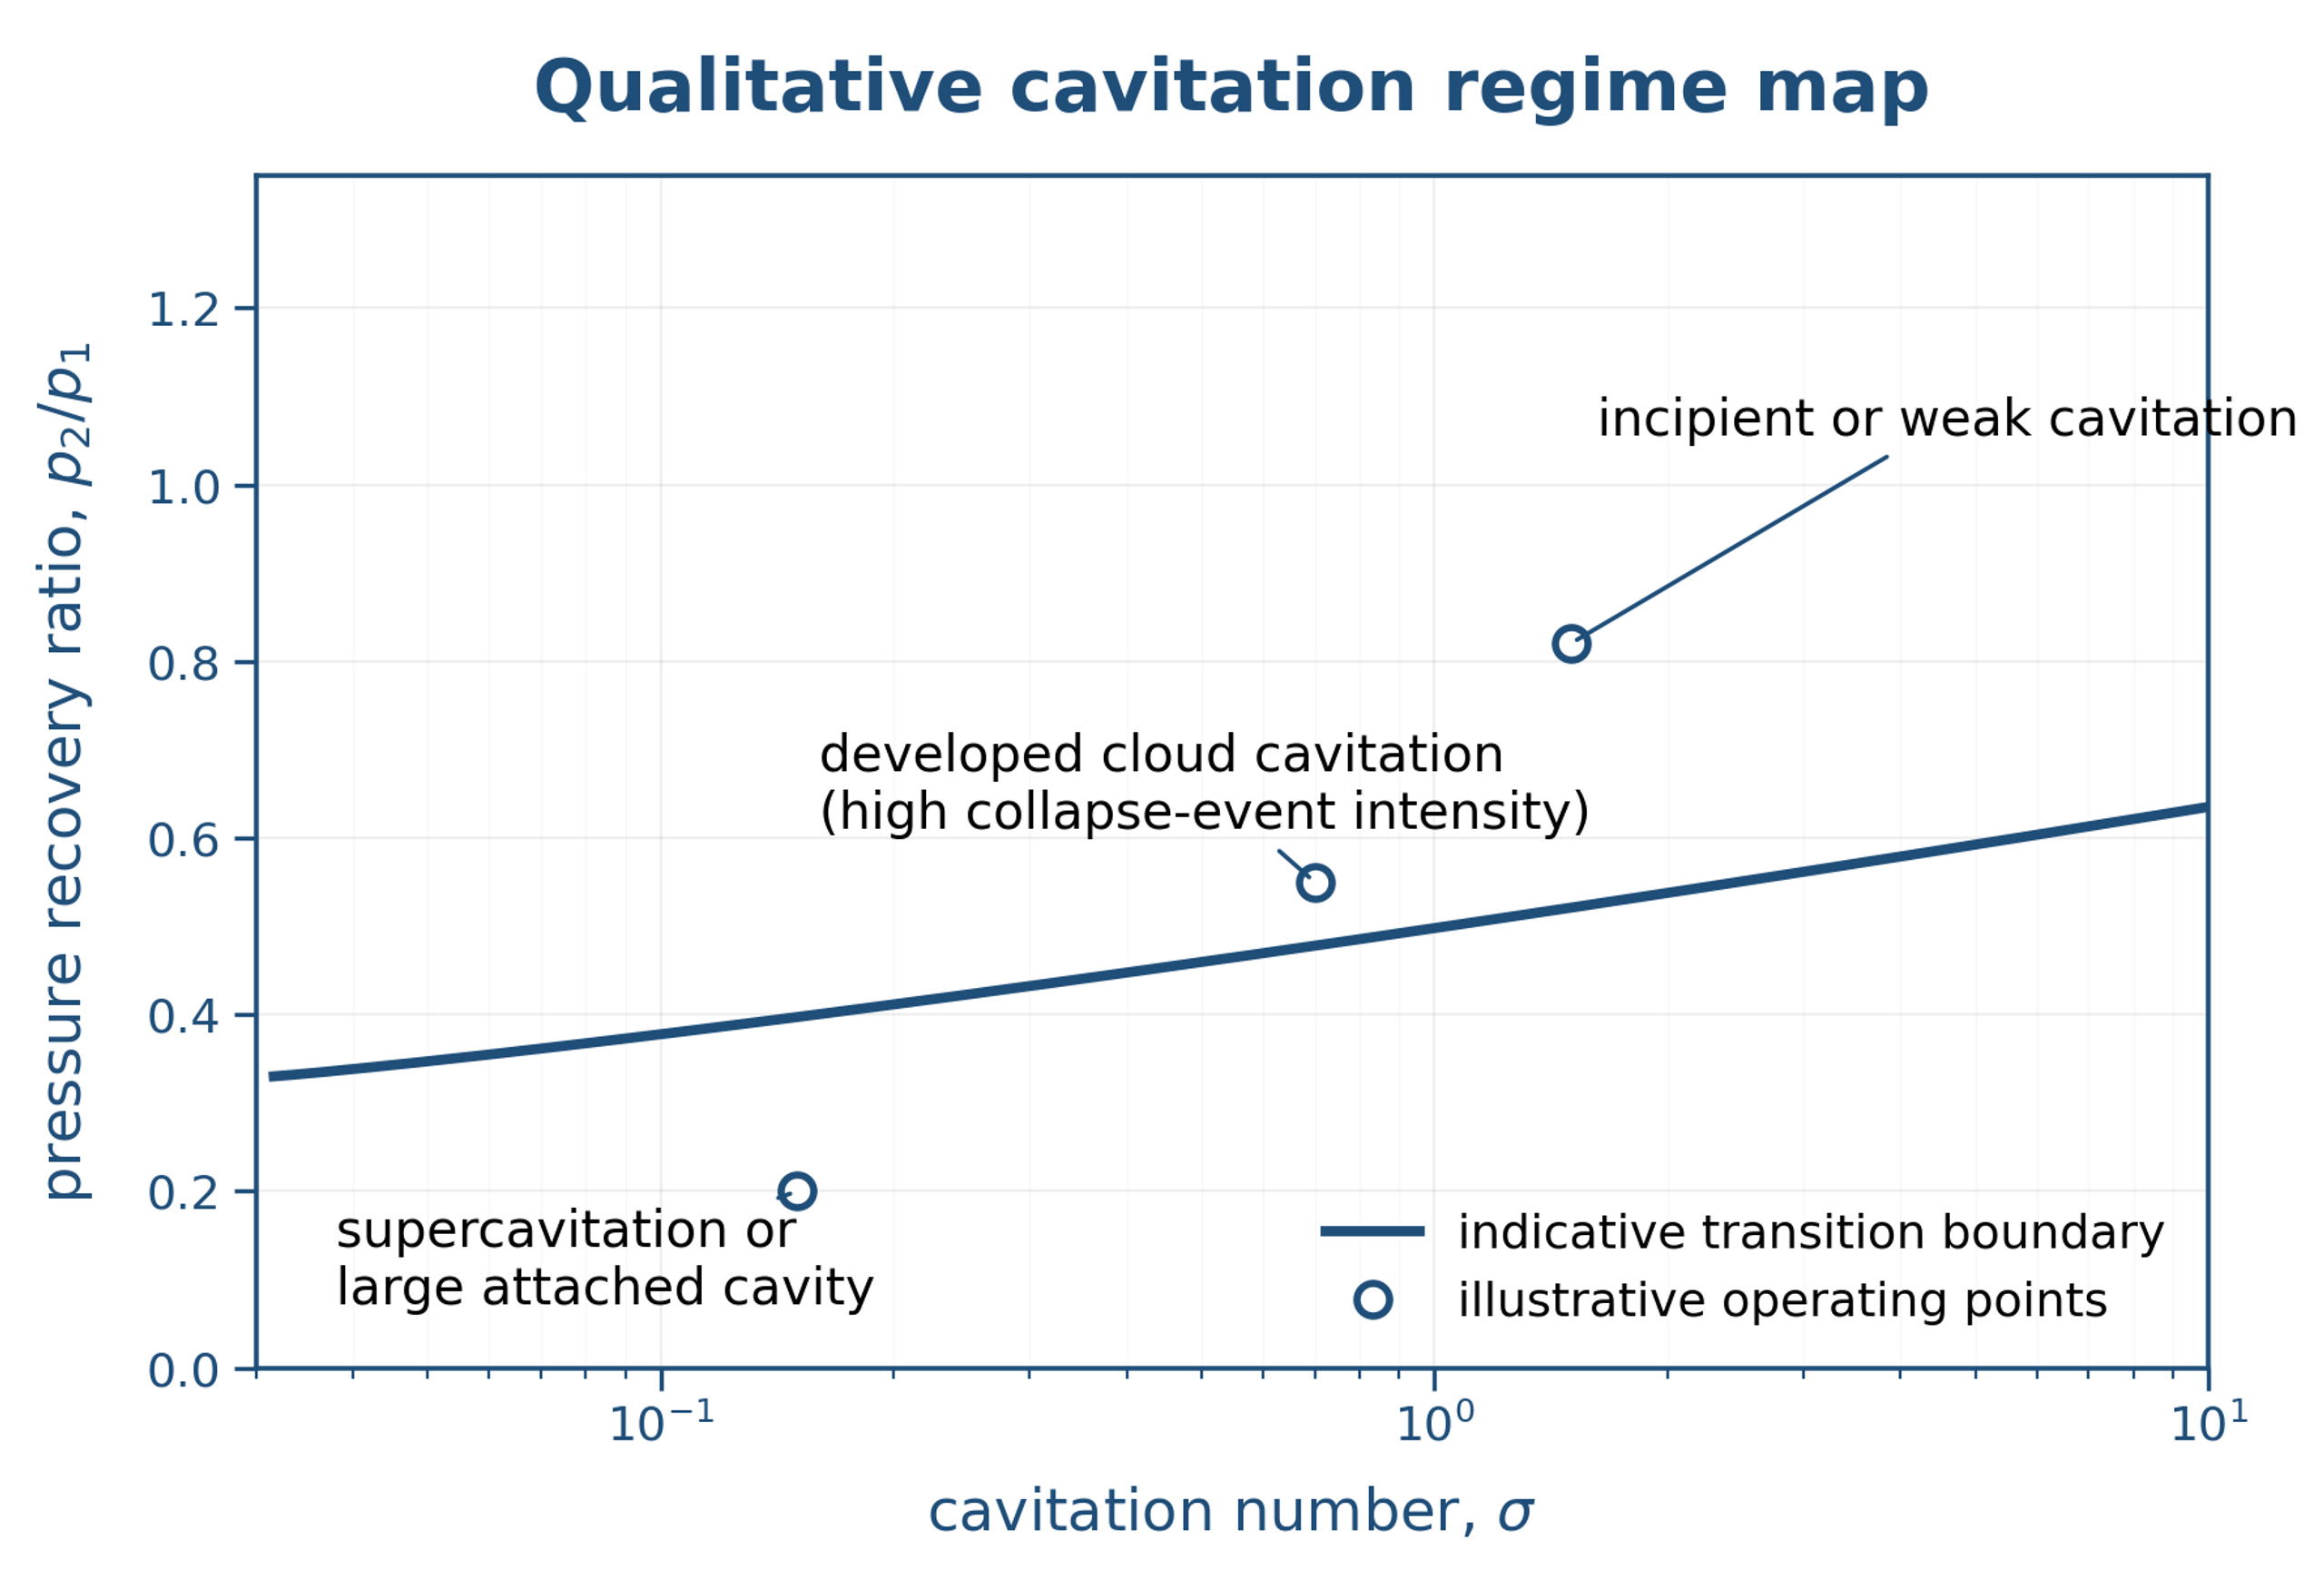
Figure 2.1. Qualitative cavitation regime map using cavitation number and pressure recovery ratio. Boundaries are device and liquid dependent and are shown only to organize the discussion. [1,2,3]
2.3 Device Families
Hydrodynamic cavitators may be classified by the mechanism that creates the low pressure region. Figure 2.2 summarizes representative static and dynamic configurations. Orifice plates generate high speed jets and separated shear layers. Venturi devices accelerate and decelerate the flow more gradually, which can reduce irreversible losses relative to a sharp restriction. Multihole plates divide the flow into multiple jets and increase the number of simultaneous cavities. Vortex devices use tangential momentum to produce a low pressure core. Rotor stator systems combine rotational shear with rapid pressure fluctuations, while multistage baffles impose repeated cycles of acceleration and recovery. Contemporary studies of vortex based devices, continuous emulsification, and rotary cavitation illustrate the influence of geometry, scale up, and scale out on device performance [4,5,6].
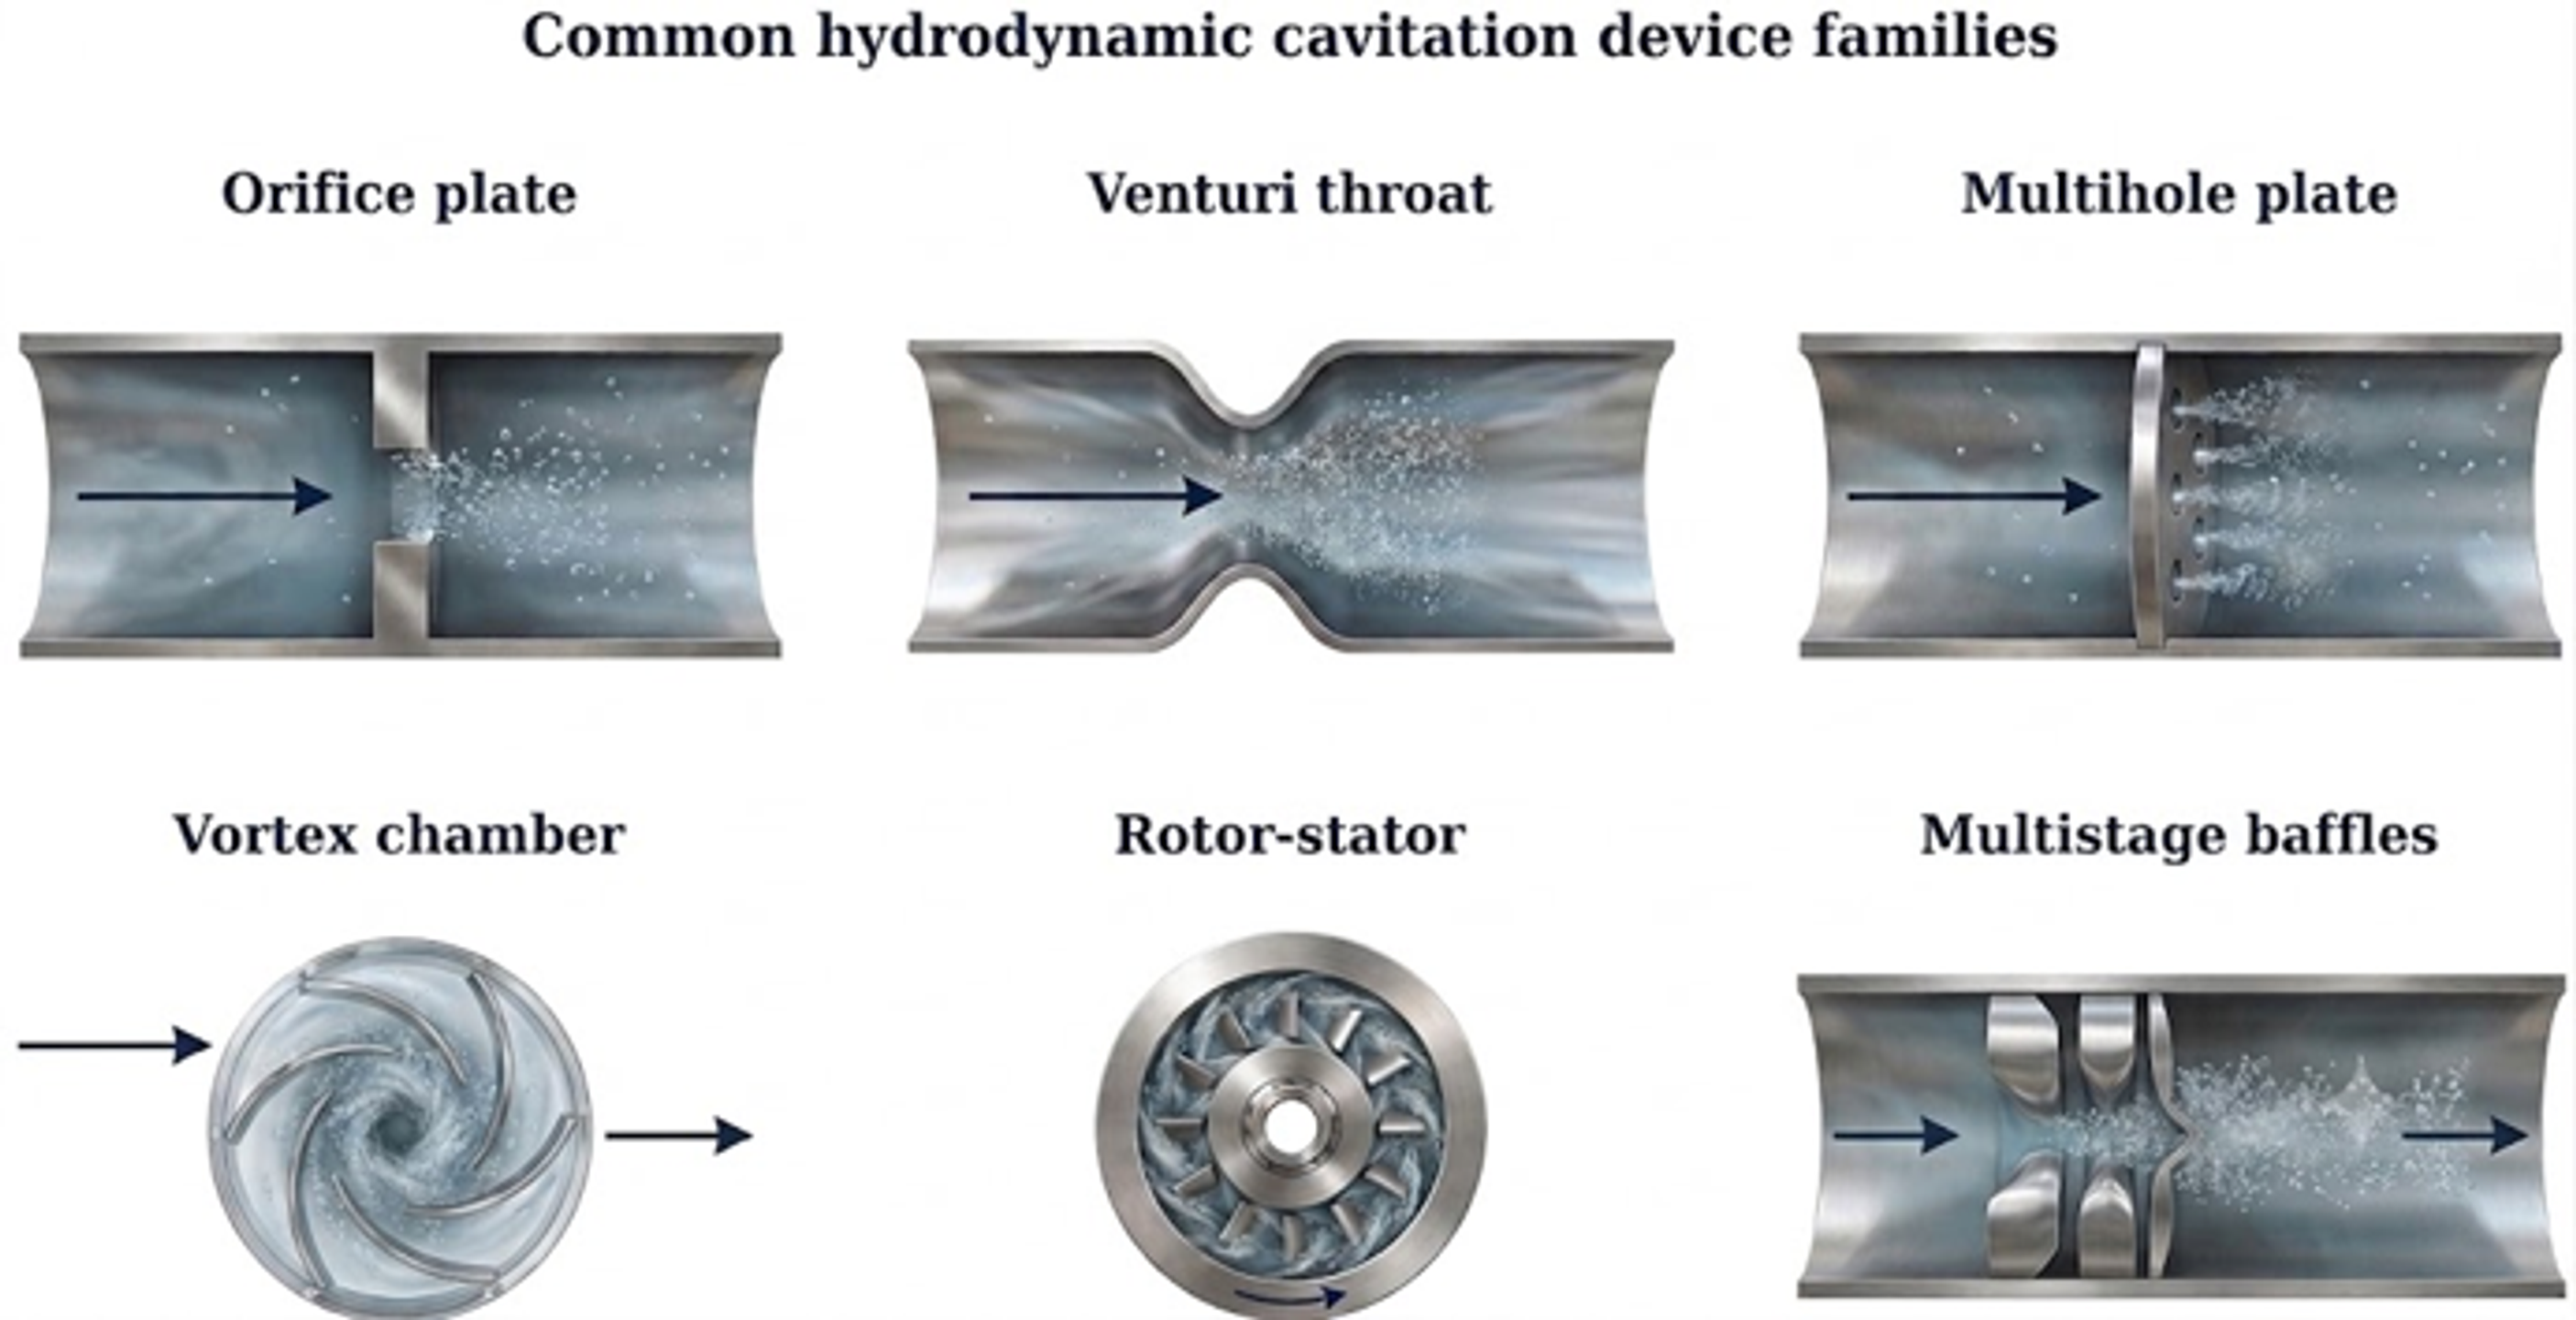
Figure 2.2. Common hydrodynamic cavitation device families. [7]
Table 2.1. Principal device characteristics and typical engineering implications.
| Device | Cavitation zone | Strengths | Main limitations |
|---|---|---|---|
| Single orifice | Jet vena contracta and downstream shear layer | Simple, compact, inexpensive, easy to characterize | High pressure loss; clogging risk; wall collapse and erosion if poorly designed |
| Multihole plate | Multiple jets and interacting cavity clouds | High event density; distributes flow; geometry is easily varied | Hole fouling; unequal flow distribution; manufacturing tolerances matter |
| Venturi | Throat and diffuser | Smoother acceleration; potentially lower irreversible loss | Longer device; cavity position depends strongly on diffuser and backpressure |
| Vortex chamber | Low pressure vortex core | Cavitation can occur away from walls; open flow passage; scale out is practical | Swirl stability and outlet geometry are critical; pressure measurements may not represent core pressure |
| Rotor or rotor stator | Rotor tip, gap, and wake regions | High throughput and strong mixing; tunable rotational speed | Moving parts, seals, mechanical wear, and more complex scale up |
| Multistage baffles | Repeated local restrictions | Multiple treatment zones in one body; adjustable designs are possible | Cumulative pressure loss and potential solids deposition |
2.4 Nucleation, Gas Content, and Liquid Properties
The same nominal hydraulic condition can produce markedly different cavitation fields in filtered water, gas saturated liquids, emulsions, and high solids slurries. Cavitation nuclei may be trapped in surface crevices, transported on particles, stabilized by surfactants, or intentionally introduced. Dissolved gas can diffuse into growing cavities and cushion final collapse because noncondensable gas remains during compression. Conversely, an increased nuclei population can raise the number of collapse events and broaden the spatial coverage of treatment.
Viscosity attenuates radial bubble motion and small scale turbulence, while surface tension resists cavity growth and deformation of droplets or particle interfaces. Vapor pressure increases strongly with temperature, which generally promotes inception but can reduce collapse severity because a larger vapor mass must condense. Temperature also affects reaction kinetics, gas solubility, viscosity, and product stability. A complete process description should therefore report, at minimum, temperature, viscosity, density, surface or interfacial tension when relevant, gas content or degassing condition, solids concentration, and surfactant content.
Table 2.2. Dimensionless groups and engineering quantities used in cavitation processing.
| Quantity | Definition | Primary use | Important qualification |
|---|---|---|---|
| Cavitation number | Inception and relative cavitation intensity | State pressure and velocity reference locations | |
| Reynolds number | Dynamic similarity and turbulence | Does not capture nuclei or two phase effects | |
| Weber number | Droplet and interface deformation | Use the appropriate interfacial tension | |
| Euler number | Pressure loss and geometric comparison | Sensitive to velocity definition | |
| Pressure recovery ratio | Collapse driving condition | Does not provide minimum pressure | |
| Specific energy consumption | or | Energy normalized process comparison | State whether electrical or hydraulic power is used |
| Cavitational yield | Product change divided by input energy | Useful outcome per energy input | The product metric must be explicitly defined |
2.5 Forms and Regimes
Hydrodynamic cavitation occurs in distinct spatial and temporal forms that differ in stability, collapse behavior, and engineering consequence. Table 2.3 summarizes the principal regimes relevant to cavitation processing and hydraulic systems.
Table 2.3. Common cavitation forms and regimes. [7]
| Form or regime | Typical geometry or behavior | Primary concern |
|---|---|---|
| Bubble cavitation | Discrete cavities grow in a low pressure region and collapse after convection. | Noise, local pitting, and inception diagnostics. |
| Sheet cavitation | An attached vapor layer forms on a blade or hydrofoil suction surface. | Performance change, reentrant jet instability, and cloud shedding. |
| Cloud cavitation | A group of cavities is periodically shed and collapses collectively. | Strong pressure pulses, vibration, and high erosion potential. |
| Vortex cavitation | A vapor core forms in a concentrated vortex such as a propeller tip or leakage vortex. | Noise, long range interaction, and remote collapse damage. |
| Traveling cavitation | Cavities nucleate in the free stream and pass through a pressure field. | Test tunnel nuclei sensitivity and isolated impact events. |
| Partial cavitation | Vapor occupies only part of a passage or surface. | Often controllable but may be unstable or erosive. |
| Supercavitation | A cavity extends over most of the body or blade. | Drag and load control, cavity closure, ventilation, and stability. |
| Choked two phase flow | Vapor volume limits mass flow or pressure recovery. | Severe performance loss and inability to gain flow with added pressure drop. |
2.6 Collective Effects and the Limits of Single Index Descriptions
Cavitation fields range from isolated bubbles to attached sheets, detached clouds, vortex cores, and extended supercavities. The prevailing regime is determined by geometry, nuclei availability, pressure level, residence time, and pressure recovery. Isolated cavities can often be analyzed using single bubble models, whereas dense clouds exhibit collective behavior. Neighboring cavities modify the local pressure field, shield one another from the imposed disturbance, and may collapse as coordinated structures that generate pressure pulses stronger than those of an isolated event [8,9].
A lower minimum pressure does not necessarily produce a more effective cavitation process. When vapor occupies a large fraction of the flow passage, pressure recovery can shift beyond the intended active zone or be cushioned by a persistent vapor cloud. Effective hydrodynamic generation therefore requires simultaneous control of inception, growth time, void fraction, cloud transport, and collapse location. The same considerations apply to acoustically generated bubble clouds and hydrodynamic cavity structures [2,10].
2.7 Conclusions
Hydrodynamic cavitation generation is governed by the coupled conversion of static pressure to local kinetic energy, the availability of nuclei, and the subsequent recovery of pressure that drives cavity collapse. No single cavitation number fully characterizes the process because equivalent nominal pressure drops can produce different cavity morphologies and collapse locations when geometry, liquid properties, gas content, and pressure recovery differ.
Reliable design and scale up therefore require a multivariable description that combines cavitation number, Reynolds and Weber scaling, pressure recovery, energy consumption, and process outcome. Device selection should account for where cavities form and collapse, whether the desired regime is discrete or collective, and whether erosion, clogging, or mechanical complexity constrains operation. These principles provide a physical basis for selecting and comparing hydrodynamic cavitation devices without treating cavitation intensity as a function of pressure drop alone.
Nomenclature
The following nomenclature defines the symbols and abbreviations used in this article. Unless otherwise stated, quantities are expressed in SI units.
| Symbol | Definition | SI unit or status |
|---|---|---|
| A | Flow cross sectional area | m² |
| Pressure recovery coefficient | dimensionless | |
| D | Characteristic hydraulic diameter | m |
| Input energy | J | |
| Eu | Euler number | dimensionless |
| g | Gravitational acceleration | m s⁻² |
| Irreversible head loss | m | |
| ṁ | Mass flow rate | kg s⁻¹ |
| p | Absolute static pressure | Pa |
| Reference pressure used in a cavitation number | Pa | |
| Saturation vapor pressure | Pa | |
| Electrical input power | W | |
| Q | Volumetric flow rate | m³ s⁻¹ |
| Re | Reynolds number | dimensionless |
| U | Mean liquid velocity | m s⁻¹ |
| Reference velocity | m s⁻¹ | |
| We | Weber number | dimensionless |
| Y | Energy normalized treatment yield | application dependent |
| z | Elevation relative to a datum | m |
Greek Letters
| Symbol | Letter name | Meaning in this chapter |
|---|---|---|
| α | Alpha | Kinetic energy correction factor |
| γ | Gamma | Surface or interfacial tension |
| μ | Mu | Dynamic viscosity |
| ρ | Rho | Liquid density |
| σ | Sigma | Cavitation number |
| Pi | Pressure recovery ratio | |
| Δ | Delta | Finite change, such as pressure drop |
Bibliography
[1] Michel FC Jr, Kozyuk O. Hydrodynamic cavitation processing. In: Letcher TM, Scott JL, Patterson DA, editors. Chemical Processes for a Sustainable Future. Cambridge: Royal Society of Chemistry; 2015. p. 84-142. doi:10.1039/BK9781849739757-00084.
[2] Gogate PR, Tayal RK, Pandit AB. Cavitation: a technology on the horizon. Current Science. 2006;91(1):35-46.
[3] Panda D, Saharan VK, Manickam S. Controlled hydrodynamic cavitation: a review of recent advances and perspectives for greener processing. Processes. 2020;8(2):220. doi:10.3390/pr8020220.
[4] Gode A, Kourousis K, Ranade VV. Vortex based cavitation devices for continuous emulsification: influence of device design, scale up, and scale out. Industrial & Engineering Chemistry Research. 2026;65(15):8081-8101. doi:10.1021/acs.iecr.6c00278.
[5] Pandey DK, Kumar R, Ranade VV. A simplified droplet breakage model to simulate continuous emulsification by hydrodynamic cavitation. ACS Omega. 2026;11(10):16248-16258. doi:10.1021/acsomega.5c11513.
[6] Blagojević M, Rak G, Bizjan B, Kolbl Repinc S. A review on rotary generators of hydrodynamic cavitation for wastewater treatment and enhancement of anaerobic digestion. Processes. 2023;11:514. doi:10.3390/pr11020514.
[7] Kozyuk O. Hydrodynamic Cavitation. [Unpublished technical manuscript and supporting data] 2026.
[8] Brennen CE. Cavitation and Bubble Dynamics. New York: Oxford University Press; 1995.
[9] Lauterborn W, Kurz T. Physics of bubble oscillations. Reports on Progress in Physics. 2010;73(10):106501. doi:10.1088/0034-4885/73/10/106501.
[10] Meroni D, Djellabi R, Ashokkumar M, Bianchi CL, Boffito DC. Sonoprocessing: from concepts to large scale reactors. Chemical Reviews. 2022;122(3):3219-3258. doi:10.1021/acs.chemrev.1c00438.