
Technical publication
Back to publications
Reactors & equipment
Hydrodynamic Cavitation in Emulsification and Homogenization
okozyuk.com
Published
Read complete publication for whole-document Find and printing. Browser Find and native printing on this reader include only loaded content.
6 Process Variables and Experimental Performance
6.1 Cavitation regime, pressure, and backpressure
The experiments show a nonmonotonic relationship between reported cavitation index and Sauter mean diameter. Transition from noncavitating flow to a field of transient cavities reduced droplet size, but progression toward an attached supercavity increased the diameter again [3,18,34]. The minimum occurred in a region reported as approximately 0.6 to 1.0 for that specific index definition and apparatus. The important observation is the regime transition, not the absolute numerical value.
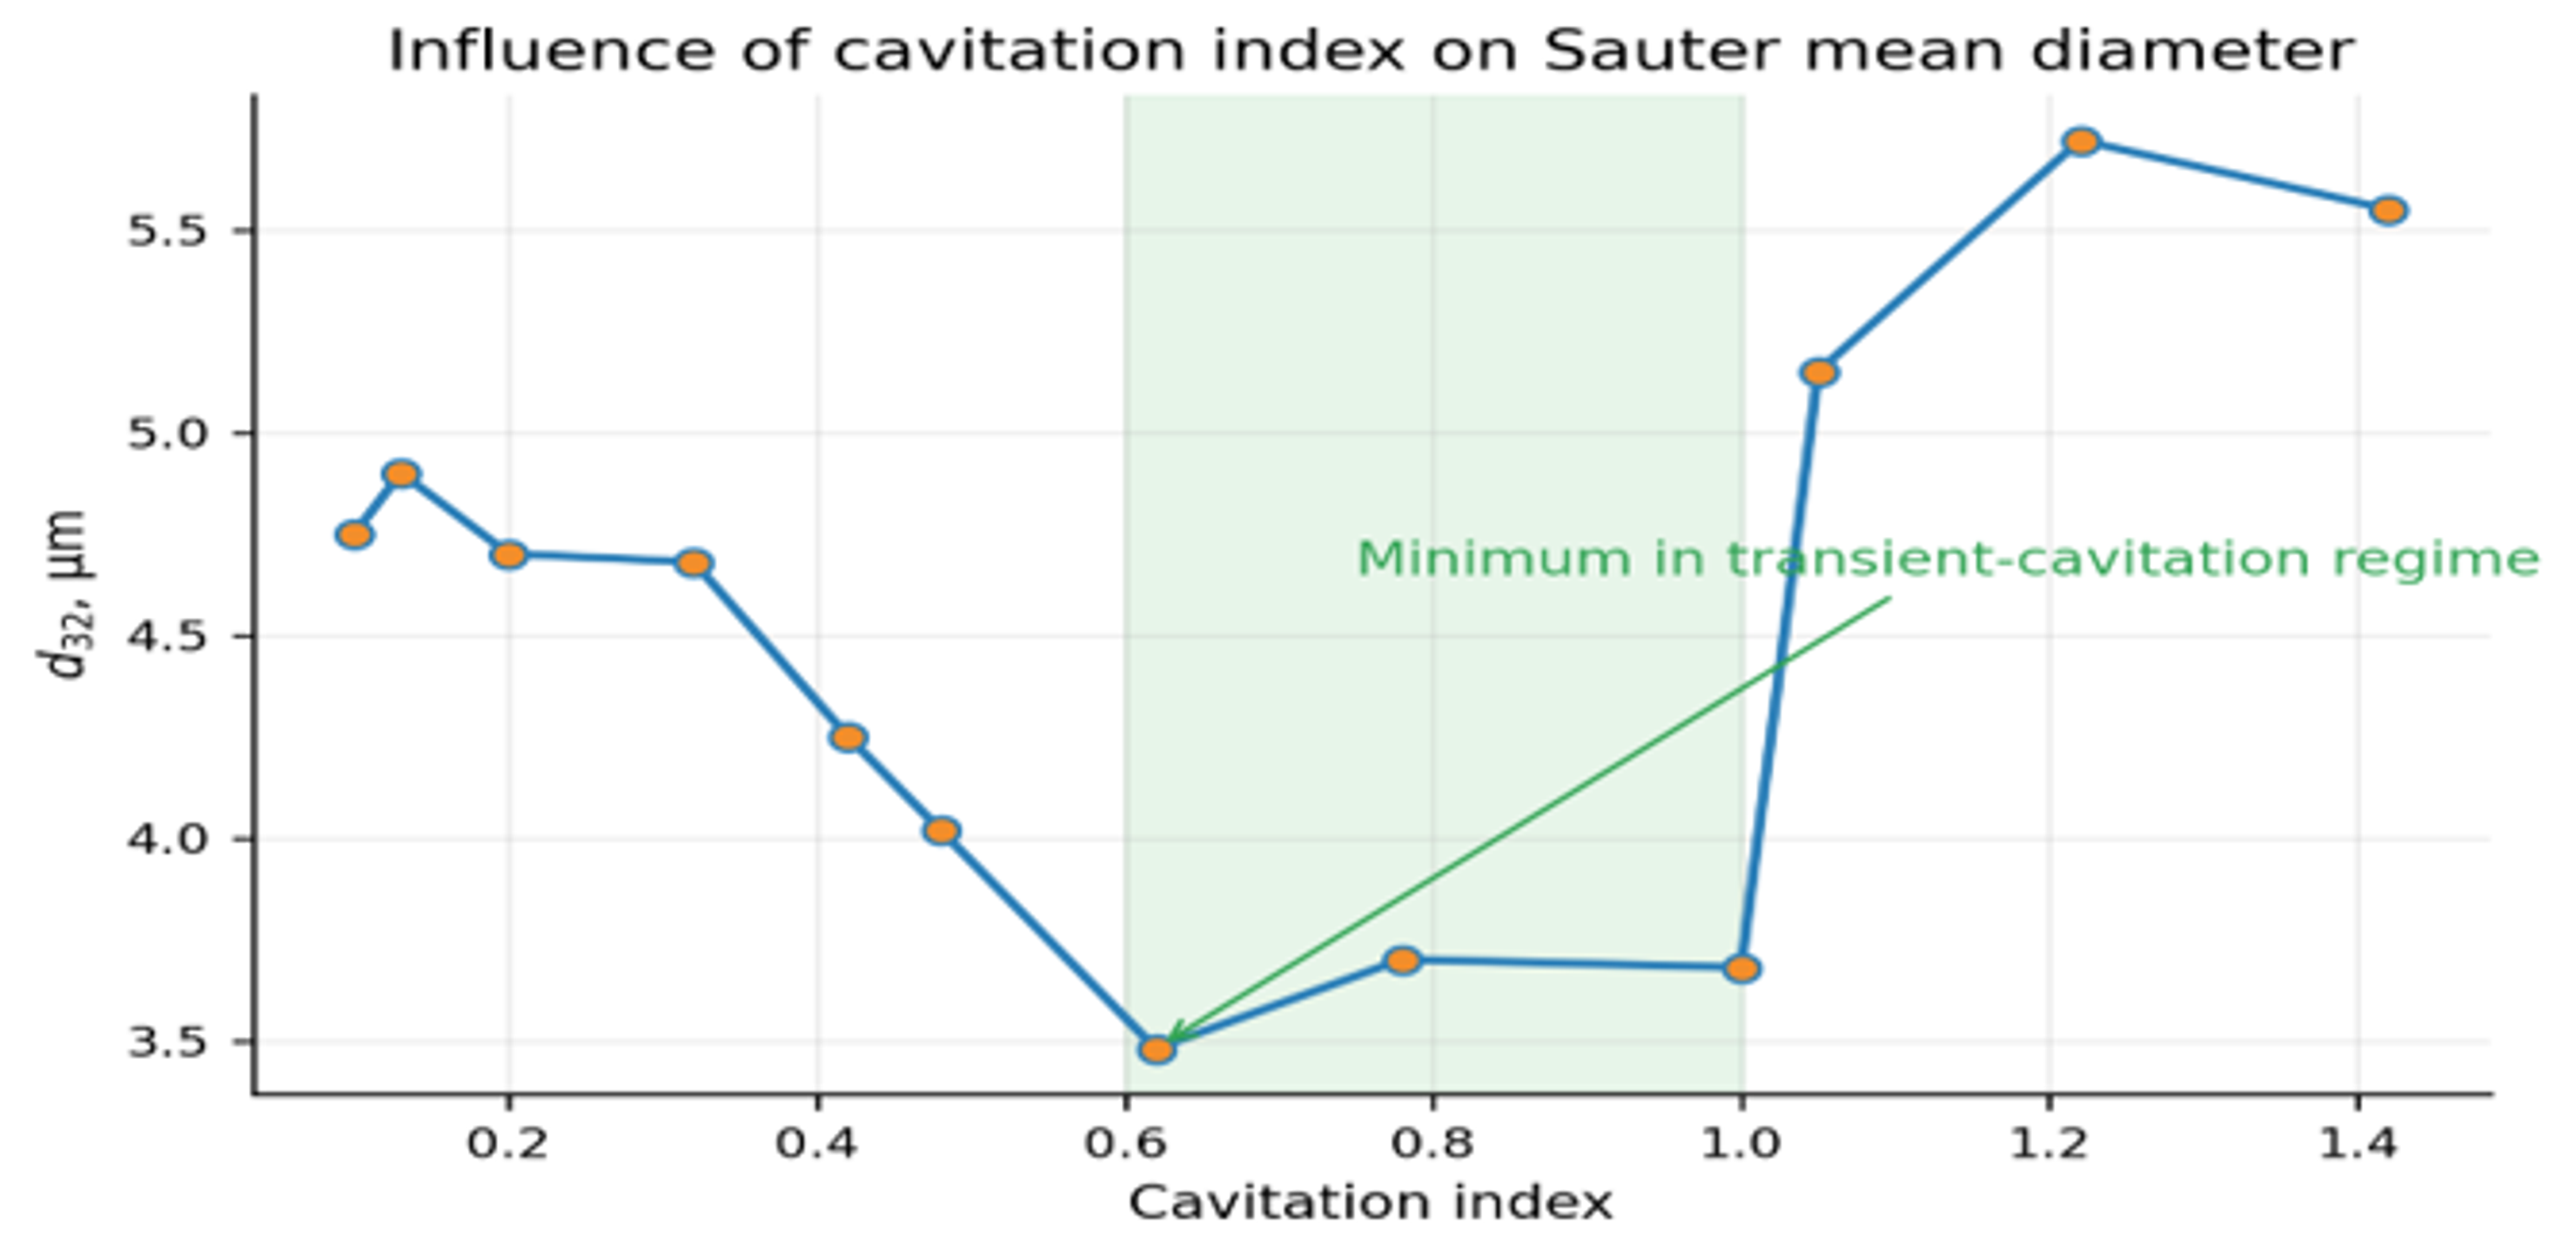
Figure 14. Influence of the reported cavitation index on Sauter mean diameter in a cone shaped cavitator. The shaded region indicates the minimum associated with many transient collapse events [9].
Backpressure is a direct control variable because it changes both the pressure margin for cavity formation and the recovery pressure available for collapse. In the reported test loop, backpressure varied almost linearly with the reported cavitation index. In high pressure homogenization, variation of the second stage restriction similarly changes cavitation and can improve or reduce breakup depending on where droplets experience the dominant stress relative to the orifice exit [45–48].
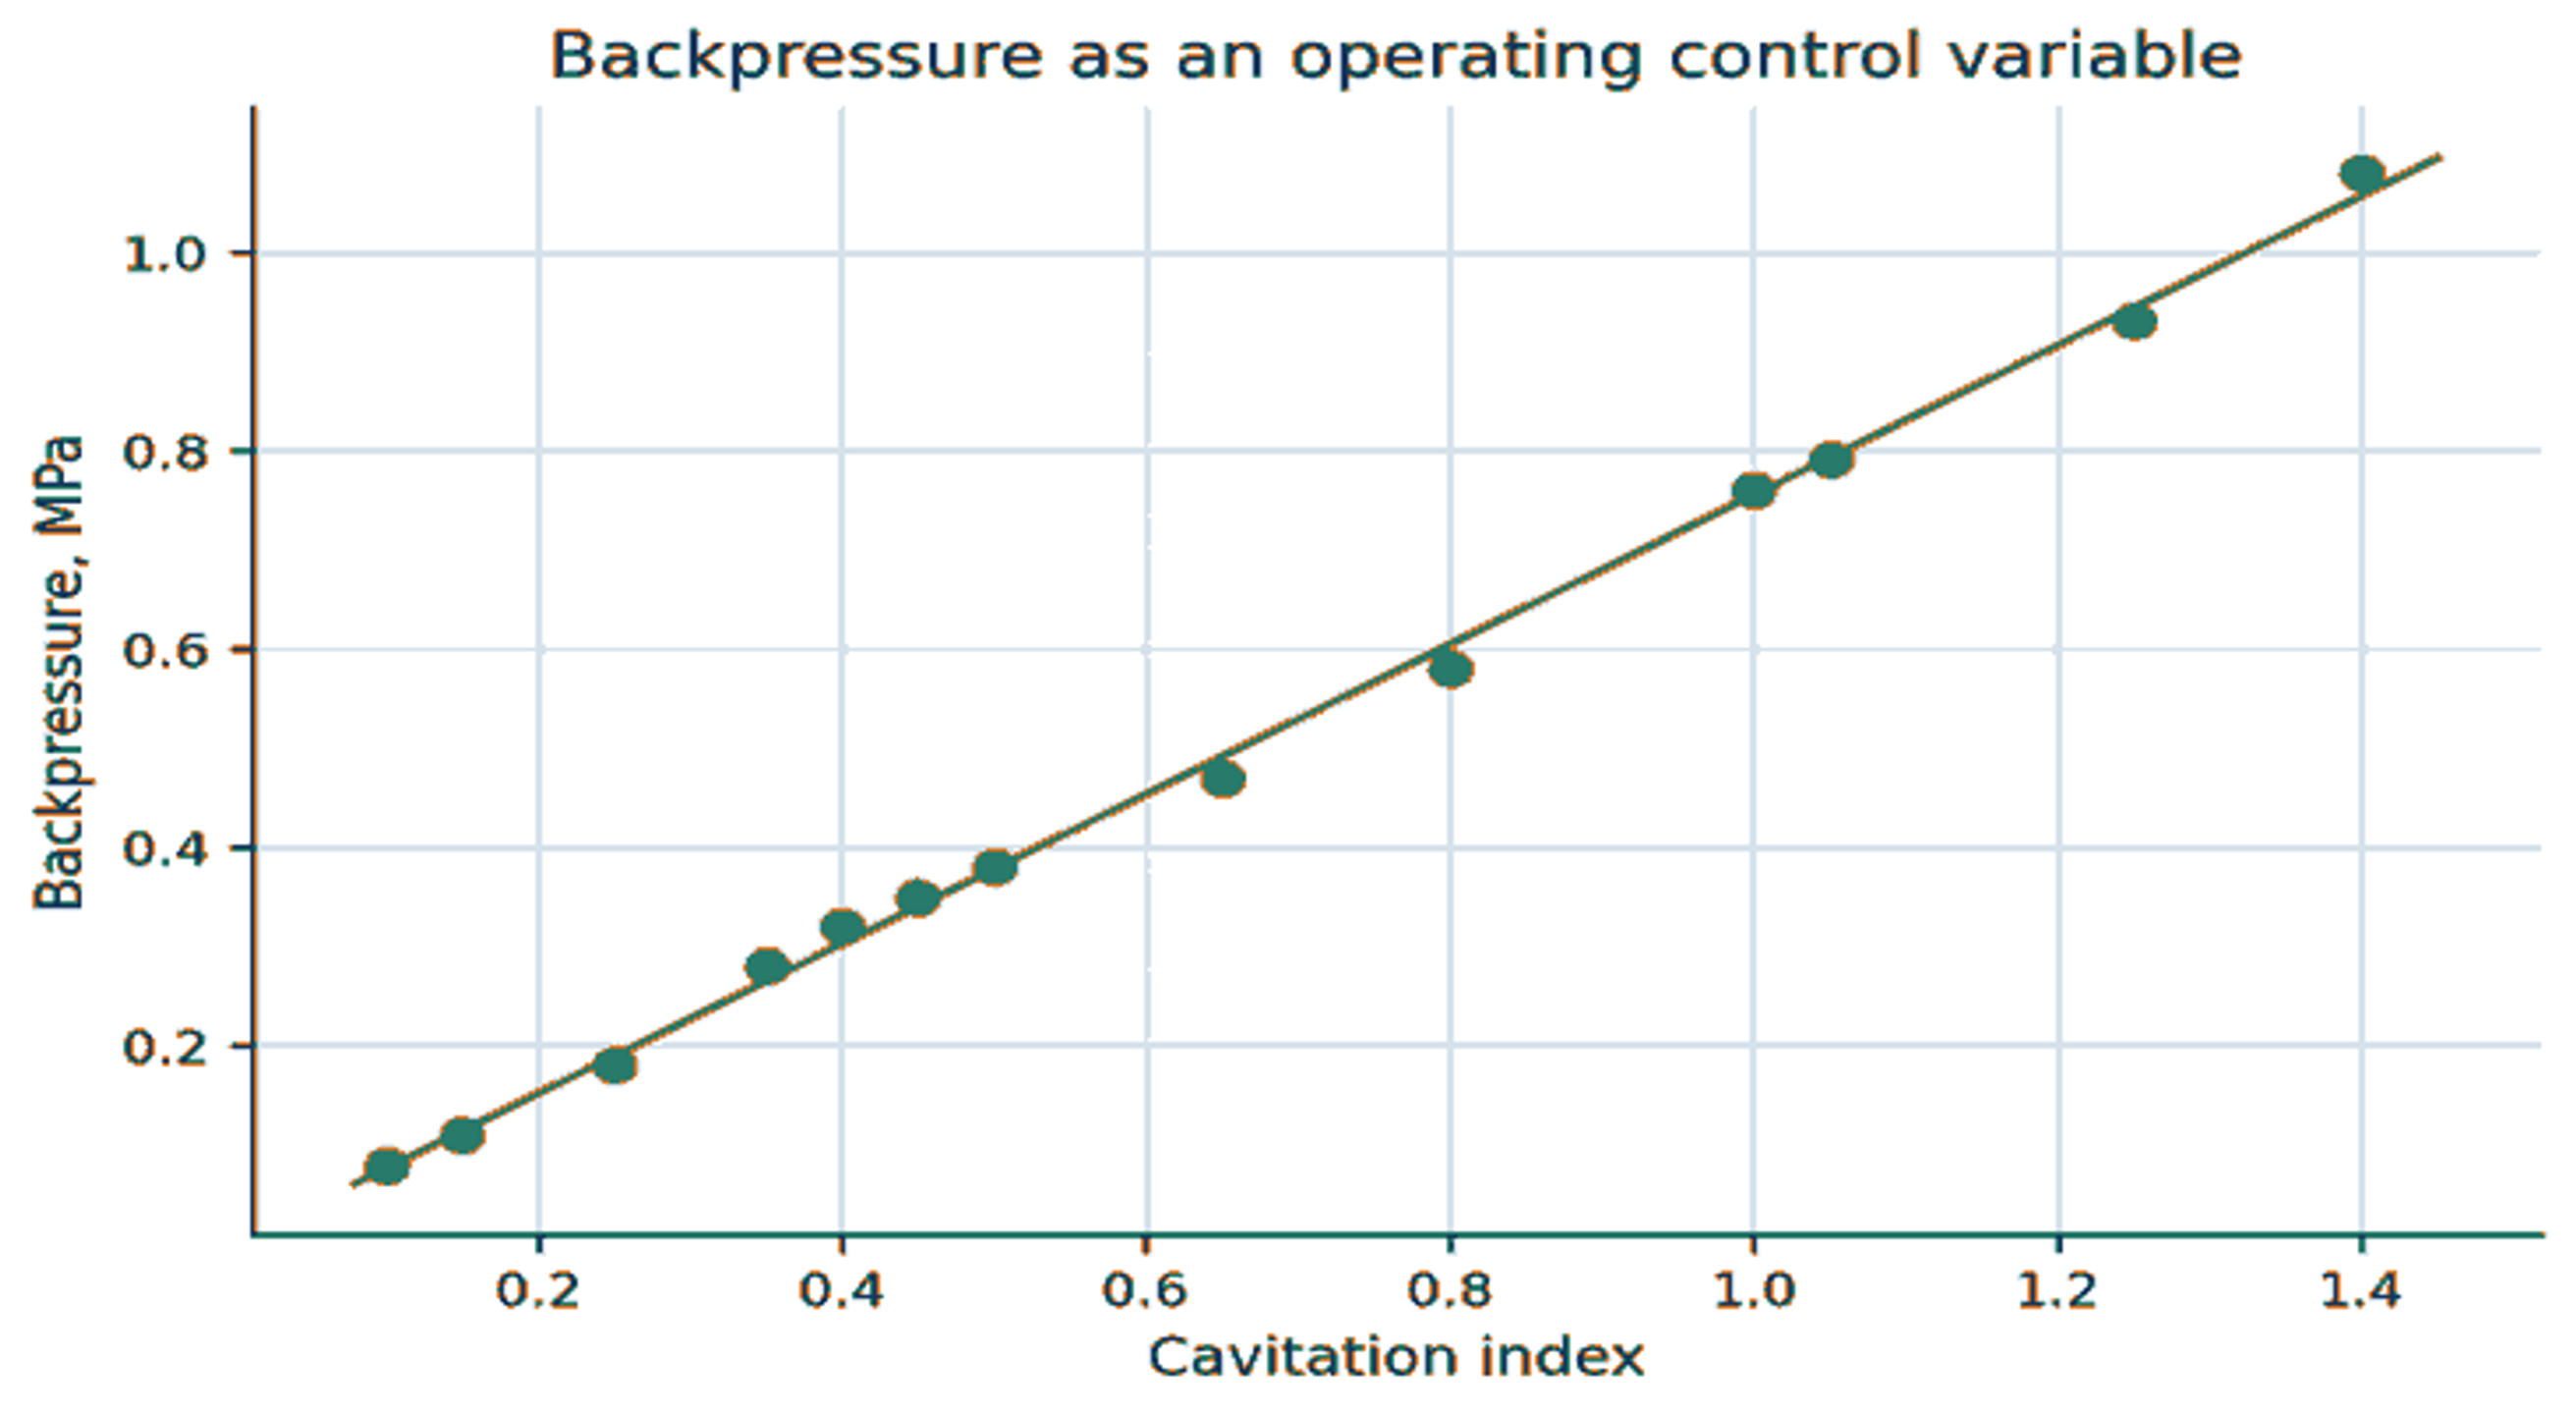
Figure 15. Backpressure as an operating control variable in the cone cavitator test loop [3].
The engineering consequence is that a backpressure valve should not be treated only as a flow control accessory. It is part of the cavitation reactor. During scale up, the downstream line, valve, heat exchanger, and elevation can alter pressure recovery enough to change the bubble field even when the upstream pressure is unchanged.
6.2 Number of passes and diminishing returns
Repeated passage increases the probability that large droplets encounter a high stress region. The first pass usually produces the largest reduction because coarse, weak droplets are abundant. Later passes act on smaller droplets with higher capillary pressure and may also increase recoalescence, heating, oxidation, and residence time spread. In the reported vegetable oil data, most of the size reduction occurred during the first pass, and three passes captured most of the practical benefit [3].
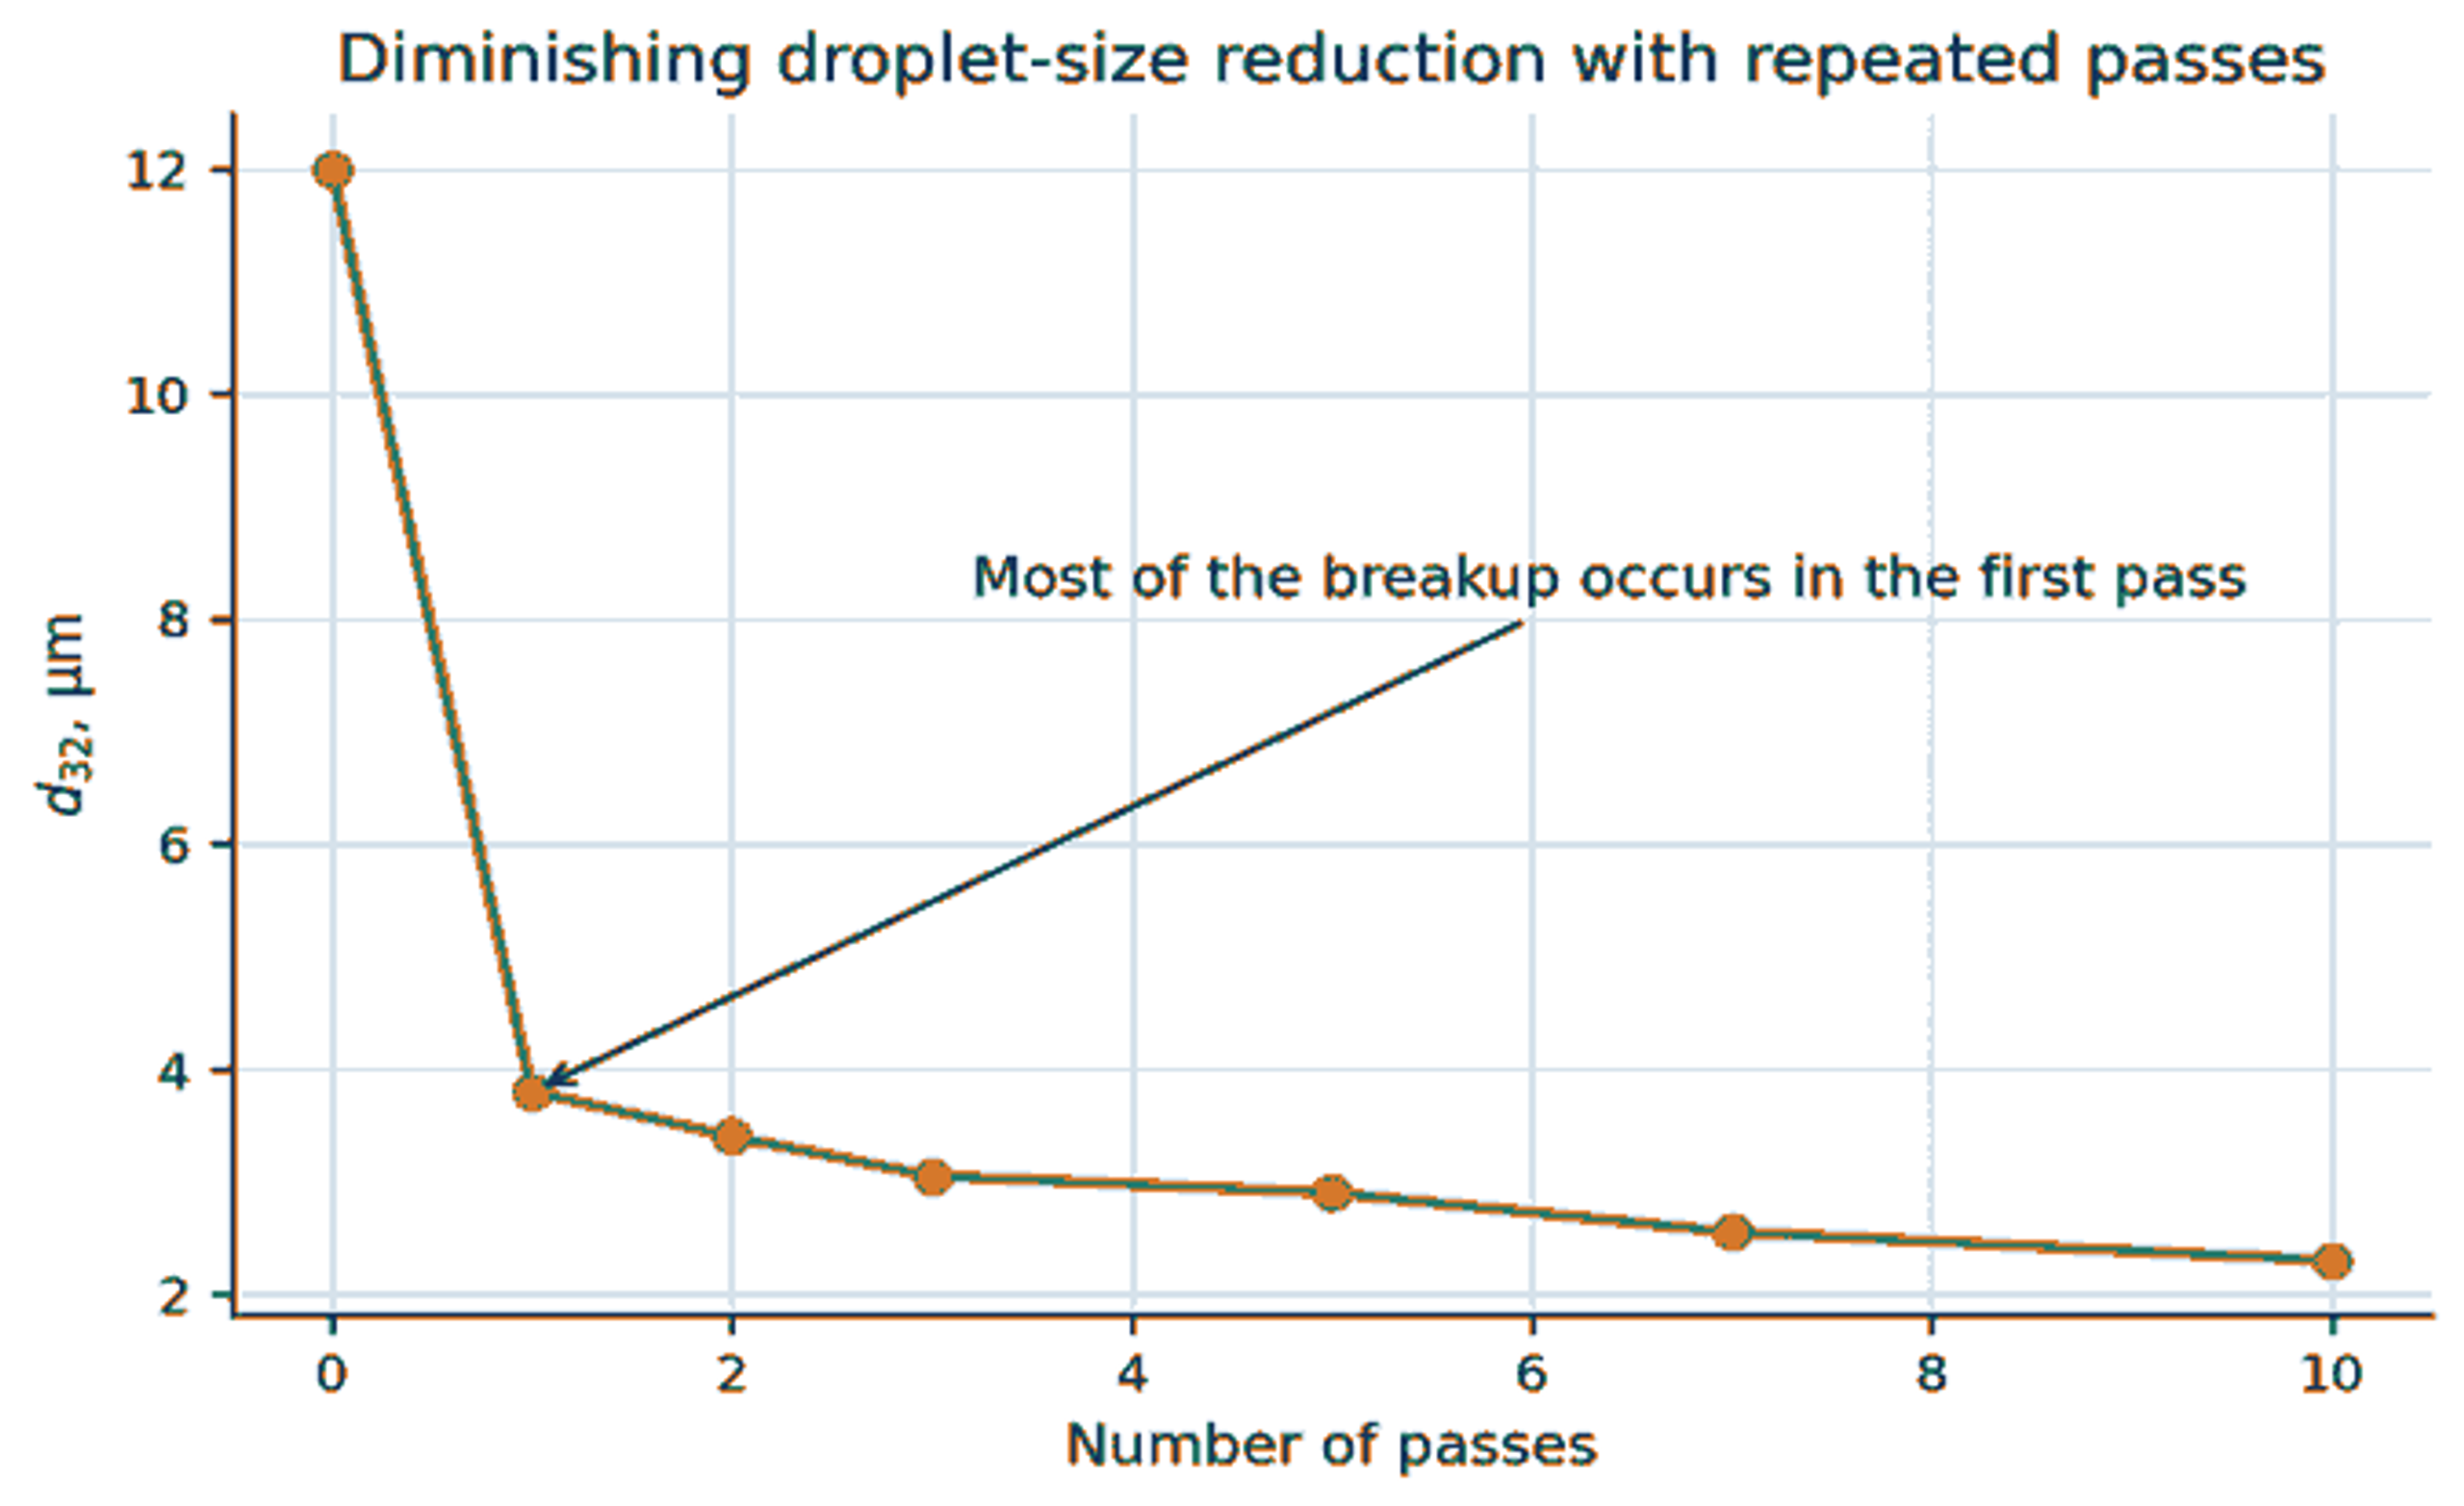
Figure 16. Diminishing reduction in Sauter mean diameter with repeated passes through a cavitation mixer [3,18].
Pass number should therefore be optimized against a multi criterion endpoint: , coarse fraction, temperature increase, oxidation sensitive markers, surfactant integrity, energy per mass, and production rate. A target based only on the smallest attainable diameter can select an uneconomic or chemically damaging operating point.
6.3 Dispersed phase viscosity
A more viscous droplet resists internal circulation and deformation. In the present silicone oil tests, increased approximately linearly over the investigated viscosity range at a constant reported cavitation index [3]. The modest slope does not imply that viscosity is unimportant in all systems. Viscosity effects become stronger as the ratio rises, temperature falls, or collapse stress decreases.
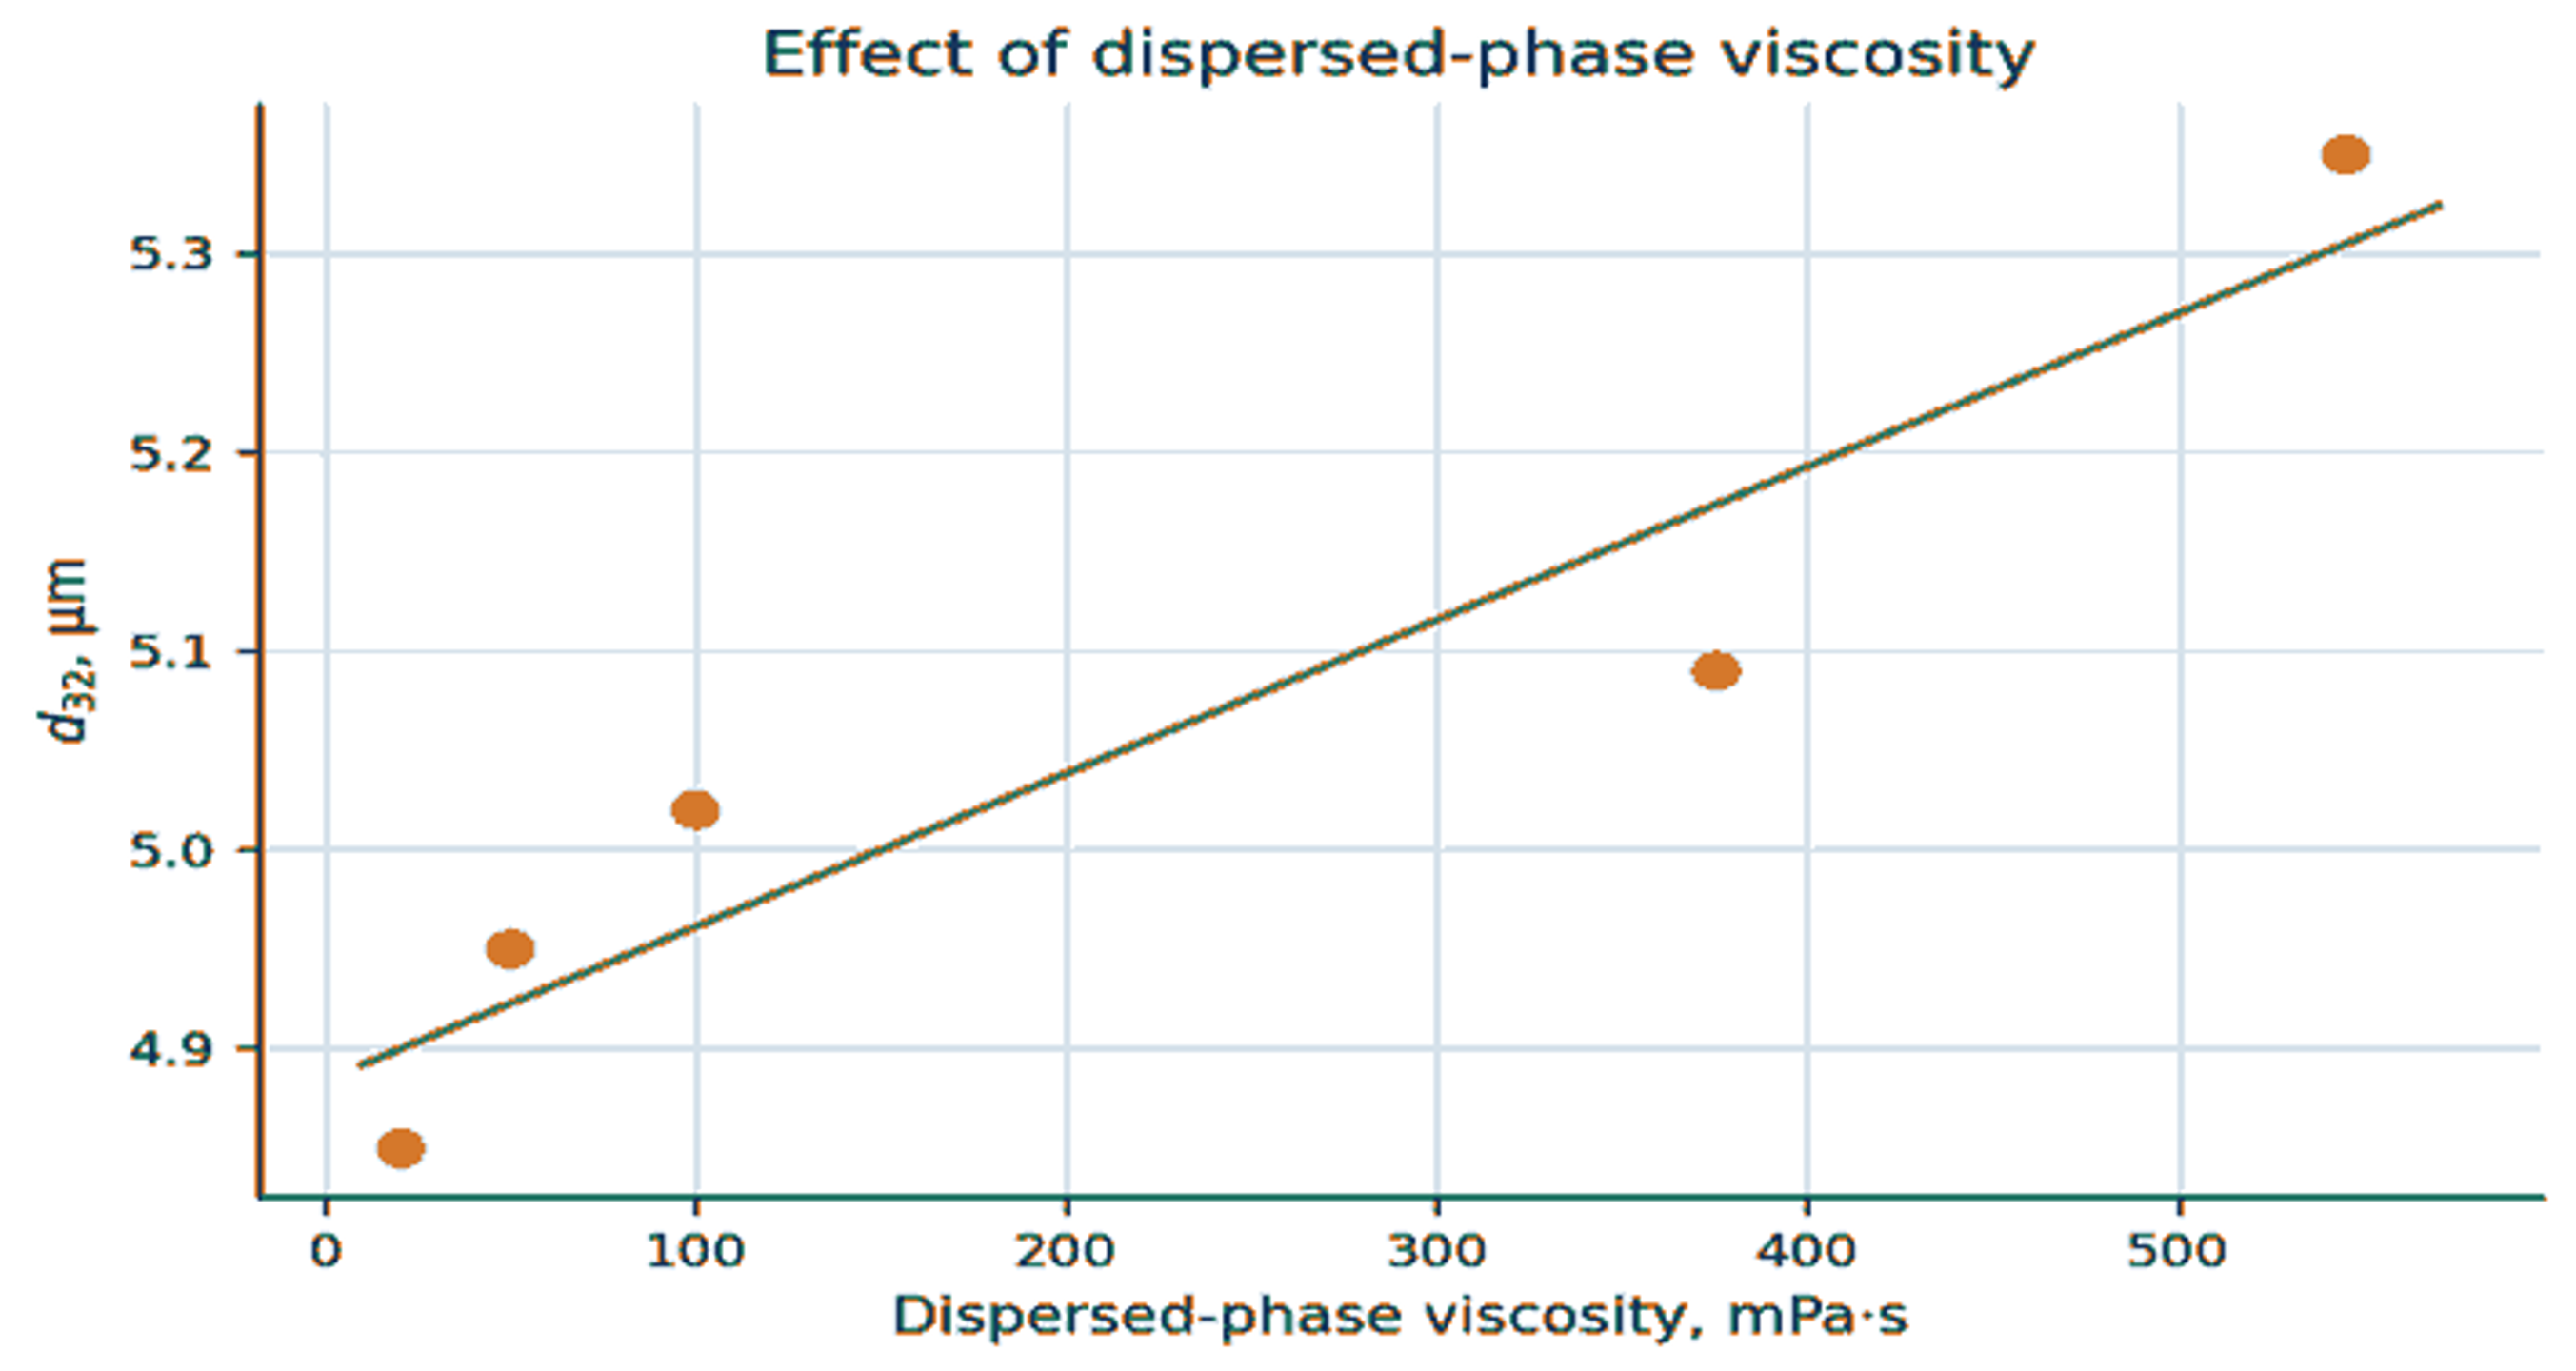
Figure 17. Effect of dispersed phase viscosity on the Sauter mean diameter of silicone oil emulsions [3].
Viscosity and interfacial tension should be measured at the actual processing temperature. Using room temperature data for hot food, oil, polymer, or fuel can create a large error in Weber number, capillary number, and pump sizing. Non Newtonian dispersed phases require a rate dependent viscosity model rather than a single tabulated value.
6.4 Continuous phase viscosity
Continuous phase viscosity has competing effects. It reduces Reynolds number and may damp turbulence, but it also slows creaming, changes film drainage during coalescence, and modifies propagation of collapse induced velocity gradients. The reported comparison used 1% silicone oil without surfactant in water adjusted to 10 or 350 mPa s. A rotor stator homogenizer operated at 24,000 rpm produced a mean diameter that increased from 14.9 to 36.9 µm as continuous phase viscosity increased. Under the same two viscosity conditions, the cavitation mixer operated at 2.8 MPa produced mean diameters of 9.4 and 10.2 µm [3].
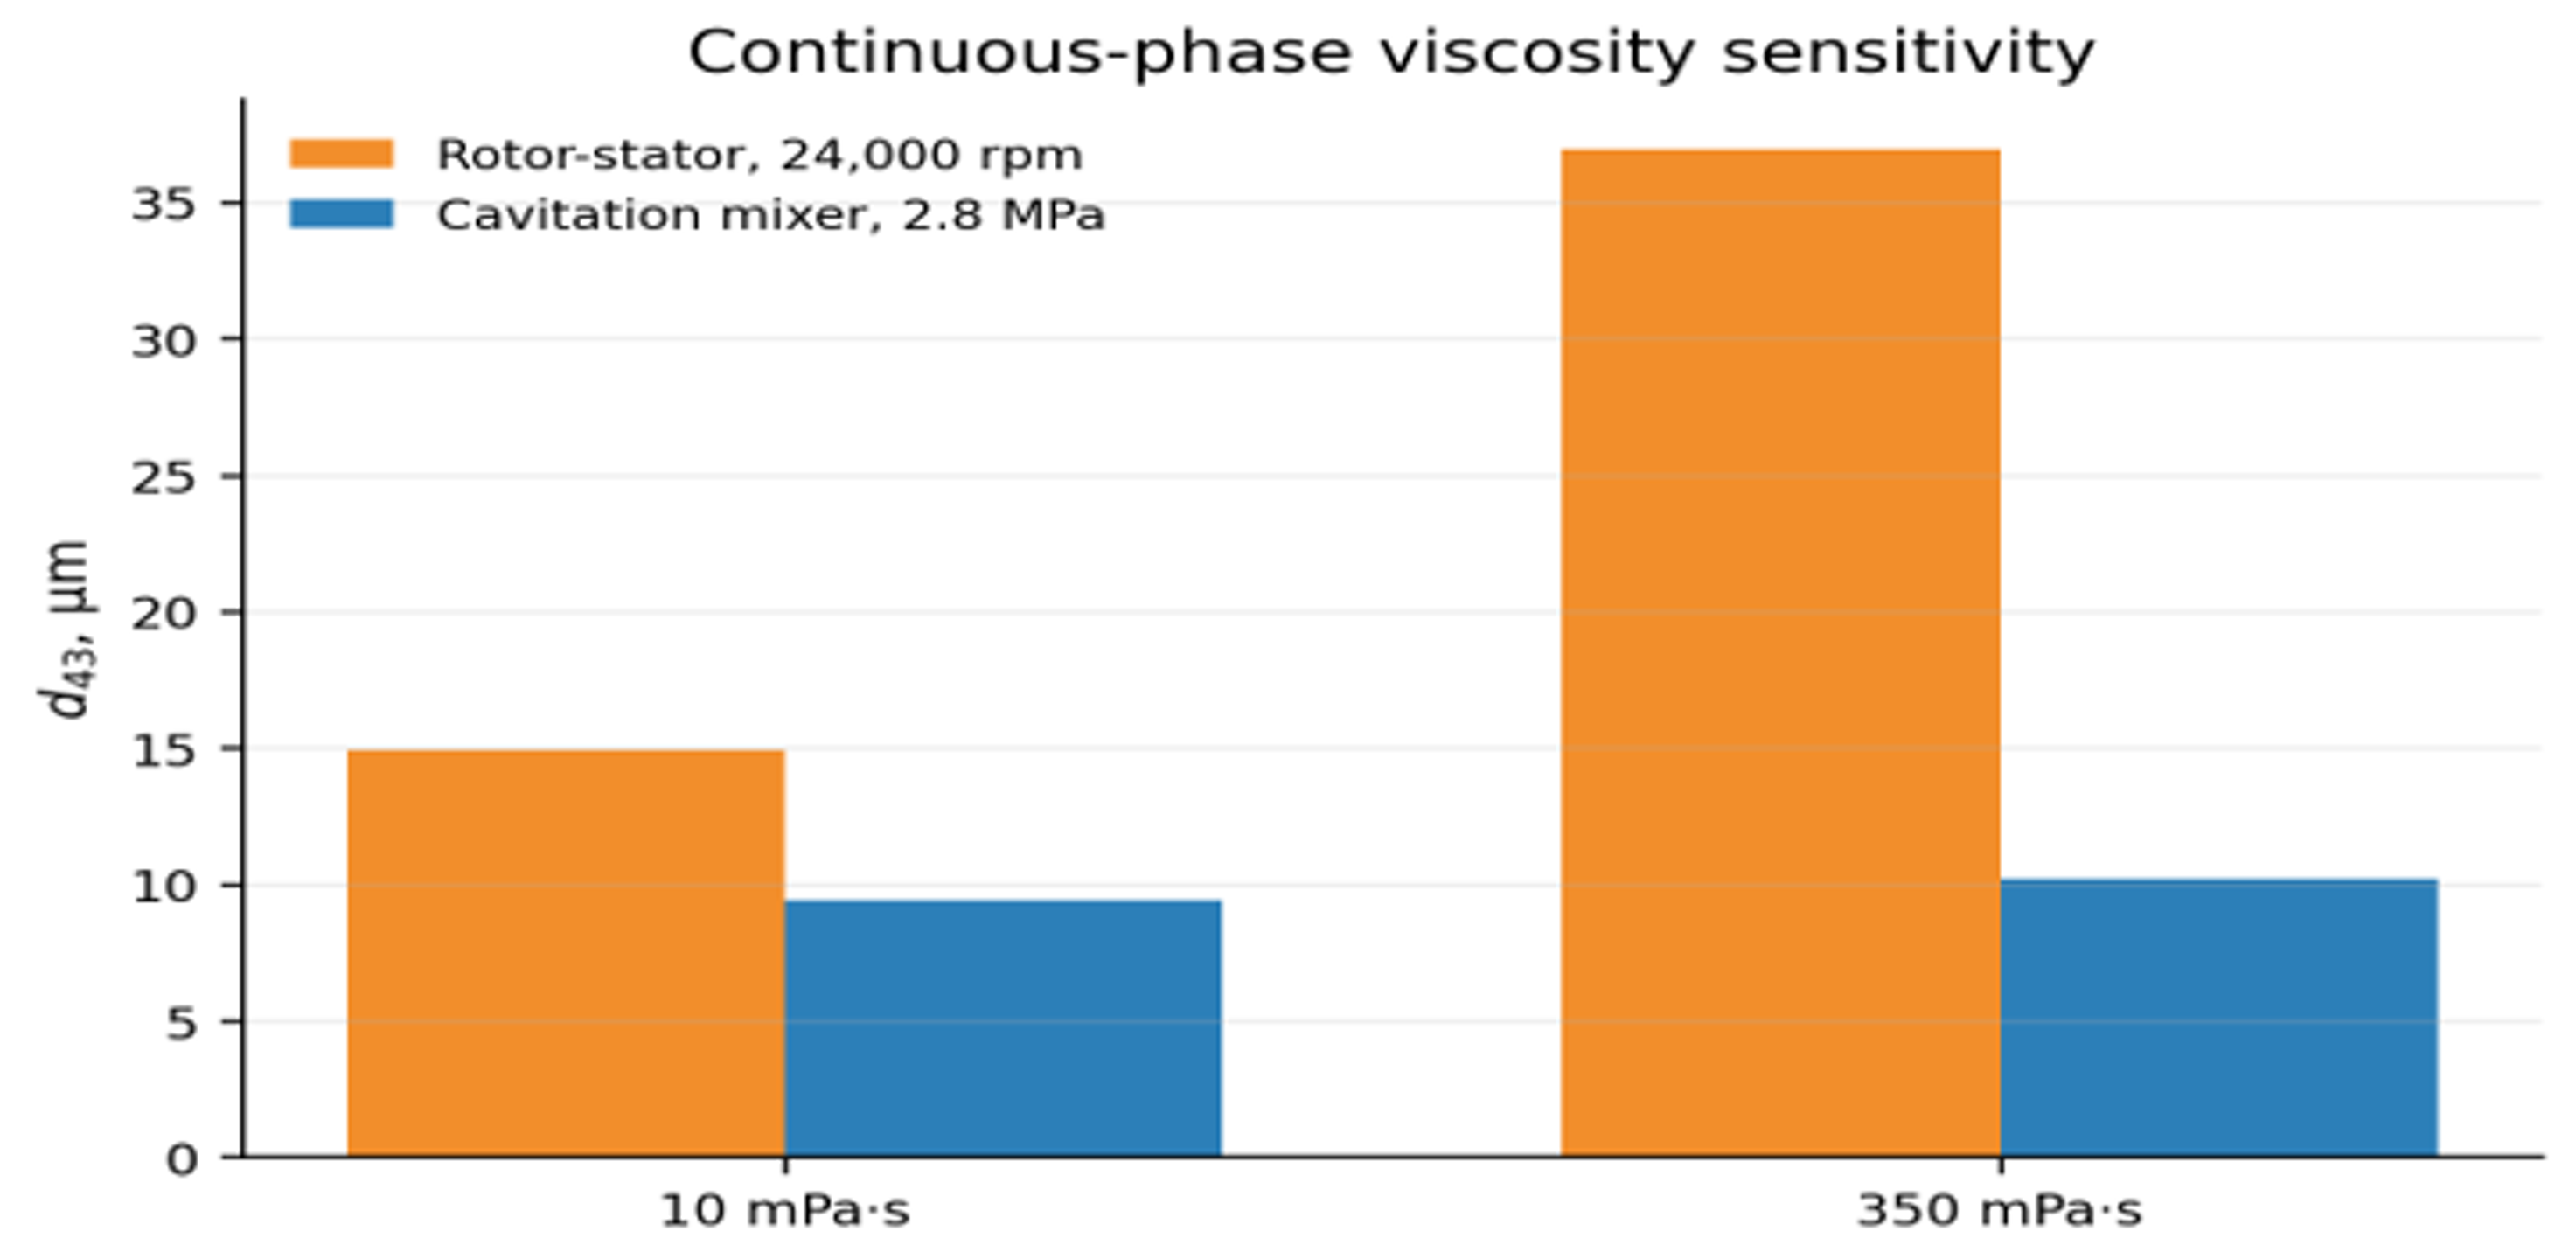
Figure 18. Continuous phase viscosity sensitivity in a rotor stator homogenizer and a single orifice cavitation mixer [3].
Table 7. Effect of continuous phase viscosity on droplet breakup in turbulent and cavitating flow [3].
| Process | Continuous phase viscosity, mPa s | Capacity, m³/s | Mean diameter, d₄₃, µm | Coarse diameter, d₉₀, µm | Reported energy density, J/m³ |
|---|---|---|---|---|---|
| Premix | 10 | Not reported | 114.8 | 182.1 | Not reported |
| Premix | 350 | Not reported | 175.9 | 292.8 | Not reported |
| Rotor stator, one pass, 24,000 rpm | 10 | 14.9 | 27.8 | ||
| Rotor stator, one pass, 24,000 rpm | 350 | 36.9 | 97.4 | ||
| Cavitation mixer, one pass, 2.8 MPa | 10 | 9.4 | 16.4 | ||
| Cavitation mixer, one pass, 2.8 MPa | 350 | 10.2 | 21.3 |
The comparison is informative but should not be interpreted as a universal efficiency ranking. The devices used different mechanisms, capacities, and power accounting conventions, and the emulsions were not stabilized. It demonstrates that localized collapse can remain effective in a viscous continuous phase under conditions where bulk rotor stator circulation deteriorates.
6.5 Protein modification and emulsification
Hou et al. investigated tilapia myofibrillar protein in an open access study using a recirculating hydrodynamic cavitation loop. A 900 mL suspension was processed at 0.14 MPa with a 550 W pump through a single orifice plate having a 3 mm hole and 20 mm thickness. Treatment times were 0, 5, 10, 15, and 20 min [49]. This case is useful because the same experiment reports protein particle response and the performance of the resulting oil in water emulsion.
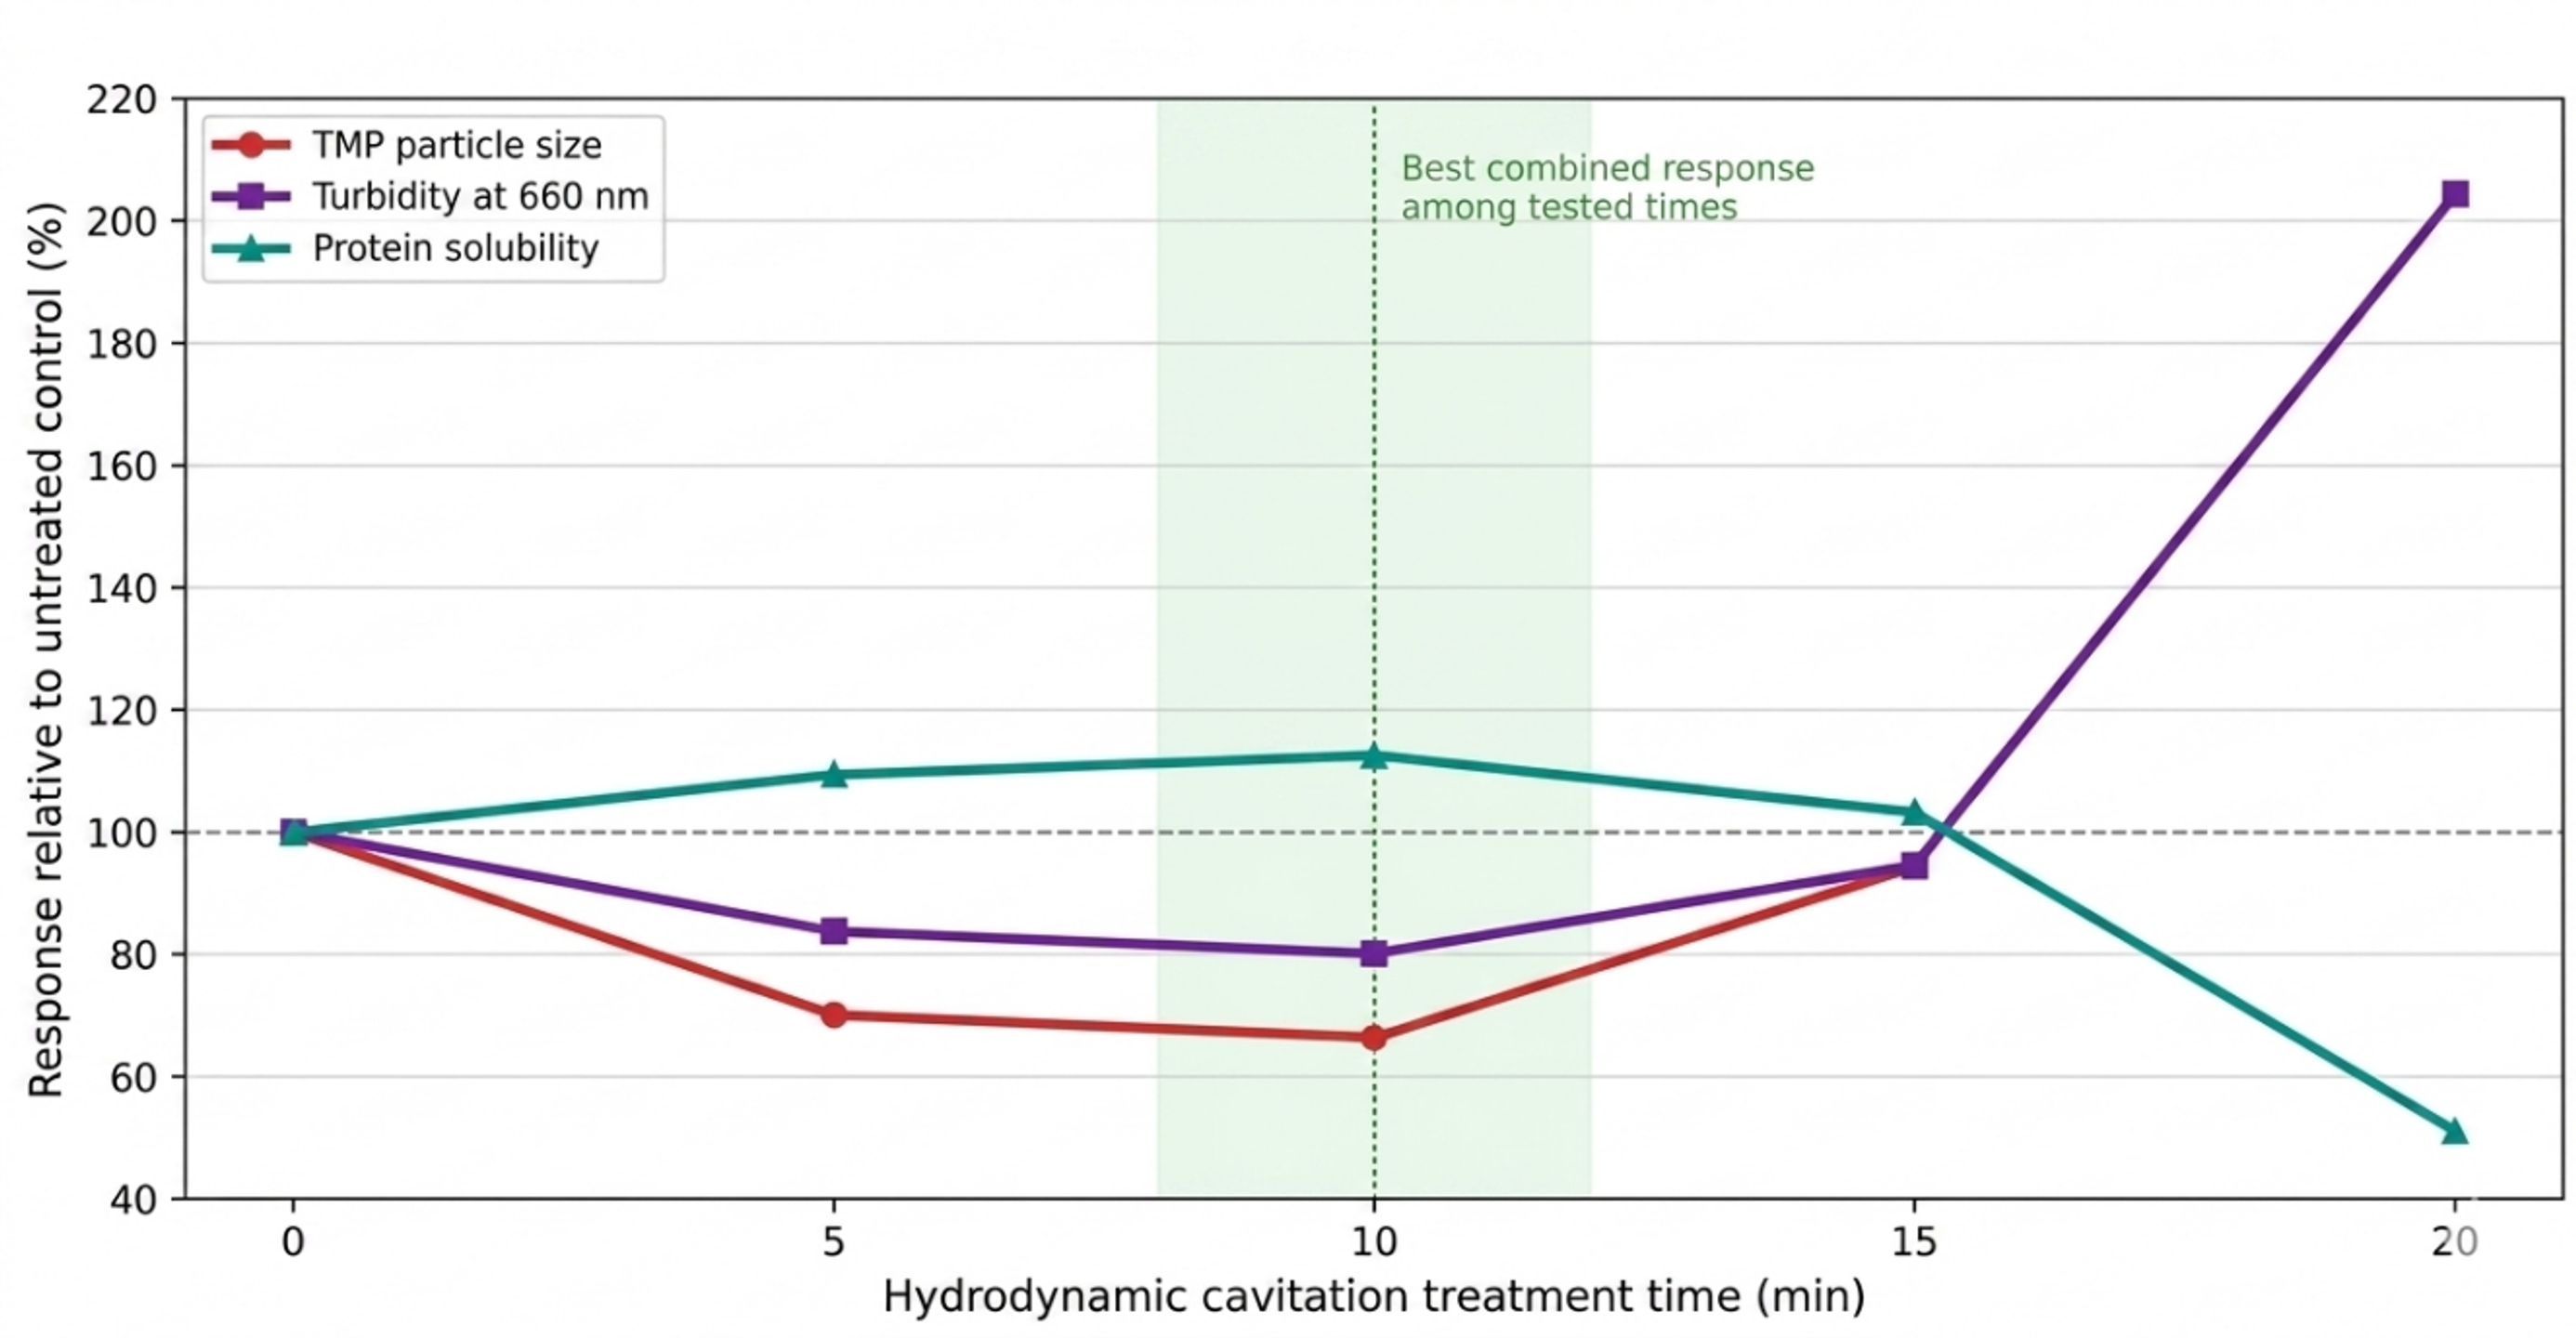
Figure 19. Relative particle size, turbidity, and solubility of tilapia myofibrillar protein versus hydrodynamic cavitation treatment time. The shaded region marks the best combined response among the tested times [49].
The 10 min condition gave the smallest measured protein particle size, the lowest turbidity, and the highest solubility among the tested times. Extending treatment to 15 and 20 min reversed several of those gains; at 20 min, particle size and turbidity rose sharply while solubility fell. The result demonstrates a finite process window in which aggregate disruption and protein unfolding improve functionality before reaggregation or excessive structural change becomes dominant [49].
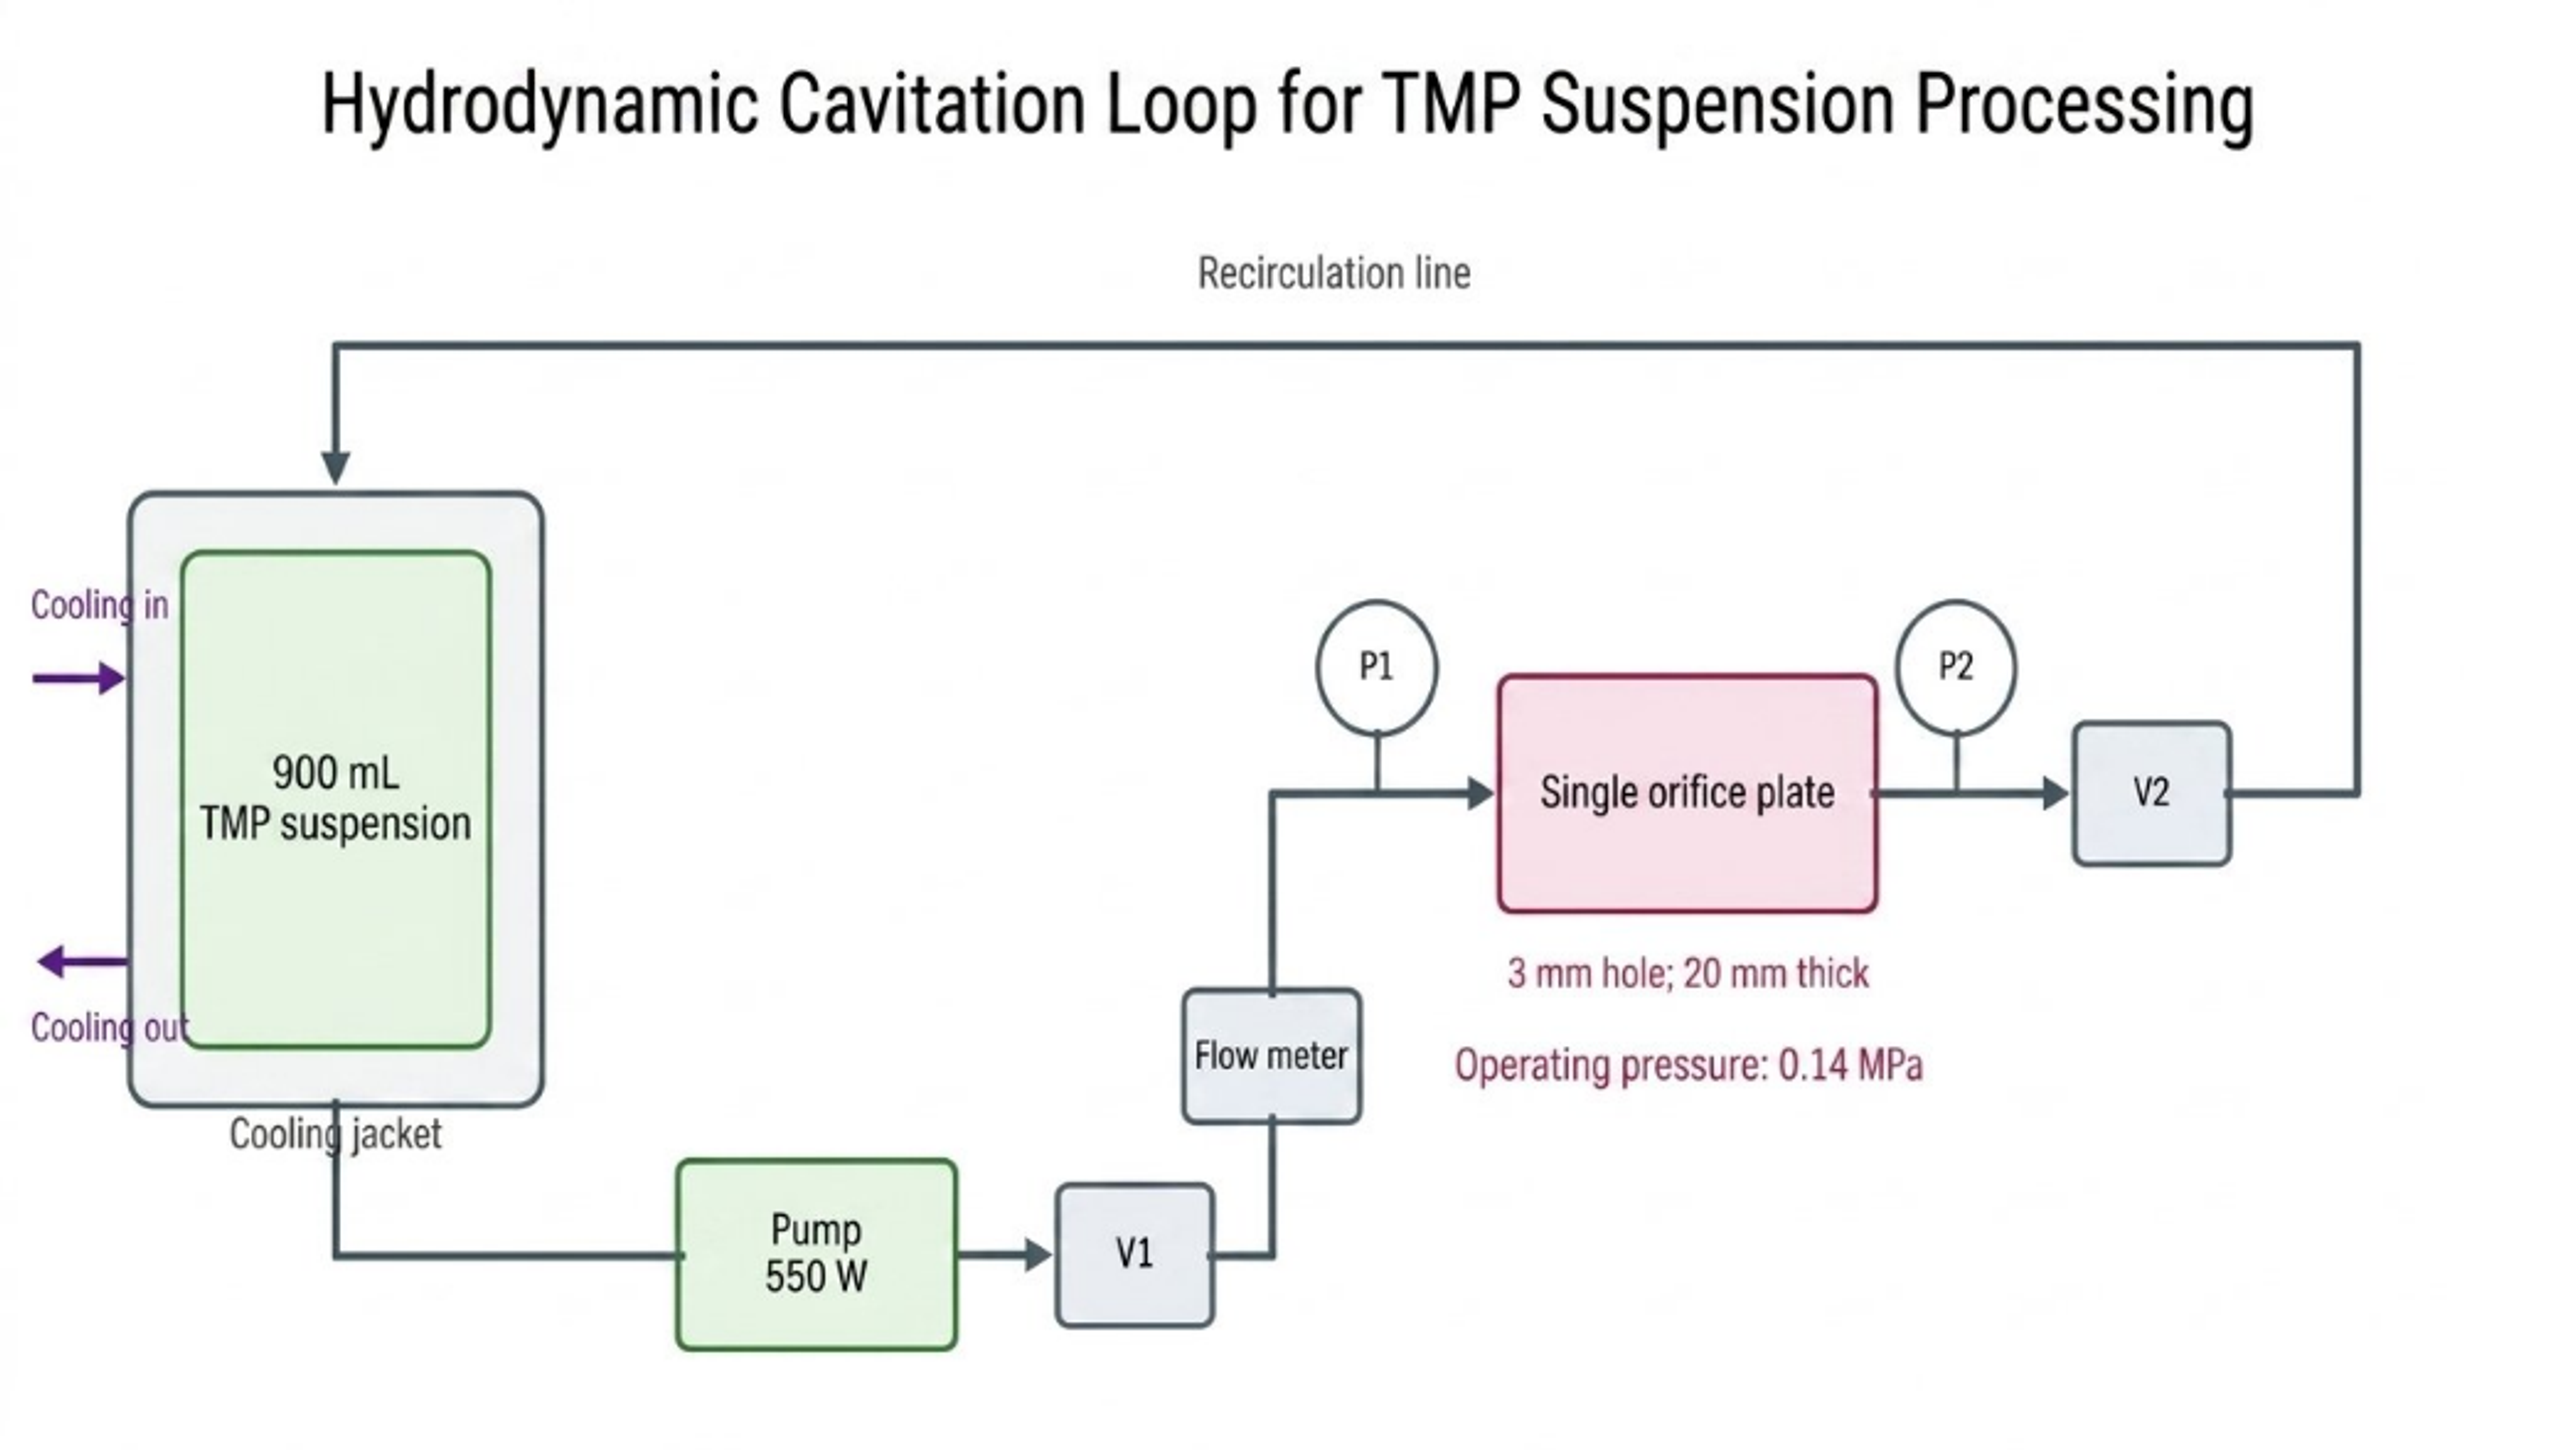
Table 8. Open access hydrodynamic cavitation case: tilapia myofibrillar protein and emulsion response.
| HC time, min | TMP particle size, nm | Turbidity, A660 | Protein solubility, % | Emulsion response | Engineering interpretation |
|---|---|---|---|---|---|
| Reactor settings | 3 mm orifice | 20 mm plate | 0.14 MPa | 550 W; 900 mL | Cooling water; recirculating loop |
| 0 | 1026.2 ± 25.9 | 0.111 ± 0.001 | 57.65 ± 1.08 | 2754 ± 110 nm; ESI 71.28 ± 5.50 min | Untreated control |
| 5 | 719.3 ± 41.1 | 0.093 ± 0.001 | 63.07 ± 1.37 | Improved from control | Aggregate dissociation |
| 10 | 681.6 ± 13.6 | 0.089 ± 0.001 | 64.90 ± 0.34 | 2138 ± 182 nm; ESI 91.73 ± 5.56 min | Best overall tested condition |
| 15 | 967.3 ± 27.8 | 0.105 ± 0.004 | 59.50 ± 0.41 | Emulsion response began to deteriorate | Onset of overtreatment |
| 20 | 2095.3 ± 61.6 | 0.227 ± 0.003 | 29.44 ± 5.10 | Coarser, less stable emulsion | Strong reaggregation |
| Design implication | Track size | Track turbidity | Track solubility | Confirm diameter and ESI | Define a validated treatment window |
6.6 Emulsion response and process window
The protein changes translated into a measurable emulsion response. At the best tested 10 min condition, mean emulsion droplet size decreased from 2754 ± 110 to 2138 ± 182 nm, while the emulsifying stability index increased from 71.28 ± 5.50 to 91.73 ± 5.56 min [49]. Longer treatment did not continue the improvement. This combined response shows why a formulation should be optimized against both ingredient functionality and final emulsion performance.
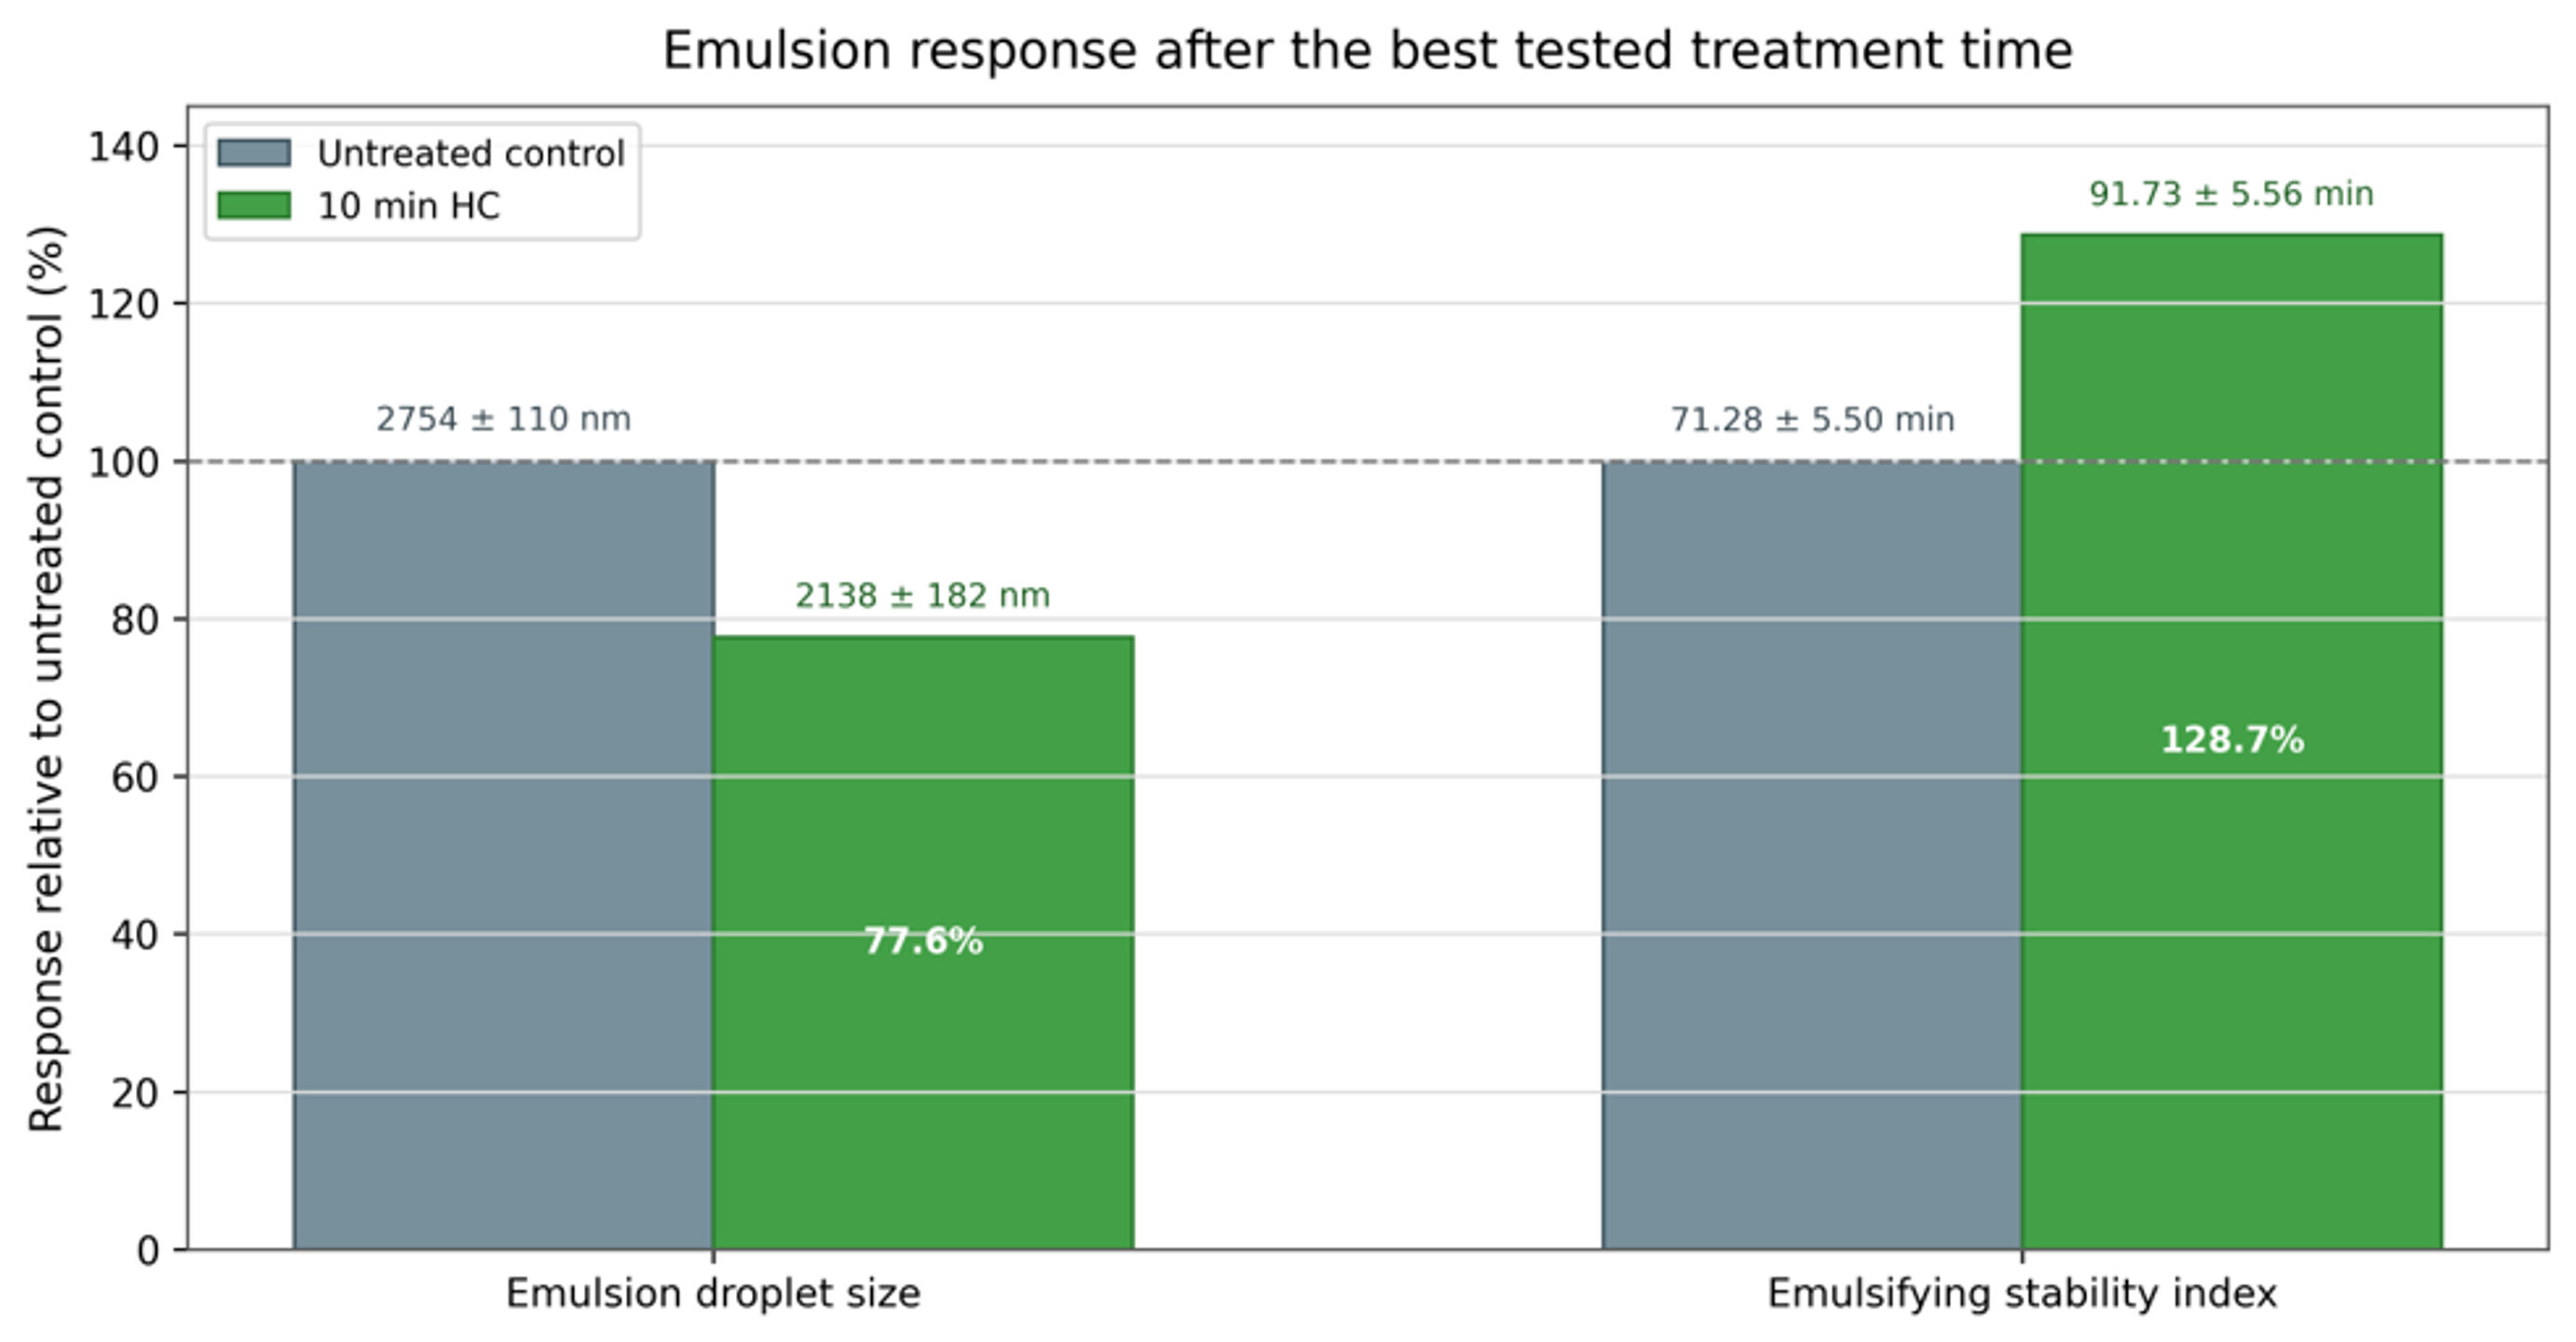
Figure 21. Emulsion droplet size and emulsifying stability index after 10 min of hydrodynamic cavitation, normalized to the untreated control. Exact reported values are shown above the bars [49].
Stability should be tested under the intended storage and distribution conditions. A short visual test is insufficient for nanoemulsion. Recommended measurements include droplet size at multiple ages, centrifugation, temperature cycling, freeze thaw if relevant, zeta potential where electrostatic stabilization is used, rheology, oxidative markers for unsaturated oils, active ingredient retention, and microbial quality for water rich products.
6.7 Inlet pressure and processing time in Venturi reactors
Ramisetty, Pandit, and Gogate used circular and slit Venturis to prepare coconut oil in water emulsions [35]. For a circular Venturi, increasing inlet pressure from 5 to 10 bar sharply reduced droplet size and shortened the time to a stable plateau. Increasing to 20 bar produced a smaller early time diameter but gave limited additional benefit after sufficient passes. The result again demonstrates an optimum rather than an unlimited benefit from pressure.
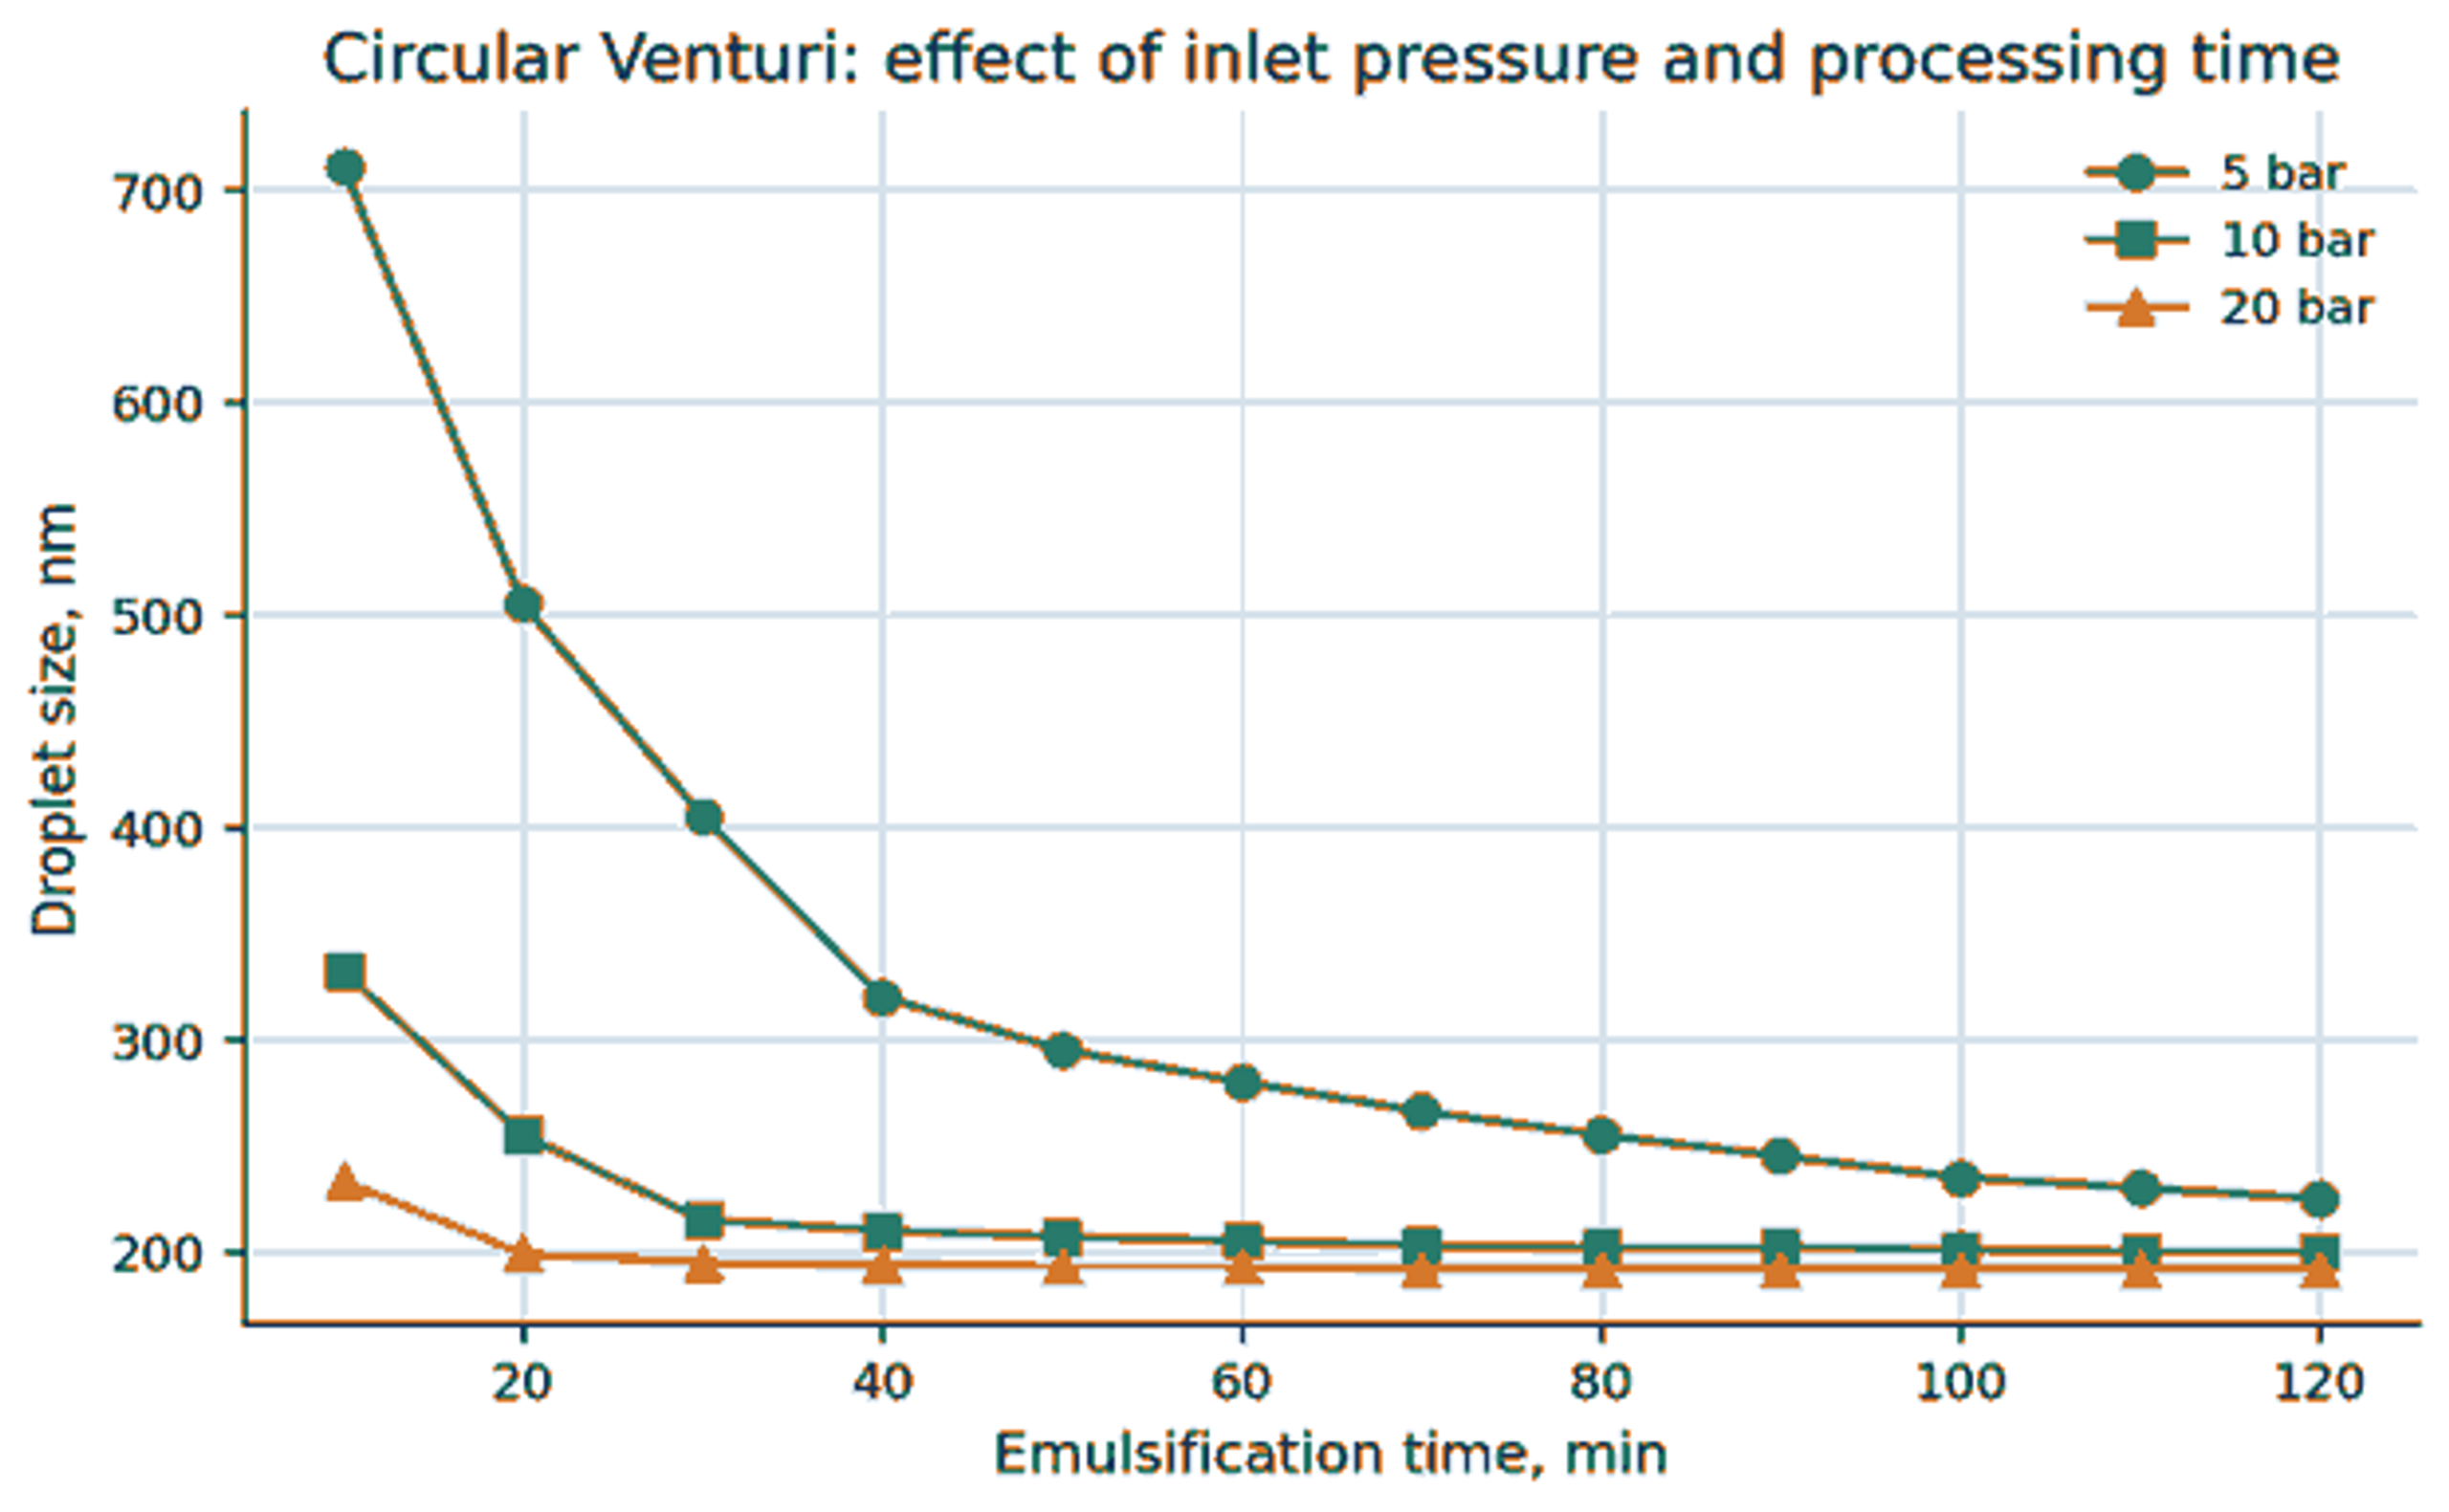
Figure 22. Circular Venturi: combined effect of inlet pressure and emulsification time on coconut oil droplet size [35].
At equal 5 bar pressure, the slit Venturi achieved a much smaller diameter than the circular Venturi because of higher flow, higher dissipated power, lower cavitation number, and more passes over the same time. A circular Venturi at 10 bar produced a similar trajectory to the slit Venturi at 5 bar, illustrating that geometry can substitute for pressure when it changes exposure and local flow favorably.
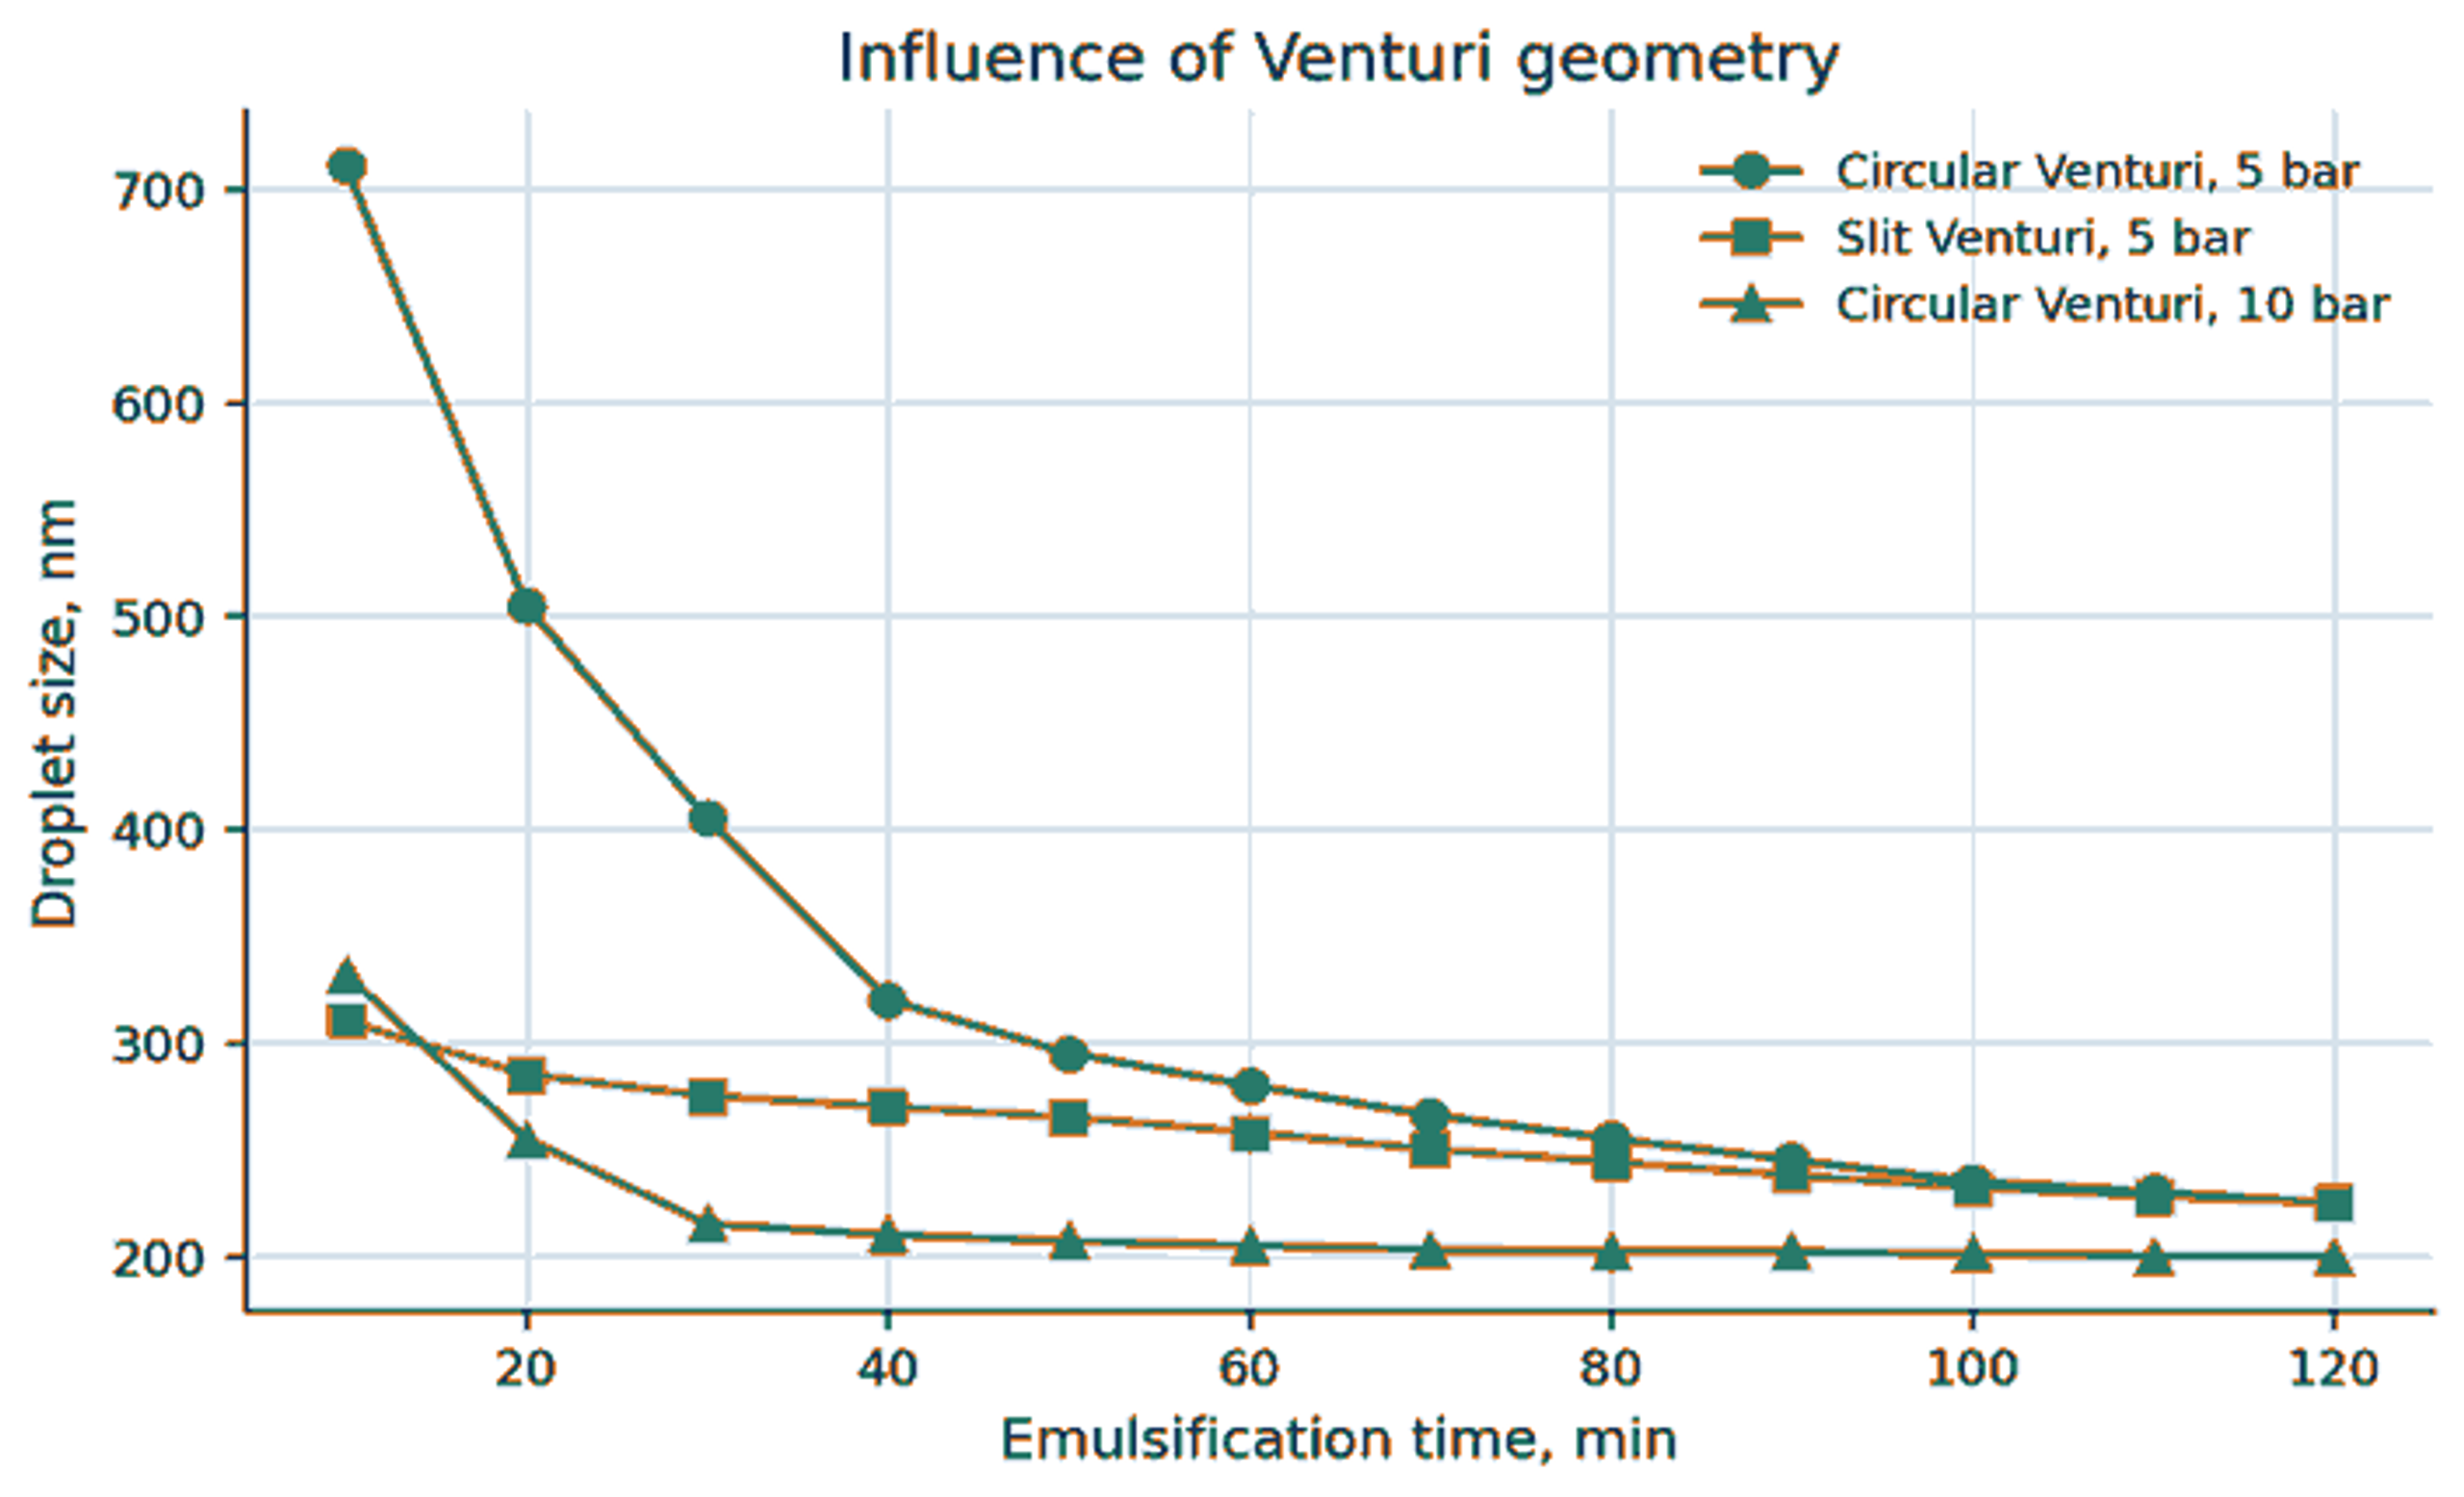
Figure 23. Comparison of circular and slit Venturi performance for coconut oil emulsification [35].
6.8 Evolution from broad to narrow distributions
Early passes through a cavitation device often produce a broad or bimodal distribution because some droplets encounter strong collapse events while others experience only weak stress. In the circular Venturi study, the mean diameter and polydispersity decreased as recirculation continued [35]. The breakup studies likewise show that increasing effective stress can shift breakup morphology and distribution, but stochastic exposure means that a single mean stress is insufficient to describe every droplet [26,27].
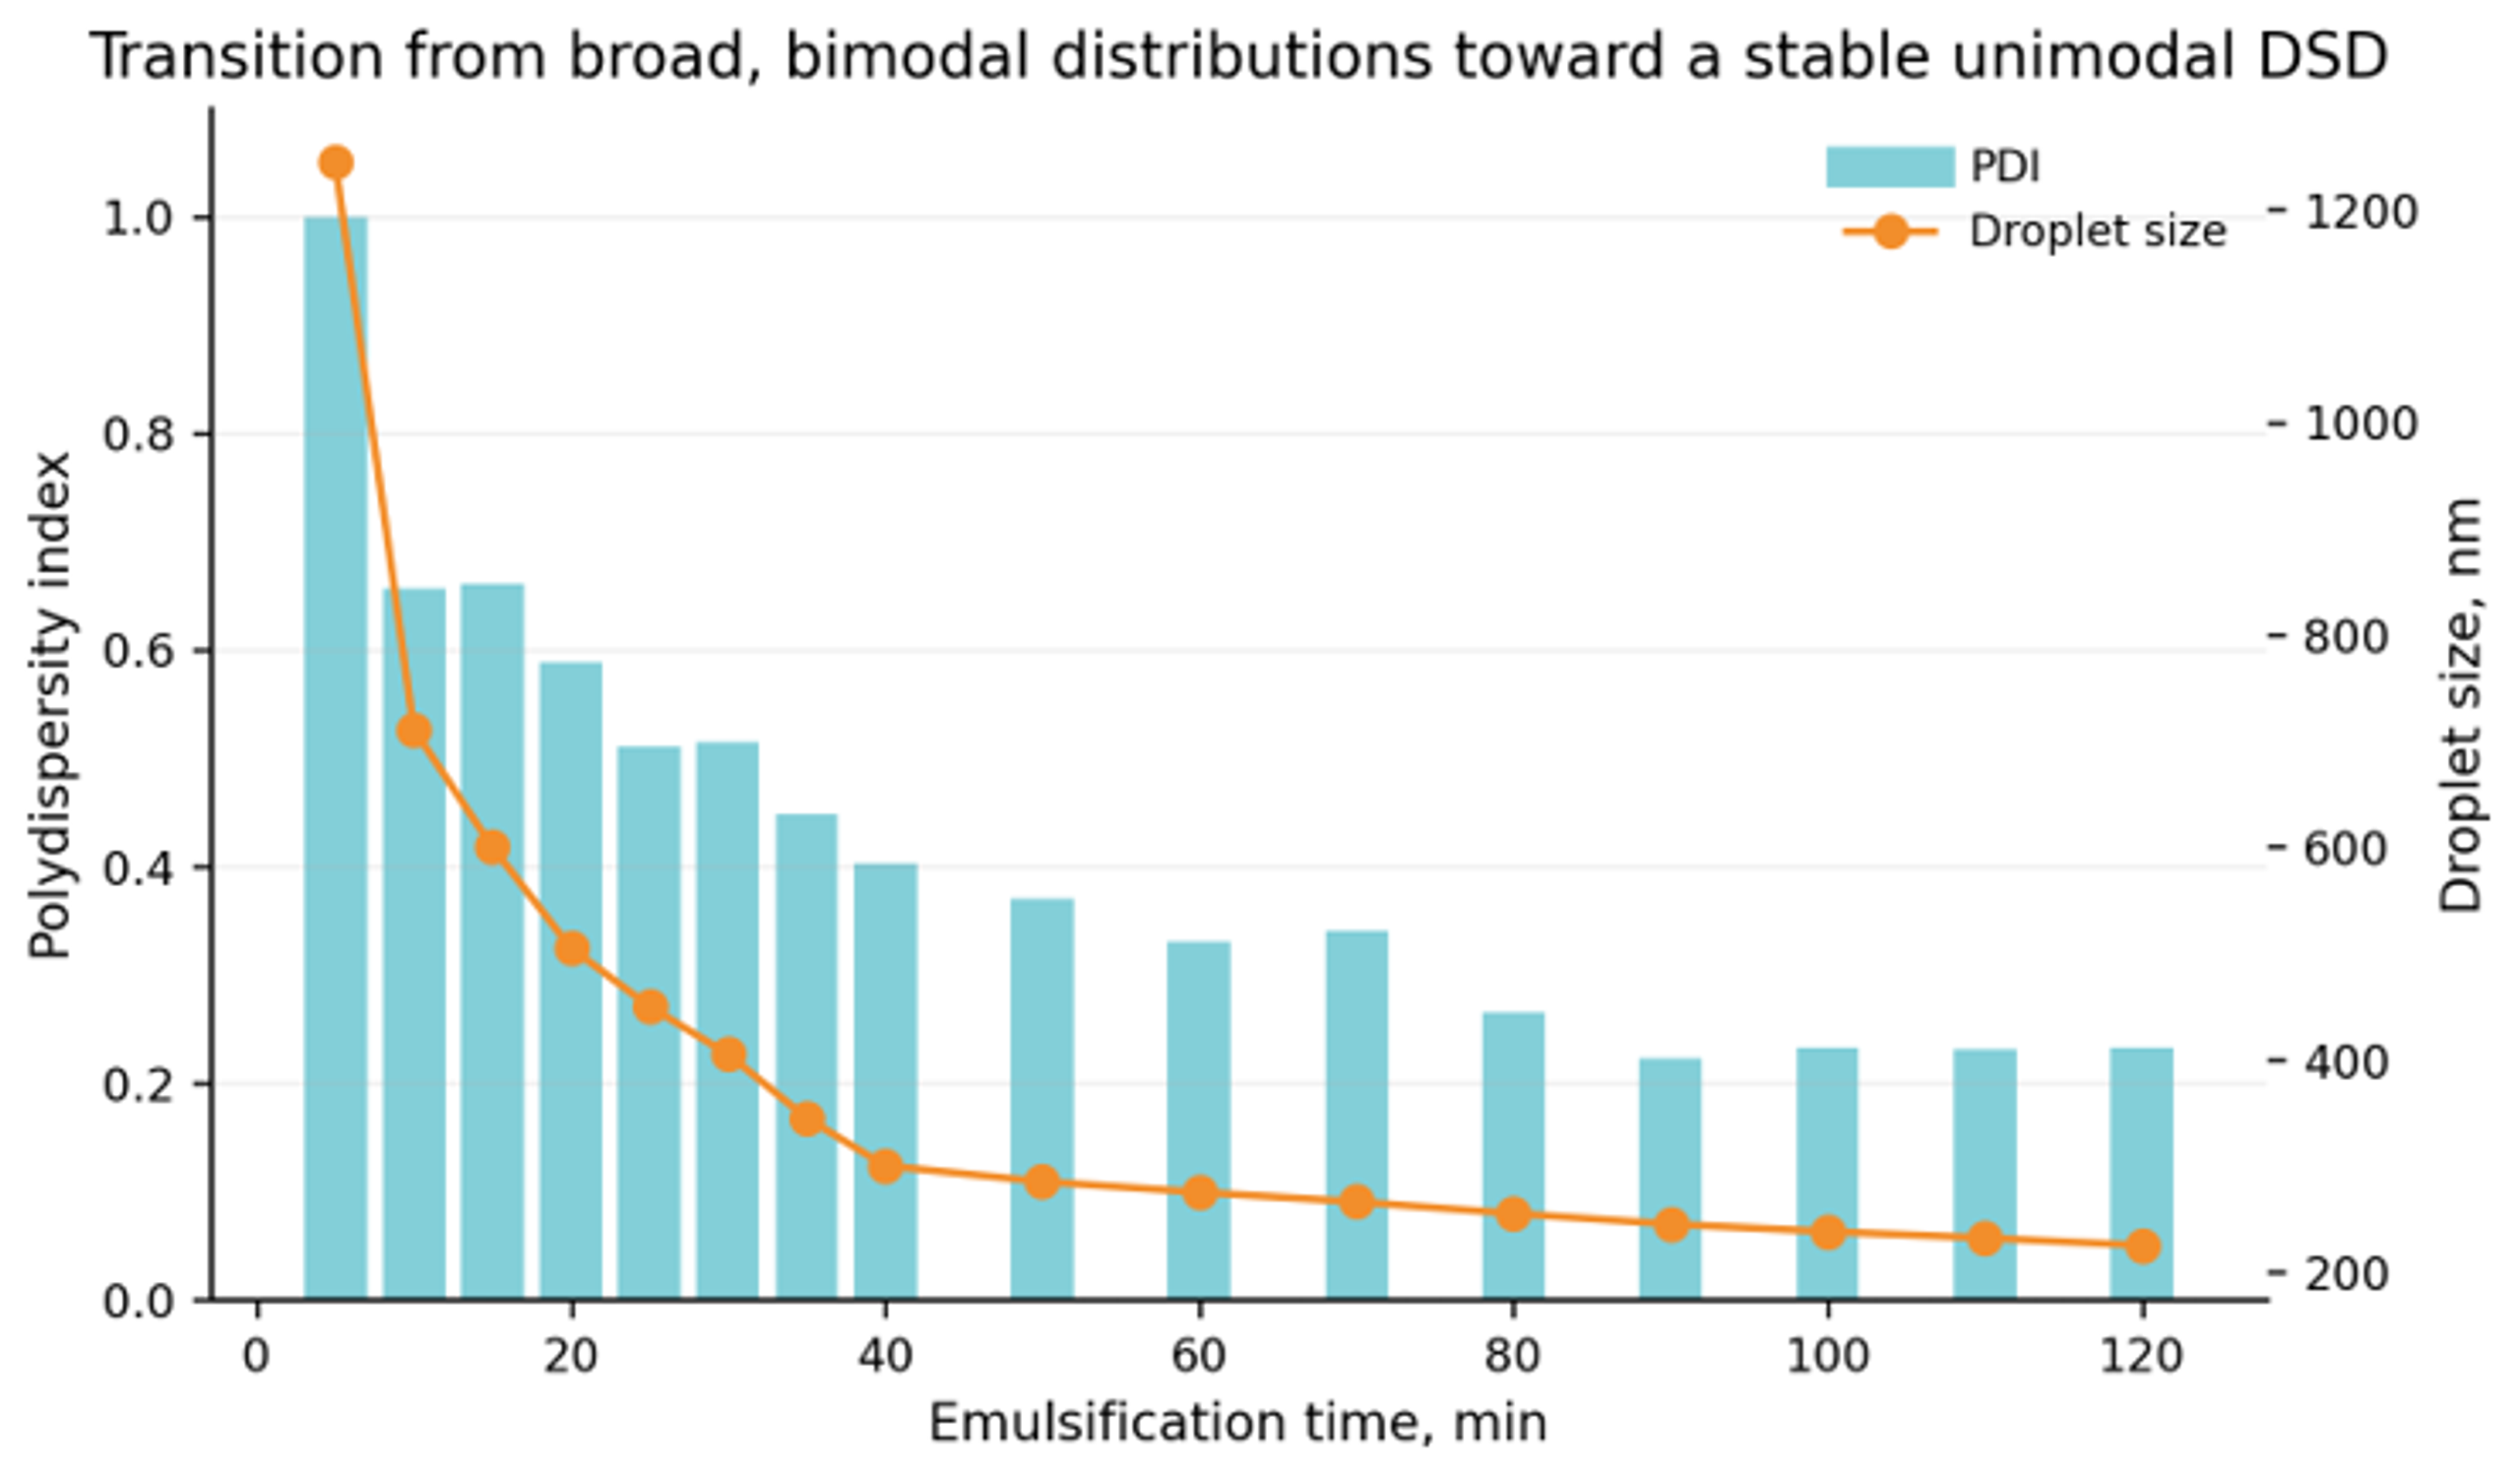
Figure 24. Transition from a broad, initially bimodal droplet size distribution toward a smaller and narrower distribution with increasing processing time [35].
6.9 Dispersed phase fraction and emulsifier loading
At fixed device conditions, increasing oil volume fraction increases the amount of interface that must be created and raises droplet collision frequency. Ramisetty et al. observed that increasing coconut oil fraction from 0.1 to 0.4 increased both the early time diameter and the time required to reach a stable plateau [35]. Increasing emulsifier fraction reduced interfacial tension and recoalescence, producing smaller final droplets until additional treatment gave little benefit.
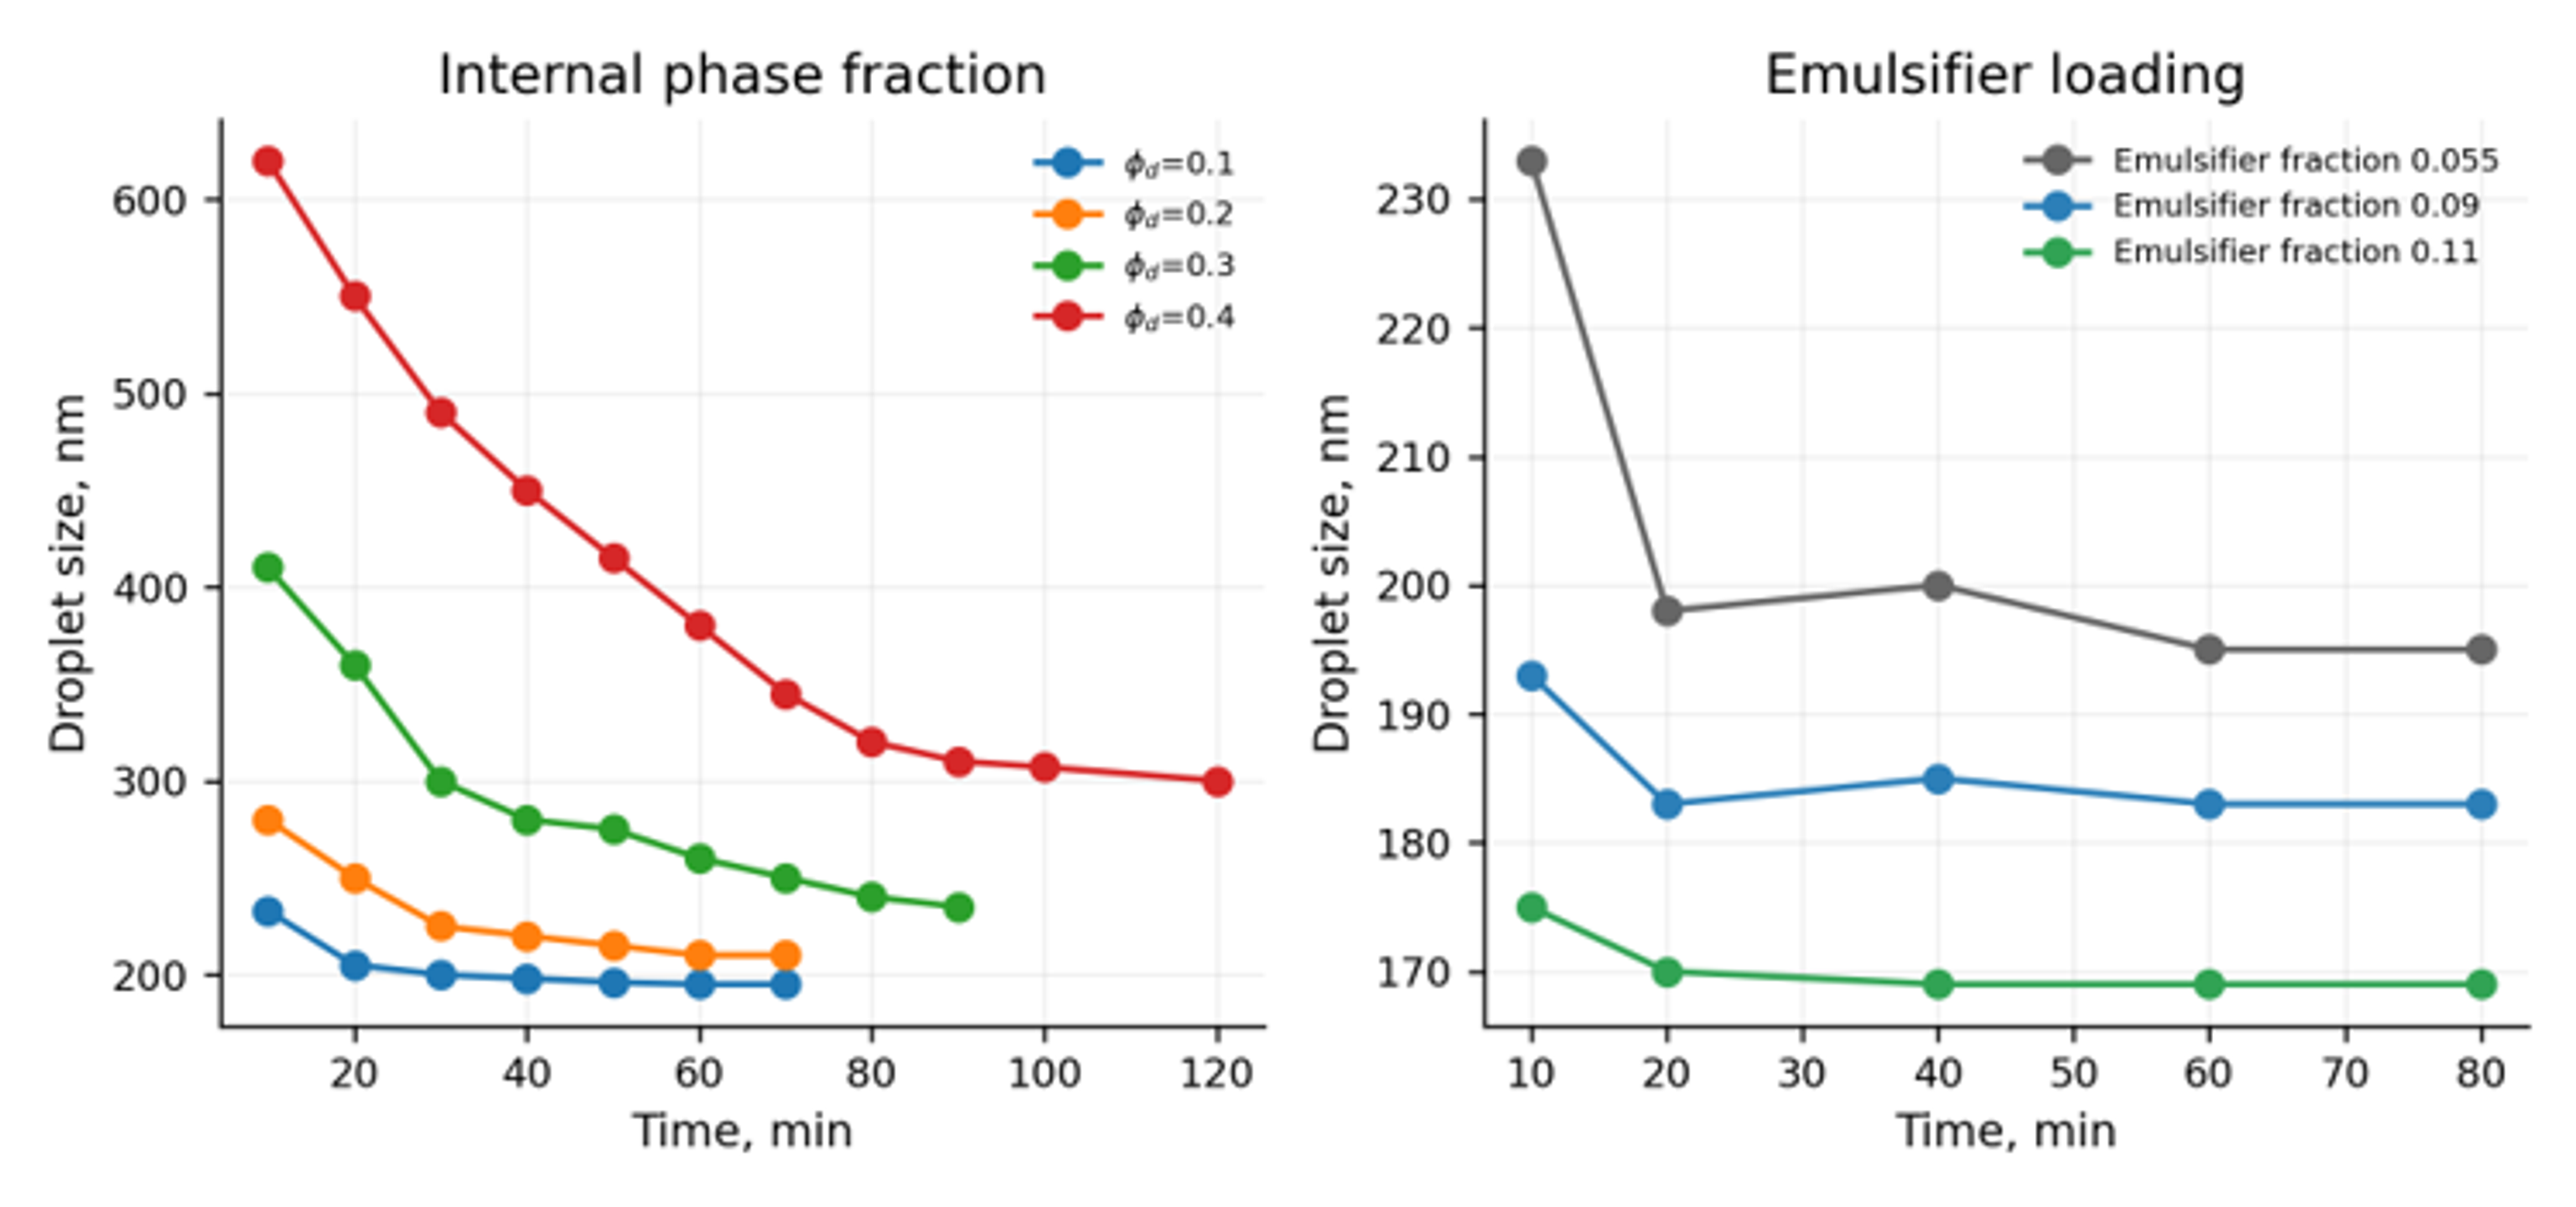
Figure 25. Effects of internal phase volume fraction and emulsifier loading on coconut oil emulsion droplet size [35].
Dense emulsions require additional care because viscosity can rise sharply, the continuous phase may become difficult to identify, and droplets can crowd the effective cavitation region. Upadhyay, Ravi, and Ranade studied rapeseed oil volume fractions up to 0.60 [24]. They found that was nearly independent of oil fraction up to a critical value and then increased approximately linearly. They also reported and breakup efficiency proportional to .
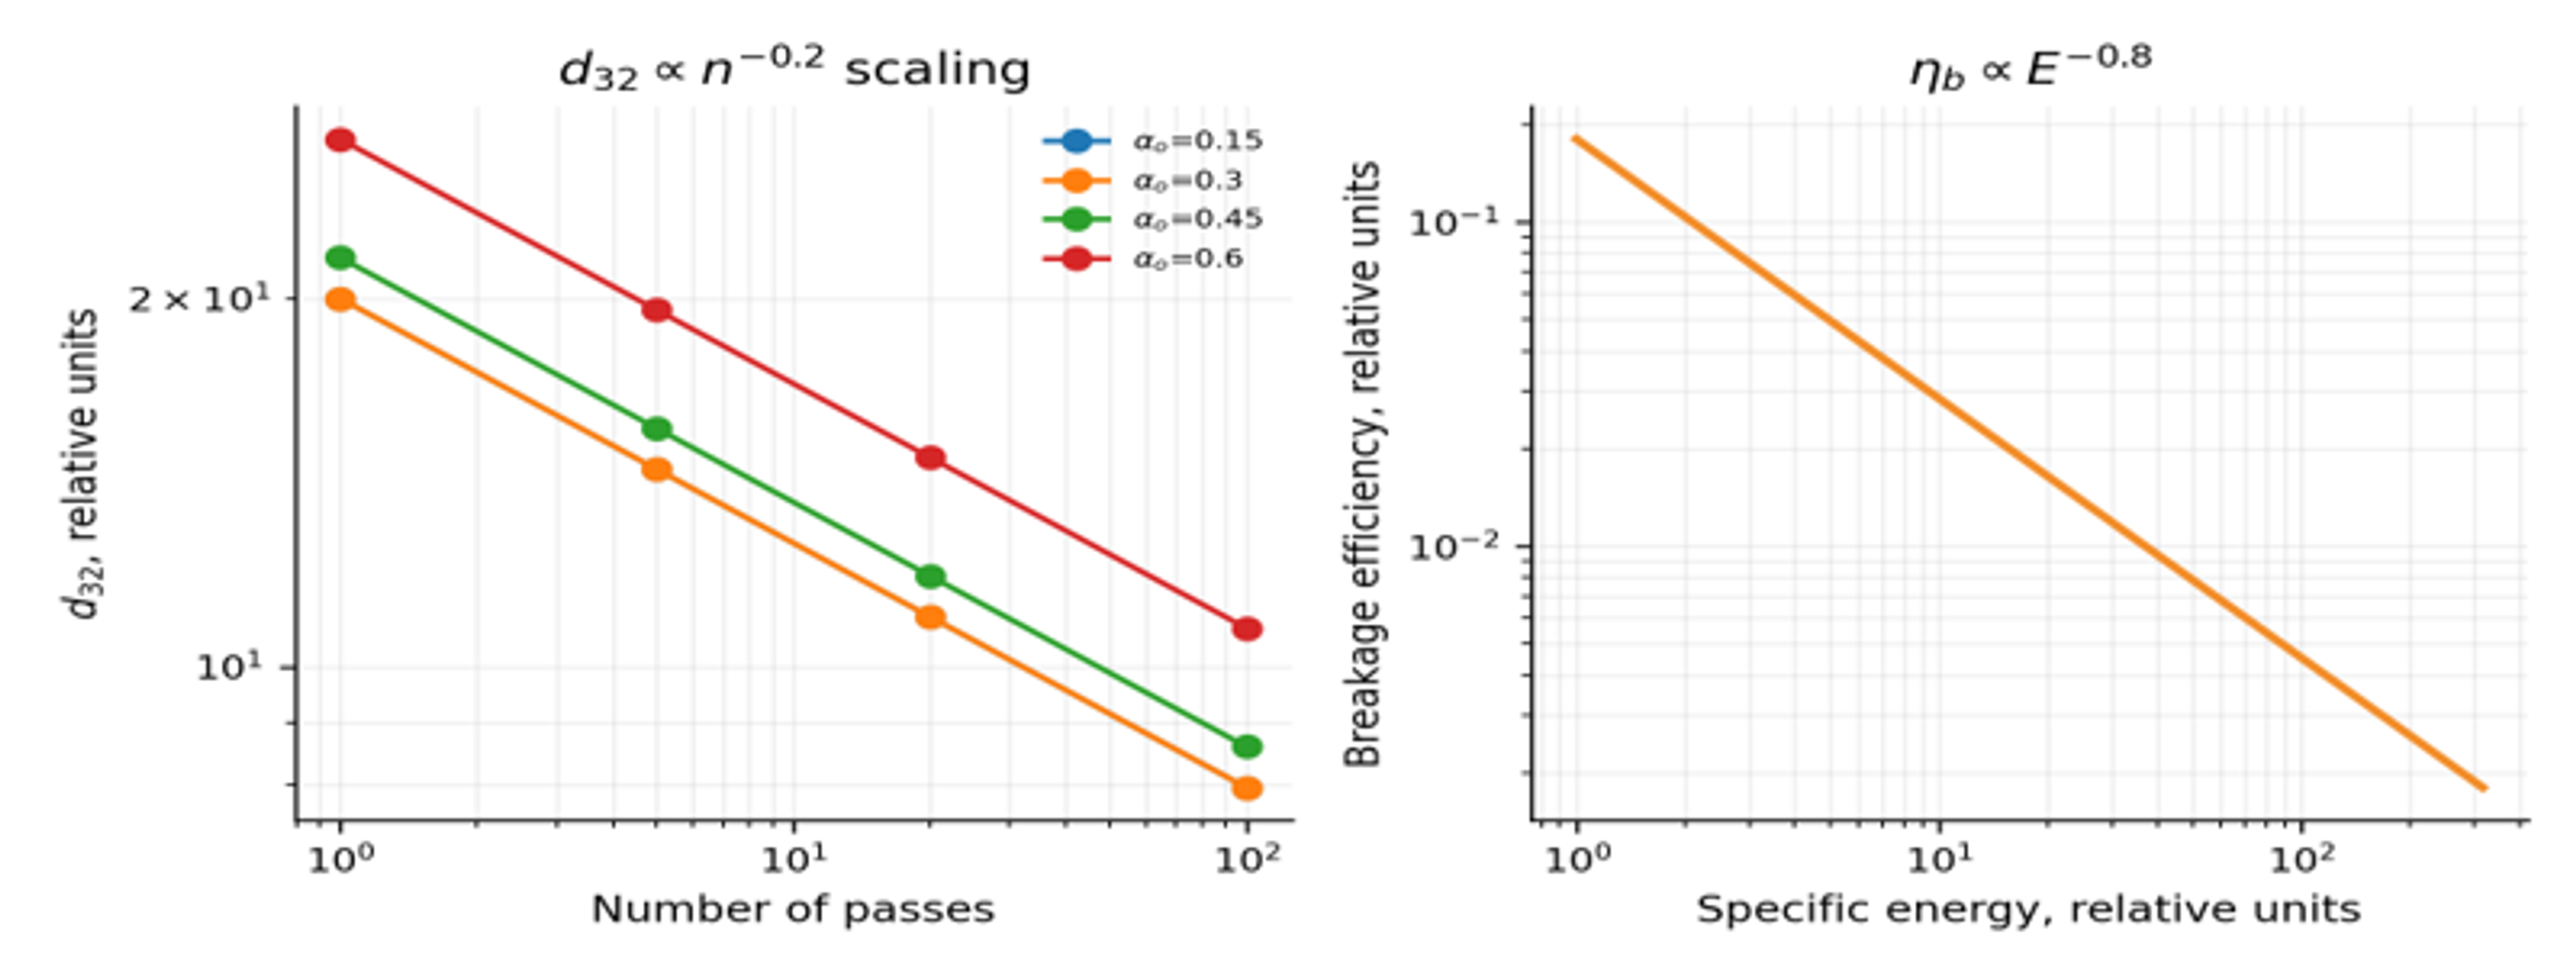
Figure 26. Reported scaling for dense oil in water emulsions in a vortex based cavitation device: pass number dependence, declining breakup efficiency with energy, and the effect of oil fraction beyond a critical value [24].
6.10 Temperature, dissolved gas, chemistry, and materials
Temperature changes vapor pressure, viscosity, density, interfacial tension, surfactant solubility, adsorption rate, oxidation rate, and the location of cavitation inception. A temperature increase can reduce viscosity and promote breakup, but it also increases vapor pressure and may weaken collapse at a fixed downstream pressure. For heat sensitive products, outlet temperature and cumulative thermal history must be controlled rather than assuming the process is nonthermal.
Dissolved and entrained gases provide nuclei and cushion collapse. Excess gas can broaden the bubble population, reduce collapse intensity, change pump performance, and cause foaming. Degassing may improve reproducibility in some systems, while gas addition may be useful when aeration is desired. The selected gas condition should therefore be treated as a controlled process variable.
Cavitation can generate reactive species in water and can accelerate oxidation of unsaturated lipids, fragrances, vitamins, polymers, or active pharmaceutical ingredients. Chemical compatibility tests should include peroxide value, anisidine value, dissolved oxygen, color, odor, molecular weight, or assay as appropriate. Metallic surfaces, elastomers, and coatings should be selected for corrosion, erosion, extractables, and cleaning chemistry. Austenitic stainless steels are common for sanitary service; hardened alloys, ceramics, or replaceable inserts may be required at high intensity edges.
Table 9. Process variables, expected effects, and diagnostic measurements.
| Variable | Expected effect when increased | Possible adverse effect | Recommended measurement |
|---|---|---|---|
| Inlet pressure or pressure drop | More velocity, cavitation, and breakup up to an optimum | Heating, choked cavitation, erosion, pump load | Upstream and downstream pressure, flow, temperature, DSD |
| Backpressure | Stronger recovery collapse and shifted cavitation regime | Suppressed inception if excessive | Fast pressure trace and visual or acoustic regime indicator |
| Pass number | Lower mean size and narrower DSD initially | Diminishing returns, oxidation, heating | , , span, temperature rise, energy |
| Dispersed phase fraction | Higher production concentration | More collisions, viscosity, recoalescence, longer treatment | Phase fraction, rheology, DSD, pump curve |
| Emulsifier concentration | Faster stabilization and lower interfacial tension | Cost, taste, toxicity, micelles, phase inversion | Dynamic interfacial tension, coverage, product performance |
| Dispersed phase viscosity | Greater resistance to deformation | Coarser droplets and larger power requirement | Viscosity at process temperature and relevant shear rate |
| Continuous phase viscosity | Slower creaming and film drainage | Damped circulation and higher pressure loss | Rheology, Reynolds number, flow rate |
| Temperature | Lower viscosity and faster adsorption | Higher vapor pressure, oxidation, active degradation | Inlet/outlet temperature and cumulative thermal history |
| Dissolved gas | More nuclei and earlier inception | Collapse cushioning, foaming, variability | Dissolved oxygen or gas content, void fraction |
| Geometry | Controls local pressure, trajectory, and recovery | Clogging, bypass, erosion, difficult cleaning | CFD, pressure map, residence time distribution, pilot test |
Recent simplified modeling for continuous vortex based emulsification was validated over droplet sizes of approximately 1 to 100 µm, pressure drops of 50 to 250 kPa, and oil volume fractions of 0.05 to 0.45, with reported root mean square errors from 0.002 to 0.6 µm for the evaluated systems [28]. This is a valuable operating envelope, but it should not be extrapolated automatically to nanoemulsions below 100 nm, very high viscosities, or different cavitation architectures.
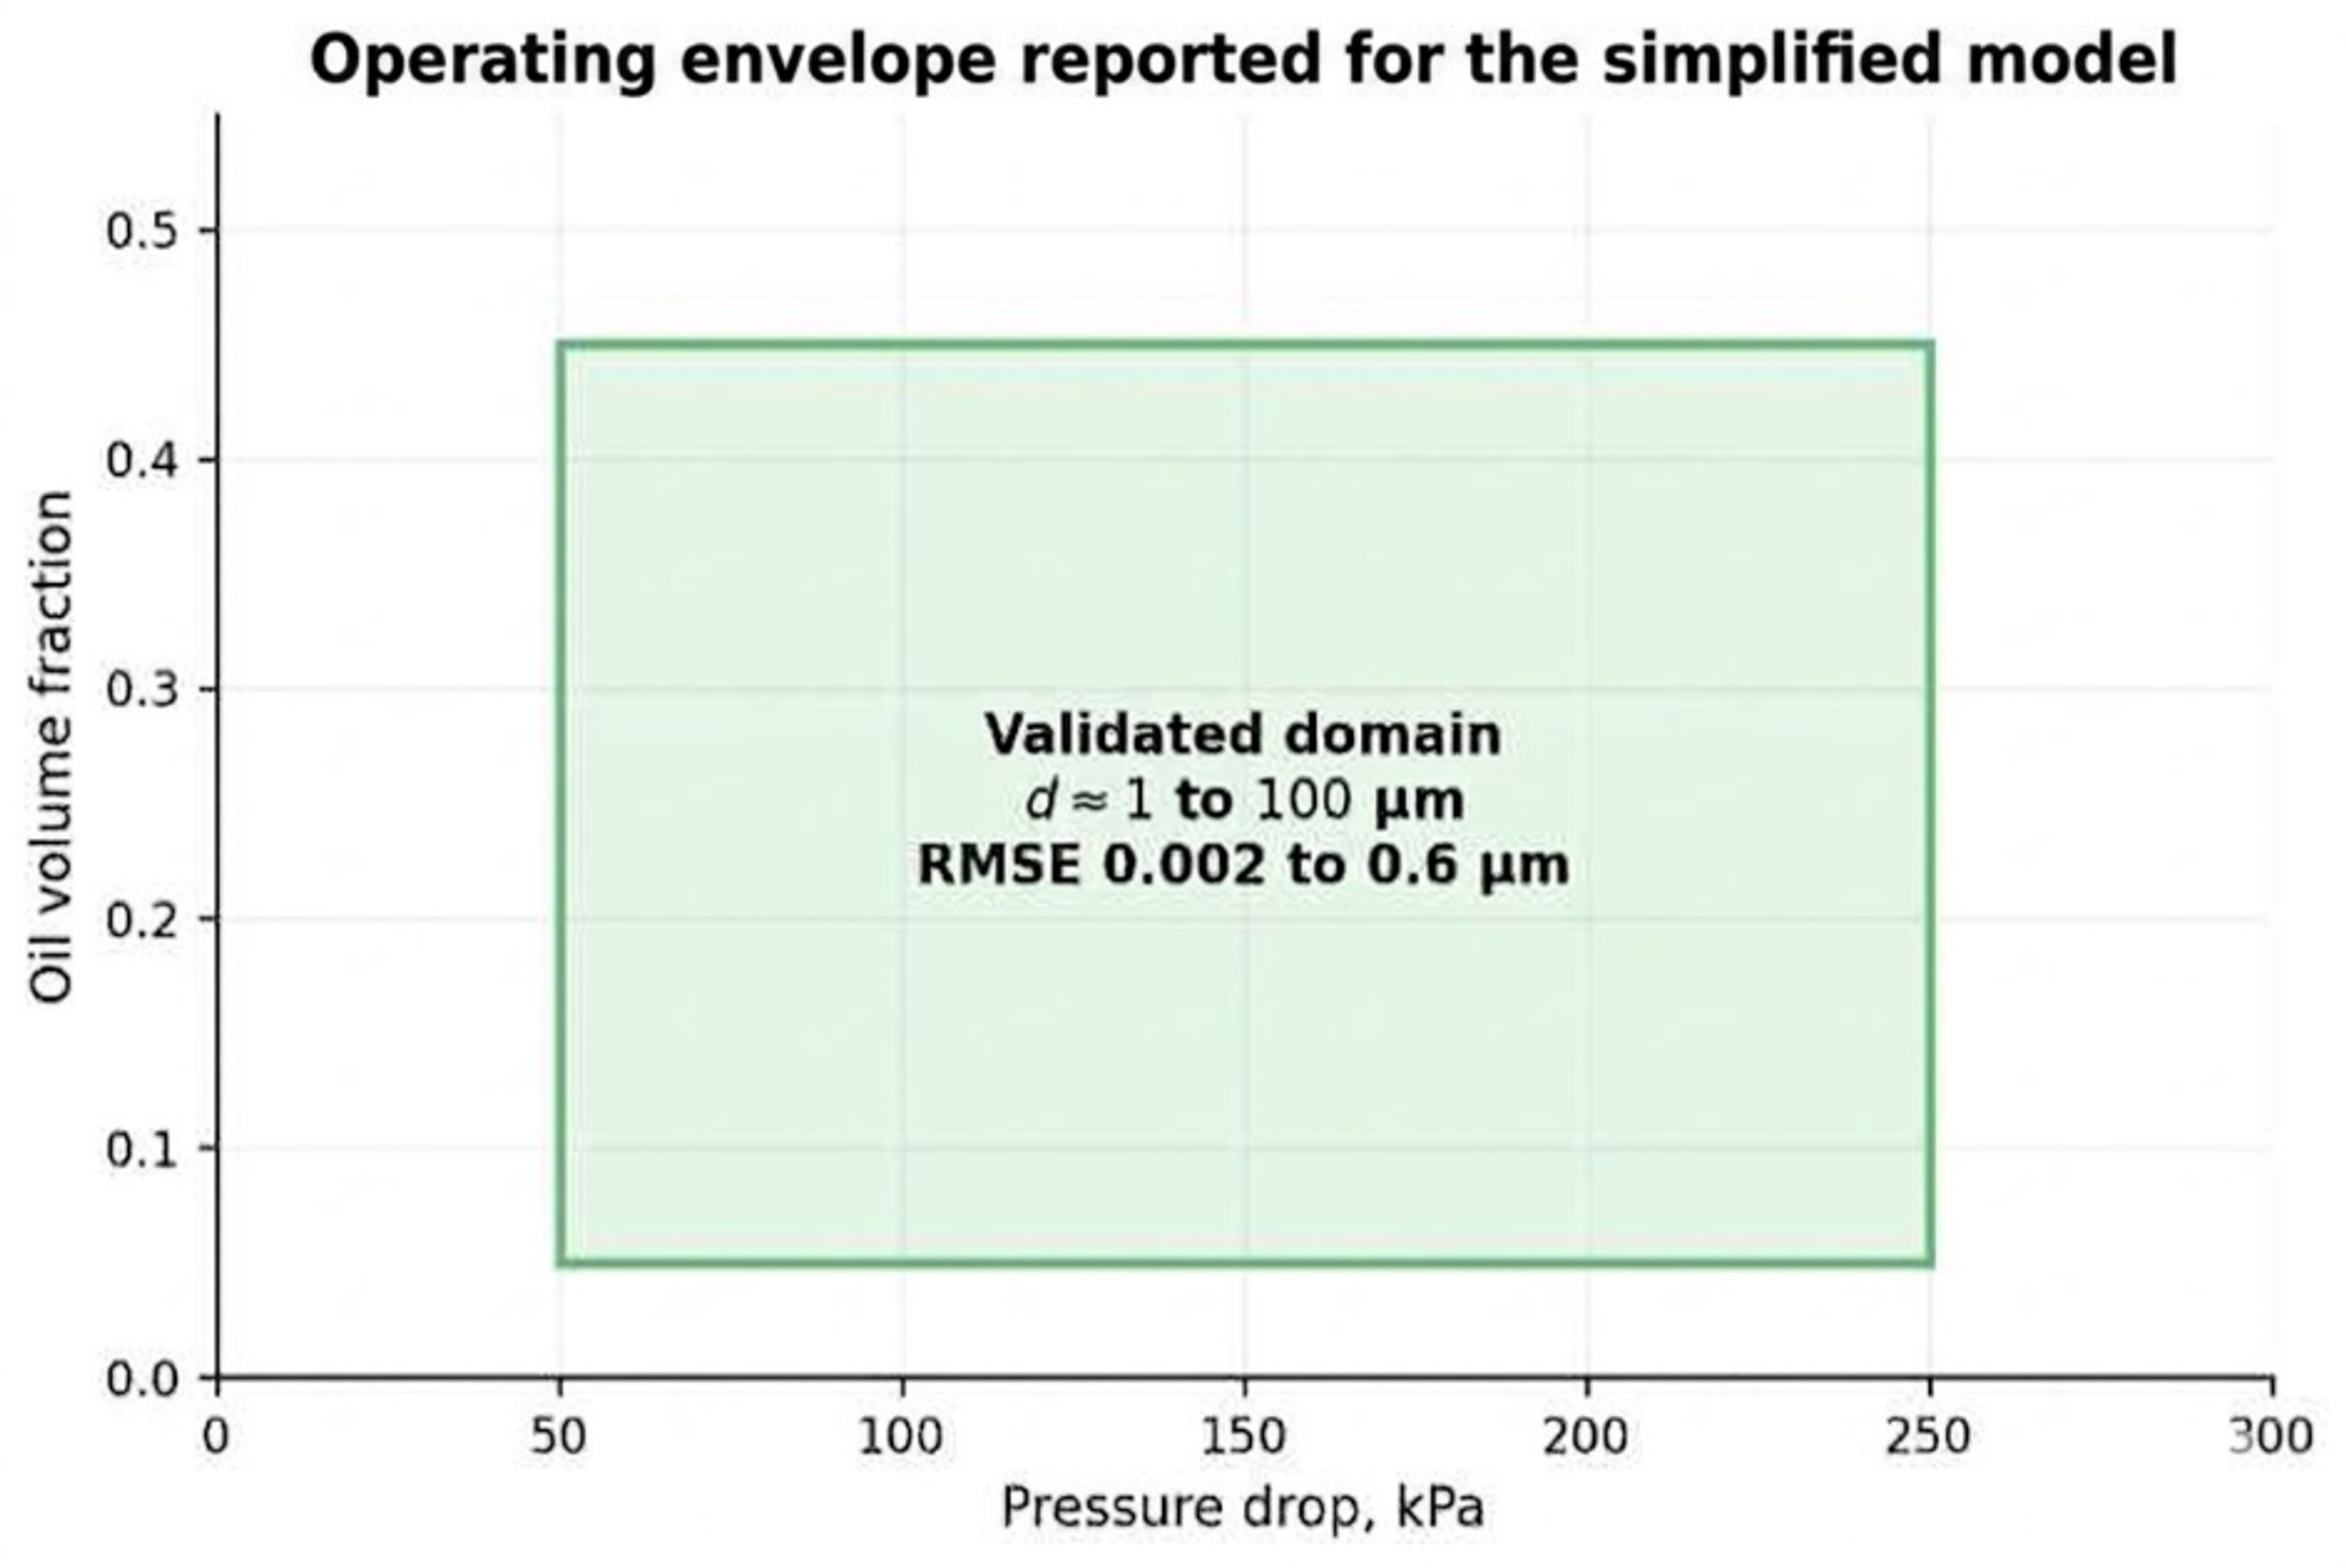
Figure 27. Reported validation envelope for the simplified continuous emulsification model [28].