
Technical publication
Back to publications
Hydrodynamic Cavitation in Emulsification and Homogenization
okozyuk.com
Published
Hydrodynamic Cavitation in Emulsification and Homogenization
Abstract
Hydrodynamic cavitation is increasingly applied to emulsification and homogenization because cavity growth and collapse generate intense, localized pressure gradients, microjets, and turbulent dissipation within continuous flow equipment. This article examines the coupled hydraulic, interfacial, and kinetic mechanisms governing droplet breakup and stabilization and reviews the principal models used to describe cavitation assisted emulsification. Static constrictions, Venturi devices, vortex reactors, and dynamic rotor stator systems are evaluated with respect to cavitation regime, pressure recovery, residence time, energy input, and product response. Emulsion quality is treated as a distributional problem rather than a single mean diameter, with emphasis on Sauter mean diameter, coarse droplet tails, interfacial area, recoalescence, and storage stability. The analysis covers Kolmogorov and Hinze scaling, Rayleigh collapse relations, the Kozyuk and Fedotkin bubble field model, population balance methods, and reduced order descriptions, together with their assumptions and validation requirements. Published results are considered for vegetable oils, proteins, dairy systems, cosmetics, pharmaceuticals, fuels, and specialty chemical applications. Particular attention is given to backpressure, pass number, viscosity, phase fraction, emulsifier concentration, temperature, dissolved gas, erosion, sanitation, scale up, and process control. The evidence indicates that maximum visible cavitation does not necessarily correspond to optimum homogenization. Industrial performance is better defined by a validated operating window that couples droplet size distribution and stability with throughput, energy, thermal history, chemical quality, cleanability, and equipment durability.
Keywords: hydrodynamic cavitation; emulsification; homogenization; droplet breakup; cavitation reactor; population balance; scale up
1 Introduction
Hydrodynamic cavitation applied to emulsification and homogenization requires a consistent framework for hydraulic definitions, energy boundaries, residence time, uncertainty, and scale translation. This article develops the mechanisms, mathematical models, equipment configurations, operating variables, validation methods, and acceptance criteria specific to cavitation assisted emulsification and homogenization.
Emulsification is the formation of a dispersion in which one liquid is present as droplets within another immiscible or only partly miscible liquid. Homogenization is a broader operation that reduces and equalizes the size of droplets, particles, aggregates, or other inhomogeneities. In industrial practice, a single machine may perform premixing, emulsification, deagglomeration, homogenization, heating, extraction, and reaction intensification in the same pass. The central engineering task is therefore not simply to create small droplets. It is to create the required distribution of sizes, stabilize the newly generated interface, and do so at the necessary throughput without unacceptable heating, oxidation, erosion, contamination, or maintenance burden [1–4].
These operations are important in foods and beverages, dairy products, mayonnaise and dressings, cosmetics, dermatological products, injectable and oral formulations, agrochemical concentrates, fuel water dispersions, polymer latexes, coatings, lubricants, edible oil refining, fermentation media, and specialty chemicals. Droplet size influences opacity, mouthfeel, flavor release, viscosity, creaming, sedimentation, filtration, sprayability, dissolution, drug release, reaction rate, and interphase mass transfer [1,2]. Practical process objectives include dispersing one liquid within another, reducing and narrowing the droplet size distribution, suppressing creaming and coalescence, and improving the required physical, chemical, or biological performance [3].
Conventional high energy equipment includes rotor stator mixers, colloid mills, high pressure homogenizers, microfluidizers, and ultrasonic processors. Low energy routes include phase inversion, spontaneous emulsification, and membrane methods. Each route occupies a different region of throughput, attainable droplet size, formulation dependence, energy input, cleanability, and capital cost. Hydrodynamic cavitation is attractive because cavities are produced by the liquid flow itself, usually through a constriction, vortex chamber, valve, nozzle, cone, rotor stator clearance, or perforated rotating element. This permits continuous processing with conventional pumps and piping, without the limited penetration depth and scale sensitivity of an acoustic field [5–8].
The local nature of cavitation is both its advantage and its main design difficulty. The most severe events occur near collapsing cavities, while the volume averaged power density may be modest. Weak cavitation may add little beyond ordinary turbulence. Excessive vapor formation may produce a large, attached cavity or vapor blanket, reduce the number of discrete collapses, increase heat load and gas entrainment, and expose equipment to erosion. The correct question is therefore: which bubble population, pressure recovery field, residence time, and formulation create the required droplet size distribution at the lowest total process penalty?
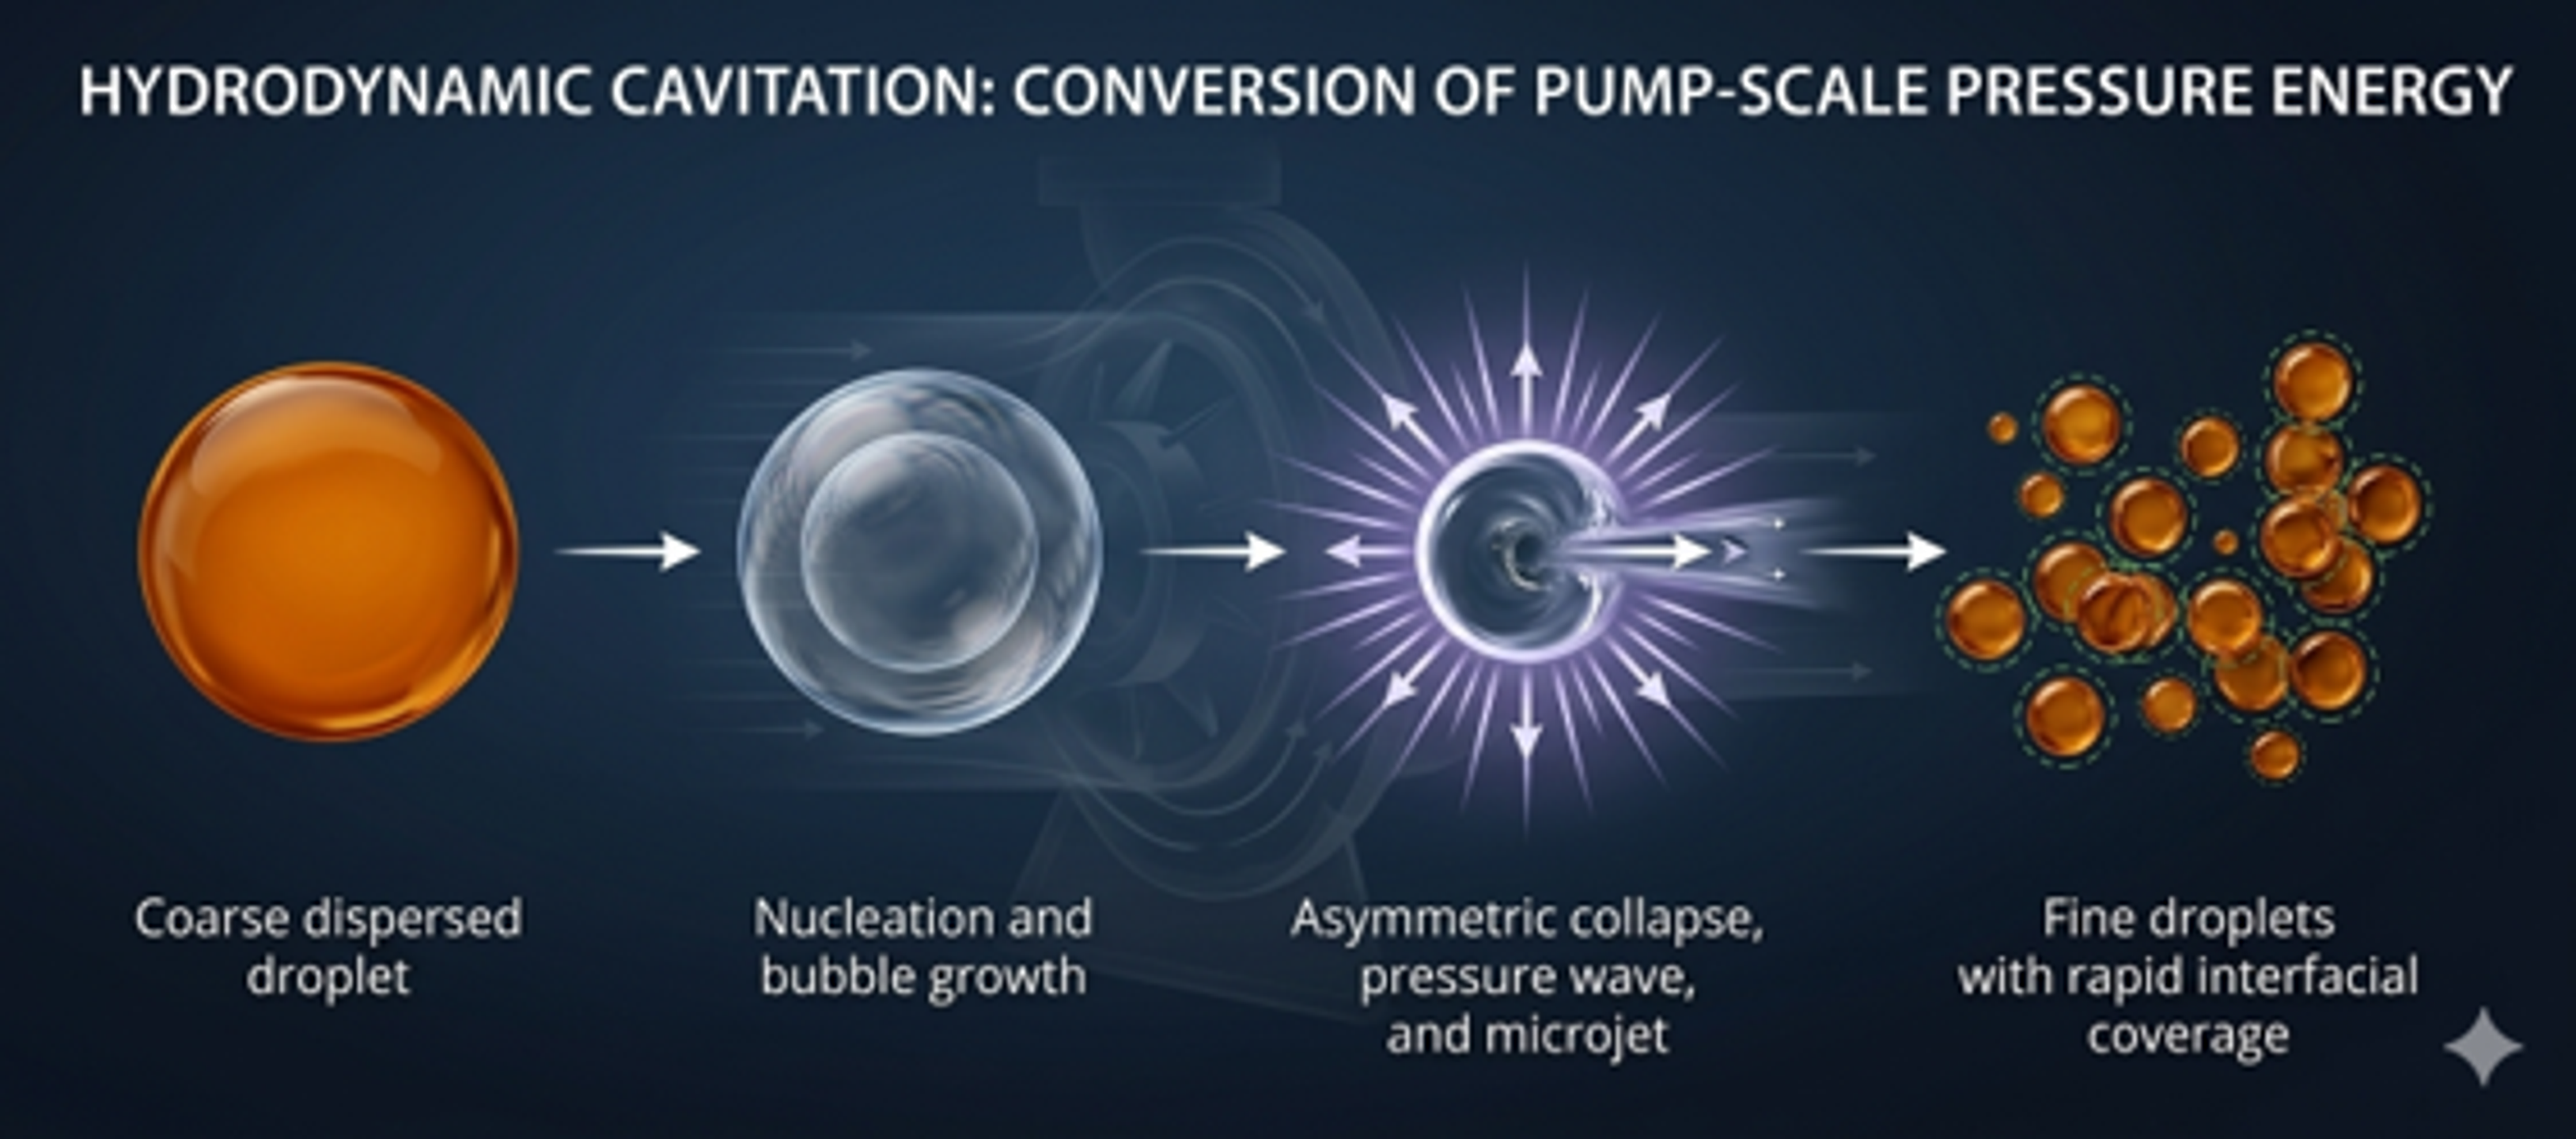
Figure 1. Conceptual sequence for cavitation assisted droplet breakup and stabilization. A coarse droplet is deformed by pressure and velocity fluctuations, fragmented near a collapse event, and then stabilized by rapid interfacial coverage [9].
Cavitation assisted emulsification differs from a purely mechanical shear process in three respects. First, the stress field is highly intermittent. Second, cavity collapse can generate strong gradients over distances comparable to bubble and droplet dimensions. Third, the pressure recovery zone is as important as the low pressure generation zone because collapse, rather than vapor formation alone, supplies much of the disruptive action. These distinctions explain why average inlet pressure, nominal power, or cavitation number alone seldom predicts product quality across different devices.
A central distinction in this article is made between breakup capacity and stabilization capacity. Breakup capacity is the ability of the flow to overcome capillary and viscous resistance. Stabilization capacity is the ability of surfactants, proteins, polymers, or particles to cover newly generated interface and prevent recoalescence. A process may therefore provide sufficient breakup while still producing a coarse or broad distribution when adsorption is too slow or droplet collisions are too frequent.
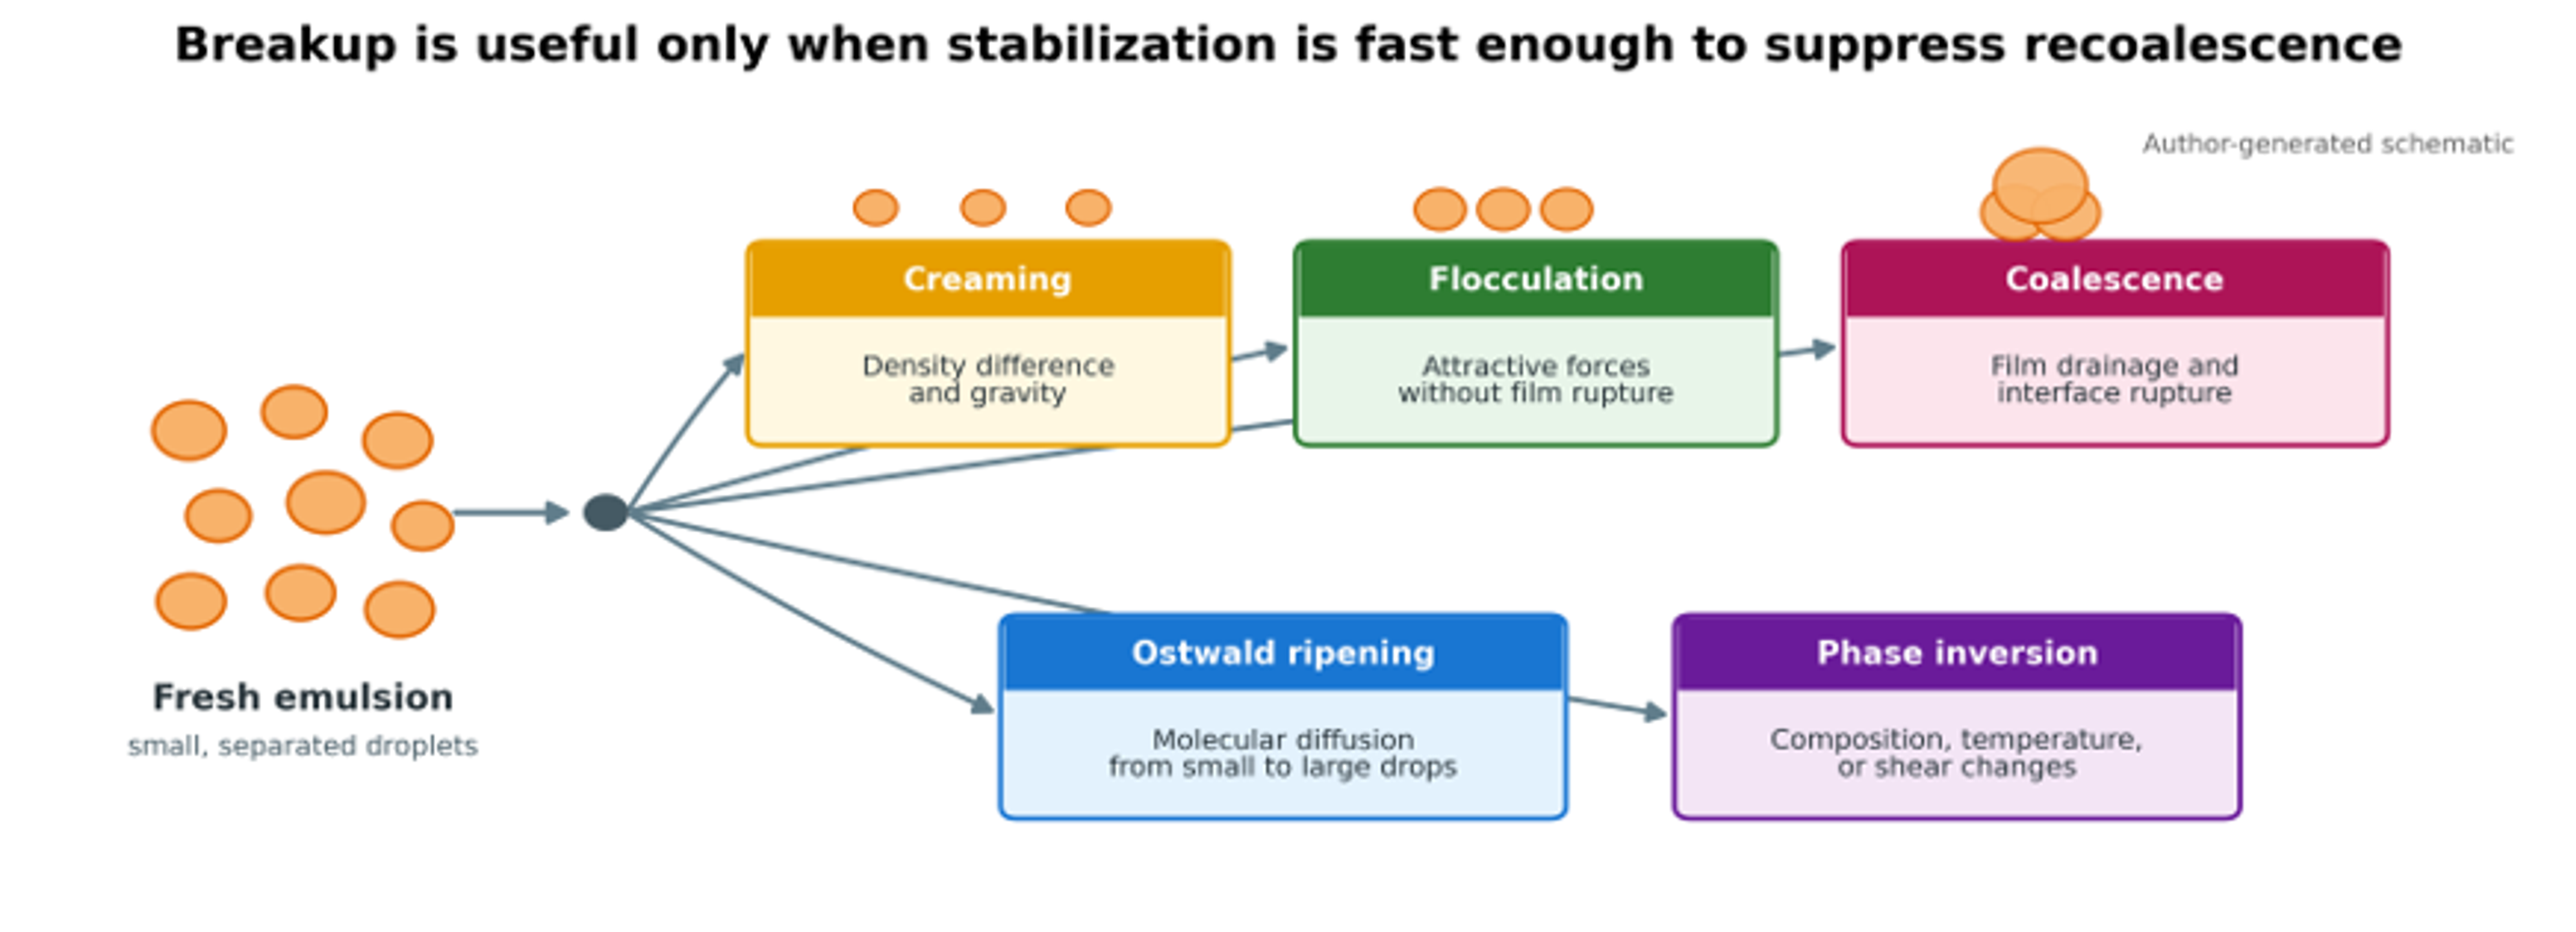
Figure 2. Principal physical destabilization pathways after emulsification. Creaming and sedimentation redistribute droplets, flocculation joins droplets without merging, coalescence merges droplets, Ostwald ripening transfers material through the continuous phase, and phase inversion changes emulsion topology [9].
2 Emulsion Fundamentals and Product Metrics
2.1 Emulsion classes and terminology
Oil in water (O/W) emulsions contain oil droplets in an aqueous continuous phase. Water in oil (W/O) emulsions contain water droplets in an oil phase. Multiple emulsions, such as W/O/W and O/W/O, contain droplets within droplets. Pickering emulsions are stabilized predominantly by solid particles adsorbed at the interface. The terms macroemulsion, miniemulsions, nanoemulsion, and microemulsion are used inconsistently across disciplines, so every technical specification should state the actual measurement method and size statistics rather than rely on a category name alone [1,2,10,11].
Table 1. Practical classification of liquid dispersion systems. Size boundaries are approximate and overlap among fields.
| System | Typical droplet scale | Thermodynamic status | Common preparation route | Design implication |
|---|---|---|---|---|
| Coarse or macroemulsion | 1 to 100 µm, sometimes larger | Unstable at equilibrium; kinetically stabilized | Agitated tank, static mixer, rotor stator | Separation may be rapid unless viscosity or interfacial stabilization is sufficient |
| Miniemulsion or submicron emulsion | 0.1 to 1 µm | Kinetically stabilized | High shear, high pressure homogenization, cavitation | Requires rapid surface coverage and control of the coarse tail |
| Nanoemulsion | Roughly 20 to 500 nm | Kinetically stabilized | High pressure homogenization, microfluidization, ultrasonication, cavitation, phase inversion | Optical appearance, ripening, and surfactant demand become dominant |
| Microemulsion | Commonly 10 to 100 nm | Thermodynamically stable over a composition region | Spontaneous self-assembly with high surfactant and often cosurfactant loading | Formulation, not mechanical energy, is the controlling variable |
| Multiple emulsion | Internal and external droplets may span submicron to tens of micrometres | Kinetically stabilized and structurally complex | Sequential emulsification | Excessive second stage stress can destroy internal droplets |
| Pickering emulsion | Broad range | Kinetically stabilized by particles | High shear plus particle wetting control | Particle wettability and adsorption energy govern stability |
2.2 Droplet size distribution and interfacial area
A single mean diameter cannot fully describe an emulsion. Number weighted measurements emphasize small droplets, while volume weighted and scattering based methods emphasize large droplets. The generalized moment mean diameter for discrete size classes is:
where is the number of droplets in class and is the representative diameter. The Sauter mean diameter, which preserves the volume to area ratio, is:
The volume weighted mean diameter is:
For spherical droplets, the interfacial area per unit emulsion volume is related directly to :
where is the dispersed phase volume fraction. This equation explains why a modest reduction in diameter creates a large increase in surface area and surfactant demand. The breadth of a distribution is often summarized by the span:
where , , and are cumulative percentile diameters. A process may reduce while leaving an undesirable coarse tail. For quality control, the minimum reporting set should therefore include the measurement method, dilution protocol, basis of weighting, or Z average, , span or polydispersity index, temperature, and the time between processing and analysis.
Table 2. Droplet size and distribution metrics used in emulsification studies.
| Metric | Physical meaning | Strength | Main limitation |
|---|---|---|---|
| Diameter with the same volume to area ratio as the distribution | Directly related to interfacial area and many breakup models | Can conceal a coarse tail | |
| Volume weighted mean | Sensitive to large droplets and useful for process failure detection | Strongly affected by a small number of coarse droplets | |
| , , | Cumulative distribution percentiles | Describe distribution location and coarse fraction | Depend on weighting basis and instrument model |
| Span | Relative width from , , | Simple comparison of breadth | Does not show multimodality |
| PDI | Polydispersity index from dynamic light scattering | Useful for submicron systems | Not interchangeable with laser diffraction span |
| Z average | Cumulants mean from dynamic light scattering | Standard for many nanoemulsions | Sensitive to dilution and scattering assumptions |
| Specific interfacial area | Area per unit mass or volume | Connects droplet size to mass transfer and surfactant demand | Requires spherical droplet and composition assumptions |
The reversible work required to create interface is the increase in interfacial free energy:
where γ is the interfacial tension. Mechanical equipment supplies far more energy than the thermodynamic minimum because most input is dissipated as bulk turbulence, heat, vibration, sound, viscous loss, and pump inefficiency. Interfacial area generated per unit energy is therefore a more revealing comparison metric than nominal power alone [2,12,13].
2.3 Stability mechanisms
Small droplets reduce gravitational separation, but they do not make an emulsion thermodynamically stable. In the dilute Stokes regime, the creaming or sedimentation velocity is approximated by
where and are continuous and dispersed phase densities, is gravitational acceleration, and is continuous phase viscosity. The quadratic diameter dependence is a major reason that homogenization slows creaming. The equation becomes inaccurate in concentrated, non Newtonian, flocculated, or hindered settling systems.
Ostwald ripening can be summarized by a cubic radius growth law:
where depends on interfacial tension, solubility of the dispersed phase in the continuous phase, diffusivity, molar volume, temperature, and formulation. Hydrodynamic cavitation does not remove the need to control ripening, coalescence, or flocculation. It can even increase the driving force for instability by creating more interface. The resulting emulsion remains useful only when interfacial coverage, electrostatic or steric repulsion, continuous phase rheology, and storage conditions provide an adequate kinetic barrier [1,2,14].
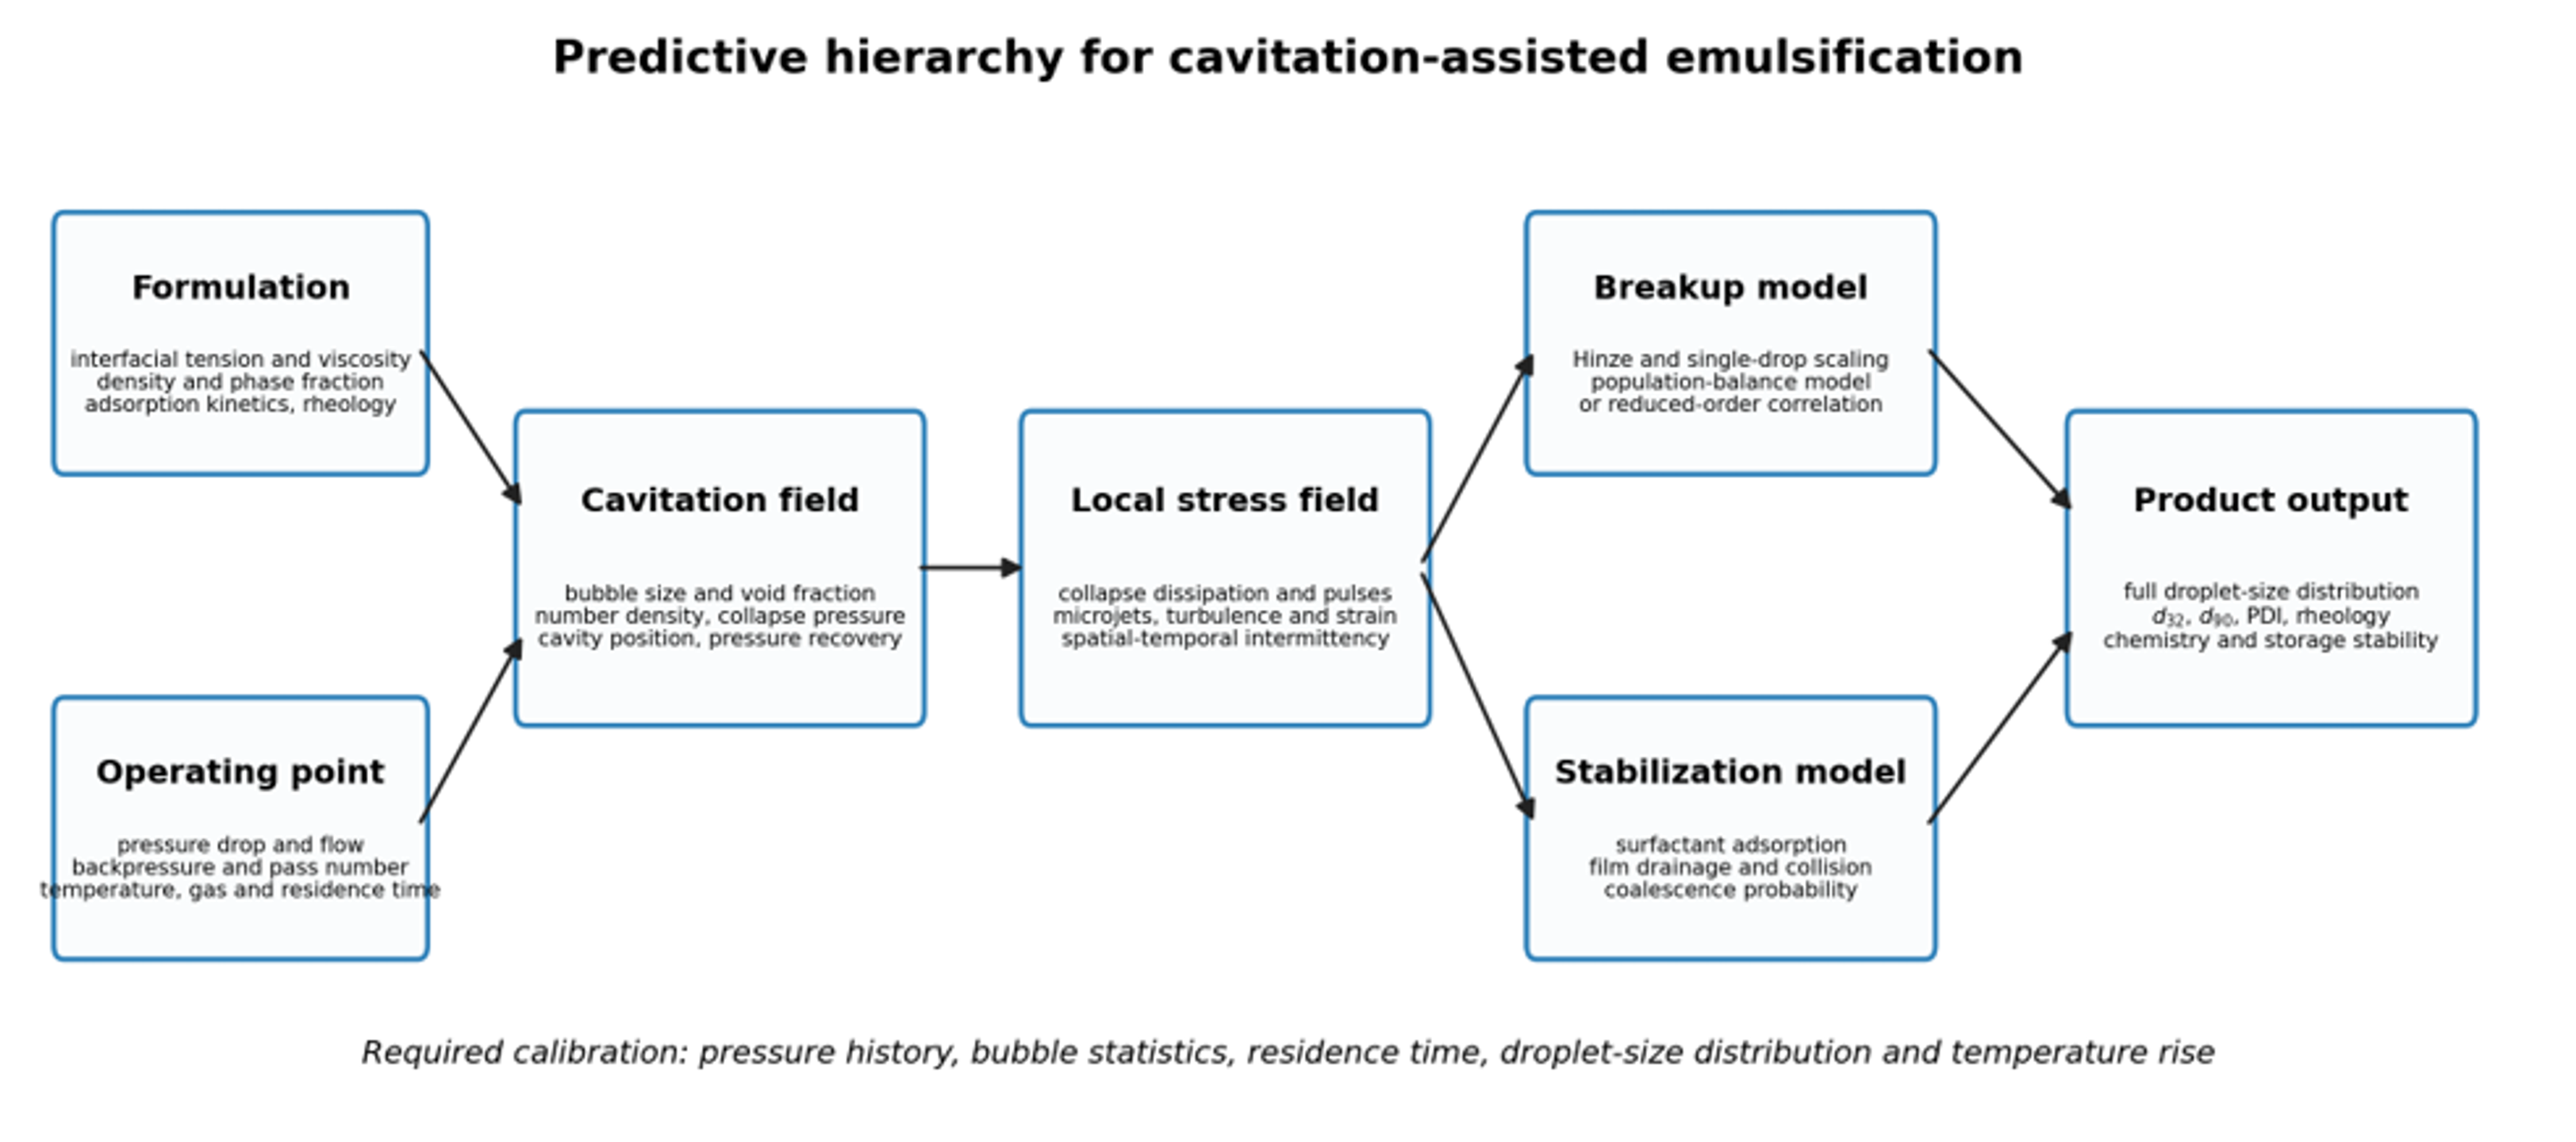
Figure 3. Predictive hierarchy for cavitation assisted emulsification. Formulation and operating inputs determine the cavitation field and local stress distribution; breakup and stabilization models then predict the droplet size distribution and product properties [9].
3 Mechanisms of Hydrodynamic Cavitation Emulsification
3.1 Cavitation inception, growth, and collapse
Hydrodynamic cavitation begins when local static pressure falls sufficiently close to or below the vapor pressure of the liquid. Nuclei grow into vapor filled or gas and vapor cavities in a low pressure region, then travel into a pressure recovery zone. Condensation and collapse produce pressure waves, liquid microjets near interfaces, and strong local velocity gradients [5,6,15–17]. A bubble collapsing near the interface between two liquids can deform the interface, strip ligaments, and fragment a parent droplet. A collapse far from any droplet may contribute mostly to heat, sound, and bulk mixing. The probability of spatial encounter is therefore a core variable, even when it is not measured directly.
The conventional cavitation number is:
where is a defined recovered downstream pressure, is vapor pressure at the operating temperature, and is the throat or reference velocity. Lower values usually indicate a lower pressure margin and stronger cavitation, but the optimum is device and formulation specific. Values reported by different laboratories cannot be compared unless pressure taps, velocity definitions, dissolved gas content, temperature, and geometry are equivalent. Some historical cone mixer studies used a different cavitation index referenced to cavitation inception. Those values are retained as reported but should not be equated numerically with Equation (9).
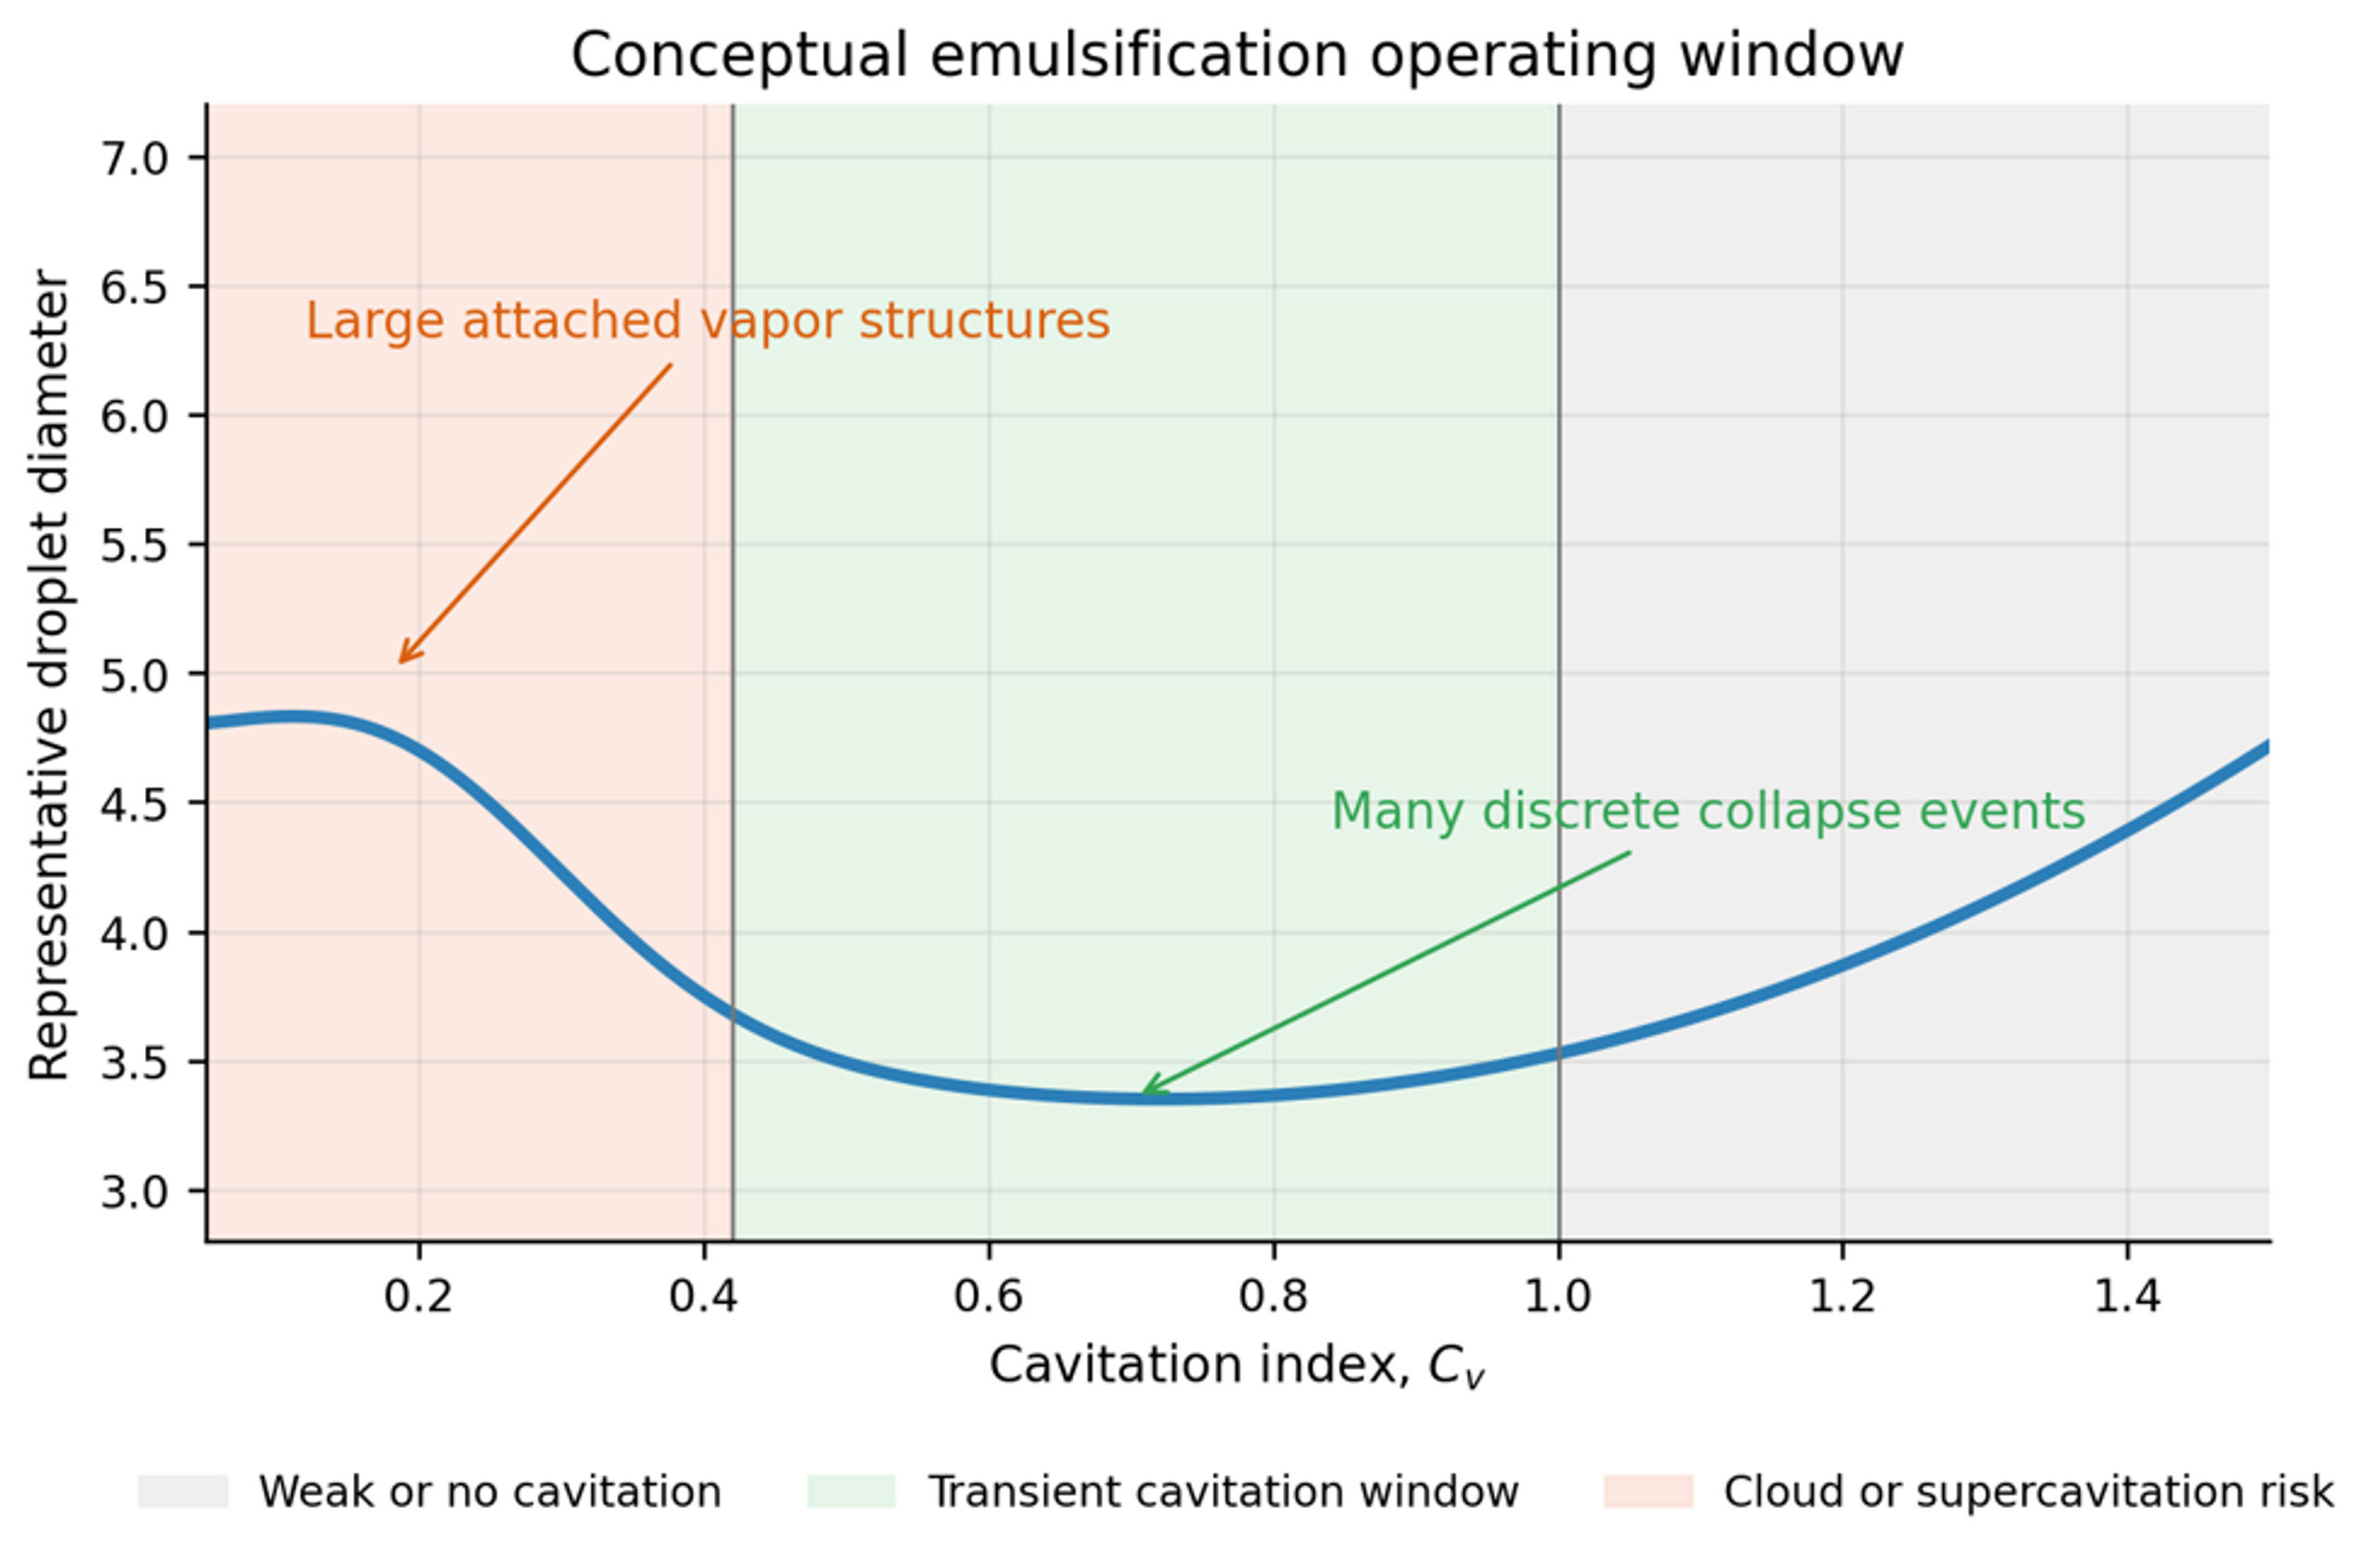
Figure 4. Conceptual operating window. Droplet size may pass through a minimum as cavitation progresses from inception to a field of many transient cavities and then to large, attached vapor structures [9].
The visually largest cavity is not necessarily the most useful emulsification state. In a transient regime, many bubbles can collapse separately in the recovery zone. In a supercavitating or choked state, a large, attached vapor region can reduce the number of discrete collapse events, redistribute pressure recovery, and increase gas or vapor shielding. The optimum is therefore device and formulation specific and should be identified from product response, pressure signals, temperature, and flow behavior rather than from visual intensity alone [3,5–7,18,19].
3.2 Dimensionless breakup criteria
Several dimensionless groups organize the combined effects of inertia, viscosity, interfacial tension, and geometry. The Reynolds number is:
The droplet Weber number is:
The capillary number is:
The Ohnesorge number is:
The viscosity ratio is:
Here is a device length scale, is a characteristic droplet scale velocity difference, and is a shear rate. The capillary restoring pressure of a spherical droplet is:
Breakup becomes probable when a disruptive stress exceeds capillary and viscous resistance. A compact engineering form is:
The critical value is not universal because deformation history, surfactant mobility, internal circulation, and stress type differ among shear, extension, turbulence, and cavity collapse.
Table 3. Dimensionless groups and their use in hydrodynamic cavitation emulsification.
| Group | Expression | Main role | Caution |
|---|---|---|---|
| Cavitation number | Pressure margin for cavity formation | Definition and pressure tap location must be stated | |
| Reynolds number | Ratio of inertia to viscosity | Does not describe local collapse intermittency | |
| Weber number | Inertial stress relative to capillarity | Choice of local velocity is model dependent | |
| Capillary number | Viscous shear relative to capillarity | More useful in viscous or extensional regions | |
| Ohnesorge number | Internal viscous resistance | Changes as droplets become smaller | |
| Viscosity ratio | Internal circulation and deformation | Temperature can change both viscosities strongly | |
| Euler number | Device pressure loss relative to inertia | Not a cavitation intensity measure by itself |
3.3 Turbulent, extensional, and collapse induced stresses
In the inertial subrange of locally isotropic turbulence, the characteristic stress acting across a droplet of diameter may be written:
where is the local turbulent energy dissipation rate per unit mass. Balancing turbulent stress with capillary pressure gives the Kolmogorov and Hinze estimate for the maximum stable diameter [12,20–22]:
where is an empirical constant that depends on the flow and criterion used. The smallest turbulent length scale is:
where is the kinematic viscosity. When droplets approach or fall below , viscous range deformation and local strain become more relevant than inertial subrange scaling. Cavitation adds a second, highly intermittent stress population. For this reason, a model based only on a reactor average can reproduce overall trends yet miss device to device differences created by collapse location and probability.
The active exposure of a fluid element is often summarized by the residence time:
where is the active or nominal reactor volume and is volumetric flow. For recirculation systems, the average hydraulic power is:
and the specific hydraulic energy delivered in one pass is:
The ideal number of passes through a recirculating loop over processing time is:
where is the batch or loop inventory. Actual exposure is distributed because of mixing in the tank, bypassing, and residence time dispersion. These equations are useful for energy accounting, but they do not identify how much energy is deposited in the effective cavitation region.
3.4 Bubble collapse energetics
The radial dynamics of an isolated spherical cavity in an incompressible liquid are commonly represented by the Rayleigh and Plesset equation:
where is bubble radius, is internal bubble pressure, is the far field pressure, and is liquid vapor surface tension. Compressibility, heat and mass transfer, noncondensable gas, nearby walls, neighboring bubbles, and nonspherical collapse require more advanced models. For an empty spherical cavity collapsing under constant pressure difference , the Rayleigh collapse time is approximately:
A simple pressure volume work estimate for collapse from to is:
For complete collapse, , the corresponding average collapse power is:
If the affected liquid mass is approximated by the liquid occupying the initial bubble volume,
then the local specific dissipation estimate is:
Equation (29) is a local idealization, not a reactor average energy balance. It shows why small collapse length scales and high recovery pressure can create very high instantaneous dissipation, while the total energy assigned to useful droplet breakup remains a small fraction of pump power. It also clarifies why a large, attached cavity at low collapse pressure may be less useful than many smaller cavities collapsing under a stronger pressure recovery [3,4,23].
4 Mathematical Models of Cavitation Assisted Emulsification
4.1 Modeling hierarchy and required data
No single model captures all scales from pump and piping hydraulics to nanometre scale interface rupture. A practical hierarchy begins with hydraulic calculations, adds a specific device description, applies a droplet breakup and coalescence model, and closes the calculation with surfactant adsorption and product rheology. The model should be chosen according to the available measurements and design question. A correlation may be adequate for selecting pressure and pass number in an established device. New geometry and scale up generally require computational fluid dynamics coupled to population balances or a validated reduced order model [19,24–29].
Table 4. Model hierarchy for hydrodynamic cavitation emulsification.
| Model level | Main outputs | Required inputs | Appropriate use | Main limitation |
|---|---|---|---|---|
| Hydraulic balance | Flow, pressure drop, residence time, energy | Geometry, pump curve, fluid properties | Preliminary sizing and utility estimate | No droplet prediction |
| Dimensionless correlation | Cavitation number, Weber number, expected diameter trend | Pressure, velocity, interfacial tension, density | Operating window screening | Device specific constants |
| Kolmogorov and Hinze model | Maximum stable diameter | Local energy dissipation and interfacial properties | Turbulent breakup estimate | Cannot represent collapse intermittency directly |
| Bubble field model | Droplet size from bubble diameter, concentration, and collapse pressure | Bubble statistics, pressure, interfacial tension | Controlled flow cavitation design | Strong simplifying assumptions and difficult bubble measurements |
| Population balance model | Full droplet size distribution | Flow field, breakup and coalescence kernels | Geometry evaluation and distribution prediction | Calibration and computational cost |
| Reduced three population model | Fast approximation of multimodal DSD evolution | Rate constants correlated with energy and composition | Control, scale up screening, digital twin | Coarse representation of the distribution |
| Empirical response surface | Optimum conditions in a tested range | Designed experimental data | Formulation optimization | Poor extrapolation outside the design space |
4.2 Kozyuk and Fedotkin bubble field model
The proposed mathematical model describes flow in cavitation mixers using established approaches to mixing processes and isotropic turbulence [21,22,30]. Its purpose is to relate the maximum stable emulsion droplet size to measurable characteristics of the collapsing bubble field. The model is based on the Kolmogorov and Hinze relation, expressed using the notation adopted in this article:
The central model assumption is that the effective dissipation responsible for breakup is the dissipation associated with cavitation collapse:
Therefore,
The rate associated with a single bubble of initial diameter is represented as:
where is the pressure surrounding the cavity during collapse and is collapse time. For a field of bubbles with size distribution , the total rate is averaged as:
The model approximates the number distribution by a normal form whose integral equals the number of bubbles collapsing per unit mass, :
where is the mean bubble diameter and is the distribution standard deviation. Substitution gives:
with the third moment integral:
Using a parabolic cylinder function representation,
The Rayleigh collapse time based on the mean diameter is:
After substitution and simplification, the collapse field dissipation becomes:
To write the final droplet relation compactly, define a distribution factor:
The maximum stable droplet diameter may then be expressed as:
If bubbles are convected with the liquid and is the number concentration per unit liquid volume, the number per unit mass is:
which gives the final form:
Equations (30) through (44) are useful because they make the design hypothesis explicit: smaller stable droplets are favored by lower interfacial tension, higher collapse pressure, a larger concentration of collapsing bubbles, and a bubble distribution that produces a favorable high order moment. The model also makes clear what must be measured: , , , , and .
The model should be used with several qualifications. The normal distribution is not truncated mathematically and therefore permits negative diameters in principle, although the approximation is acceptable when is sufficiently large. A lognormal or gamma distribution is often more physical. The derivation assigns collapse energy to breakup without an explicit efficiency factor and does not include heat, sound, chemical reactions, wall effects, shielding among bubbles, or the probability that a droplet is close enough to a collapse event. The use of Kolmogorov and Hinze scaling assumes a turbulence like stress balance even though collapse is intermittent. Consequently, Equation (44) is best treated as a physically motivated engineering model that requires calibration against bubble visualization and droplet size measurements for each device family.
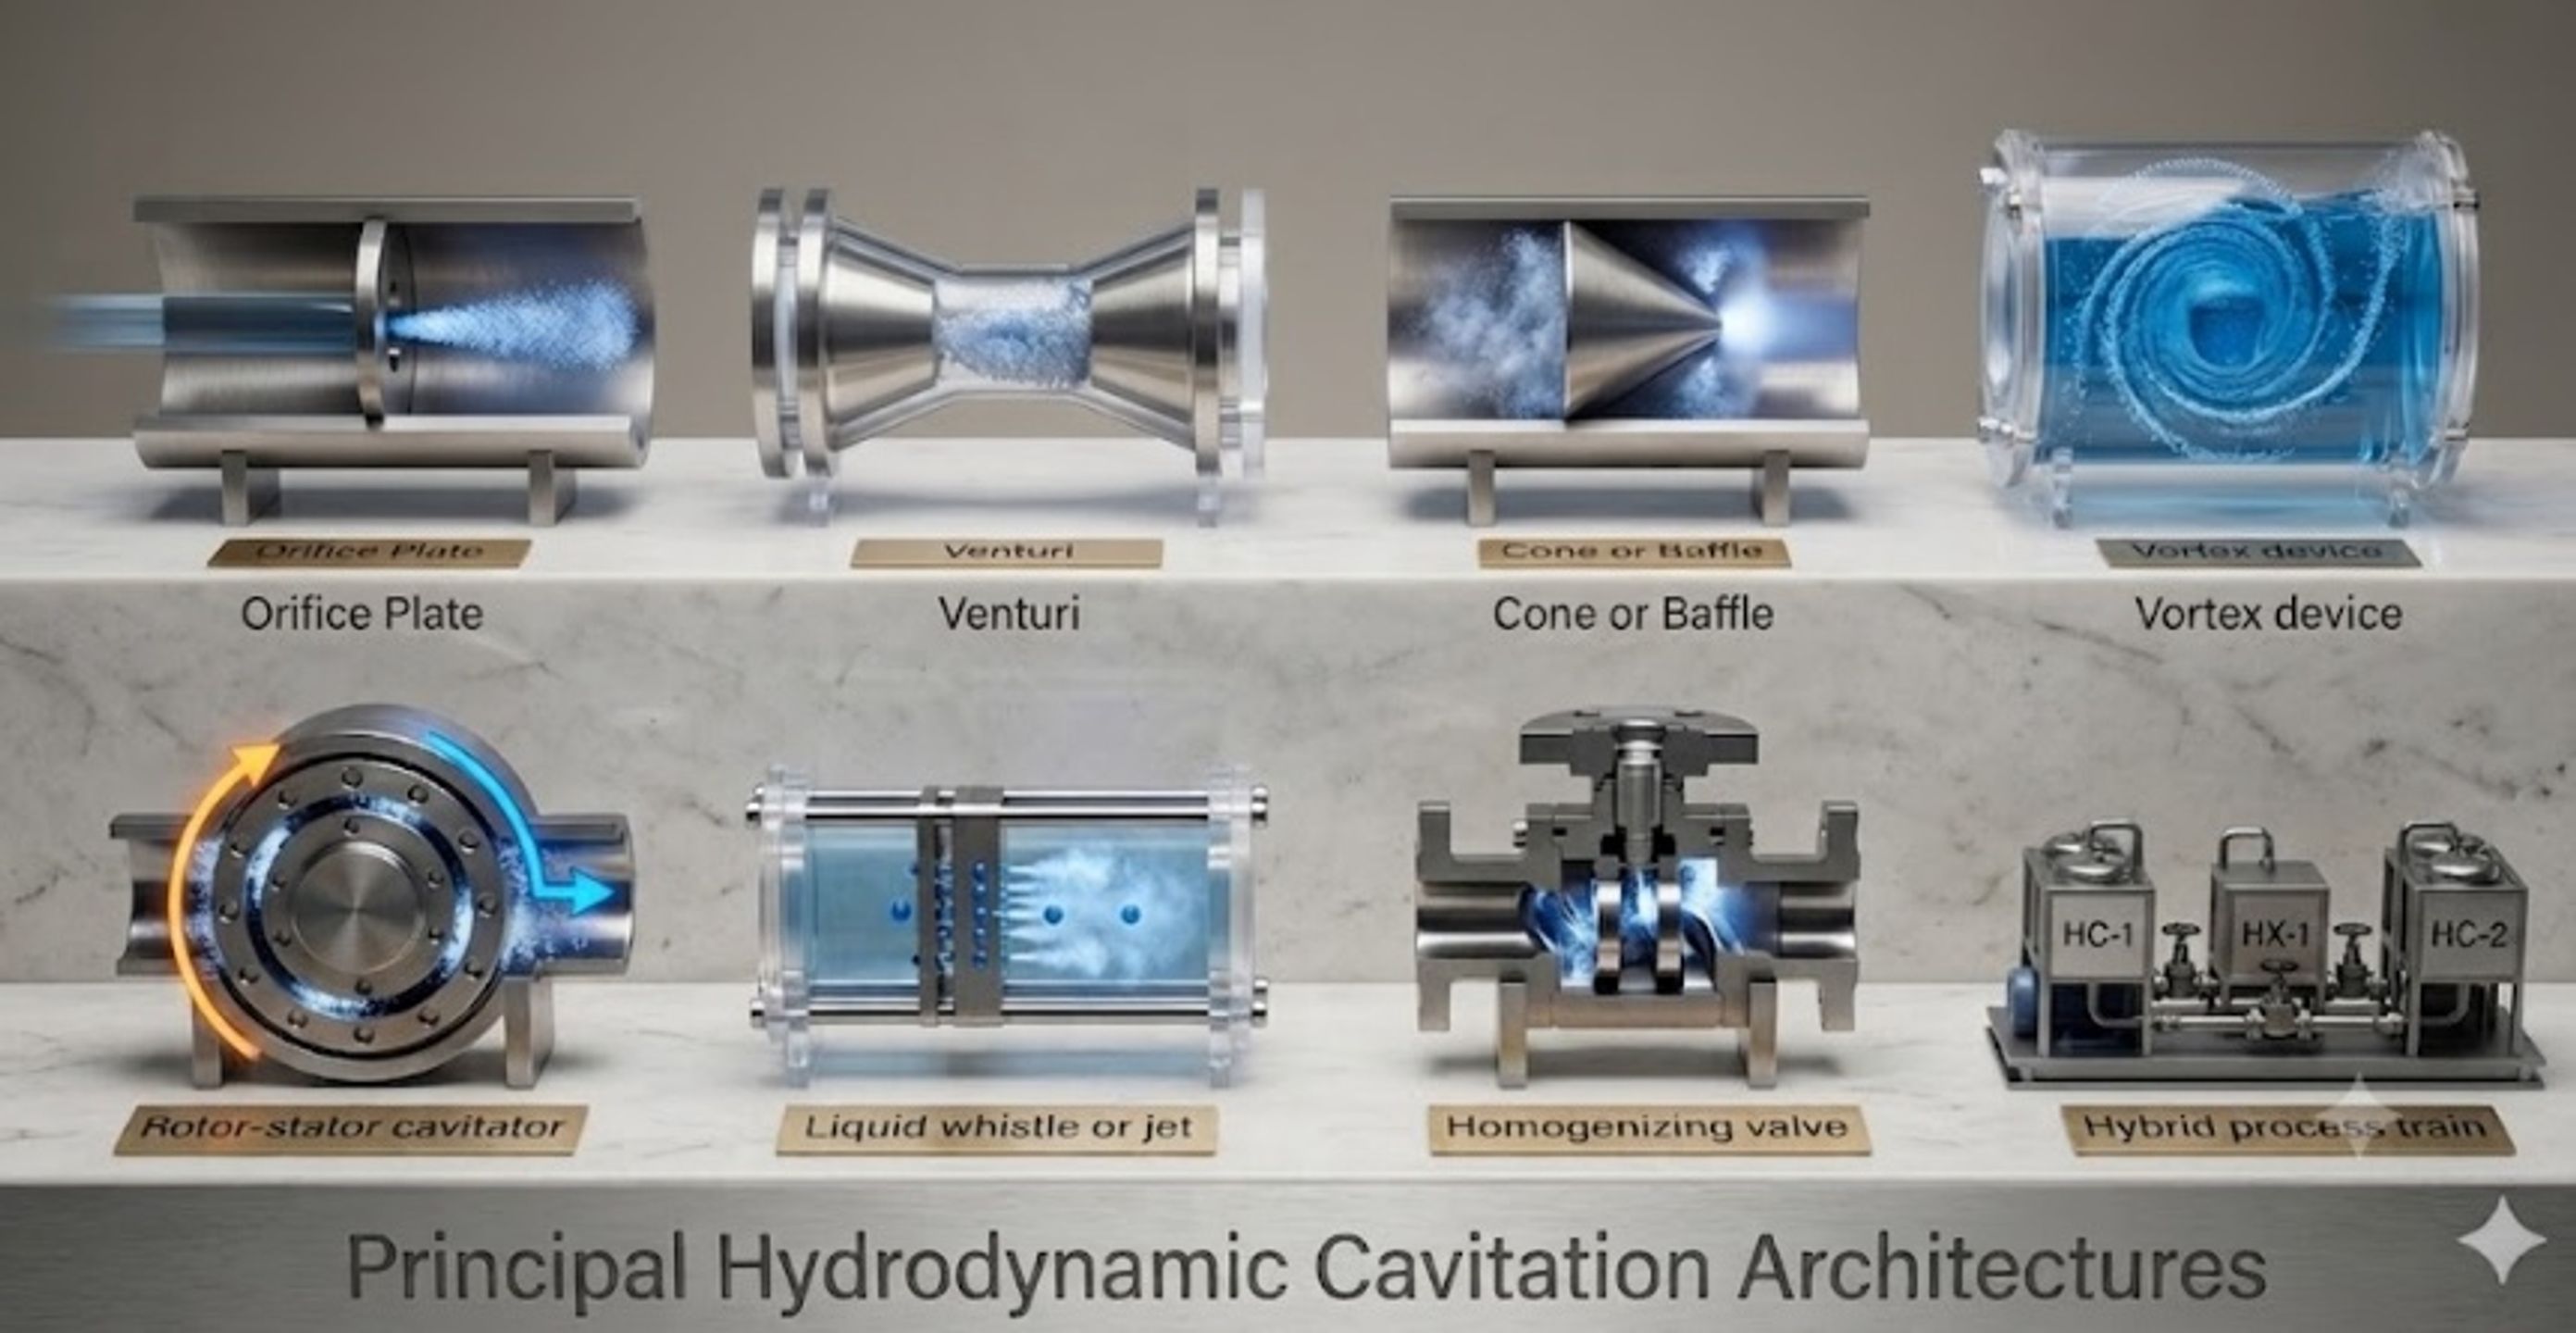
Figure 5. Principal hydrodynamic cavitation architectures used for emulsification and homogenization, including orifice, Venturi, cone or baffle, vortex, liquid whistle, and rotor stator devices [9].
Table 5. Assumptions and validation requirements for the Kozyuk and Fedotkin bubble field model.
| Assumption | Engineering meaning | Likely effect if violated | Recommended validation |
|---|---|---|---|
| Breakup follows isotropic turbulence scaling | Collapse energy is mapped to a Hinze type stress balance | Device specific intermittency may be underrepresented | Compare predicted with measured over pressure and passes |
| Collapse energy dominates effective dissipation | Ordinary shear and extension are secondary | Model may overattribute breakup to cavitation | Run noncavitating pressure drop controls at similar flow |
| Bubble diameters follow a normal distribution | Two parameters describe the bubble field | Skewed and multimodal clouds may change high moments | High speed imaging or optical probes; test lognormal and gamma forms |
| All bubbles are convected with zero slip | Number per mass is | Buoyancy, coalescence, and gas accumulation alter exposure | Measure void fraction and bubble velocity in the active zone |
| A representative collapse pressure exists | One characterizes recovery | Spatial and temporal pressure fluctuations are reduced to one value | Fast pressure transducers and CFD pressure histories |
| Droplet stabilization is instantaneous | Predicted breakup is retained | Recoalescence increases final diameter | Measure adsorption time, surfactant concentration, and post device aging |
4.3 Population balance and reduced order models
A population balance represents the number density of droplets with volume at position and time . A general transport equation is:
where the right hand terms are birth and death by breakup and coalescence. Breakup daughter distributions must conserve dispersed phase volume:
A generic breakup frequency can be written:
where the exponents and function are calibrated to the selected physical model and device. Coalescence is commonly decomposed into collision and film drainage contributions:
Full CFD and population balance calculations can represent spatially varying turbulence, vapor fraction, pressure, residence time, and emulsion rheology, but they remain sensitive to the cavitation model and breakup kernel. Open access numerical studies of cavitating devices and emulsion handling equipment show how geometry, vapor fraction, rheology, and dispersed phase distributions can be connected, although breakup closures remain formulation specific [19,31,32]. Recent open access single drop and turbulence studies provide complementary information for selecting breakup sub models [25–27].
A reduced model can represent the distribution by three droplet populations associated with low, medium, and intense stress zones. The following compact equations are an engineering representation inspired by open access reviews of stochastic breakup and by reduced order continuous emulsification modeling [27,28]:
where is dispersed phase volume fraction in population and are transfer rates caused by breakup. A volume fraction weighted Sauter mean can be reconstructed from representative diameters :
This representation preserves interpretability and is fast enough for optimization or control. It does not replace a full PBM when a detailed continuous distribution, coalescence, or multimodal daughter distribution is required.
Experiments with dense rapeseed oil emulsions in a vortex cavitation device found that the Sauter mean diameter decreased approximately with pass number as [24]:
and the reported droplet breakage efficiency decreased with specific energy as:
The negative energy exponent reflects diminishing returns: the largest droplets are disrupted first, while further reduction requires increasingly rare or intense events. The constants are formulation and device specific and should not be transferred without validation.
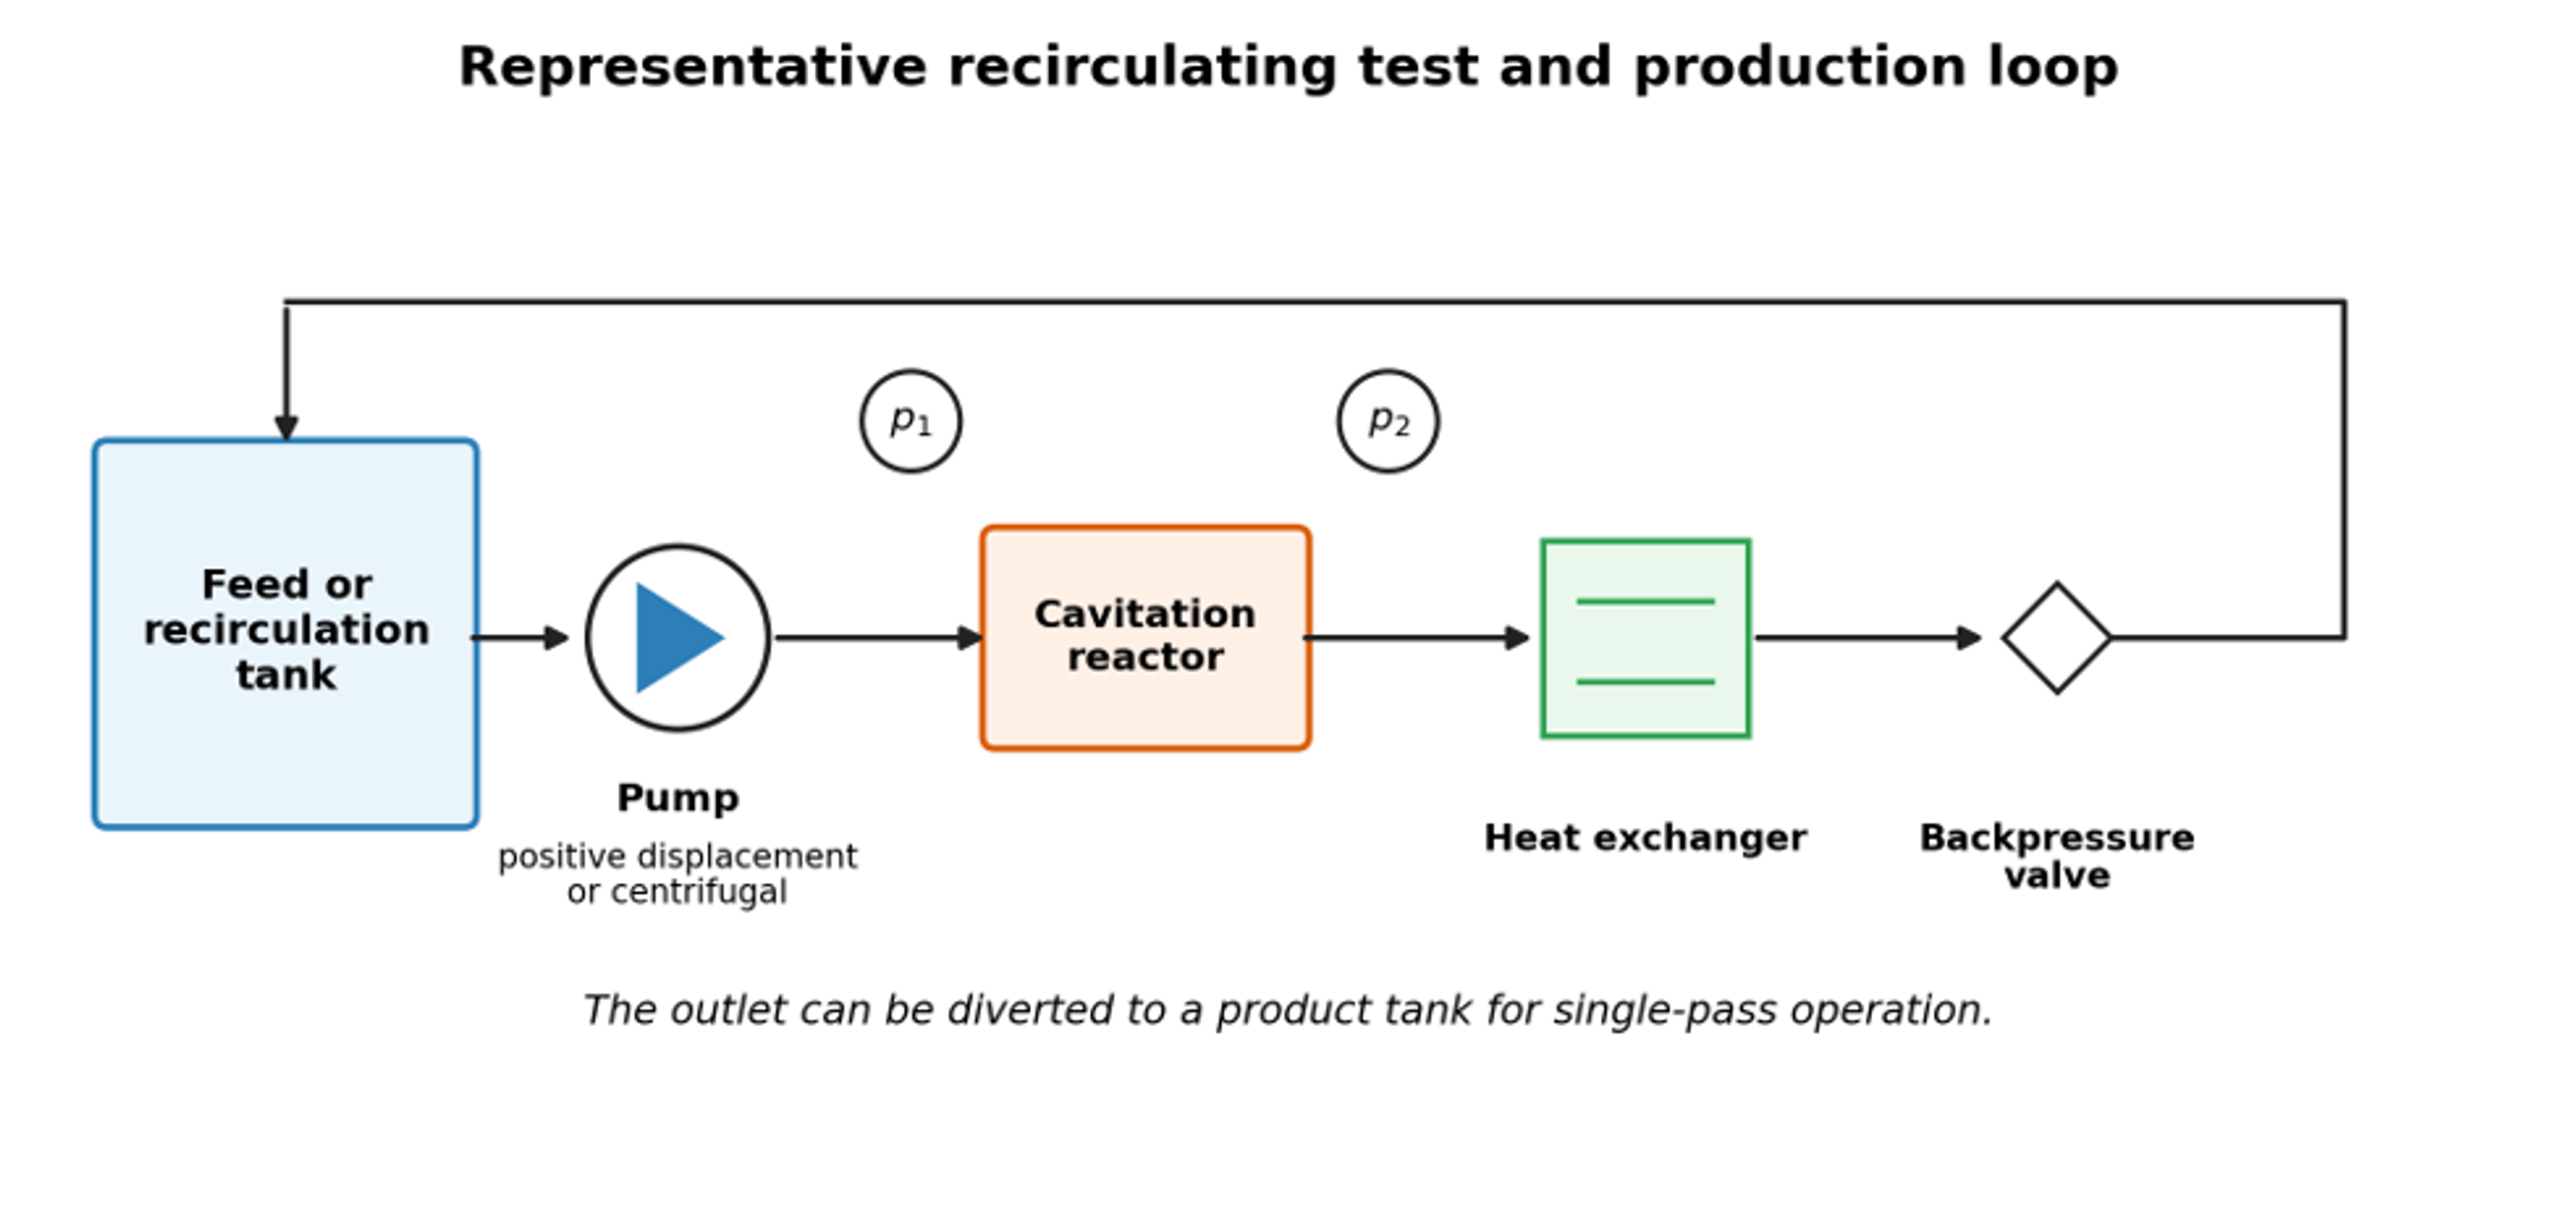
Figure 6. Representative recirculating test and production loop. Backpressure controls the recovery field; the same loop can be operated in recirculation or single pass mode [9].
4.4 Interfacial stabilization and recoalescence
The minimum surfactant mass needed to cover a newly created area is:
where is the saturated surface excess. Coverage kinetics may be approximated by:
where is fractional coverage, and are adsorption and desorption coefficients, and is surfactant concentration in the continuous phase. A useful stabilization ratio is:
where is the time between interface creation and a significant collision or exit from the active zone, and is the characteristic adsorption time. When , coverage is comparatively fast. When , breakup may be followed by rapid recoalescence. Proteins and polymers often adsorb more slowly than small molecule surfactants, so identical cavitation conditions can produce different final sizes even at similar equilibrium interfacial tension.
For process comparison, net interface generated per specific energy can be written as:
and a thermodynamic emulsification efficiency can be defined as:
A useful comparison therefore reports the product droplet size distribution, newly generated interface, hydraulic work, electrical energy, temperature rise, and pass count together. Open access studies emphasize that the local breakup field and mixing configuration, not nominal power alone, determine the useful outcome [12,13,26,27].
4.5 Worked engineering example: model based hydraulic and interfacial screening
For an illustrative screening calculation, assume a 3 mm circular throat carrying 13.6 L/min of a water continuous premix across a 1.0 MPa pressure drop. These values are hypothetical design inputs used only to demonstrate the calculation sequence. The throat velocity is:
Using water properties near the test temperature, the conventional cavitation number is:
The hydraulic power associated with a 1.0 MPa pressure drop is:
For a hypothetical monodisperse product containing 10 vol% oil at a selected screening diameter of 87 nm, the interfacial area per emulsion volume is:
This is about 6,900 m² per liter of emulsion. If the effective saturated surface excess were 2 mg/m², the theoretical monolayer requirement would be about 13.8 kg/m³ of emulsion. This calculation is only a screening estimate because the product is polydisperse, surfactant partitions between phases, micelles may form, and measured diameter is a scattering mean rather than a monodisperse diameter.
The hydraulic calculation should not be interpreted as a cross technology efficiency claim. Pump and motor efficiency, recirculation, heat removal, surfactant demand, and the fraction of the stream that actually experiences the active collapse zone must be measured before equipment is compared. Figure 7 instead shows how the breakup model responds to local dissipation and interfacial tension.
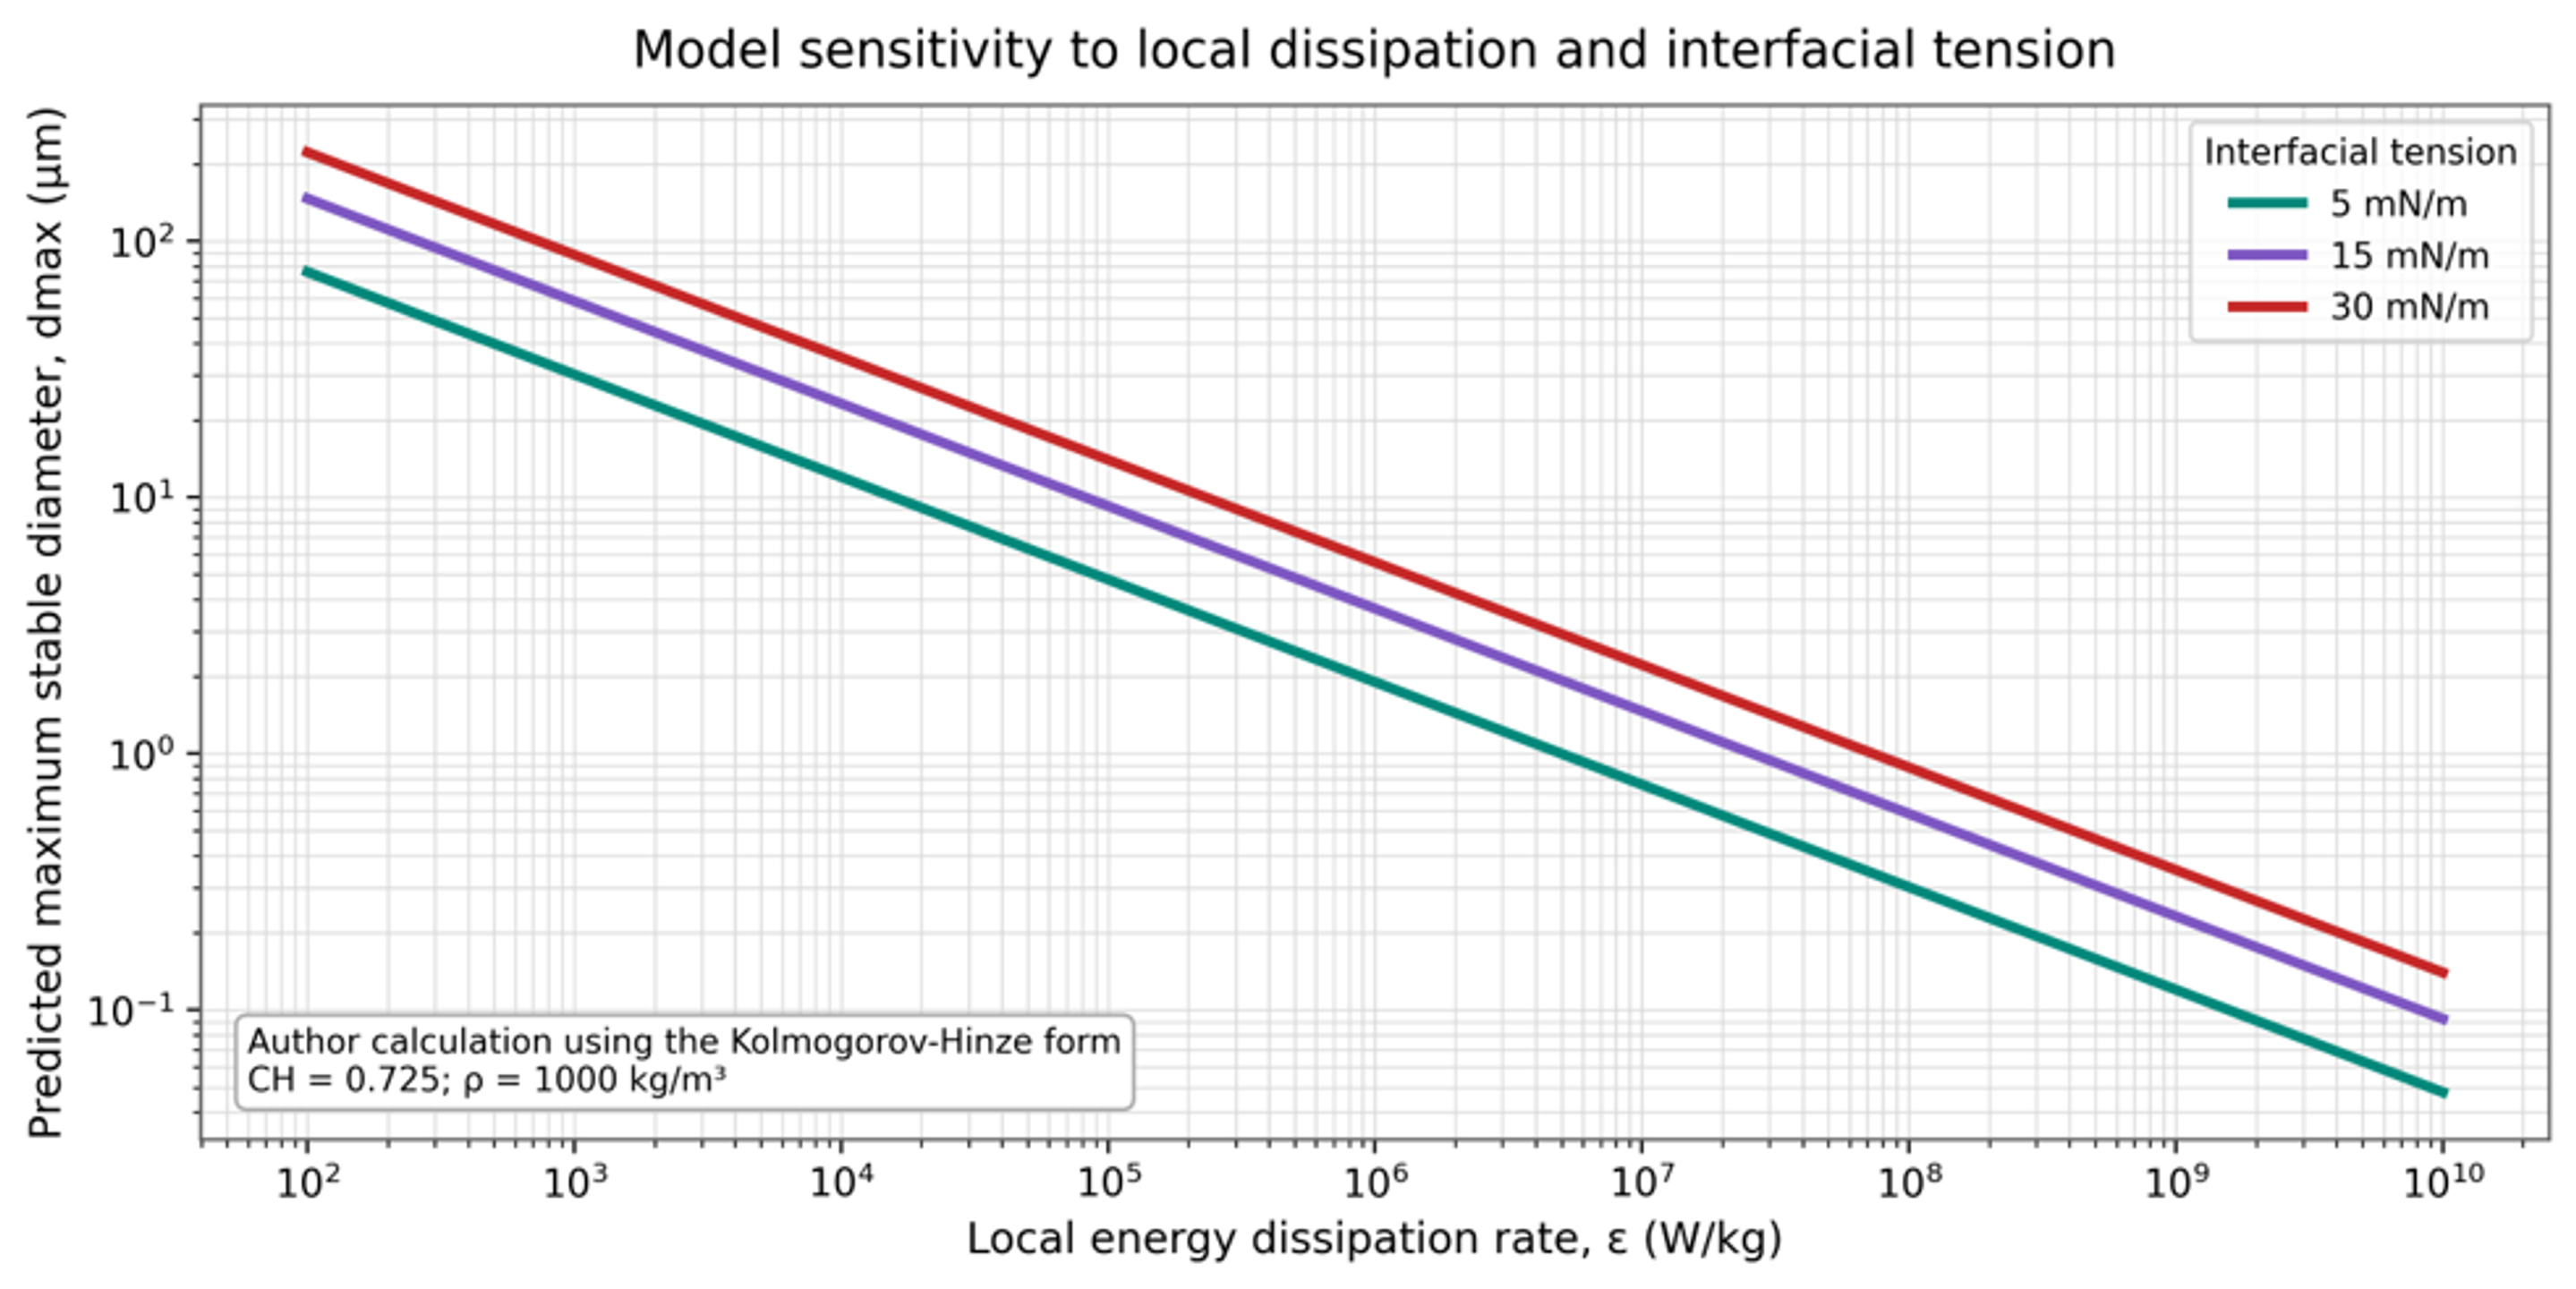
Figure 7. Model sensitivity of maximum stable droplet diameter to local energy dissipation and interfacial tension [9].
5 Equipment and Process Configurations
5.1 Static constriction devices
Static devices create a pressure decrease without moving internal parts. Orifices provide abrupt contraction and expansion, strong jets, and compact construction. Venturis provide smoother acceleration and pressure recovery. Cone, baffle, and nozzle devices offer additional control of the low pressure region and collapse location. Studies show that throat geometry, recovery profile, and cavitation number definition must be assessed together because nominal pressure drop alone does not identify the active breakup field [5–8,19,31,33–35].
Table 6. Hydrodynamic cavitation device families for emulsification and homogenization.
| Device family | Cavitation generation mechanism | Principal control variables | Strengths | Limitations |
|---|---|---|---|---|
| Orifice plate | Jet and vena contracta pressure decrease | Hole number, diameter, area ratio, edge, pressure drop | Simple, low cost, replaceable insert | Clogging, erosion, abrupt recovery, broad residence time distribution |
| Circular Venturi | Smooth acceleration through a throat | Throat diameter, convergent/divergent angles, length, backpressure | Good throughput, controlled recovery | Larger footprint, geometry sensitive cavitation location |
| Slit Venturi | Planar acceleration and shear | Slit width, height, aspect ratio, pressure | High pass rate and strong planar deformation | Narrow slit can be sensitive to solids and fouling |
| Cone or bluff body | Separated cavity behind body | Cone angle, blockage, channel diameter, backpressure | Visual access and controllable attached cavity | Supercavitation can reduce discrete collapse events |
| Vortex device | Low pressure swirling core | Inlet number, chamber aspect ratio, outlet, pressure drop | Open passages, cavitation away from walls, modular | Performance sensitive to swirl stability and droplet trajectory |
| Liquid whistle or jet device | Jet oscillation, impact, and cavitation | Jet velocity, resonator geometry, backpressure | Compact and effective for recirculation | Acoustic and erosion behavior can be geometry dependent |
| Rotor stator cavitator | Periodic cavities and high relative velocity | Rotor speed, gap, holes or grooves, flow, backpressure | Independent speed control and strong combined shear | Moving seals, mechanical complexity, heat, wear |
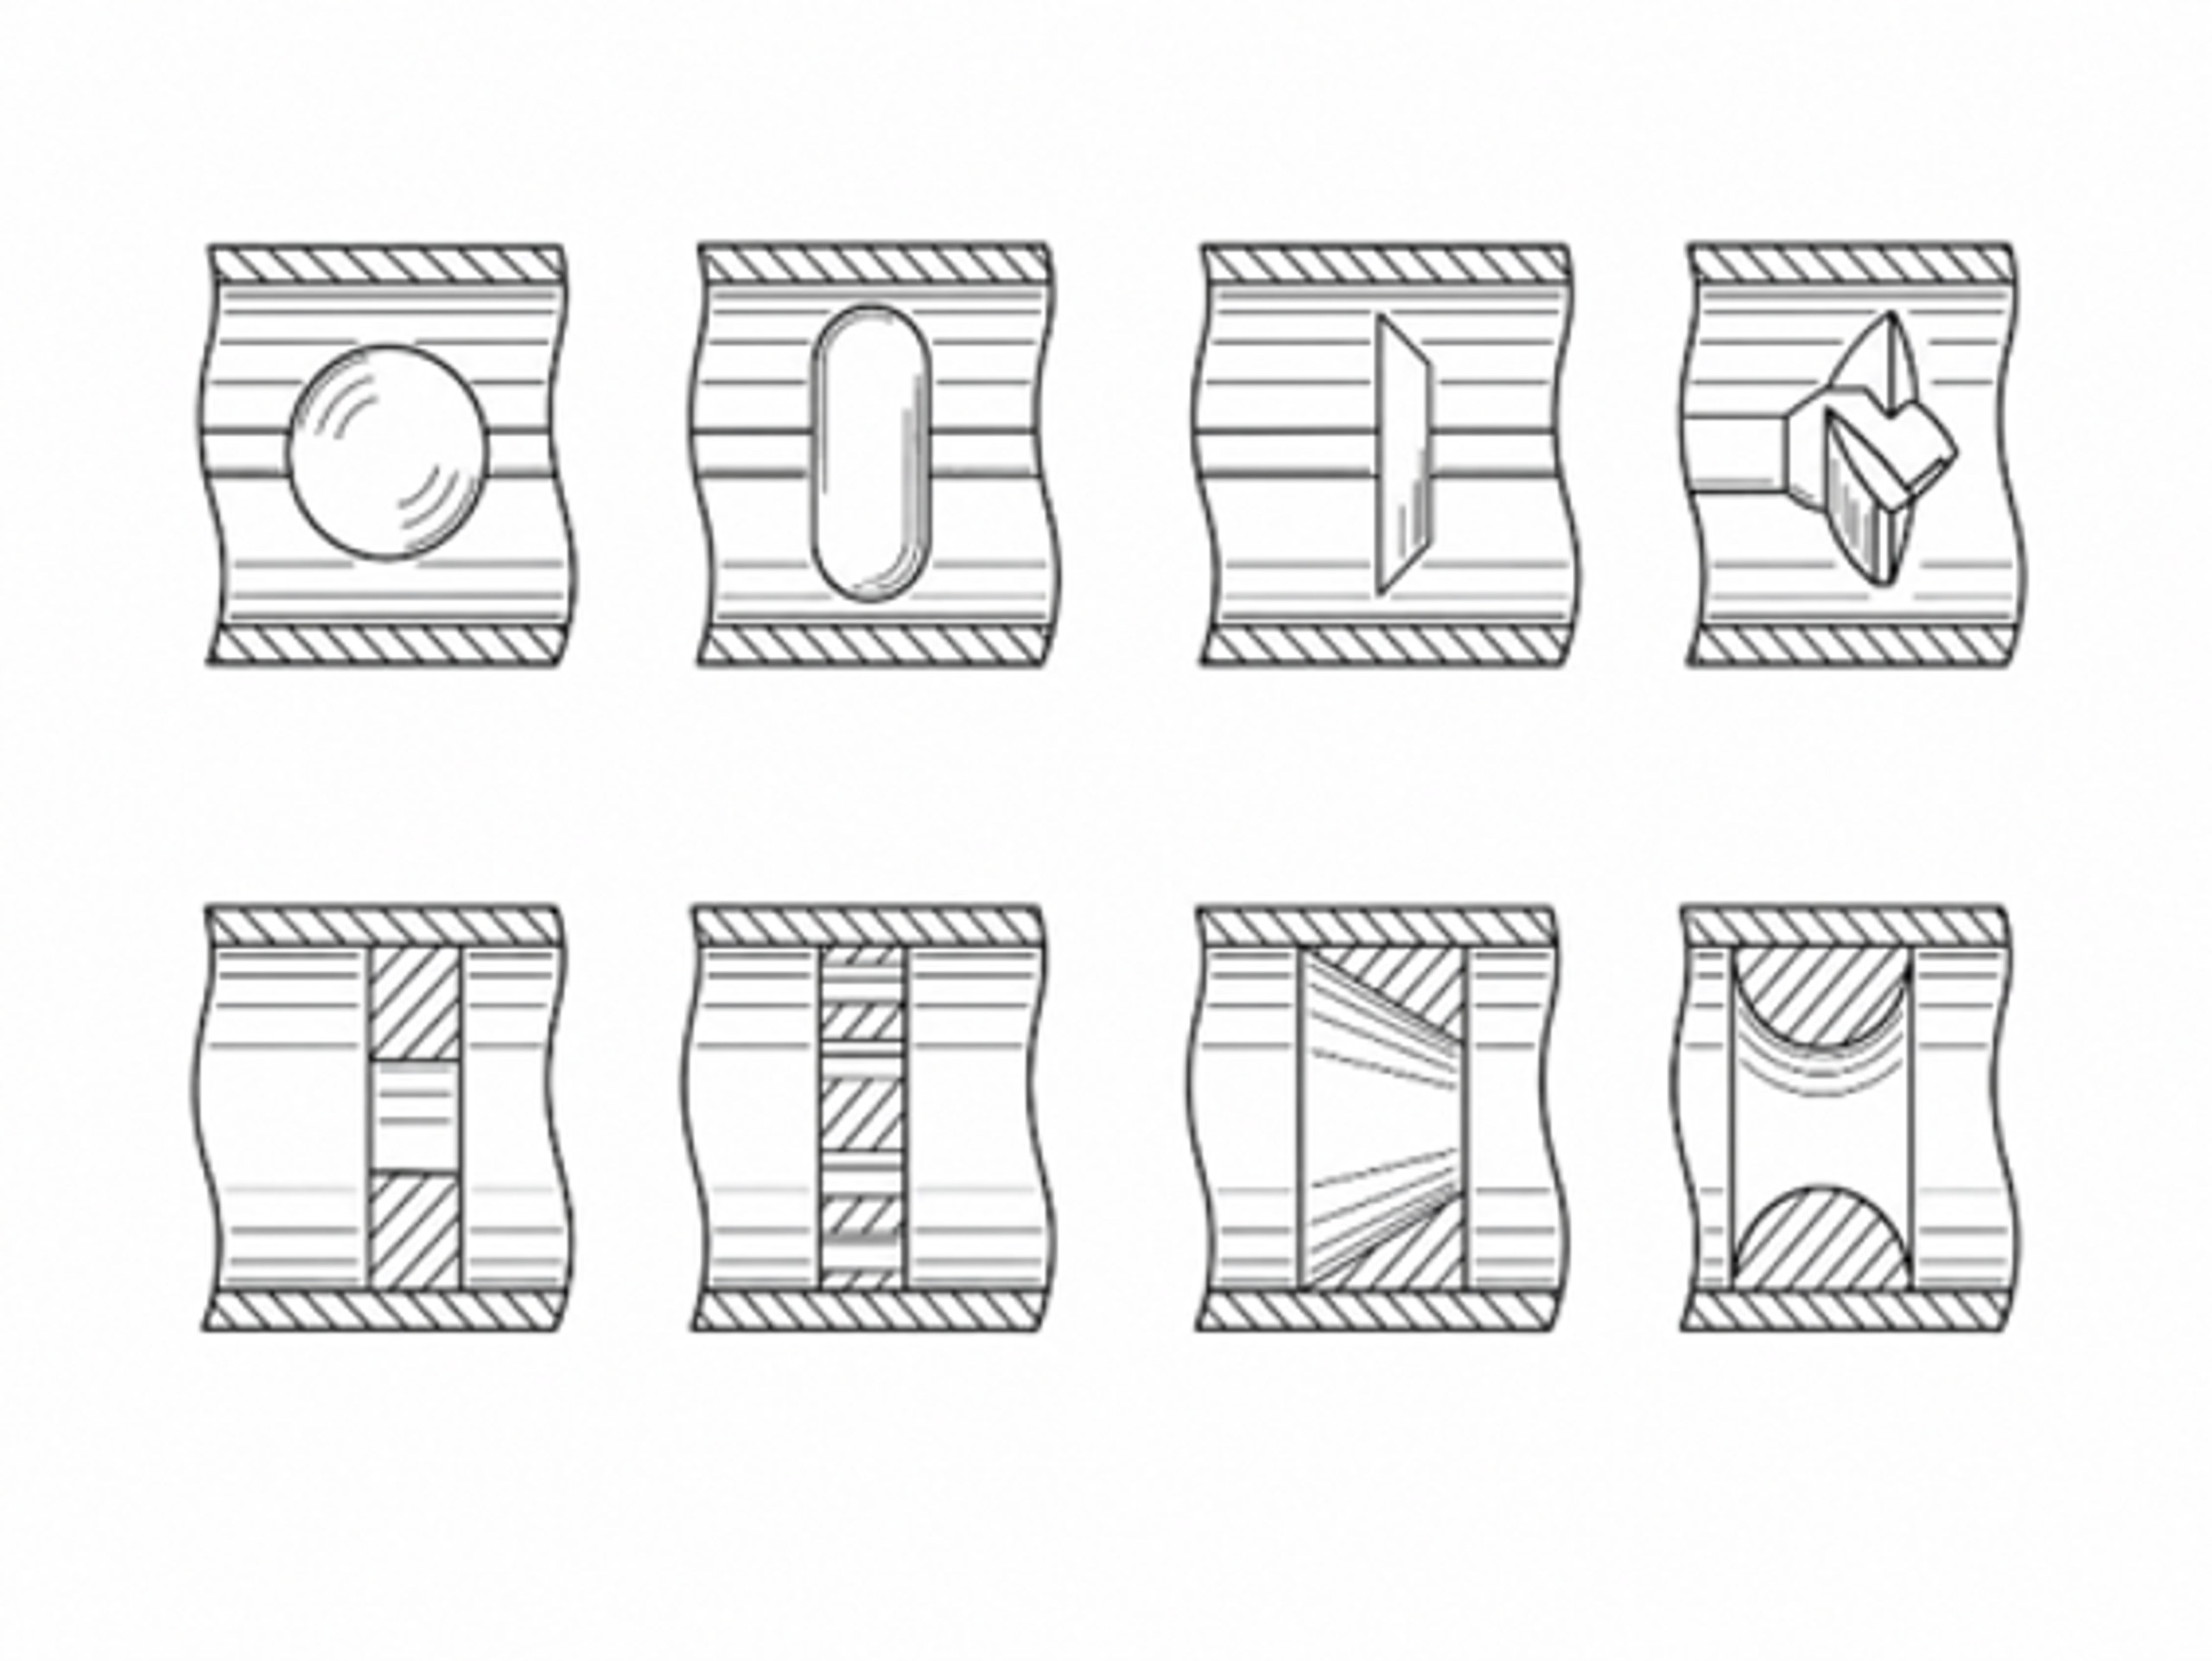
Figure 8. Drawings of controlled flow cavitation devices illustrating inline flow passages and cavitation generating geometries [36].
The Kozyuk patent family illustrates the controlled flow principle: a pressurized stream passes a cavitation generator, cavities form in the low pressure region, and collapse occurs as pressure recovers downstream [36]. The generator shape and recovery chamber are selected to control the bubble field rather than merely maximize pressure loss.
5.2 Vortex based devices
Vortex cavitation devices use tangential inlets to create a rotating flow and low pressure axial core. Cavitation can occur in the bulk fluid away from the wall, which may reduce erosion. The open chamber and millimetre scale clearances are also favorable for streams containing suspended solids or moderate viscosity. Recent studies have varied chamber aspect ratio, inlet number, outlet geometry, scale, and parallel arrangement. An aspect ratio near six was reported as favorable in one design study, while other experiments found that vortex stabilizers and multiple inlets could improve cavitation activity and energy performance, especially at low pressure drop [19,29].
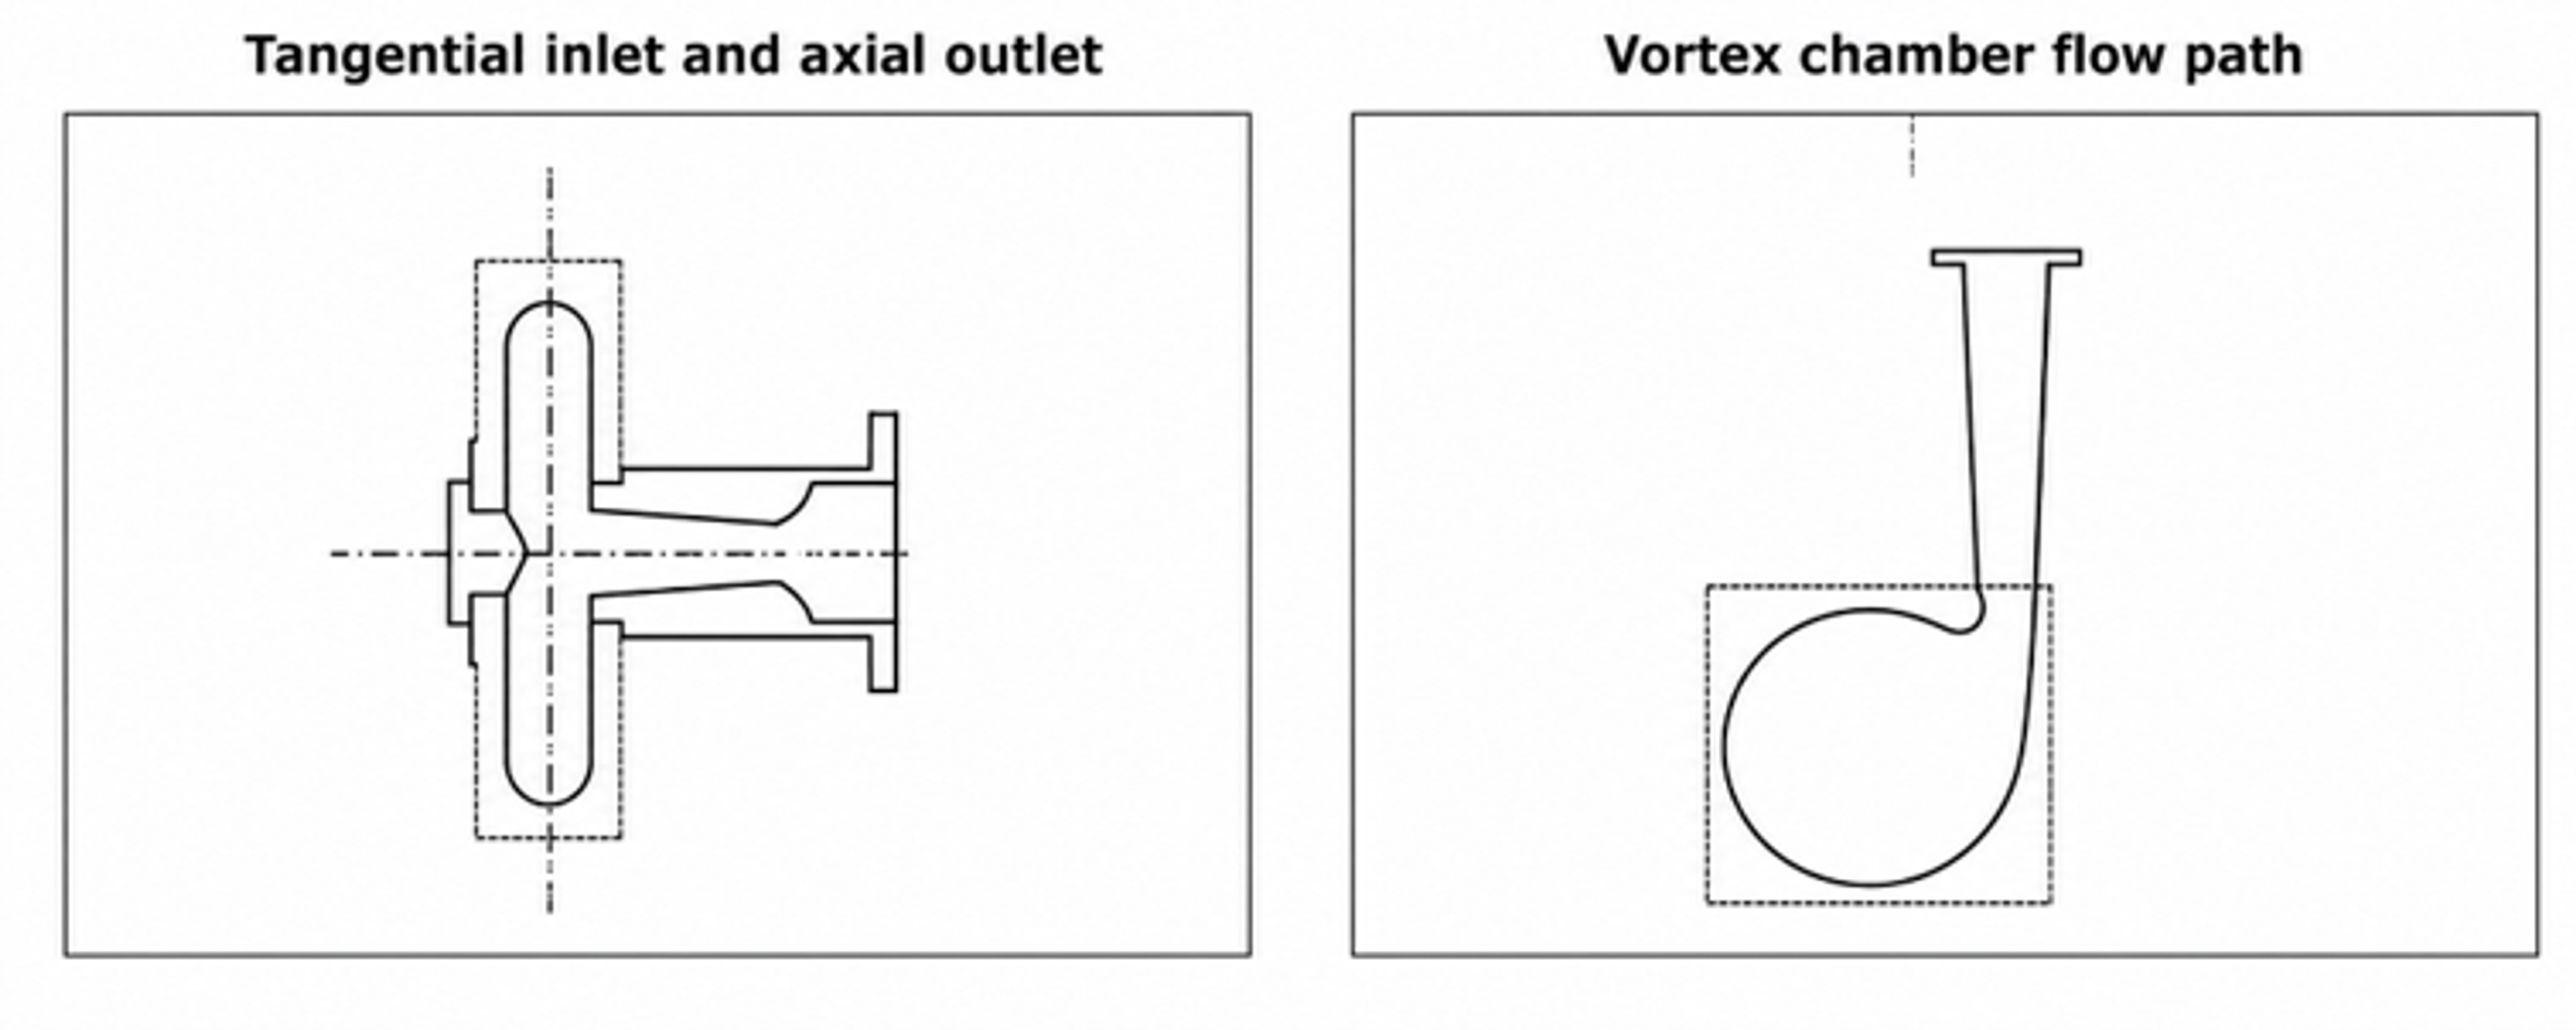
Figure 9. Representative vortex diode cavitation geometry showing a tangential inlet and axial outlet arrangement used to establish a low pressure swirling core [37].
Vortex geometry must be evaluated by both vapor generation and droplet trajectory. A large cavitation region does not guarantee effective emulsification if the dispersed phase bypasses it. This is one reason that CFD models increasingly track water, oil, and vapor phases together and then couple the predicted flow to a PBM [25,29].
5.3 Dynamic rotor stator and rotary cavitation devices
Dynamic devices generate alternating low and high pressure regions by moving cavities, holes, grooves, or blades past a stator. Rotational speed provides a control variable that can be adjusted separately from flow and backpressure. Visualization and CFD of a rotational hydrodynamic cavitation reactor show that hole diameter, hole height, and conical bottom length alter vapor exchange, cavitation area, and vortex intensity [31]. The engineering tradeoff is the addition of seals, bearings, rotor balance, tip speed limits, mechanical heating, and wear.
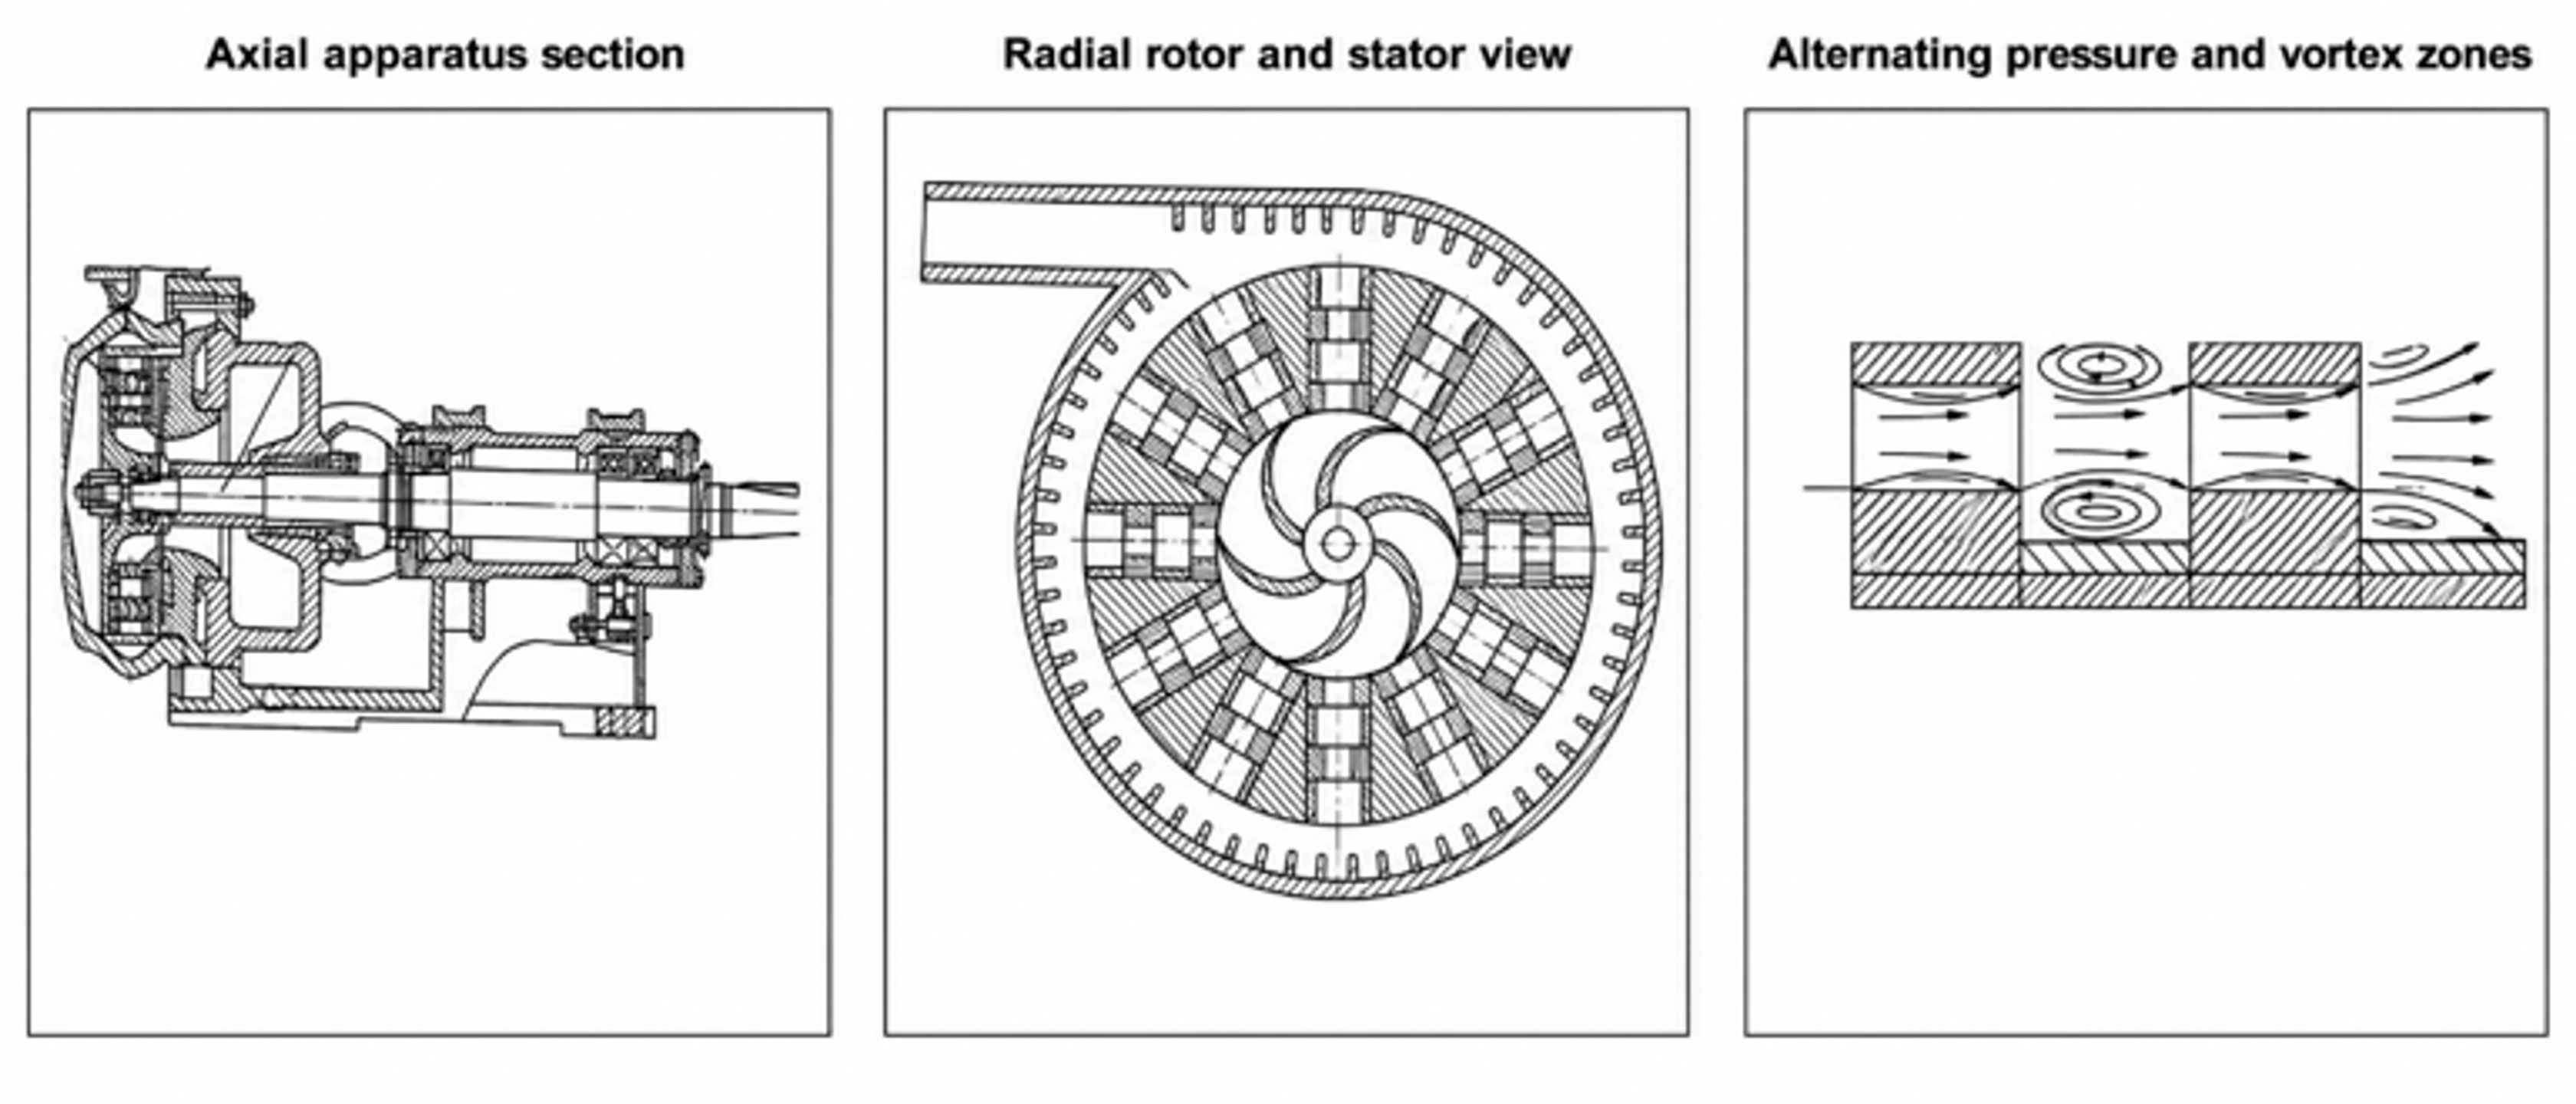
Figure 10. Rotor hydrodynamic cavitation apparatus with perforated or structured rotating elements and stationary housing [38].
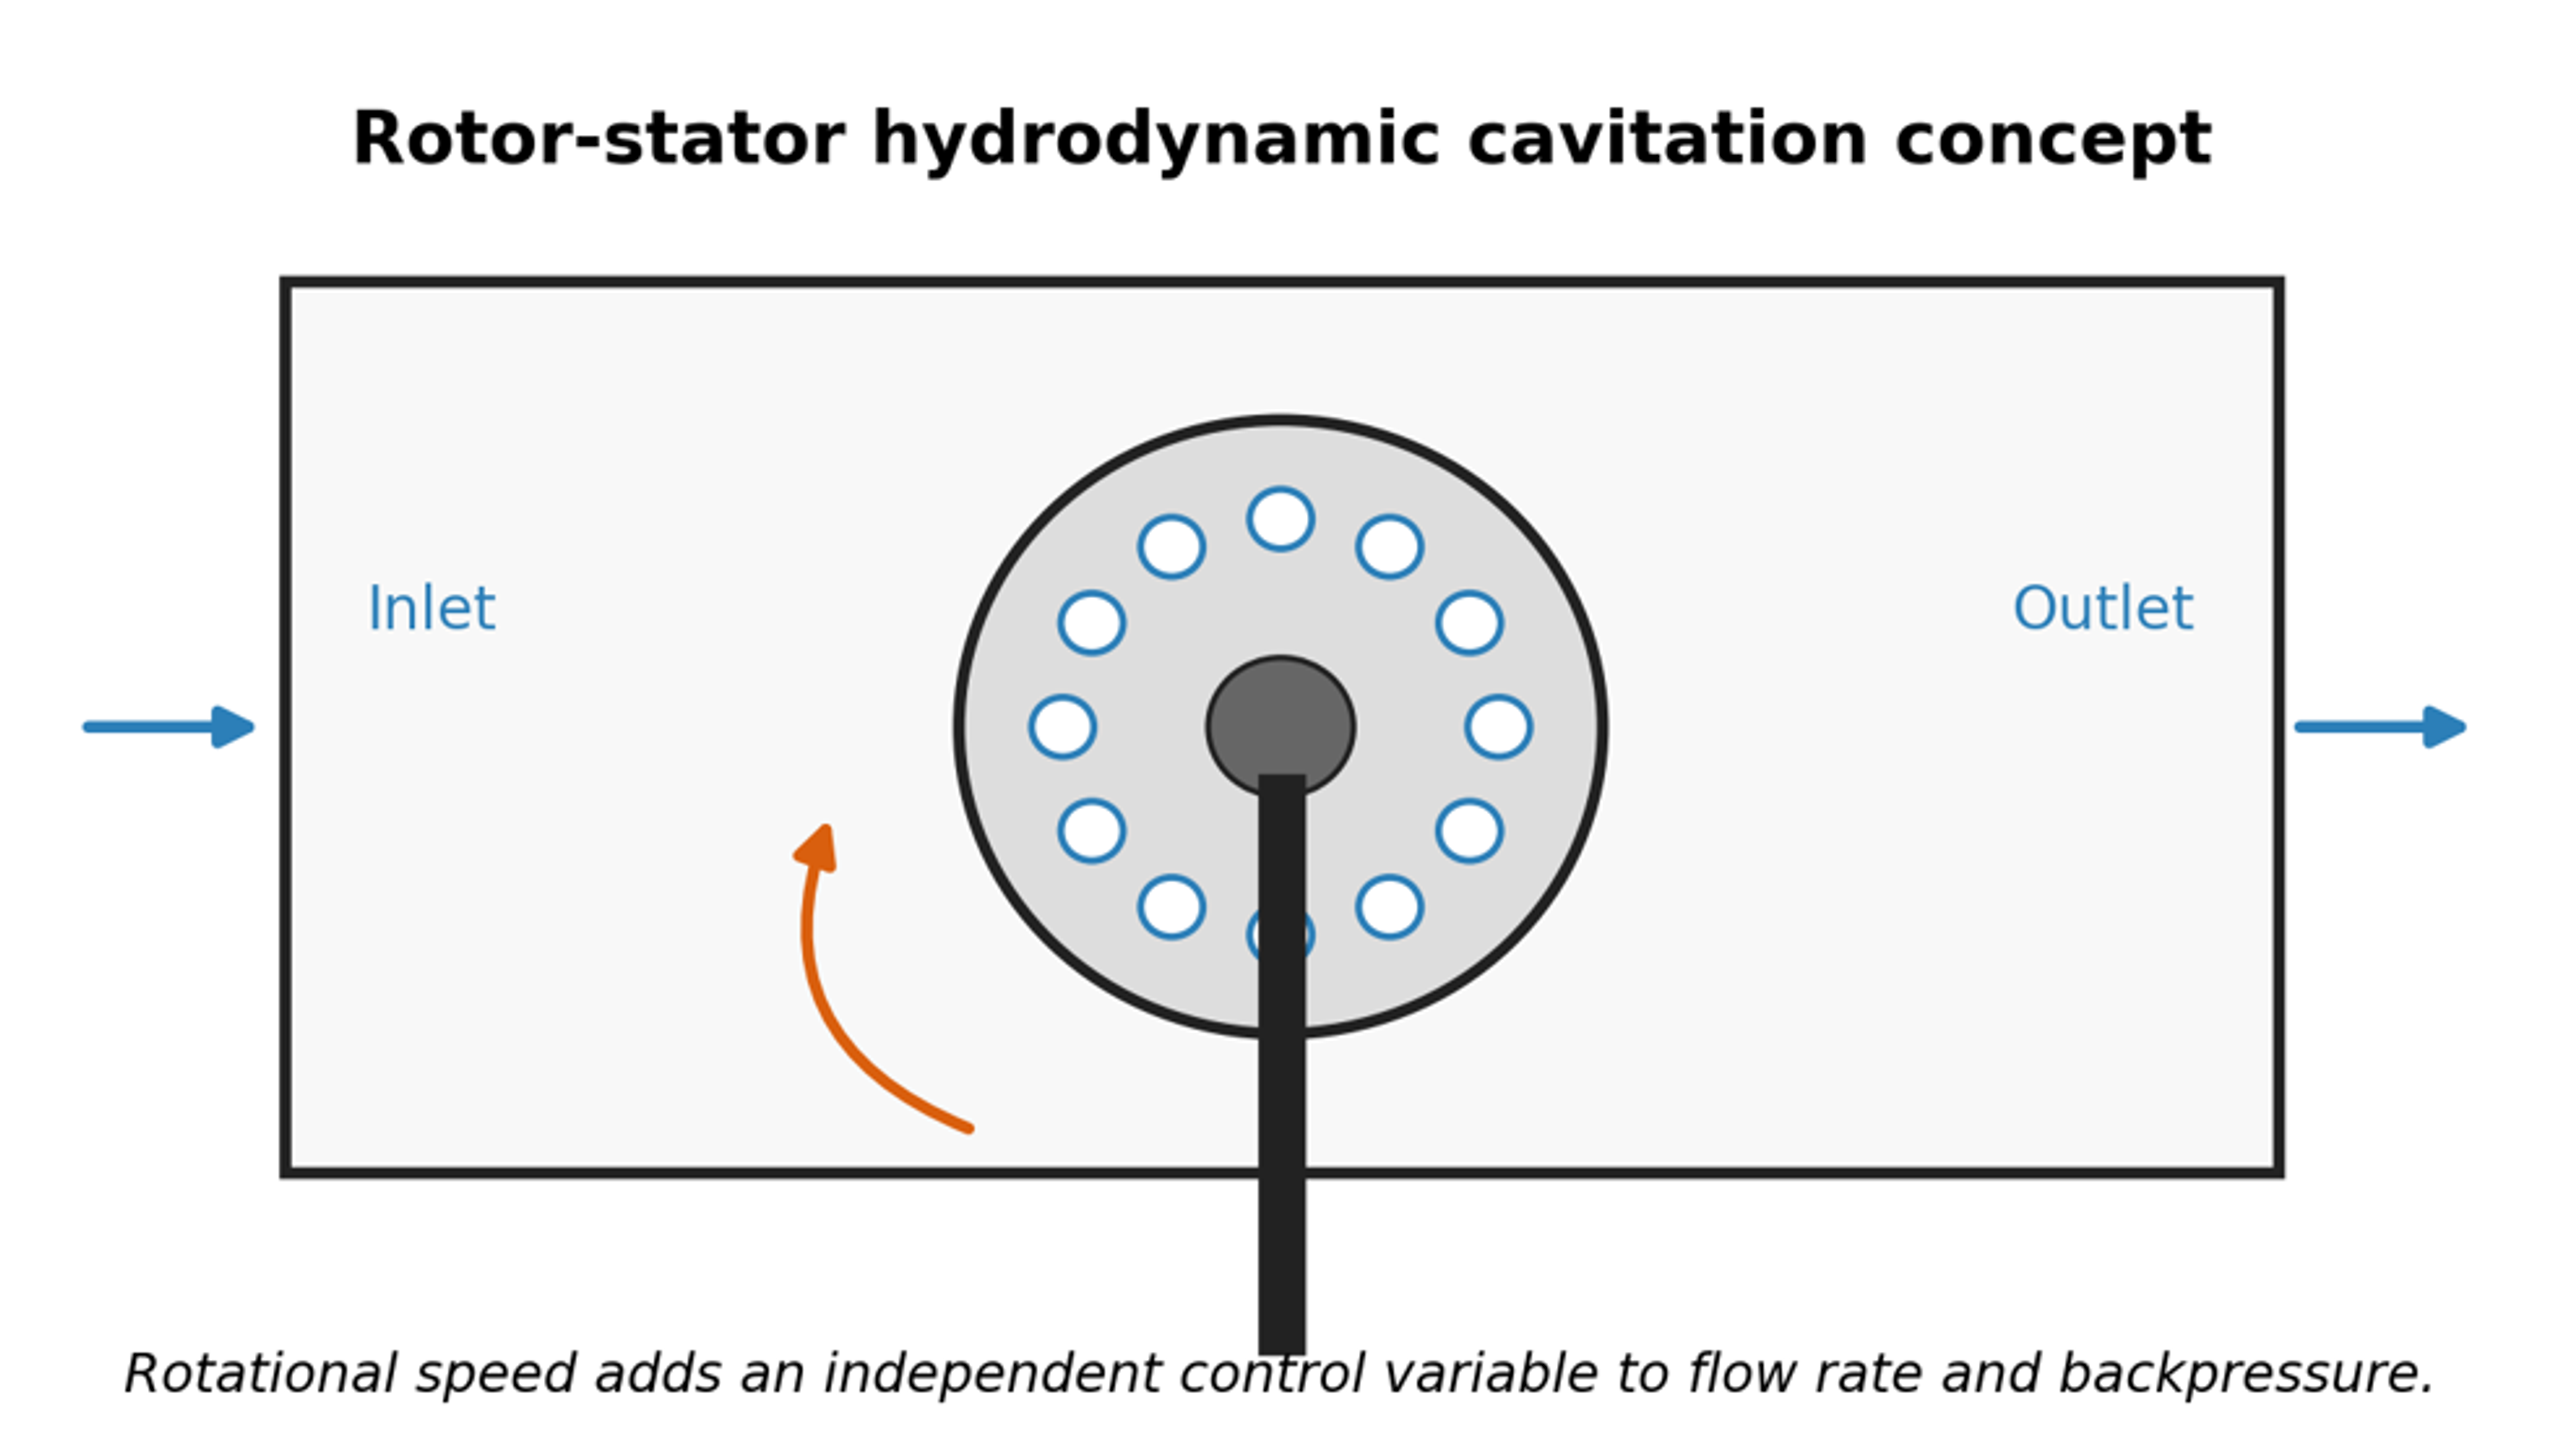
Figure 11. Rotor stator hydrodynamic cavitation concept. Rotation provides an independent variable that can be adjusted separately from flow and backpressure [9].
5.4 Patented food and emulsion process configurations
Patents illustrate how cavitation equipment is integrated into staged industrial processes. The food emulsion patent family represented in Figure 12 uses hydrodynamic cavitation within a controlled process sequence to produce an oil in water food product. Patent examples also cover vortex diodes, inline controlled flow devices, rotor cavitators, and newer hydrodynamic cavitation mixers [36–41]. Patent drawings are useful for identifying process architecture, but performance claims should be confirmed by independent testing with the intended formulation.
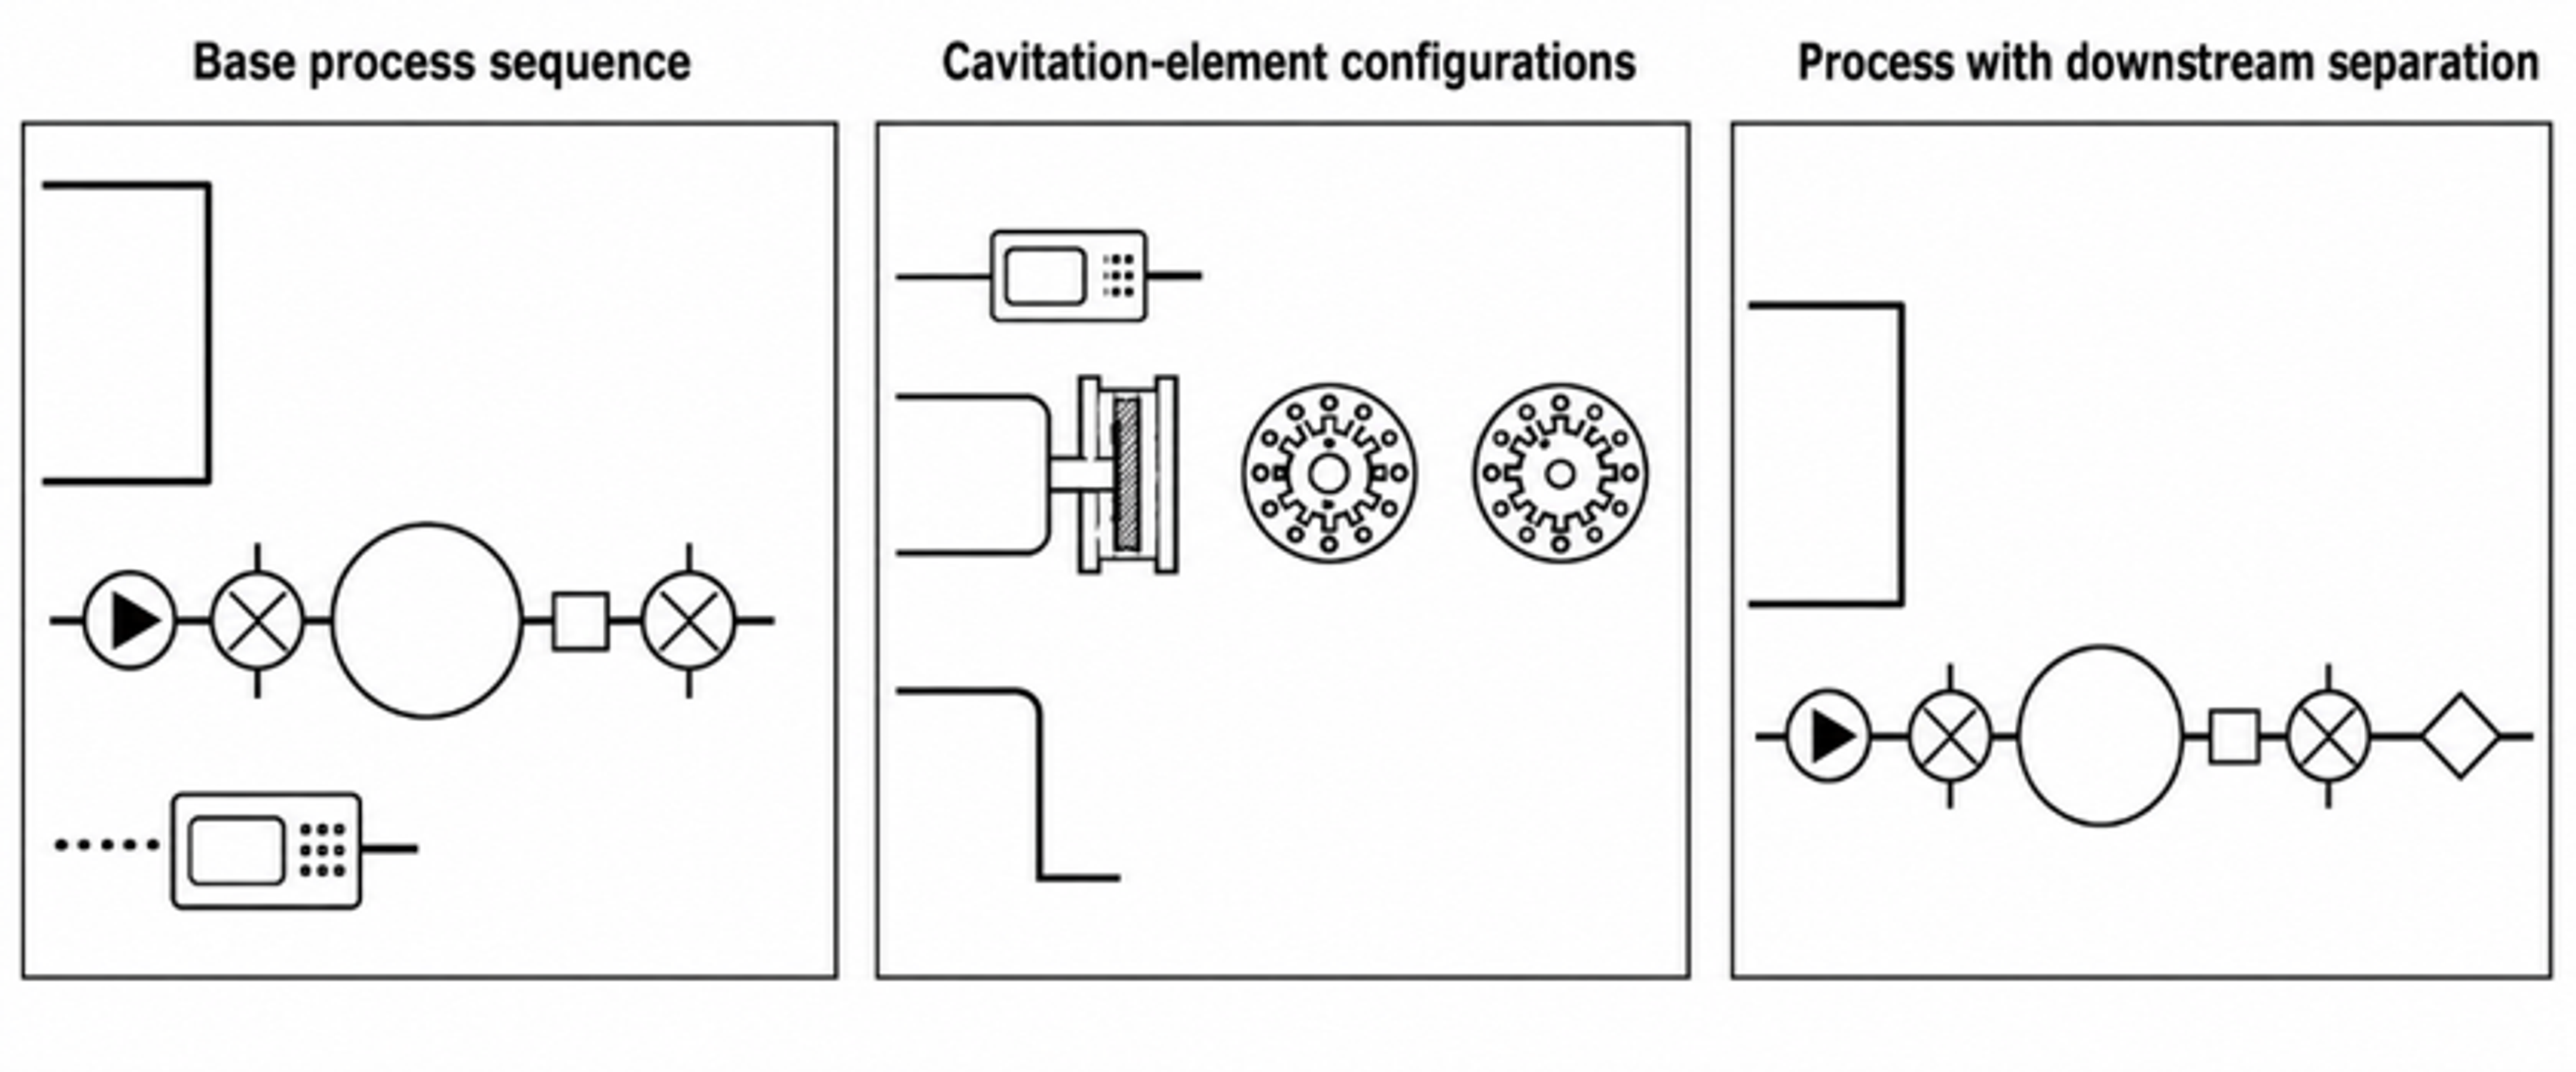
Figure 12. Representative process schemes from a food emulsion patent family that incorporates hydrodynamic cavitation into preparation and phase management steps [39].
5.5 Process integration and production configurations
Commercial implementation usually takes one of three forms: a single pass inline unit, a recirculation loop, or several identical modules operated in parallel. Selection depends on residence time tolerance, validated local cavitation conditions, cleaning strategy, and required turndown. Supplier data can support mechanical design, but product specific droplet size distribution, temperature, chemistry, and wear must be established by pilot testing [42–44].
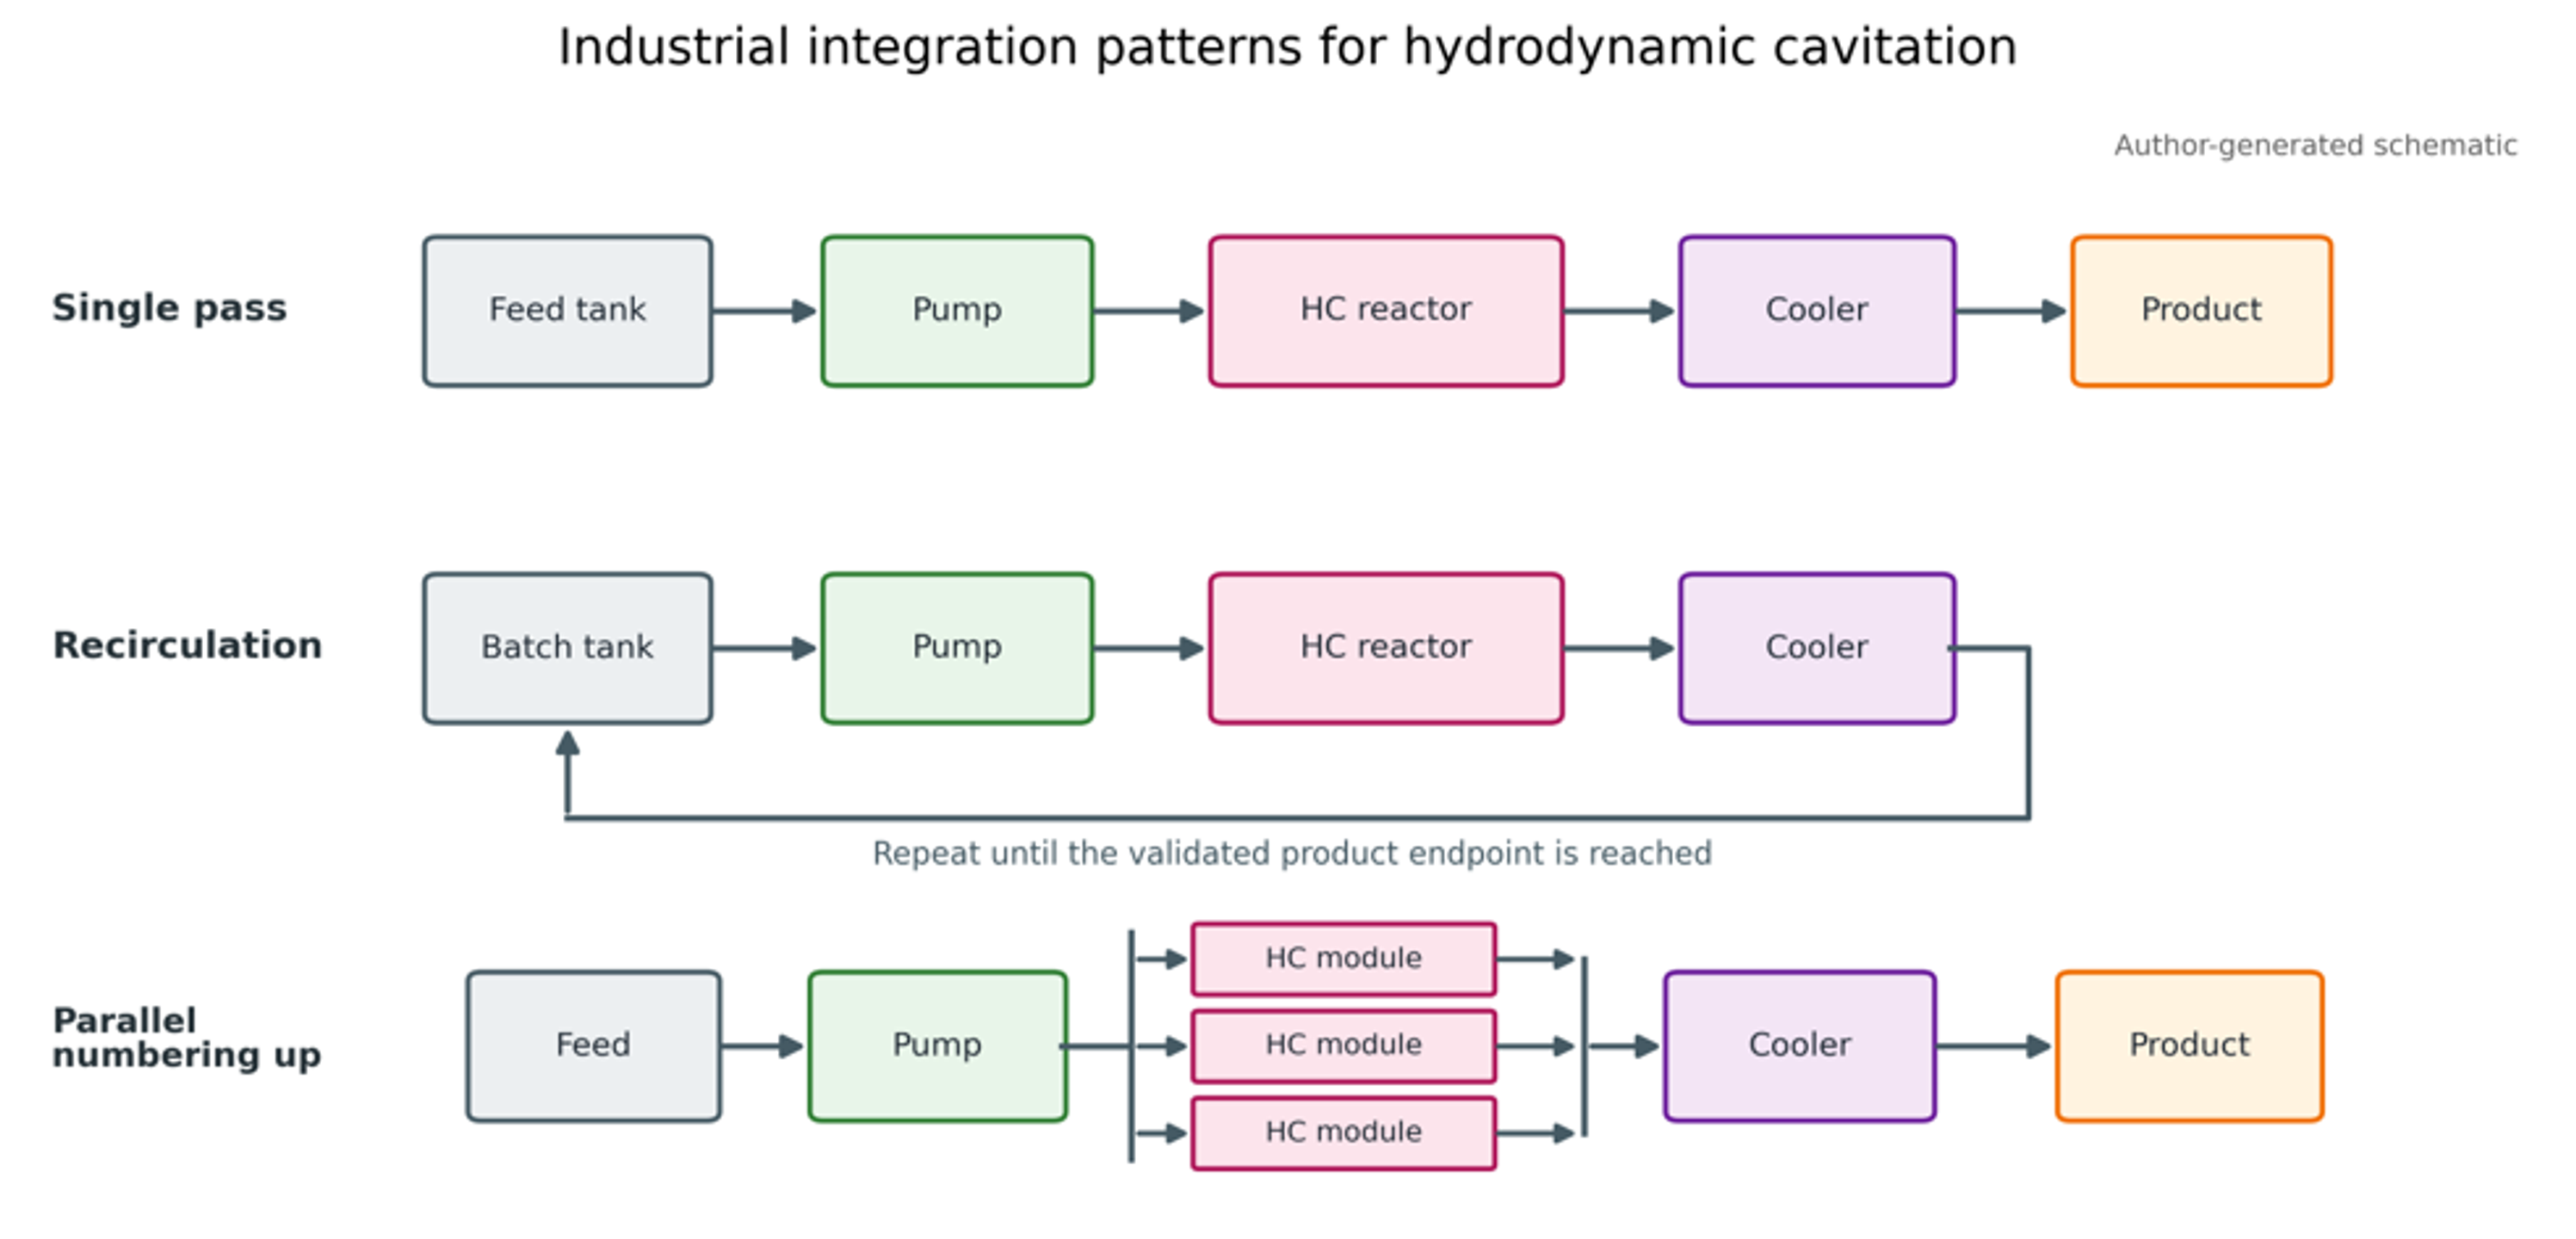
Figure 13. Industrial integration patterns for hydrodynamic cavitation: single pass, recirculation, and parallel scale out [9].
Production installation normally includes a feed or recirculation tank, pump, cavitation reactor, upstream and downstream pressure measurement, flow measurement, backpressure valve, heat exchanger, sampling point, and route for single pass discharge or recirculation. For sanitary products, drainability, elastomer compatibility, surface finish, clean in place velocity, dead leg control, and validated cleaning are as important as cavitation intensity.
6 Process Variables and Experimental Performance
6.1 Cavitation regime, pressure, and backpressure
The experiments show a nonmonotonic relationship between reported cavitation index and Sauter mean diameter. Transition from noncavitating flow to a field of transient cavities reduced droplet size, but progression toward an attached supercavity increased the diameter again [3,18,34]. The minimum occurred in a region reported as approximately 0.6 to 1.0 for that specific index definition and apparatus. The important observation is the regime transition, not the absolute numerical value.
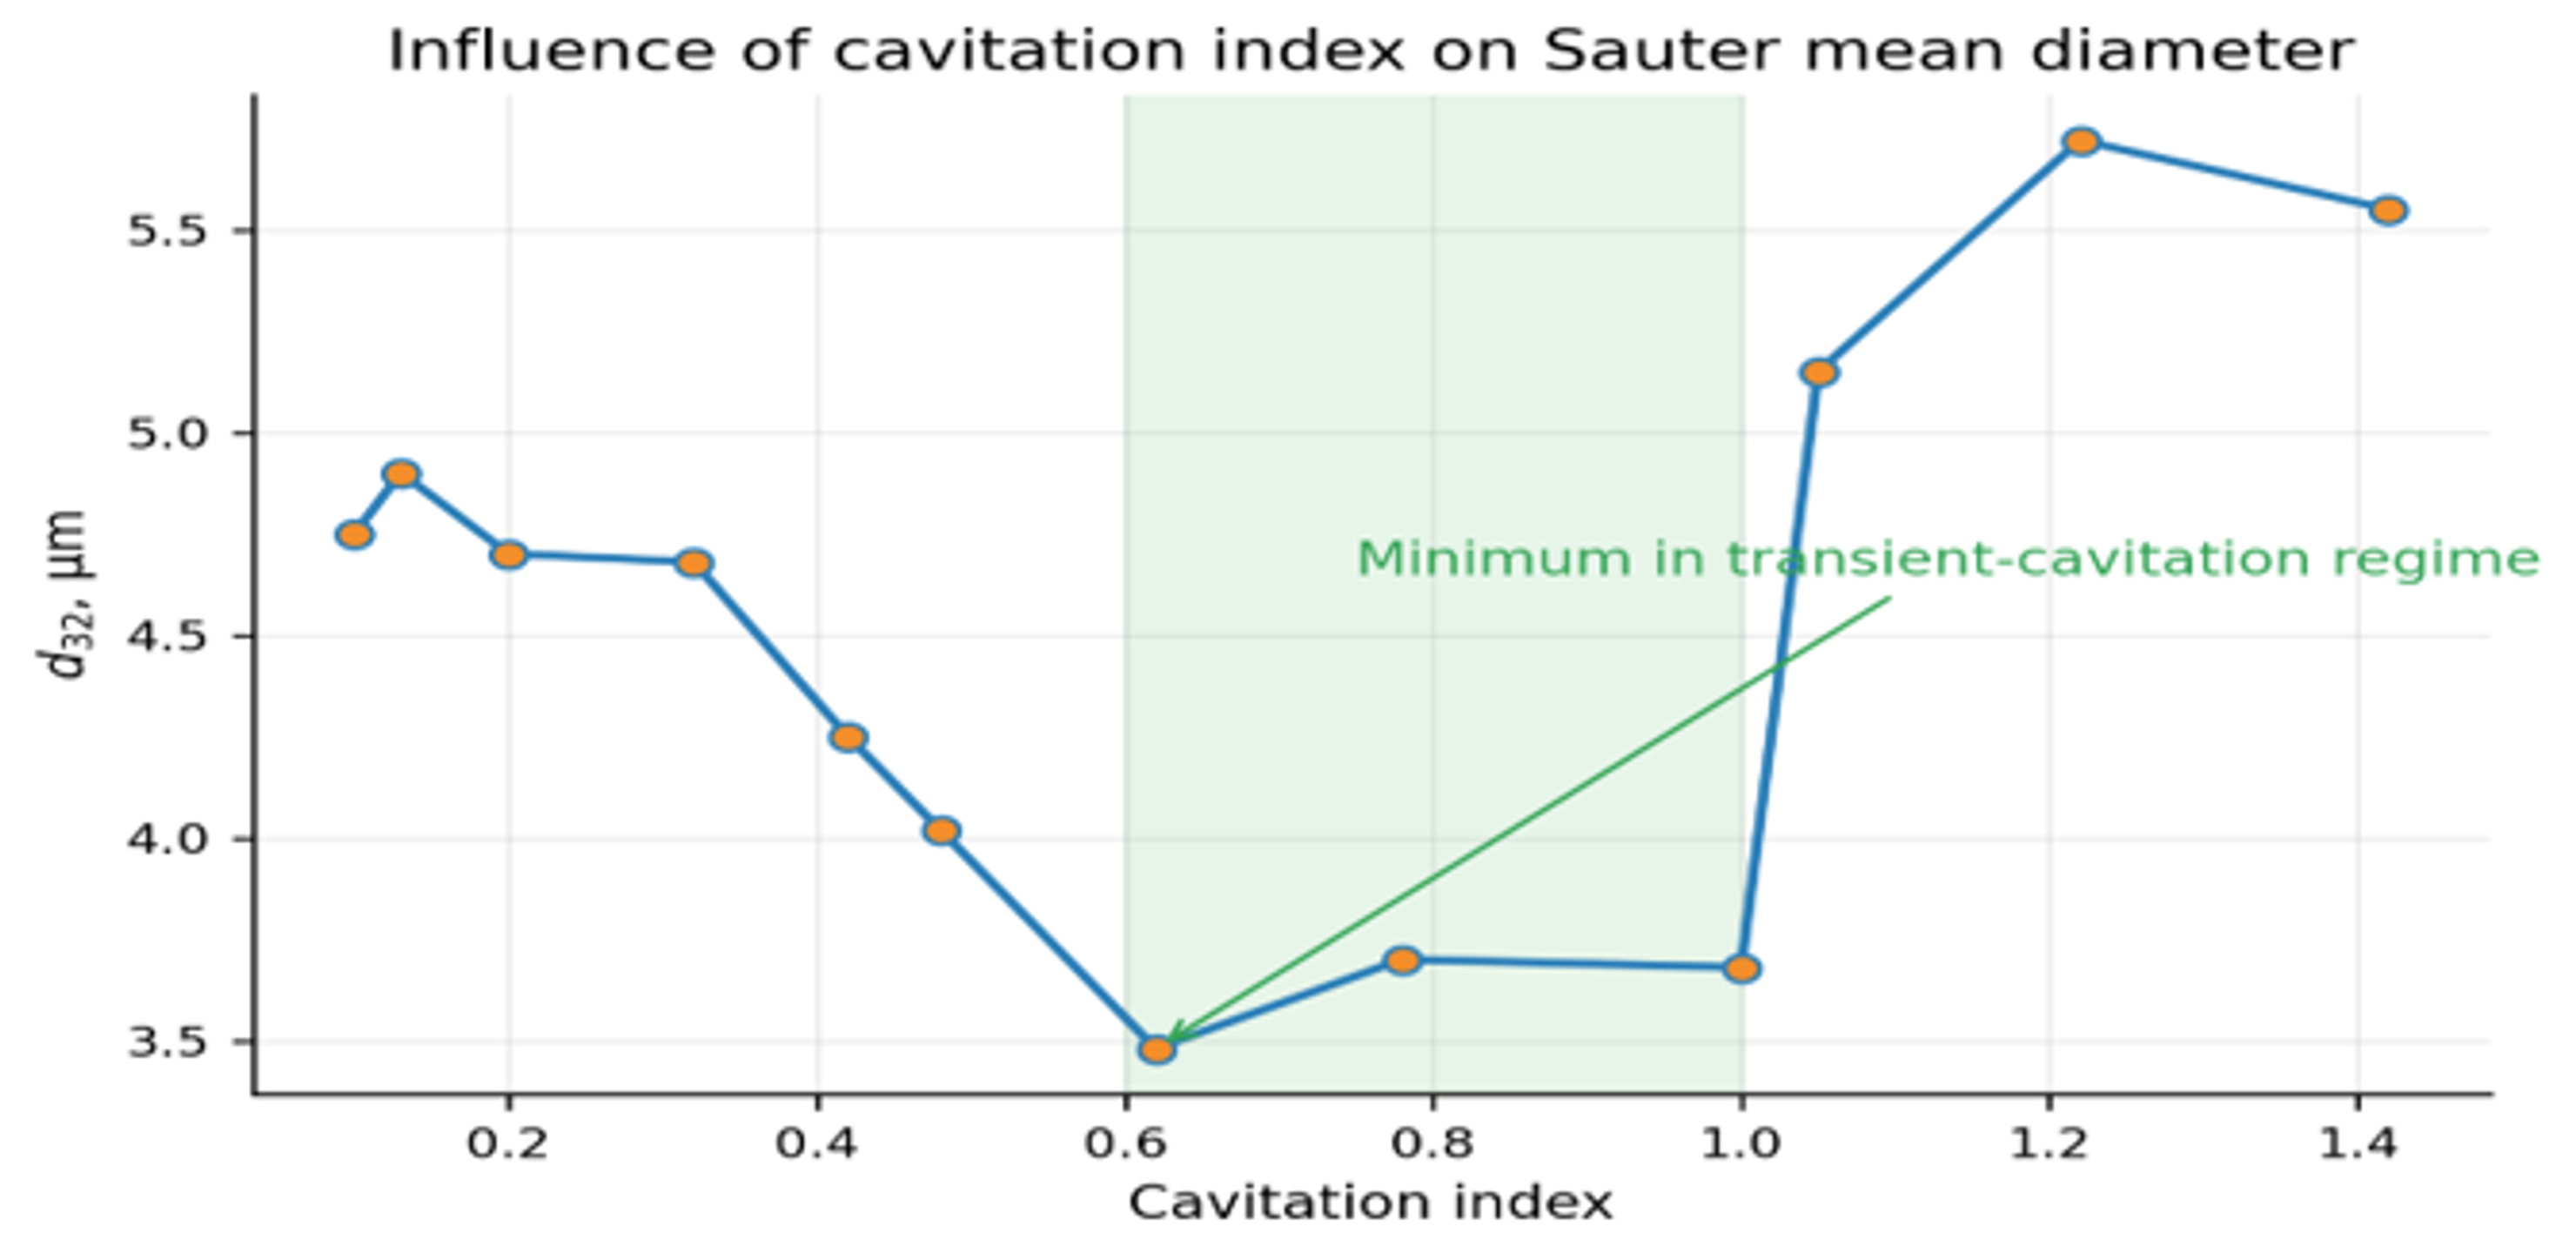
Figure 14. Influence of the reported cavitation index on Sauter mean diameter in a cone shaped cavitator. The shaded region indicates the minimum associated with many transient collapse events [9].
Backpressure is a direct control variable because it changes both the pressure margin for cavity formation and the recovery pressure available for collapse. In the reported test loop, backpressure varied almost linearly with the reported cavitation index. In high pressure homogenization, variation of the second stage restriction similarly changes cavitation and can improve or reduce breakup depending on where droplets experience the dominant stress relative to the orifice exit [45–48].
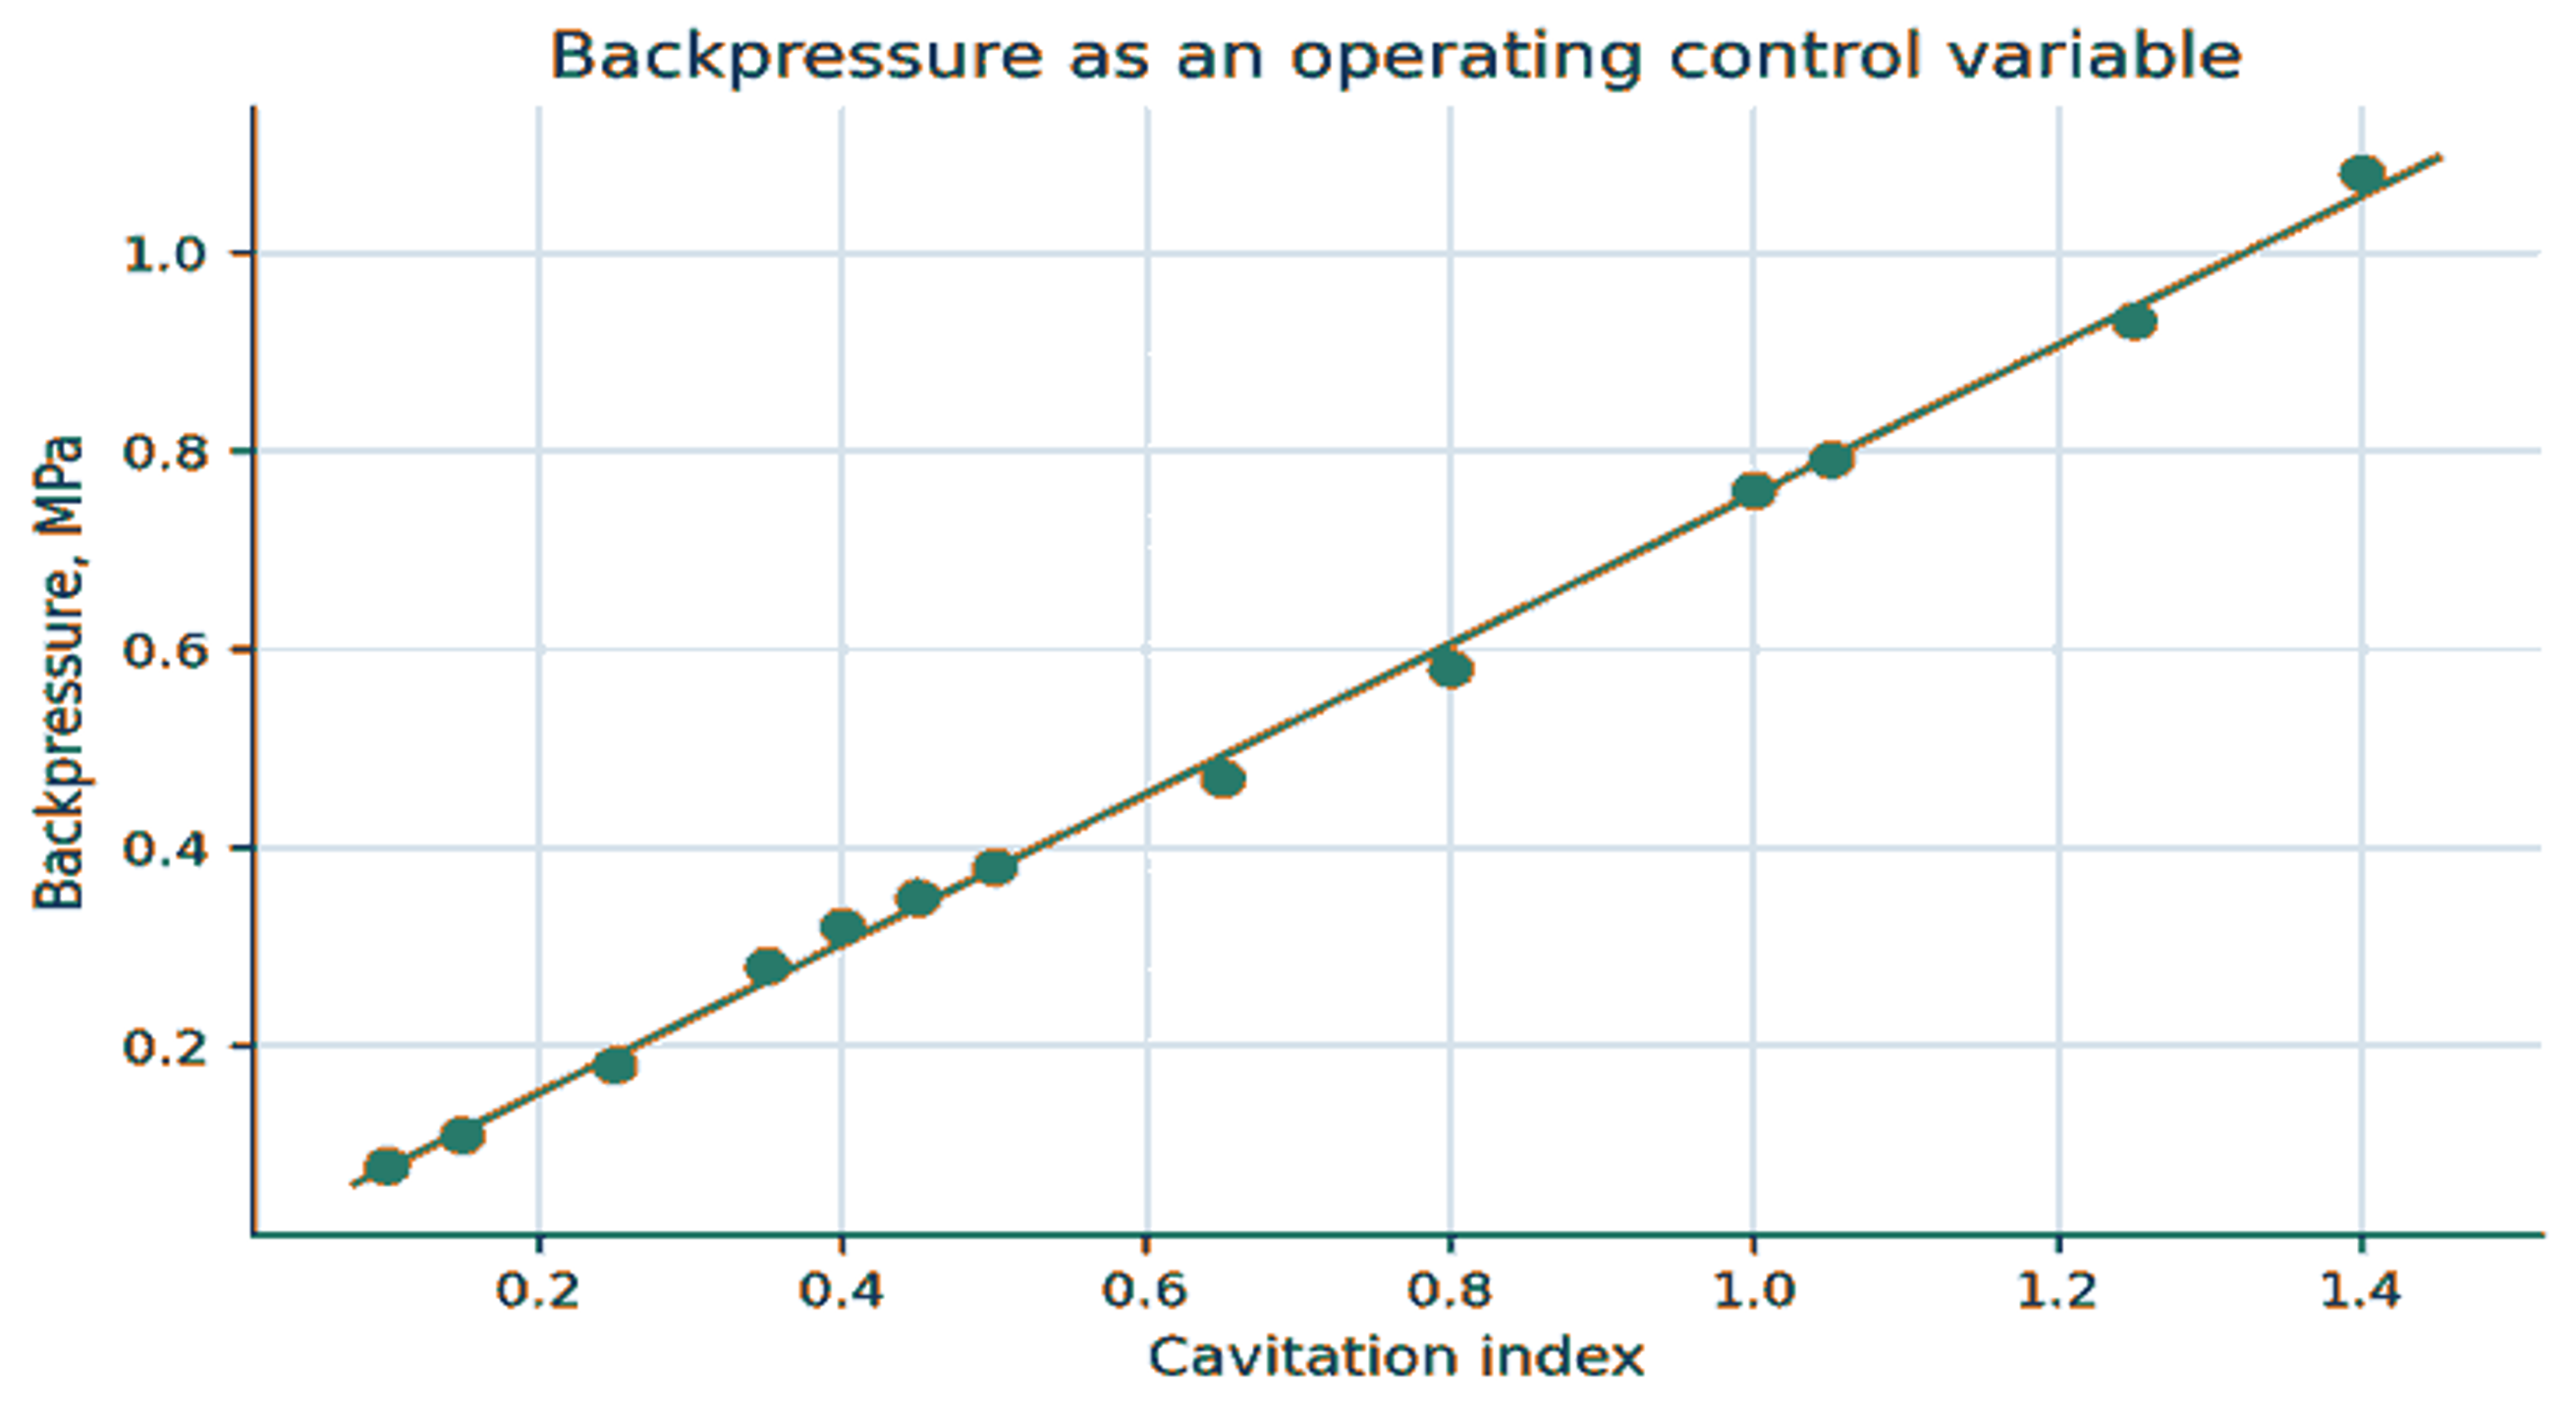
Figure 15. Backpressure as an operating control variable in the cone cavitator test loop [3].
The engineering consequence is that a backpressure valve should not be treated only as a flow control accessory. It is part of the cavitation reactor. During scale up, the downstream line, valve, heat exchanger, and elevation can alter pressure recovery enough to change the bubble field even when the upstream pressure is unchanged.
6.2 Number of passes and diminishing returns
Repeated passage increases the probability that large droplets encounter a high stress region. The first pass usually produces the largest reduction because coarse, weak droplets are abundant. Later passes act on smaller droplets with higher capillary pressure and may also increase recoalescence, heating, oxidation, and residence time spread. In the reported vegetable oil data, most of the size reduction occurred during the first pass, and three passes captured most of the practical benefit [3].
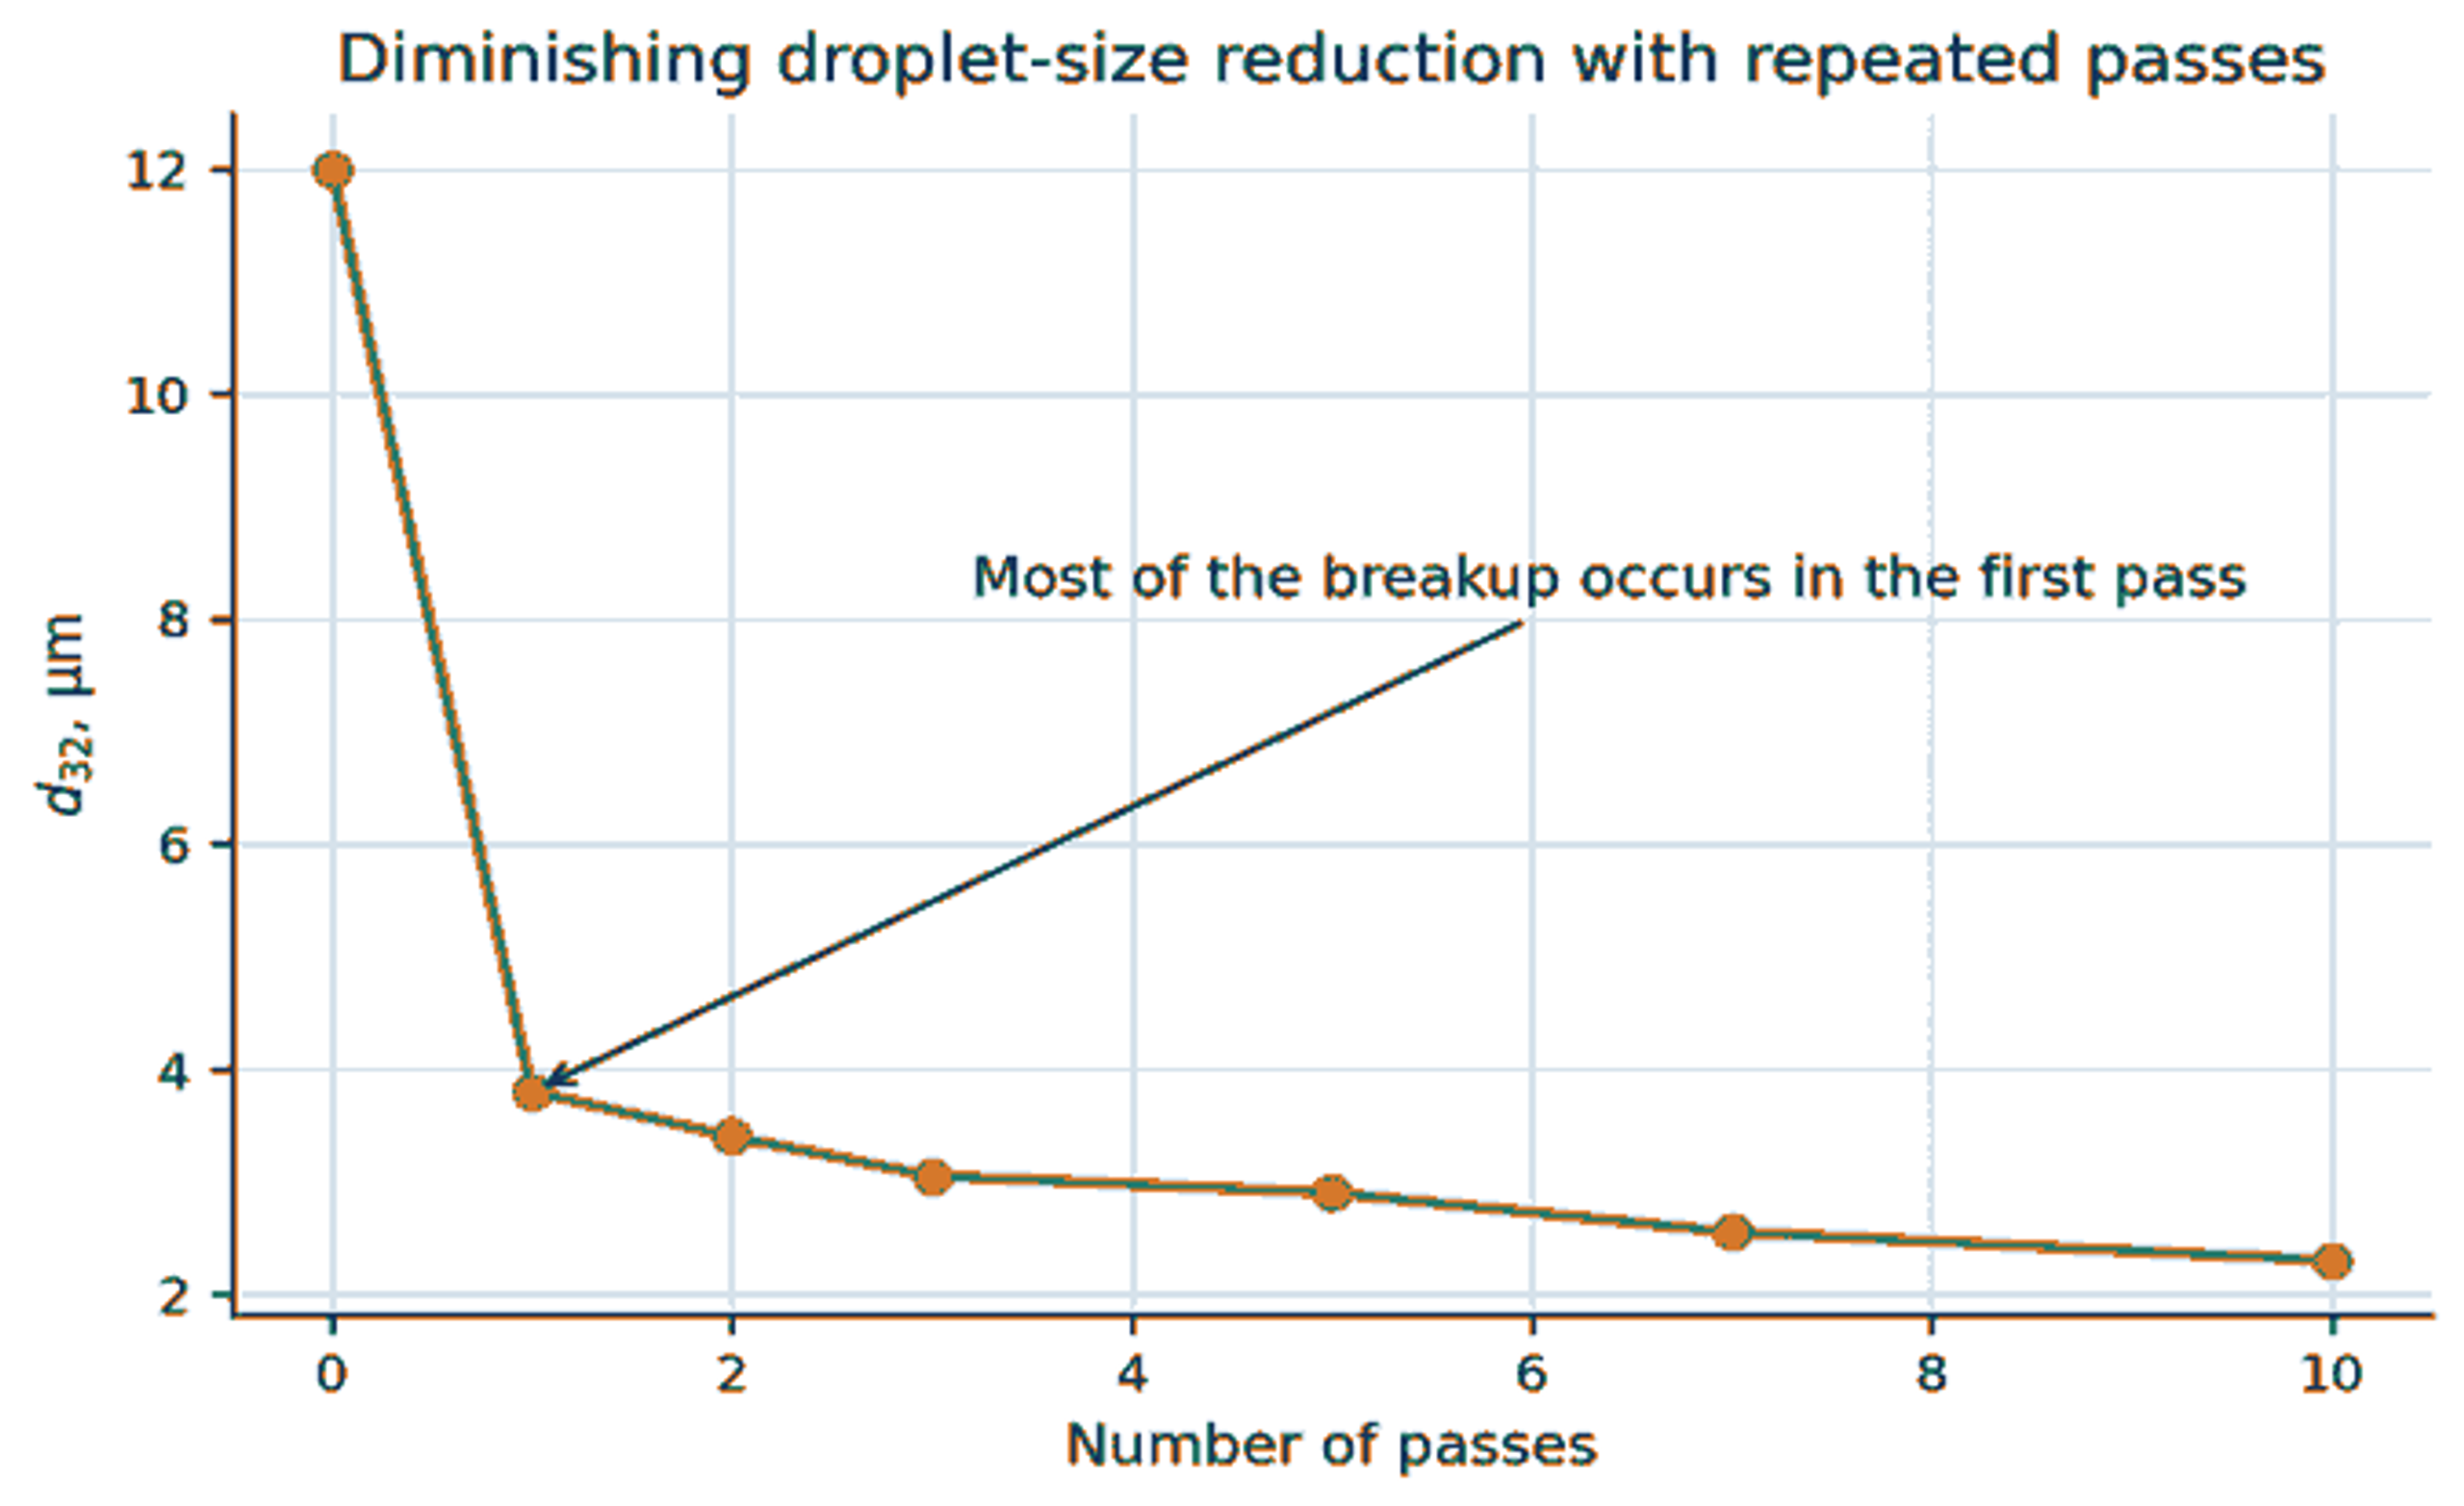
Figure 16. Diminishing reduction in Sauter mean diameter with repeated passes through a cavitation mixer [3,18].
Pass number should therefore be optimized against a multi criterion endpoint: , coarse fraction, temperature increase, oxidation sensitive markers, surfactant integrity, energy per mass, and production rate. A target based only on the smallest attainable diameter can select an uneconomic or chemically damaging operating point.
6.3 Dispersed phase viscosity
A more viscous droplet resists internal circulation and deformation. In the present silicone oil tests, increased approximately linearly over the investigated viscosity range at a constant reported cavitation index [3]. The modest slope does not imply that viscosity is unimportant in all systems. Viscosity effects become stronger as the ratio rises, temperature falls, or collapse stress decreases.
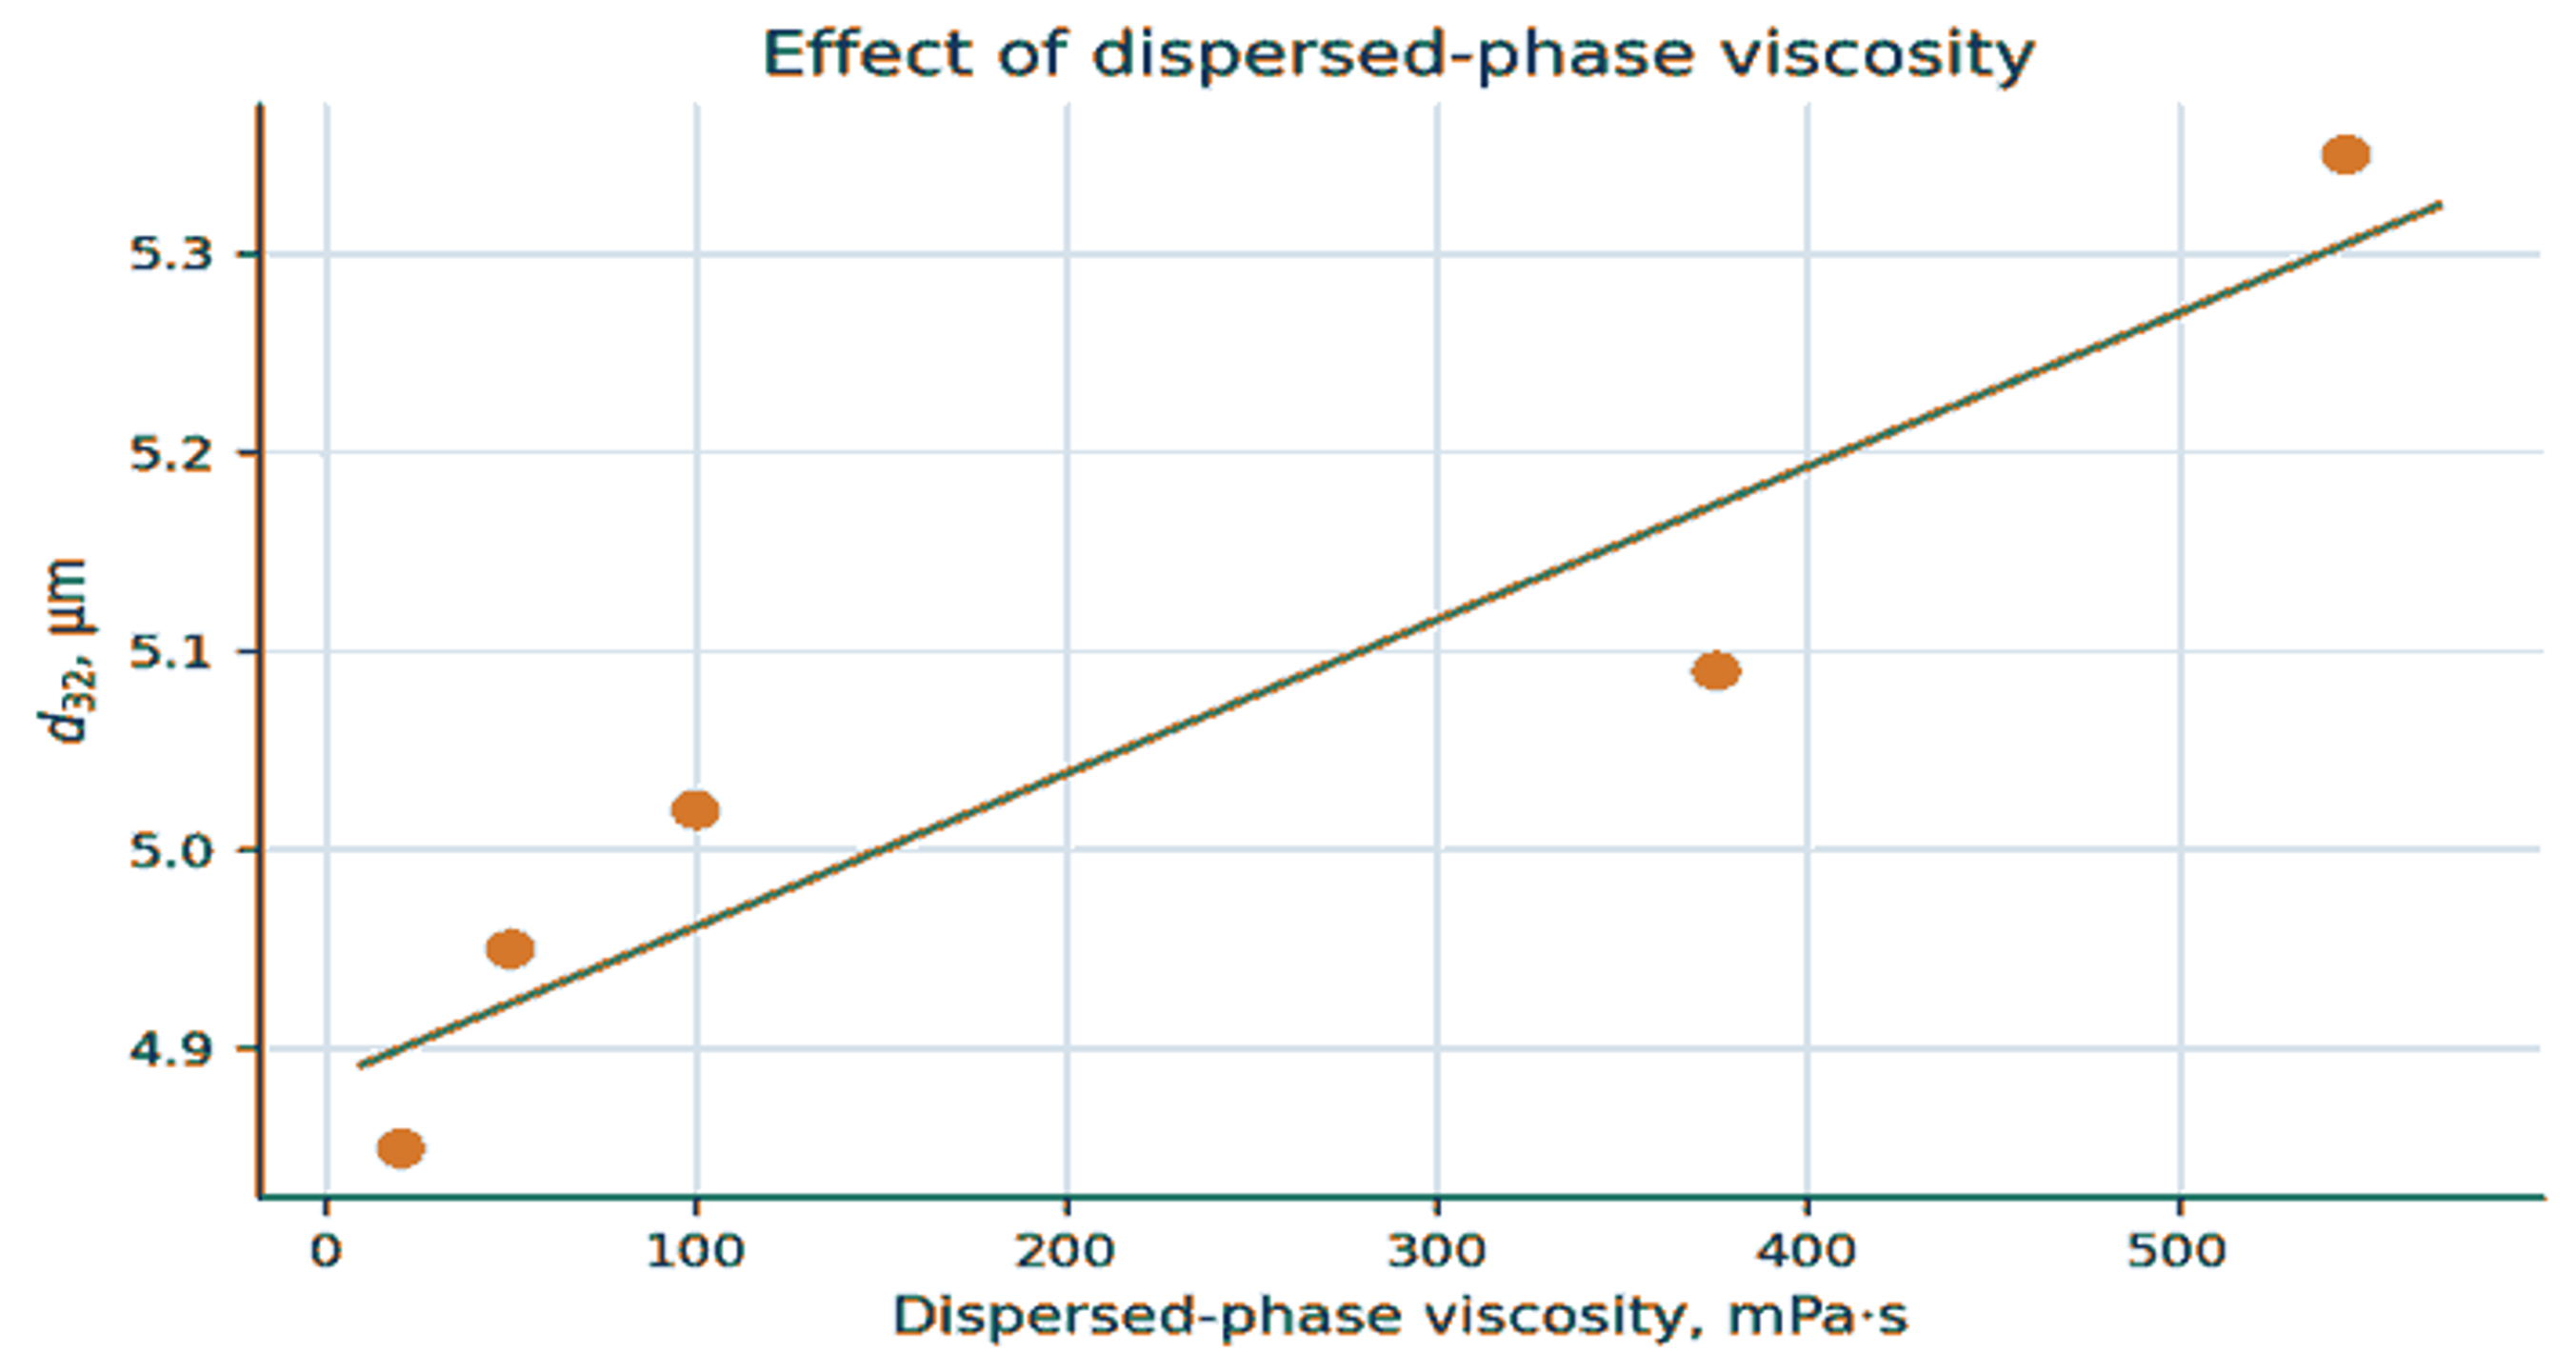
Figure 17. Effect of dispersed phase viscosity on the Sauter mean diameter of silicone oil emulsions [3].
Viscosity and interfacial tension should be measured at the actual processing temperature. Using room temperature data for hot food, oil, polymer, or fuel can create a large error in Weber number, capillary number, and pump sizing. Non Newtonian dispersed phases require a rate dependent viscosity model rather than a single tabulated value.
6.4 Continuous phase viscosity
Continuous phase viscosity has competing effects. It reduces Reynolds number and may damp turbulence, but it also slows creaming, changes film drainage during coalescence, and modifies propagation of collapse induced velocity gradients. The reported comparison used 1% silicone oil without surfactant in water adjusted to 10 or 350 mPa s. A rotor stator homogenizer operated at 24,000 rpm produced a mean diameter that increased from 14.9 to 36.9 µm as continuous phase viscosity increased. Under the same two viscosity conditions, the cavitation mixer operated at 2.8 MPa produced mean diameters of 9.4 and 10.2 µm [3].
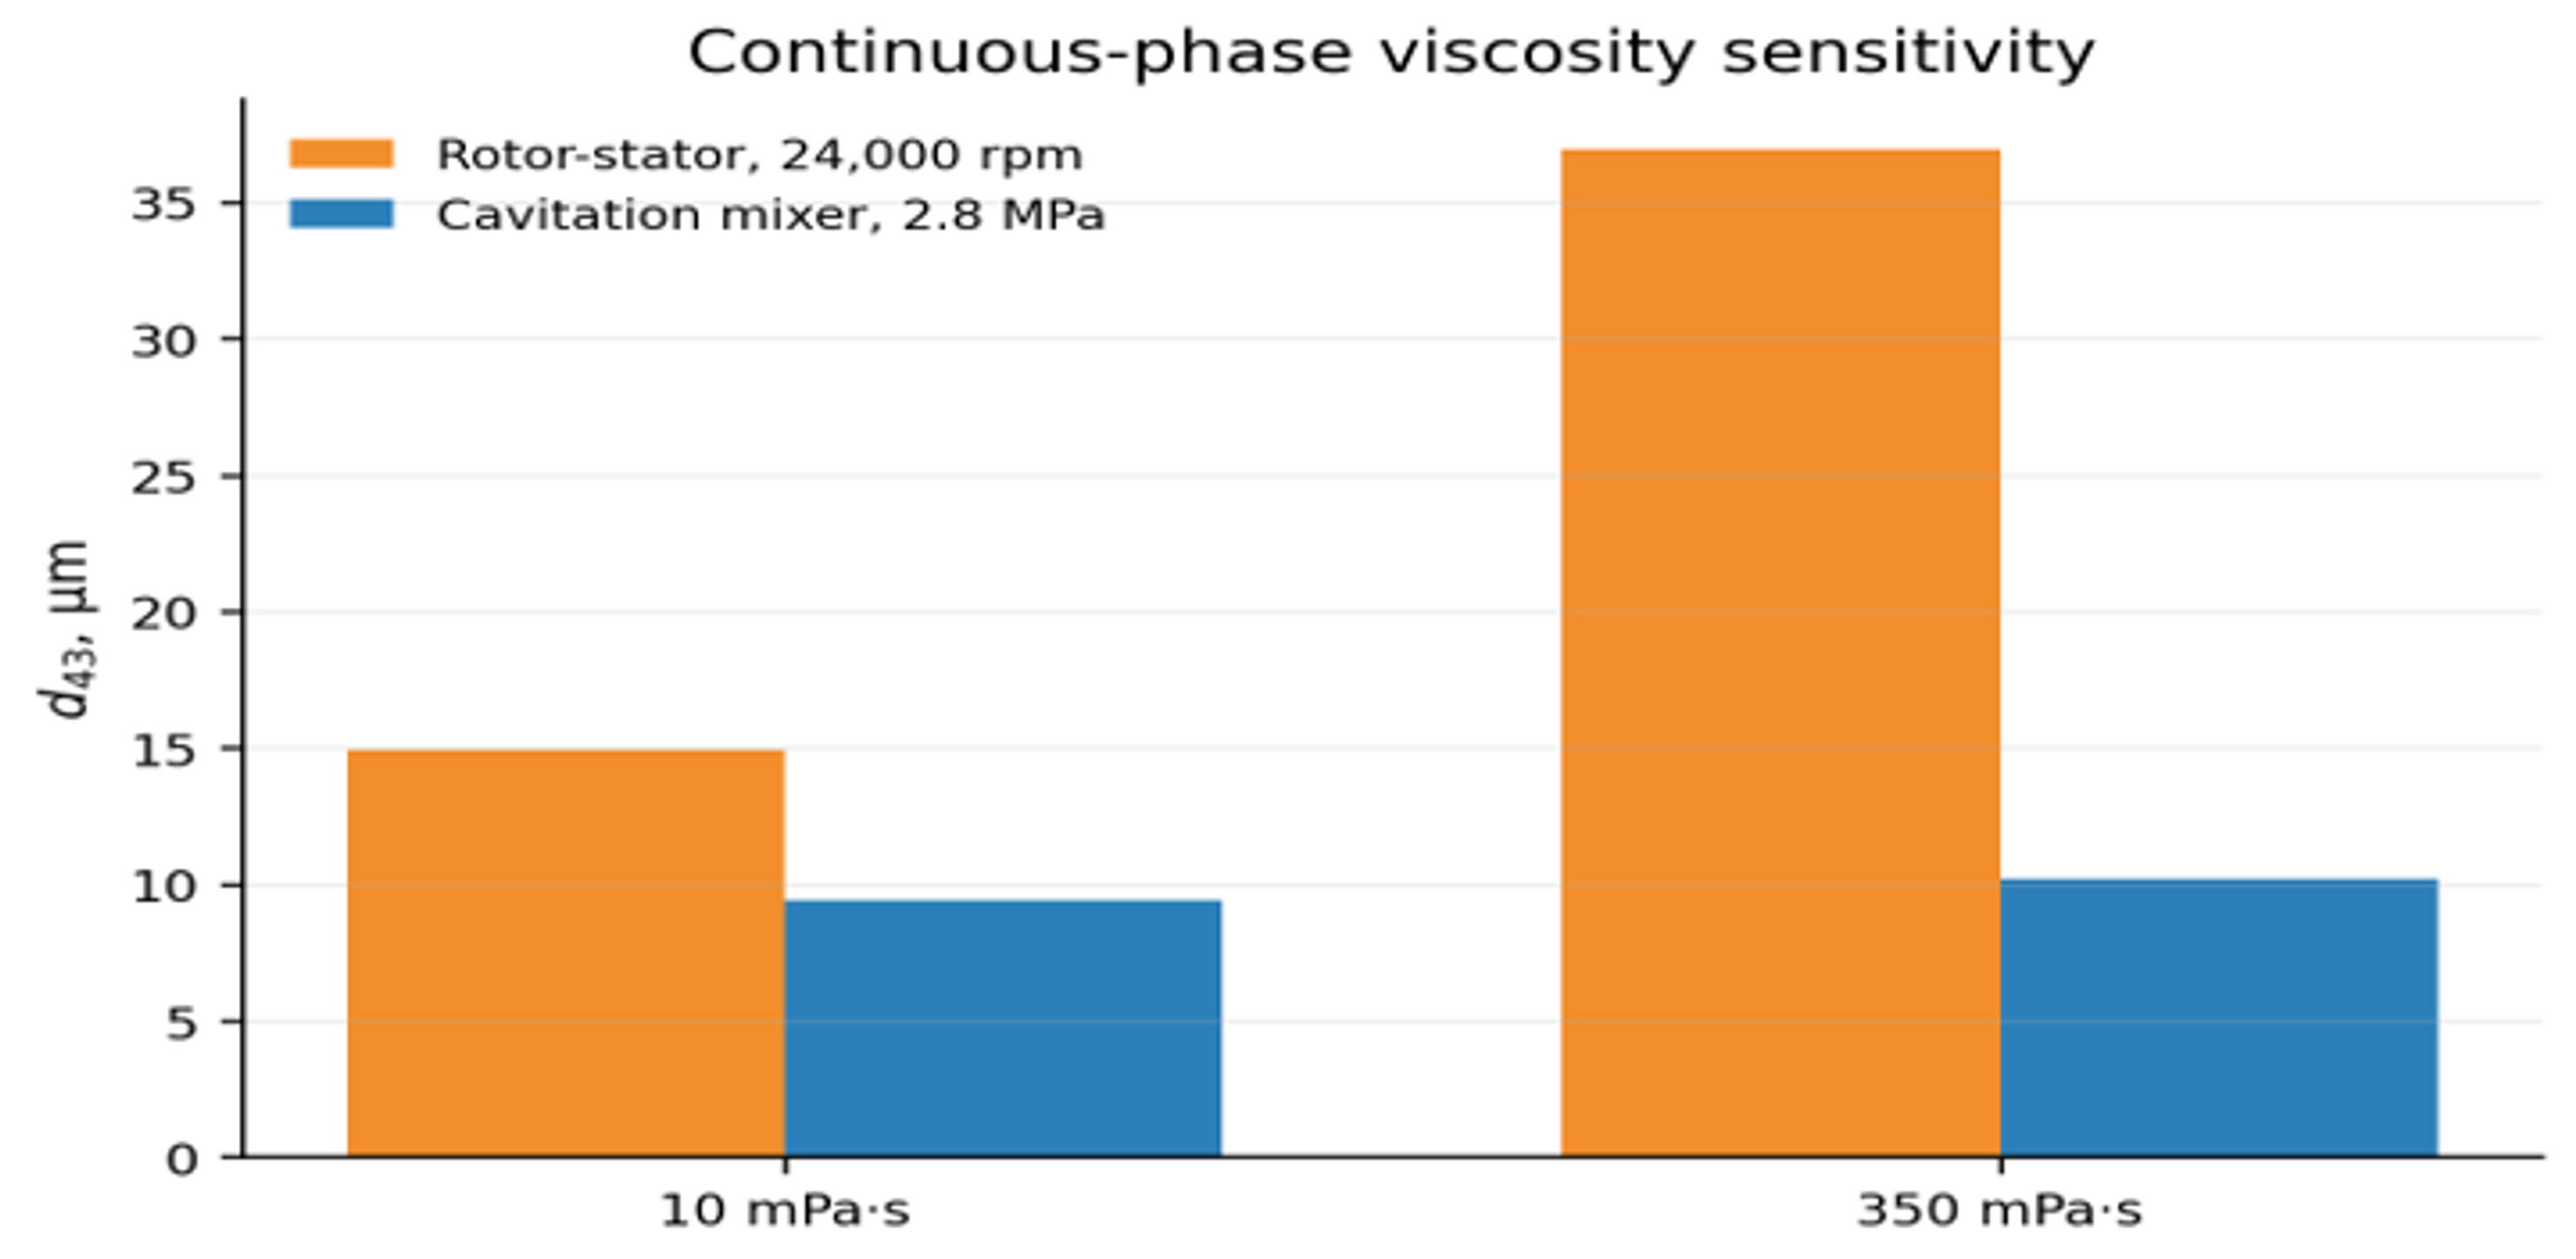
Figure 18. Continuous phase viscosity sensitivity in a rotor stator homogenizer and a single orifice cavitation mixer [3].
Table 7. Effect of continuous phase viscosity on droplet breakup in turbulent and cavitating flow [3].
| Process | Continuous phase viscosity, mPa s | Capacity, m³/s | Mean diameter, d₄₃, µm | Coarse diameter, d₉₀, µm | Reported energy density, J/m³ |
|---|---|---|---|---|---|
| Premix | 10 | Not reported | 114.8 | 182.1 | Not reported |
| Premix | 350 | Not reported | 175.9 | 292.8 | Not reported |
| Rotor stator, one pass, 24,000 rpm | 10 | 14.9 | 27.8 | ||
| Rotor stator, one pass, 24,000 rpm | 350 | 36.9 | 97.4 | ||
| Cavitation mixer, one pass, 2.8 MPa | 10 | 9.4 | 16.4 | ||
| Cavitation mixer, one pass, 2.8 MPa | 350 | 10.2 | 21.3 |
The comparison is informative but should not be interpreted as a universal efficiency ranking. The devices used different mechanisms, capacities, and power accounting conventions, and the emulsions were not stabilized. It demonstrates that localized collapse can remain effective in a viscous continuous phase under conditions where bulk rotor stator circulation deteriorates.
6.5 Protein modification and emulsification
Hou et al. investigated tilapia myofibrillar protein in an open access study using a recirculating hydrodynamic cavitation loop. A 900 mL suspension was processed at 0.14 MPa with a 550 W pump through a single orifice plate having a 3 mm hole and 20 mm thickness. Treatment times were 0, 5, 10, 15, and 20 min [49]. This case is useful because the same experiment reports protein particle response and the performance of the resulting oil in water emulsion.
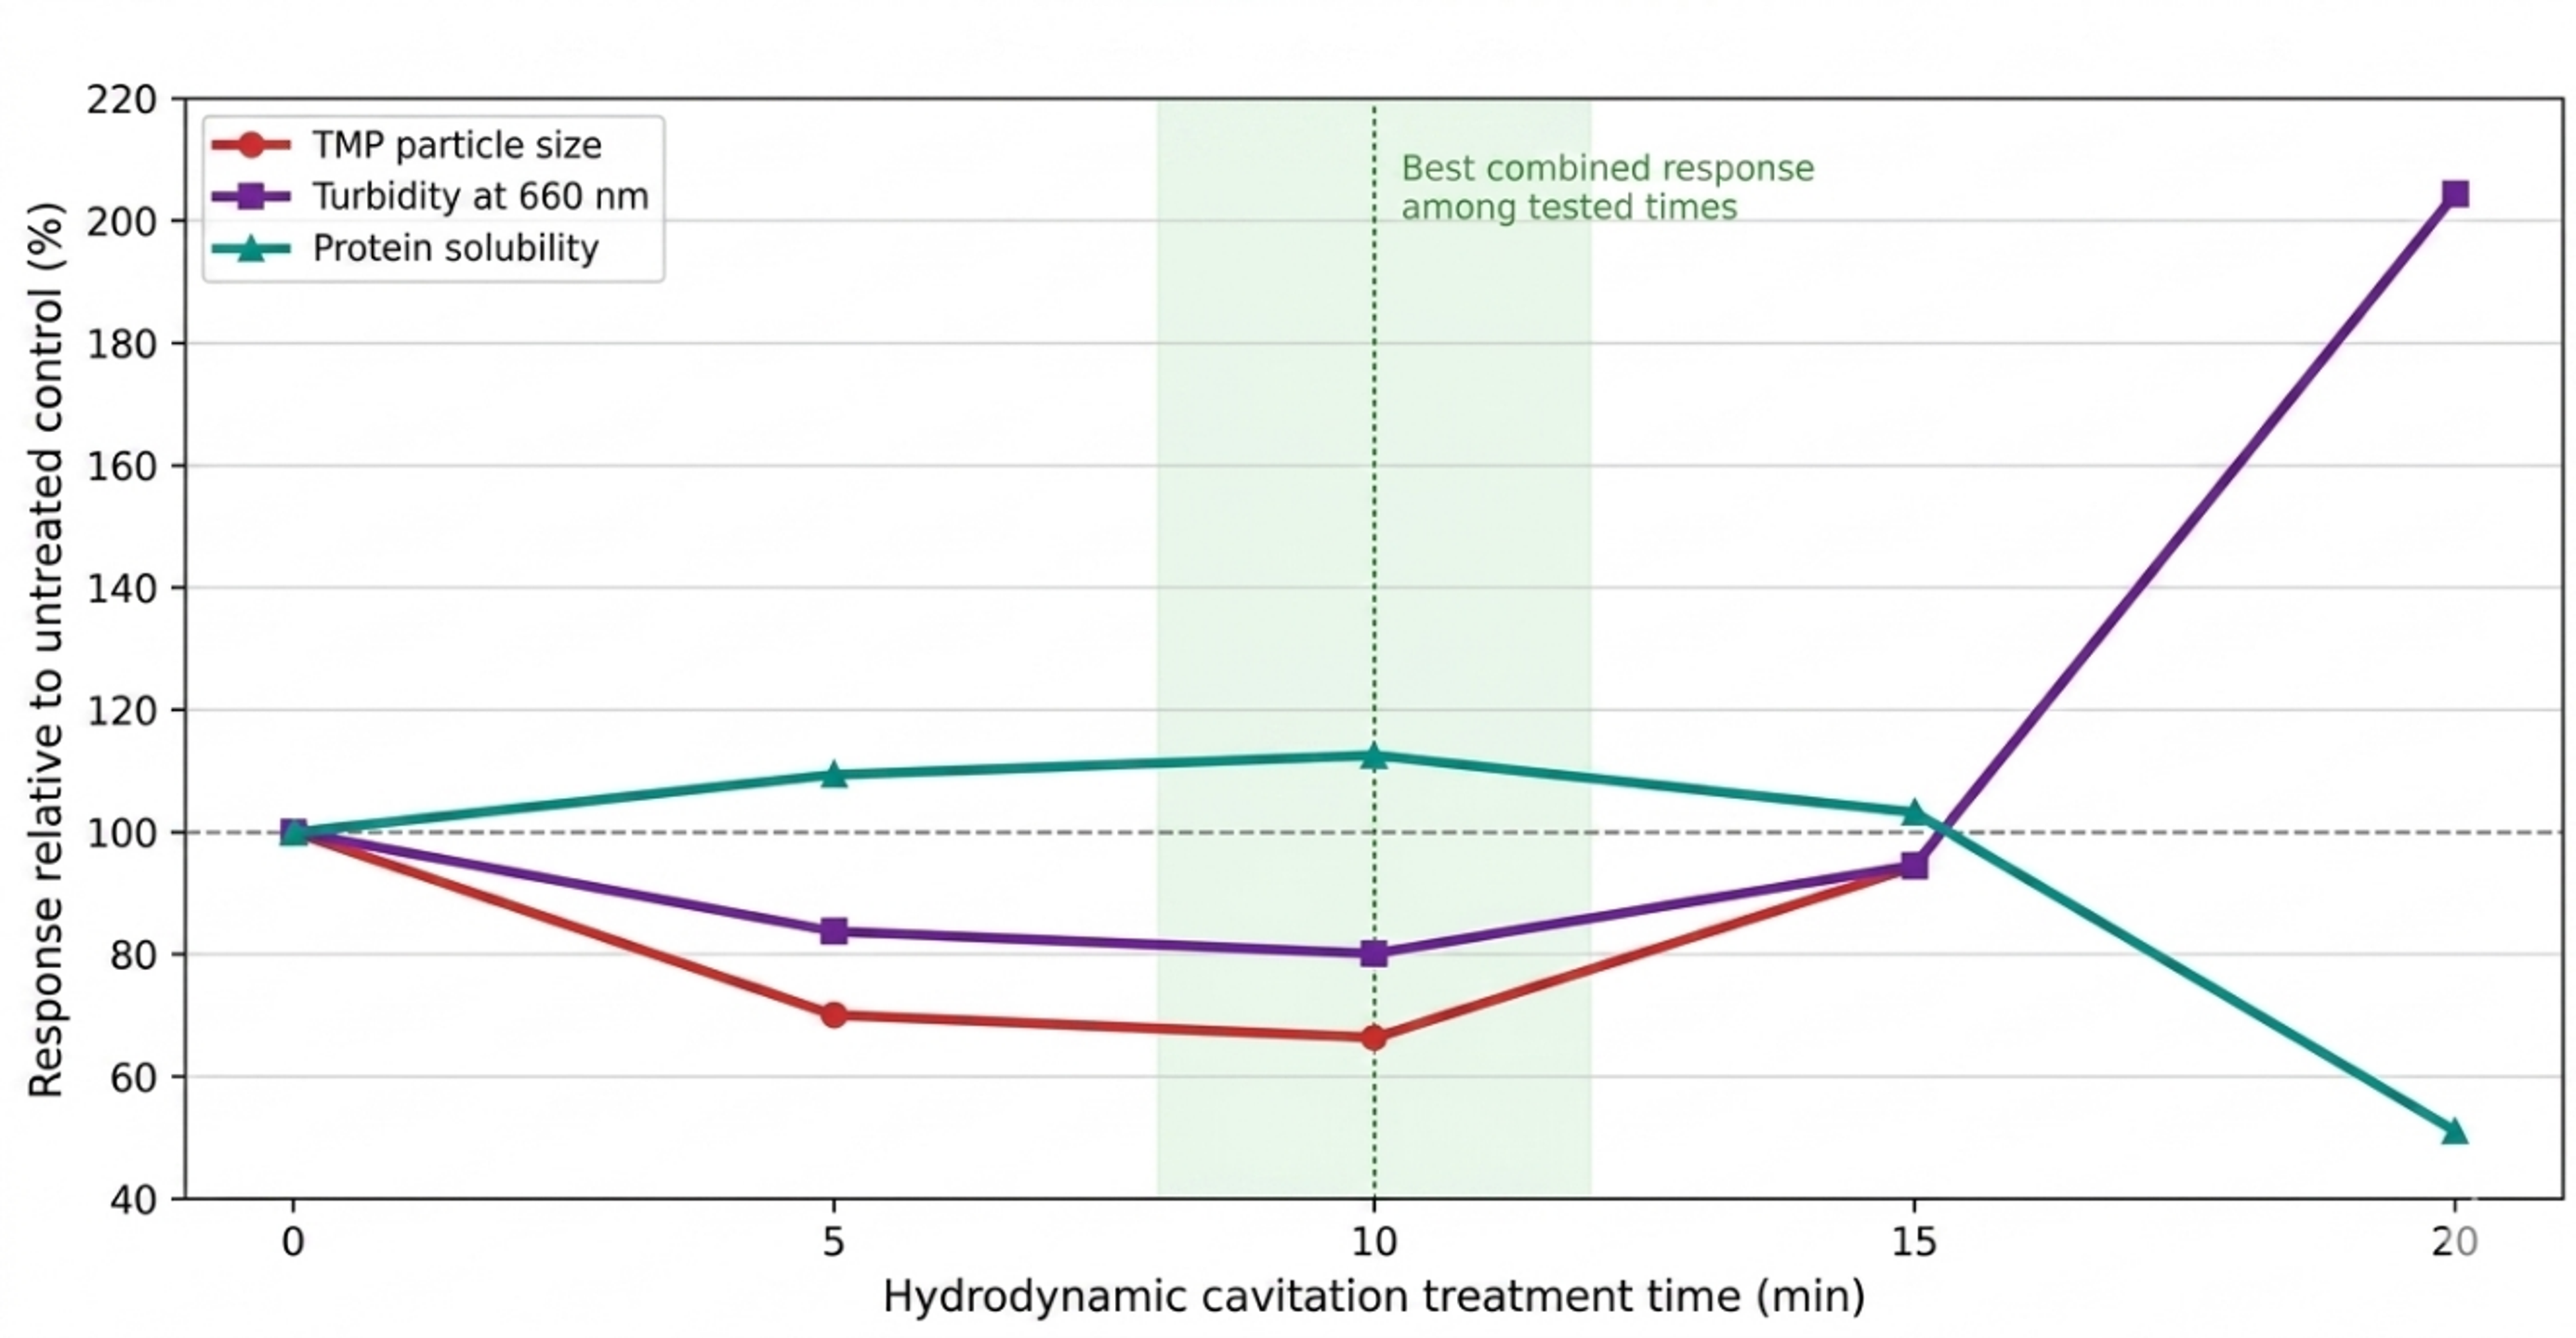
Figure 19. Relative particle size, turbidity, and solubility of tilapia myofibrillar protein versus hydrodynamic cavitation treatment time. The shaded region marks the best combined response among the tested times [49].
The 10 min condition gave the smallest measured protein particle size, the lowest turbidity, and the highest solubility among the tested times. Extending treatment to 15 and 20 min reversed several of those gains; at 20 min, particle size and turbidity rose sharply while solubility fell. The result demonstrates a finite process window in which aggregate disruption and protein unfolding improve functionality before reaggregation or excessive structural change becomes dominant [49].
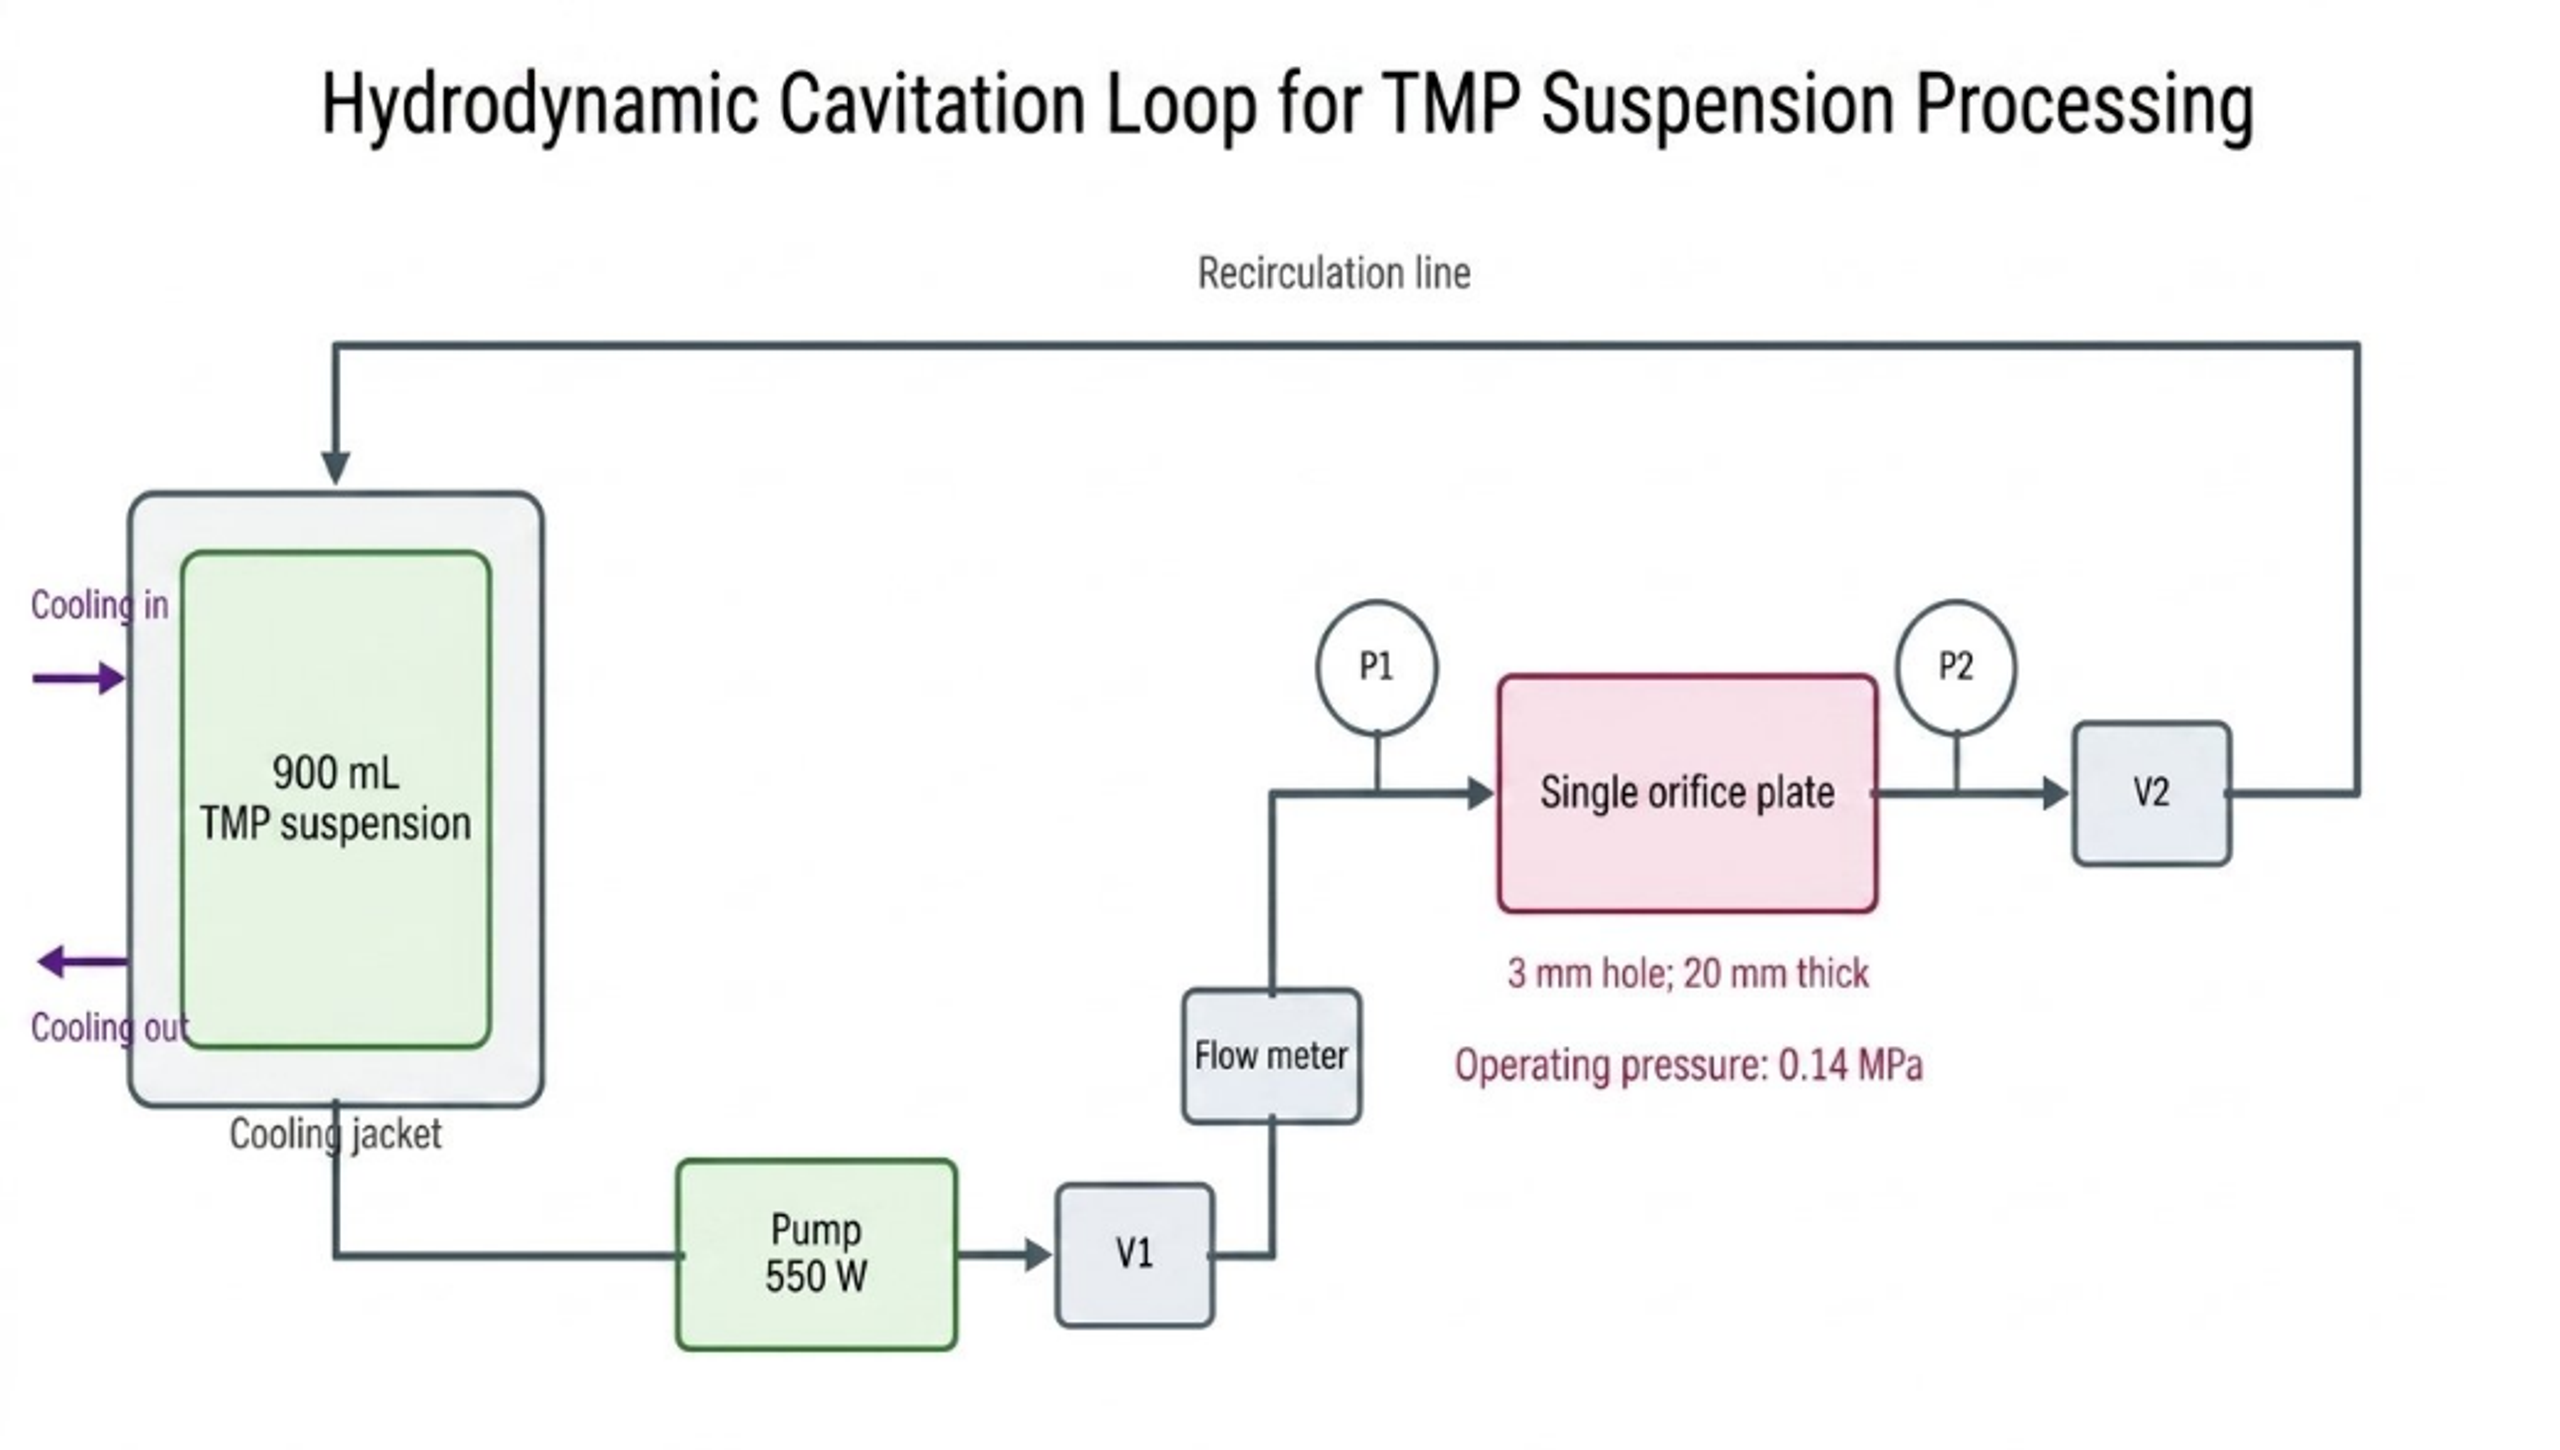
Table 8. Open access hydrodynamic cavitation case: tilapia myofibrillar protein and emulsion response.
| HC time, min | TMP particle size, nm | Turbidity, A660 | Protein solubility, % | Emulsion response | Engineering interpretation |
|---|---|---|---|---|---|
| Reactor settings | 3 mm orifice | 20 mm plate | 0.14 MPa | 550 W; 900 mL | Cooling water; recirculating loop |
| 0 | 1026.2 ± 25.9 | 0.111 ± 0.001 | 57.65 ± 1.08 | 2754 ± 110 nm; ESI 71.28 ± 5.50 min | Untreated control |
| 5 | 719.3 ± 41.1 | 0.093 ± 0.001 | 63.07 ± 1.37 | Improved from control | Aggregate dissociation |
| 10 | 681.6 ± 13.6 | 0.089 ± 0.001 | 64.90 ± 0.34 | 2138 ± 182 nm; ESI 91.73 ± 5.56 min | Best overall tested condition |
| 15 | 967.3 ± 27.8 | 0.105 ± 0.004 | 59.50 ± 0.41 | Emulsion response began to deteriorate | Onset of overtreatment |
| 20 | 2095.3 ± 61.6 | 0.227 ± 0.003 | 29.44 ± 5.10 | Coarser, less stable emulsion | Strong reaggregation |
| Design implication | Track size | Track turbidity | Track solubility | Confirm diameter and ESI | Define a validated treatment window |
6.6 Emulsion response and process window
The protein changes translated into a measurable emulsion response. At the best tested 10 min condition, mean emulsion droplet size decreased from 2754 ± 110 to 2138 ± 182 nm, while the emulsifying stability index increased from 71.28 ± 5.50 to 91.73 ± 5.56 min [49]. Longer treatment did not continue the improvement. This combined response shows why a formulation should be optimized against both ingredient functionality and final emulsion performance.
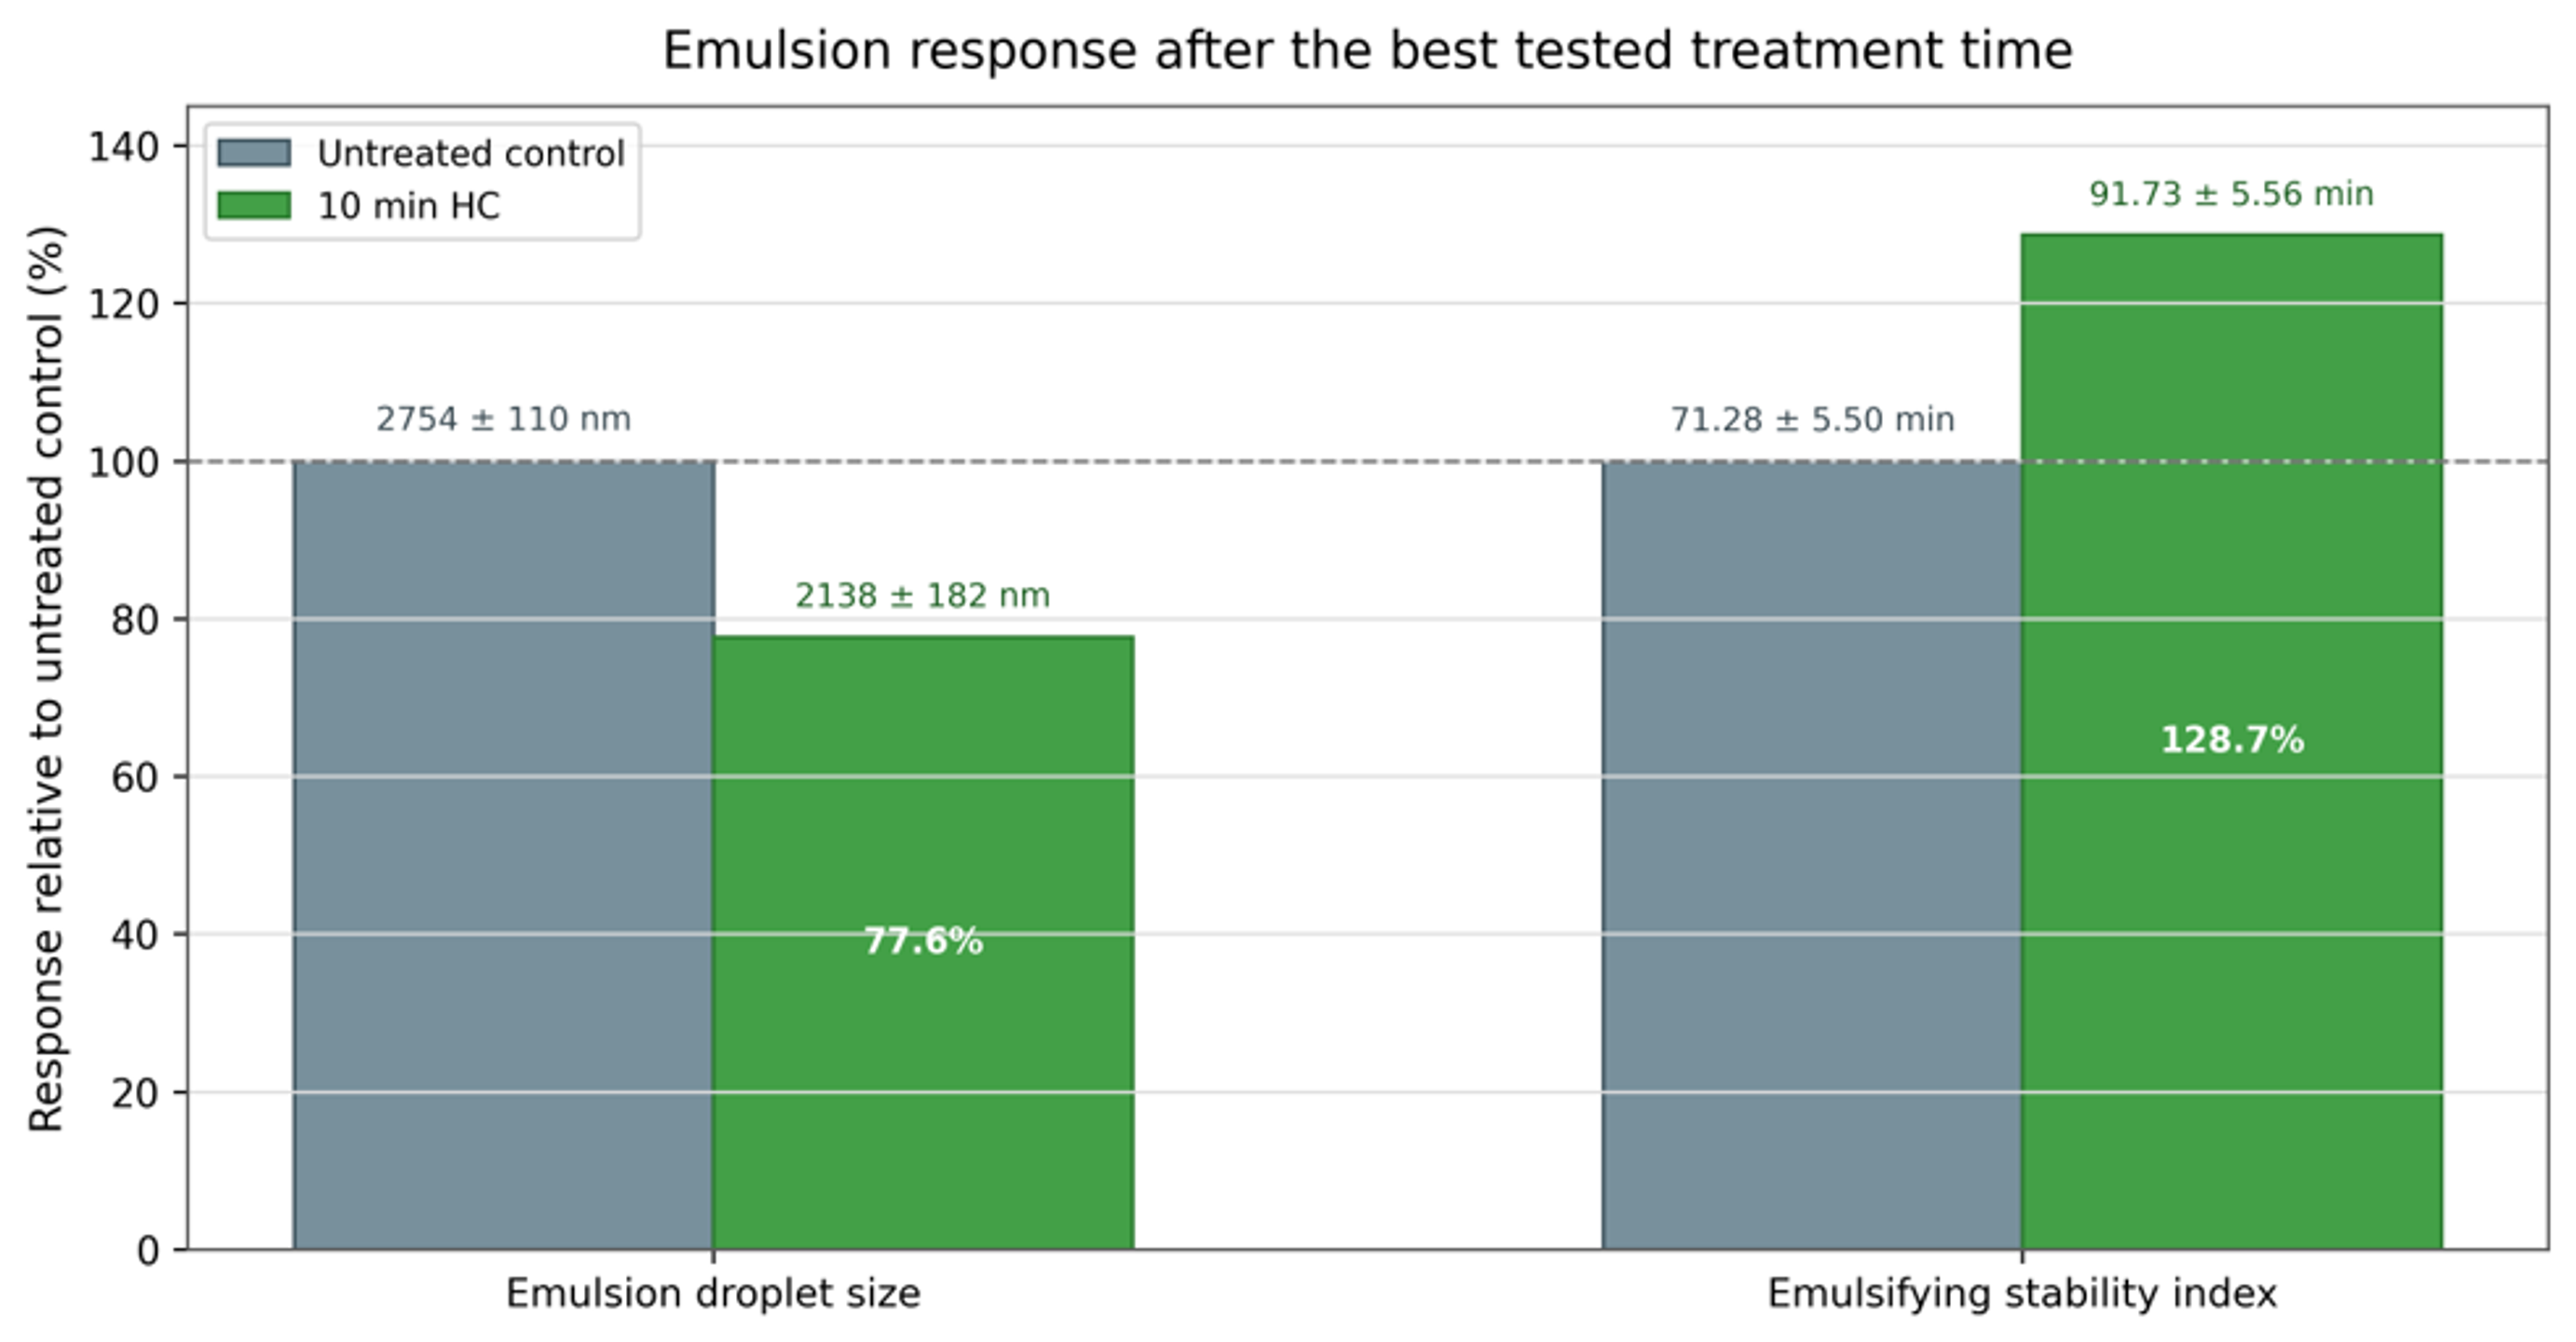
Figure 21. Emulsion droplet size and emulsifying stability index after 10 min of hydrodynamic cavitation, normalized to the untreated control. Exact reported values are shown above the bars [49].
Stability should be tested under the intended storage and distribution conditions. A short visual test is insufficient for nanoemulsion. Recommended measurements include droplet size at multiple ages, centrifugation, temperature cycling, freeze thaw if relevant, zeta potential where electrostatic stabilization is used, rheology, oxidative markers for unsaturated oils, active ingredient retention, and microbial quality for water rich products.
6.7 Inlet pressure and processing time in Venturi reactors
Ramisetty, Pandit, and Gogate used circular and slit Venturis to prepare coconut oil in water emulsions [35]. For a circular Venturi, increasing inlet pressure from 5 to 10 bar sharply reduced droplet size and shortened the time to a stable plateau. Increasing to 20 bar produced a smaller early time diameter but gave limited additional benefit after sufficient passes. The result again demonstrates an optimum rather than an unlimited benefit from pressure.
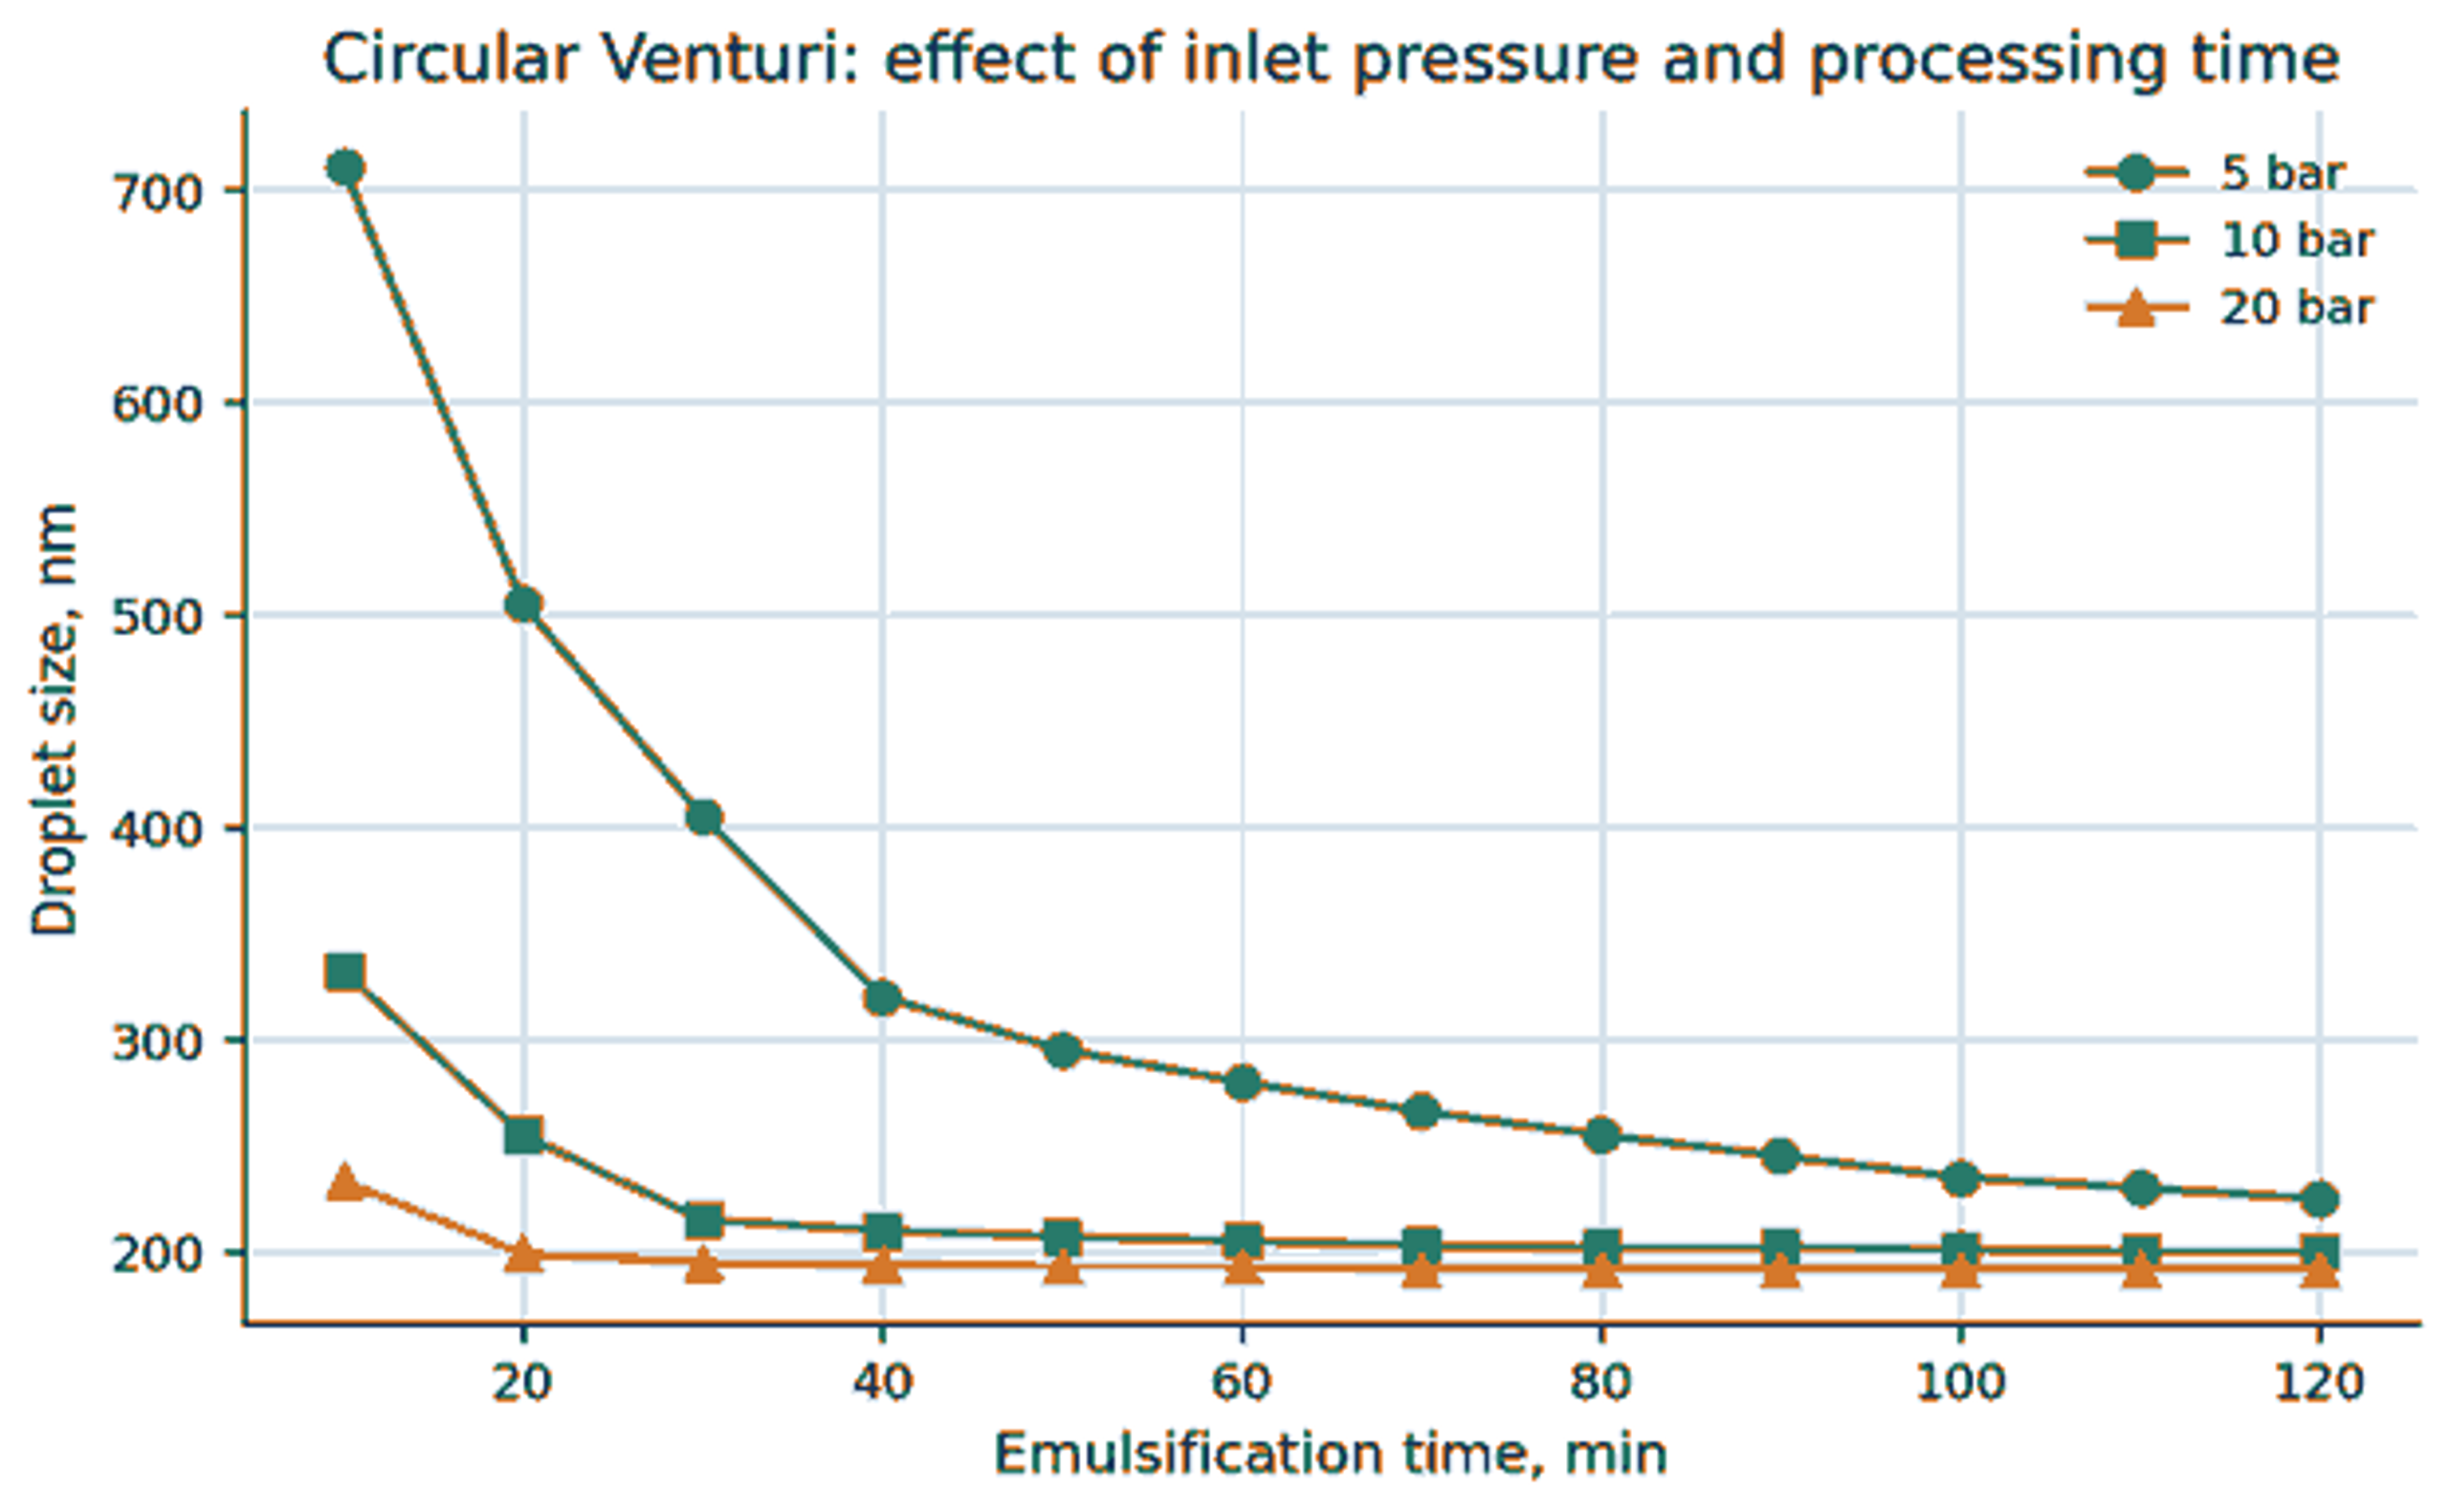
Figure 22. Circular Venturi: combined effect of inlet pressure and emulsification time on coconut oil droplet size [35].
At equal 5 bar pressure, the slit Venturi achieved a much smaller diameter than the circular Venturi because of higher flow, higher dissipated power, lower cavitation number, and more passes over the same time. A circular Venturi at 10 bar produced a similar trajectory to the slit Venturi at 5 bar, illustrating that geometry can substitute for pressure when it changes exposure and local flow favorably.
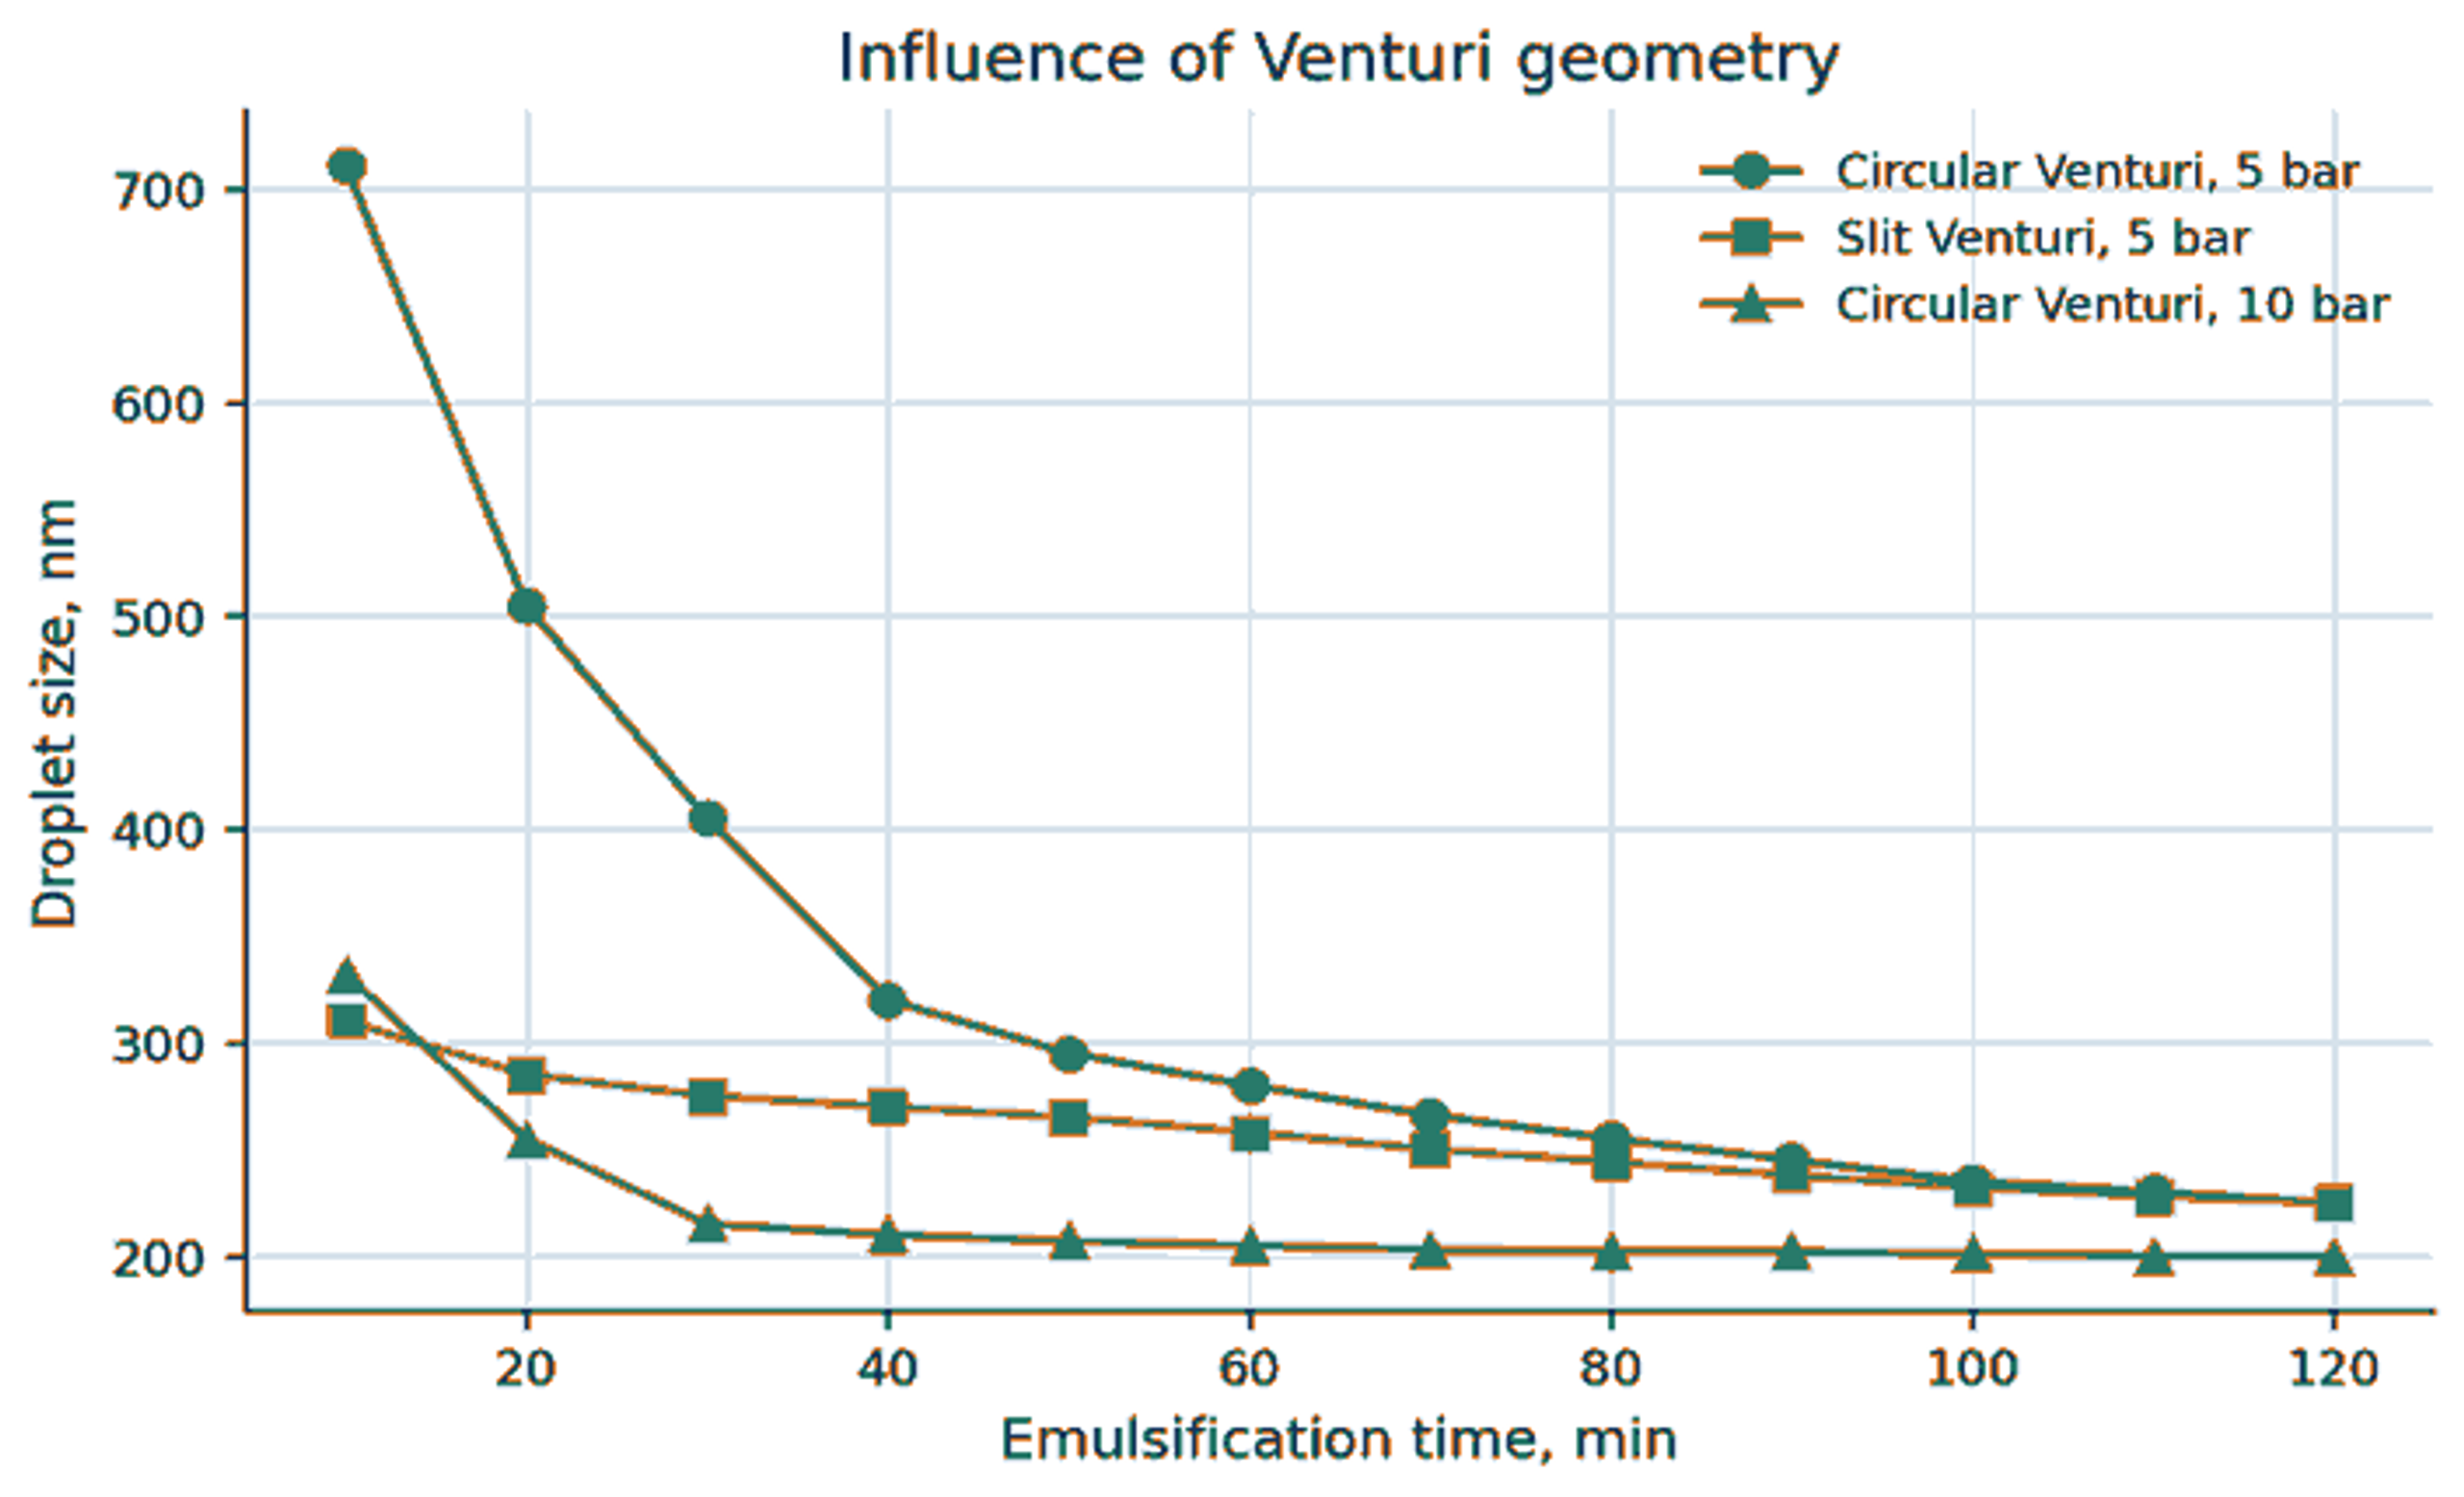
Figure 23. Comparison of circular and slit Venturi performance for coconut oil emulsification [35].
6.8 Evolution from broad to narrow distributions
Early passes through a cavitation device often produce a broad or bimodal distribution because some droplets encounter strong collapse events while others experience only weak stress. In the circular Venturi study, the mean diameter and polydispersity decreased as recirculation continued [35]. The breakup studies likewise show that increasing effective stress can shift breakup morphology and distribution, but stochastic exposure means that a single mean stress is insufficient to describe every droplet [26,27].
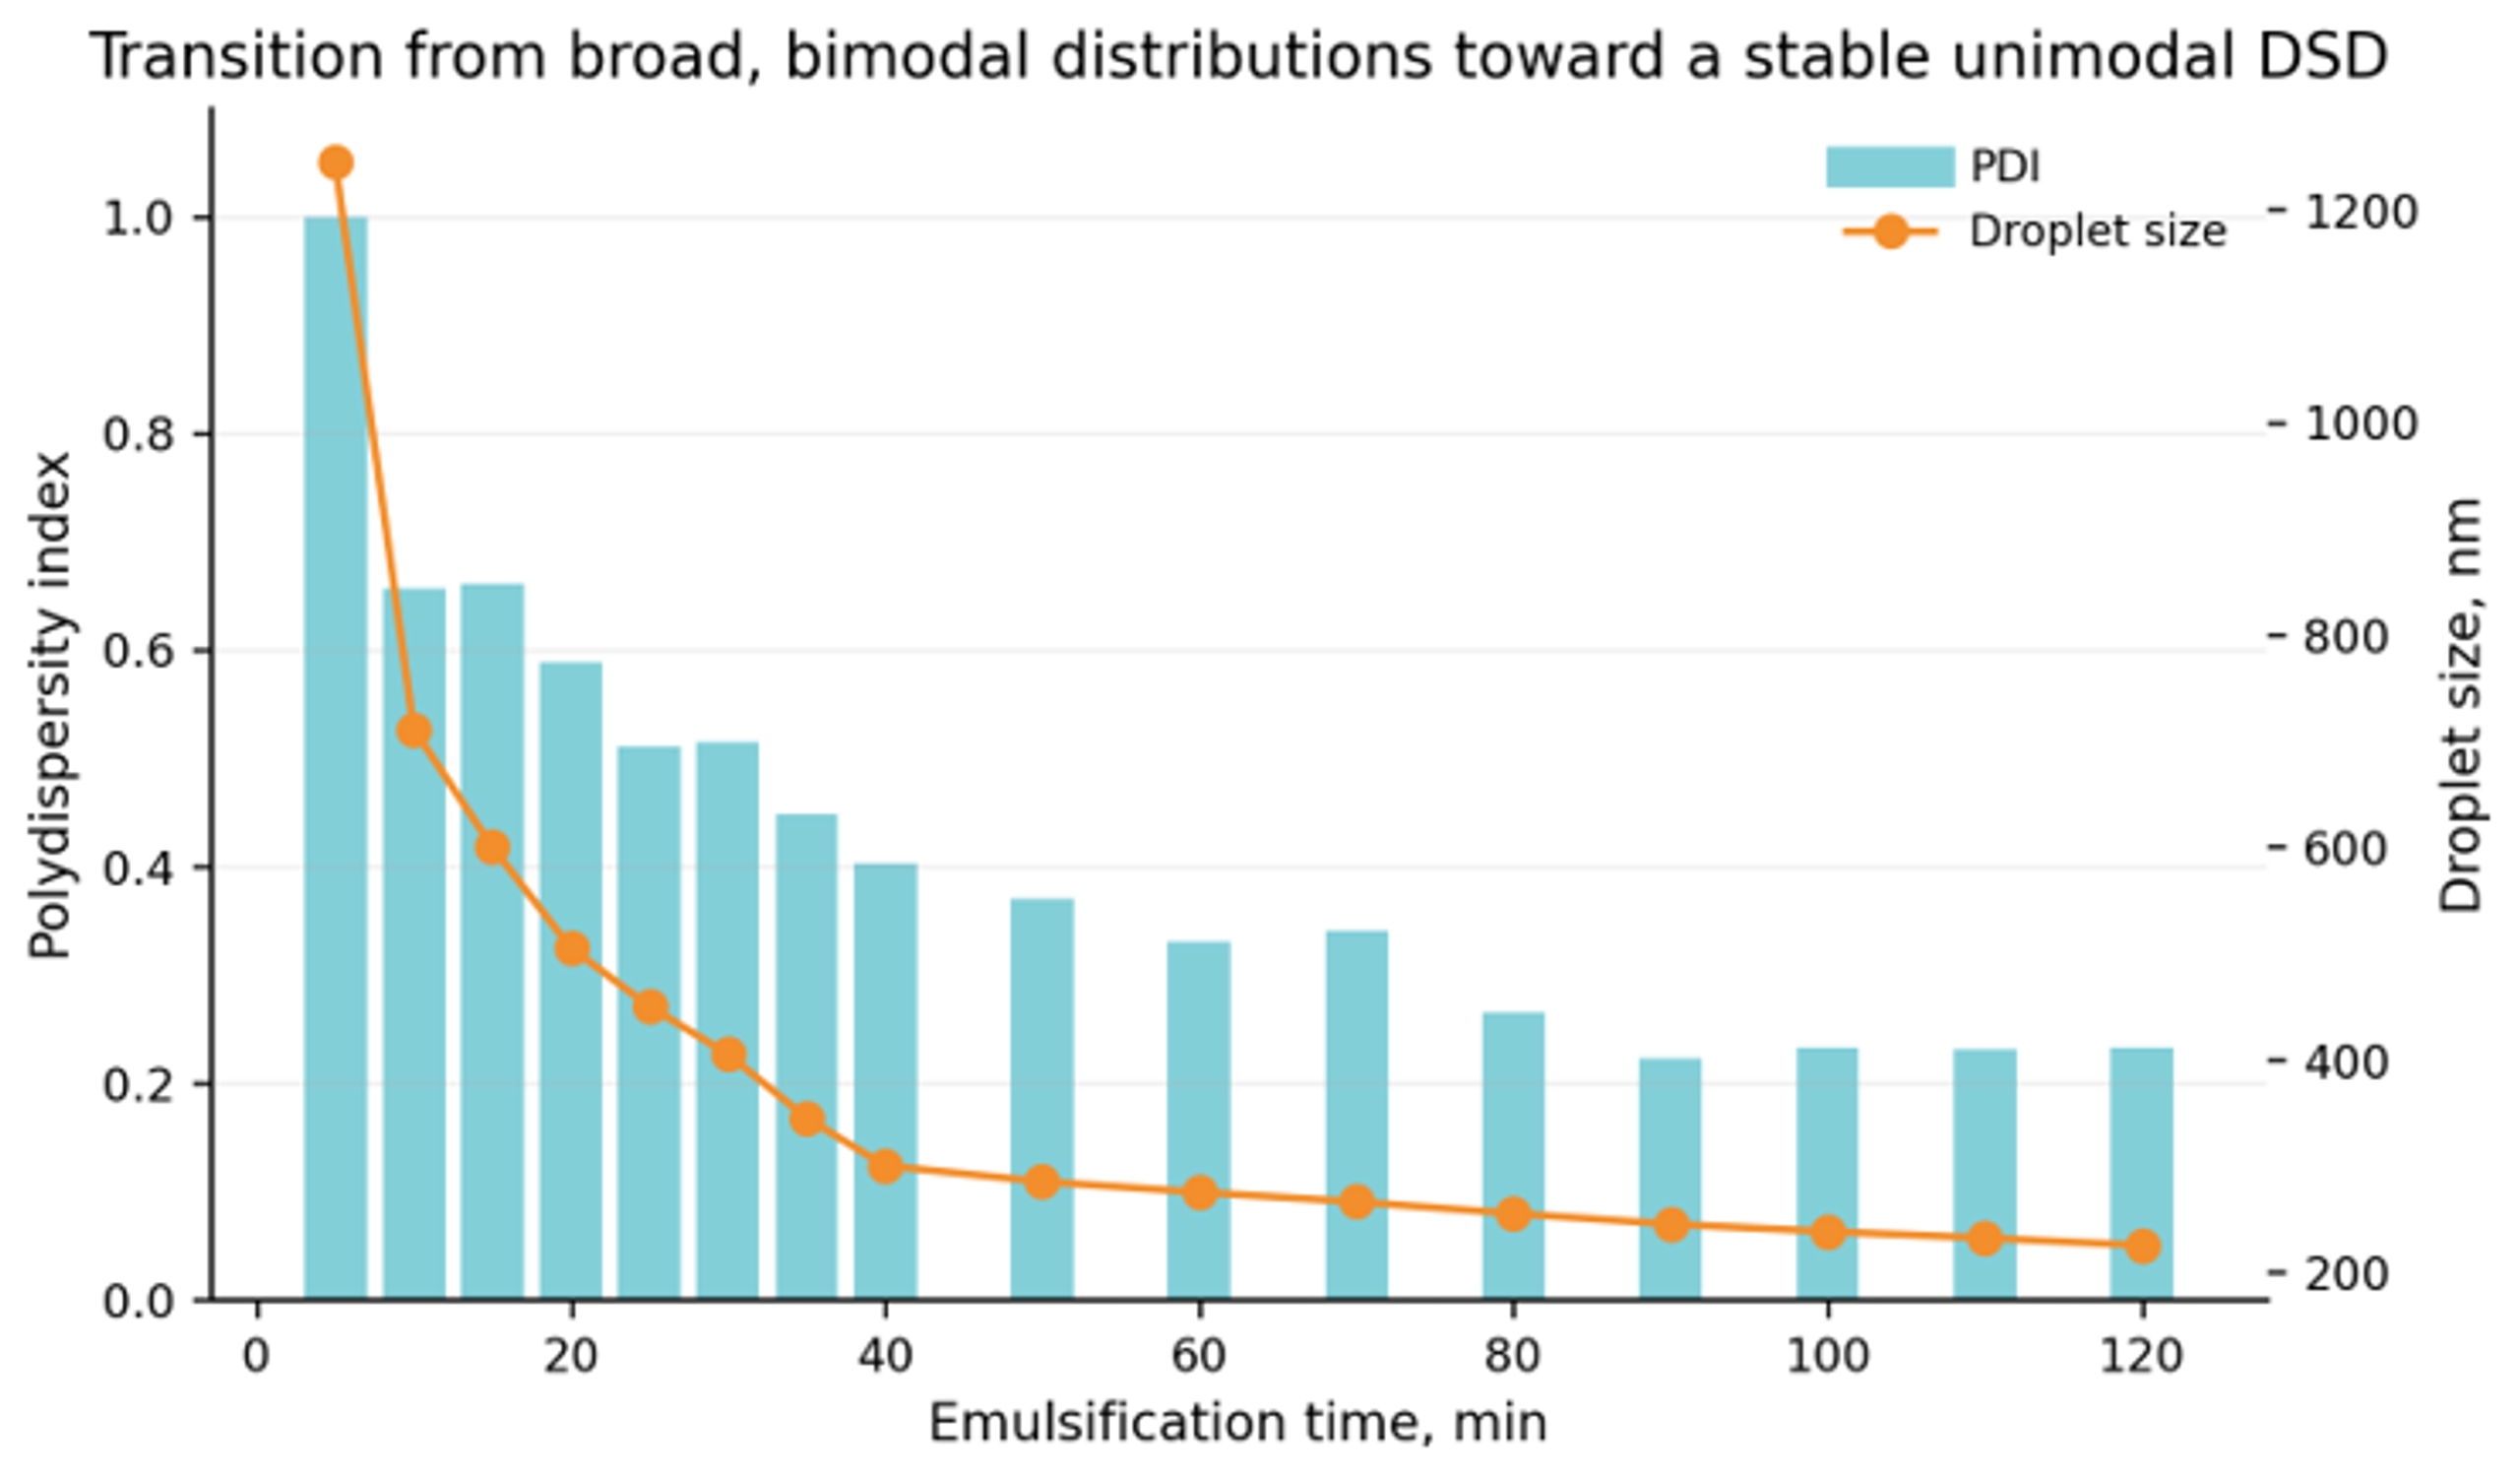
Figure 24. Transition from a broad, initially bimodal droplet size distribution toward a smaller and narrower distribution with increasing processing time [35].
6.9 Dispersed phase fraction and emulsifier loading
At fixed device conditions, increasing oil volume fraction increases the amount of interface that must be created and raises droplet collision frequency. Ramisetty et al. observed that increasing coconut oil fraction from 0.1 to 0.4 increased both the early time diameter and the time required to reach a stable plateau [35]. Increasing emulsifier fraction reduced interfacial tension and recoalescence, producing smaller final droplets until additional treatment gave little benefit.
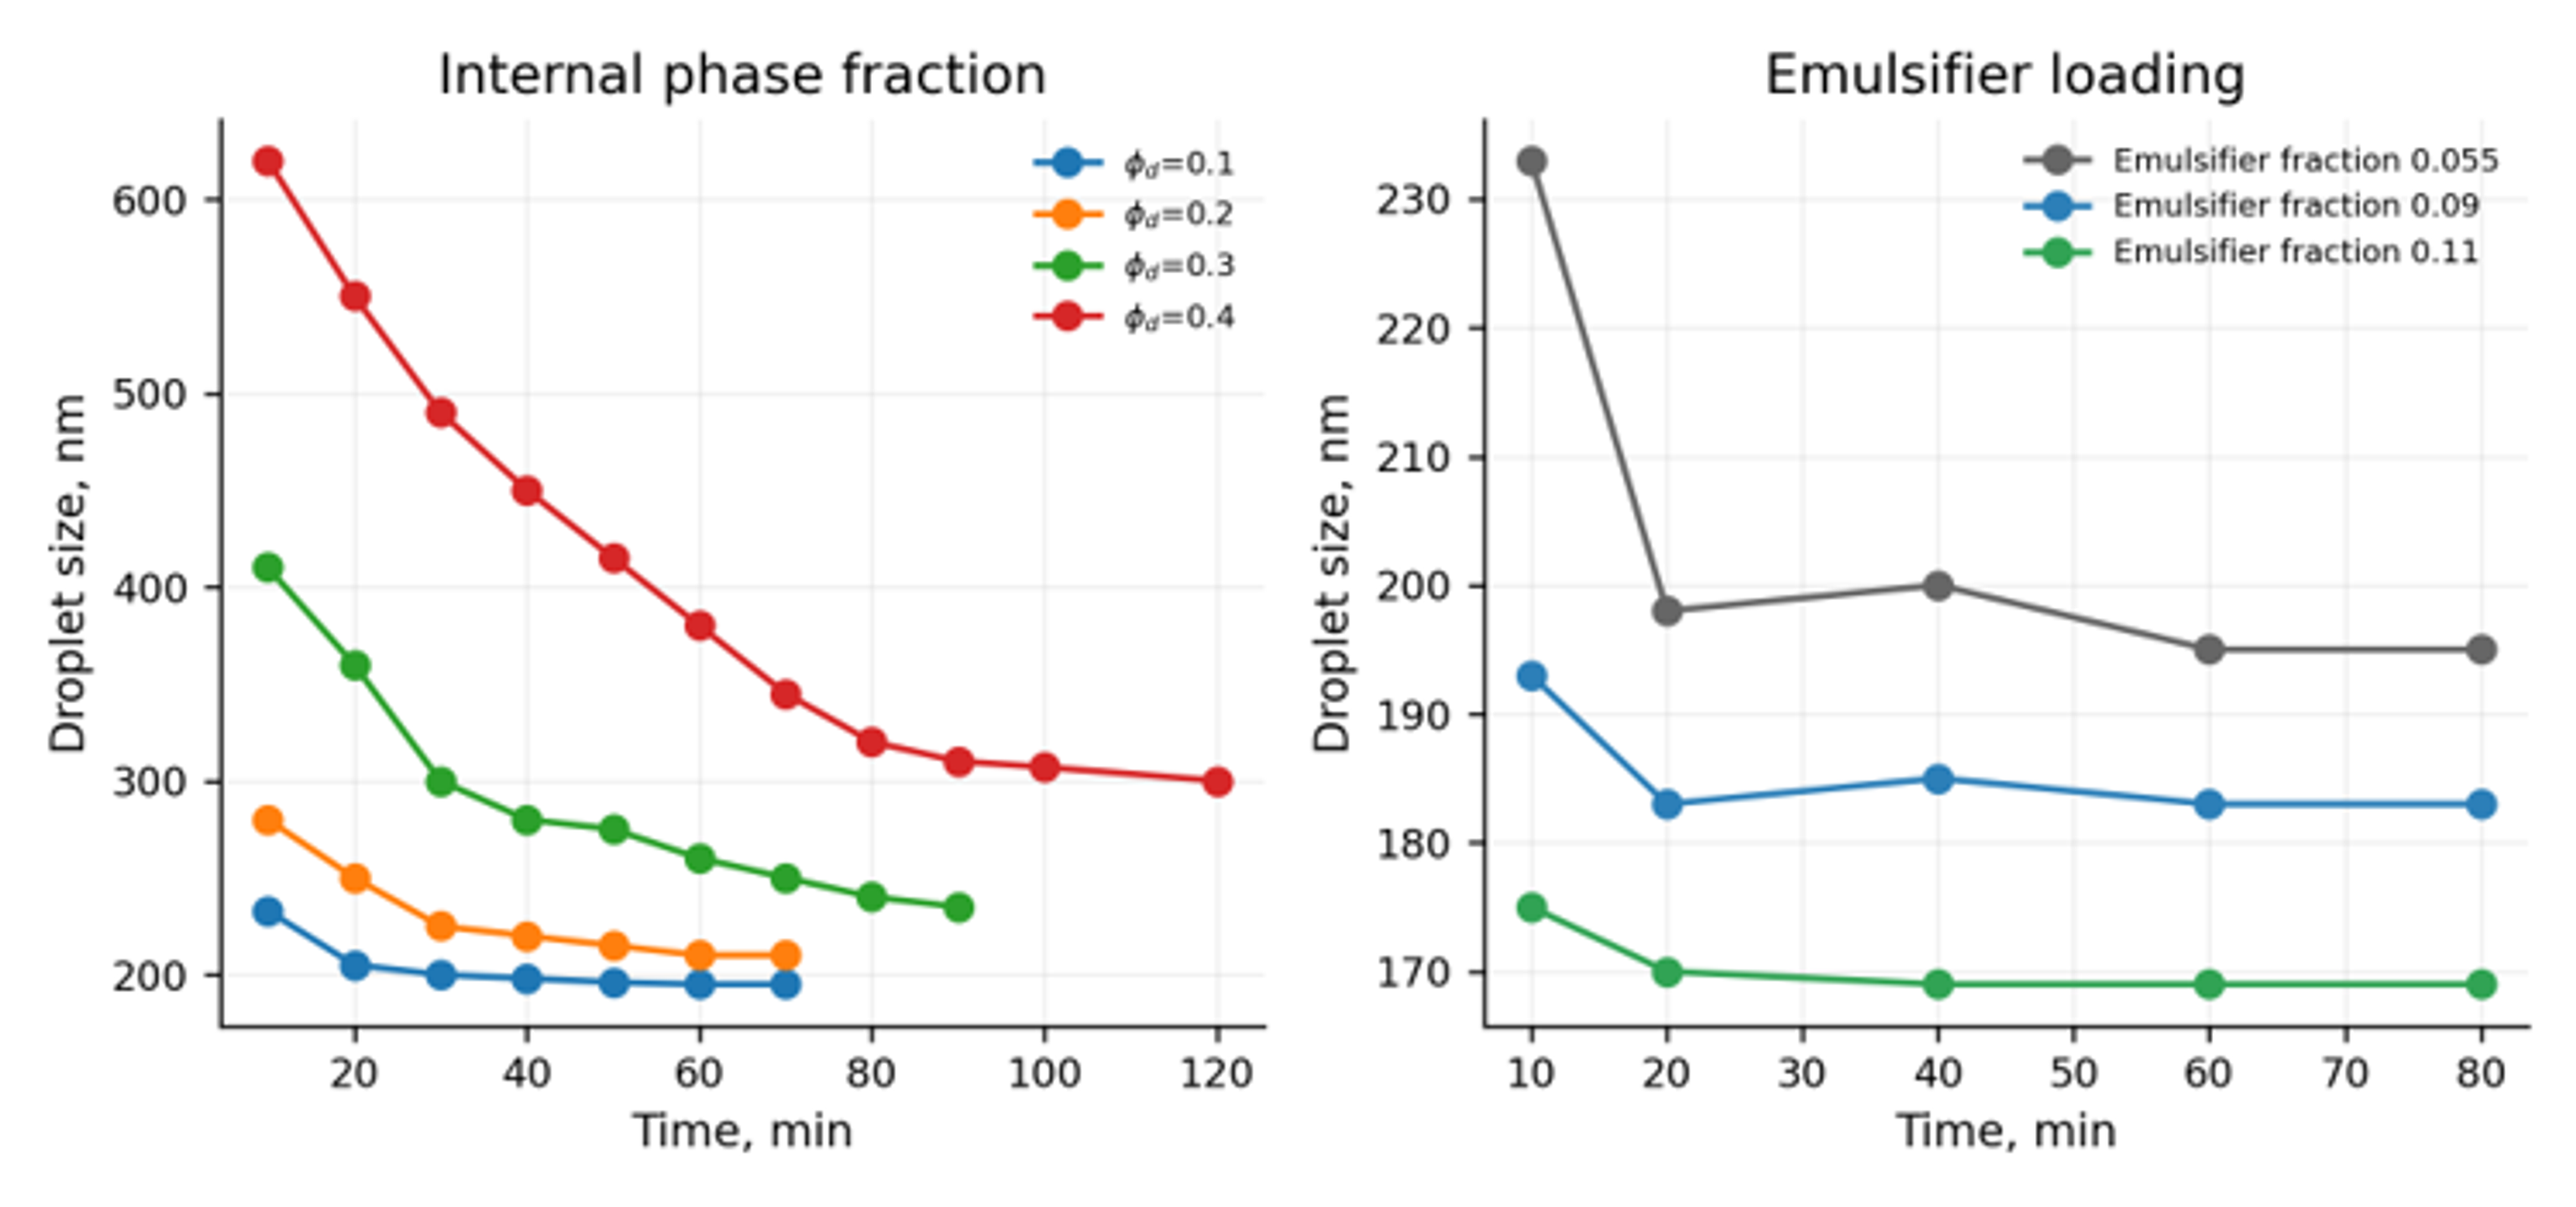
Figure 25. Effects of internal phase volume fraction and emulsifier loading on coconut oil emulsion droplet size [35].
Dense emulsions require additional care because viscosity can rise sharply, the continuous phase may become difficult to identify, and droplets can crowd the effective cavitation region. Upadhyay, Ravi, and Ranade studied rapeseed oil volume fractions up to 0.60 [24]. They found that was nearly independent of oil fraction up to a critical value and then increased approximately linearly. They also reported and breakup efficiency proportional to .
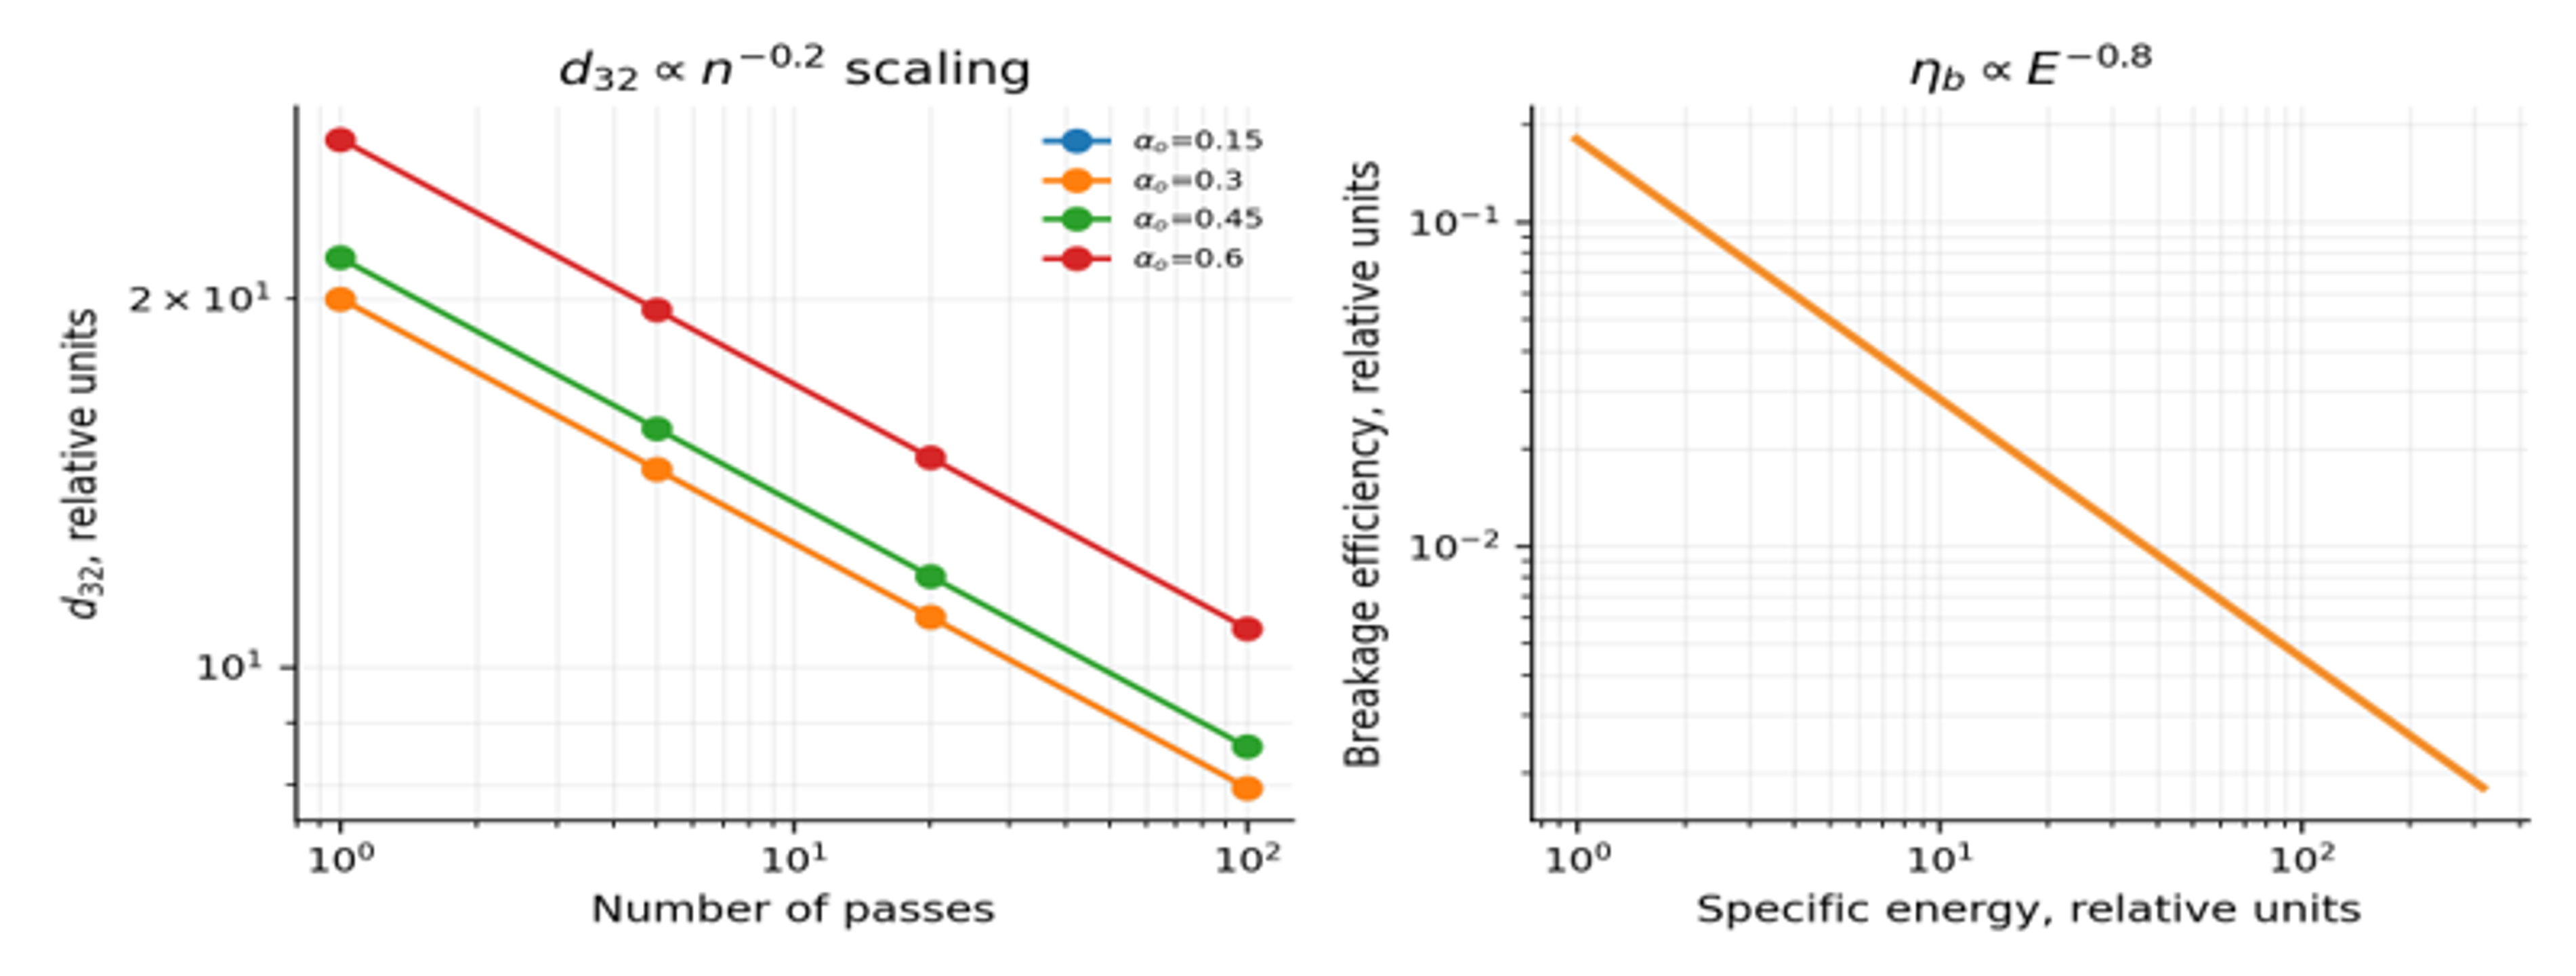
Figure 26. Reported scaling for dense oil in water emulsions in a vortex based cavitation device: pass number dependence, declining breakup efficiency with energy, and the effect of oil fraction beyond a critical value [24].
6.10 Temperature, dissolved gas, chemistry, and materials
Temperature changes vapor pressure, viscosity, density, interfacial tension, surfactant solubility, adsorption rate, oxidation rate, and the location of cavitation inception. A temperature increase can reduce viscosity and promote breakup, but it also increases vapor pressure and may weaken collapse at a fixed downstream pressure. For heat sensitive products, outlet temperature and cumulative thermal history must be controlled rather than assuming the process is nonthermal.
Dissolved and entrained gases provide nuclei and cushion collapse. Excess gas can broaden the bubble population, reduce collapse intensity, change pump performance, and cause foaming. Degassing may improve reproducibility in some systems, while gas addition may be useful when aeration is desired. The selected gas condition should therefore be treated as a controlled process variable.
Cavitation can generate reactive species in water and can accelerate oxidation of unsaturated lipids, fragrances, vitamins, polymers, or active pharmaceutical ingredients. Chemical compatibility tests should include peroxide value, anisidine value, dissolved oxygen, color, odor, molecular weight, or assay as appropriate. Metallic surfaces, elastomers, and coatings should be selected for corrosion, erosion, extractables, and cleaning chemistry. Austenitic stainless steels are common for sanitary service; hardened alloys, ceramics, or replaceable inserts may be required at high intensity edges.
Table 9. Process variables, expected effects, and diagnostic measurements.
| Variable | Expected effect when increased | Possible adverse effect | Recommended measurement |
|---|---|---|---|
| Inlet pressure or pressure drop | More velocity, cavitation, and breakup up to an optimum | Heating, choked cavitation, erosion, pump load | Upstream and downstream pressure, flow, temperature, DSD |
| Backpressure | Stronger recovery collapse and shifted cavitation regime | Suppressed inception if excessive | Fast pressure trace and visual or acoustic regime indicator |
| Pass number | Lower mean size and narrower DSD initially | Diminishing returns, oxidation, heating | , , span, temperature rise, energy |
| Dispersed phase fraction | Higher production concentration | More collisions, viscosity, recoalescence, longer treatment | Phase fraction, rheology, DSD, pump curve |
| Emulsifier concentration | Faster stabilization and lower interfacial tension | Cost, taste, toxicity, micelles, phase inversion | Dynamic interfacial tension, coverage, product performance |
| Dispersed phase viscosity | Greater resistance to deformation | Coarser droplets and larger power requirement | Viscosity at process temperature and relevant shear rate |
| Continuous phase viscosity | Slower creaming and film drainage | Damped circulation and higher pressure loss | Rheology, Reynolds number, flow rate |
| Temperature | Lower viscosity and faster adsorption | Higher vapor pressure, oxidation, active degradation | Inlet/outlet temperature and cumulative thermal history |
| Dissolved gas | More nuclei and earlier inception | Collapse cushioning, foaming, variability | Dissolved oxygen or gas content, void fraction |
| Geometry | Controls local pressure, trajectory, and recovery | Clogging, bypass, erosion, difficult cleaning | CFD, pressure map, residence time distribution, pilot test |
Recent simplified modeling for continuous vortex based emulsification was validated over droplet sizes of approximately 1 to 100 µm, pressure drops of 50 to 250 kPa, and oil volume fractions of 0.05 to 0.45, with reported root mean square errors from 0.002 to 0.6 µm for the evaluated systems [28]. This is a valuable operating envelope, but it should not be extrapolated automatically to nanoemulsions below 100 nm, very high viscosities, or different cavitation architectures.
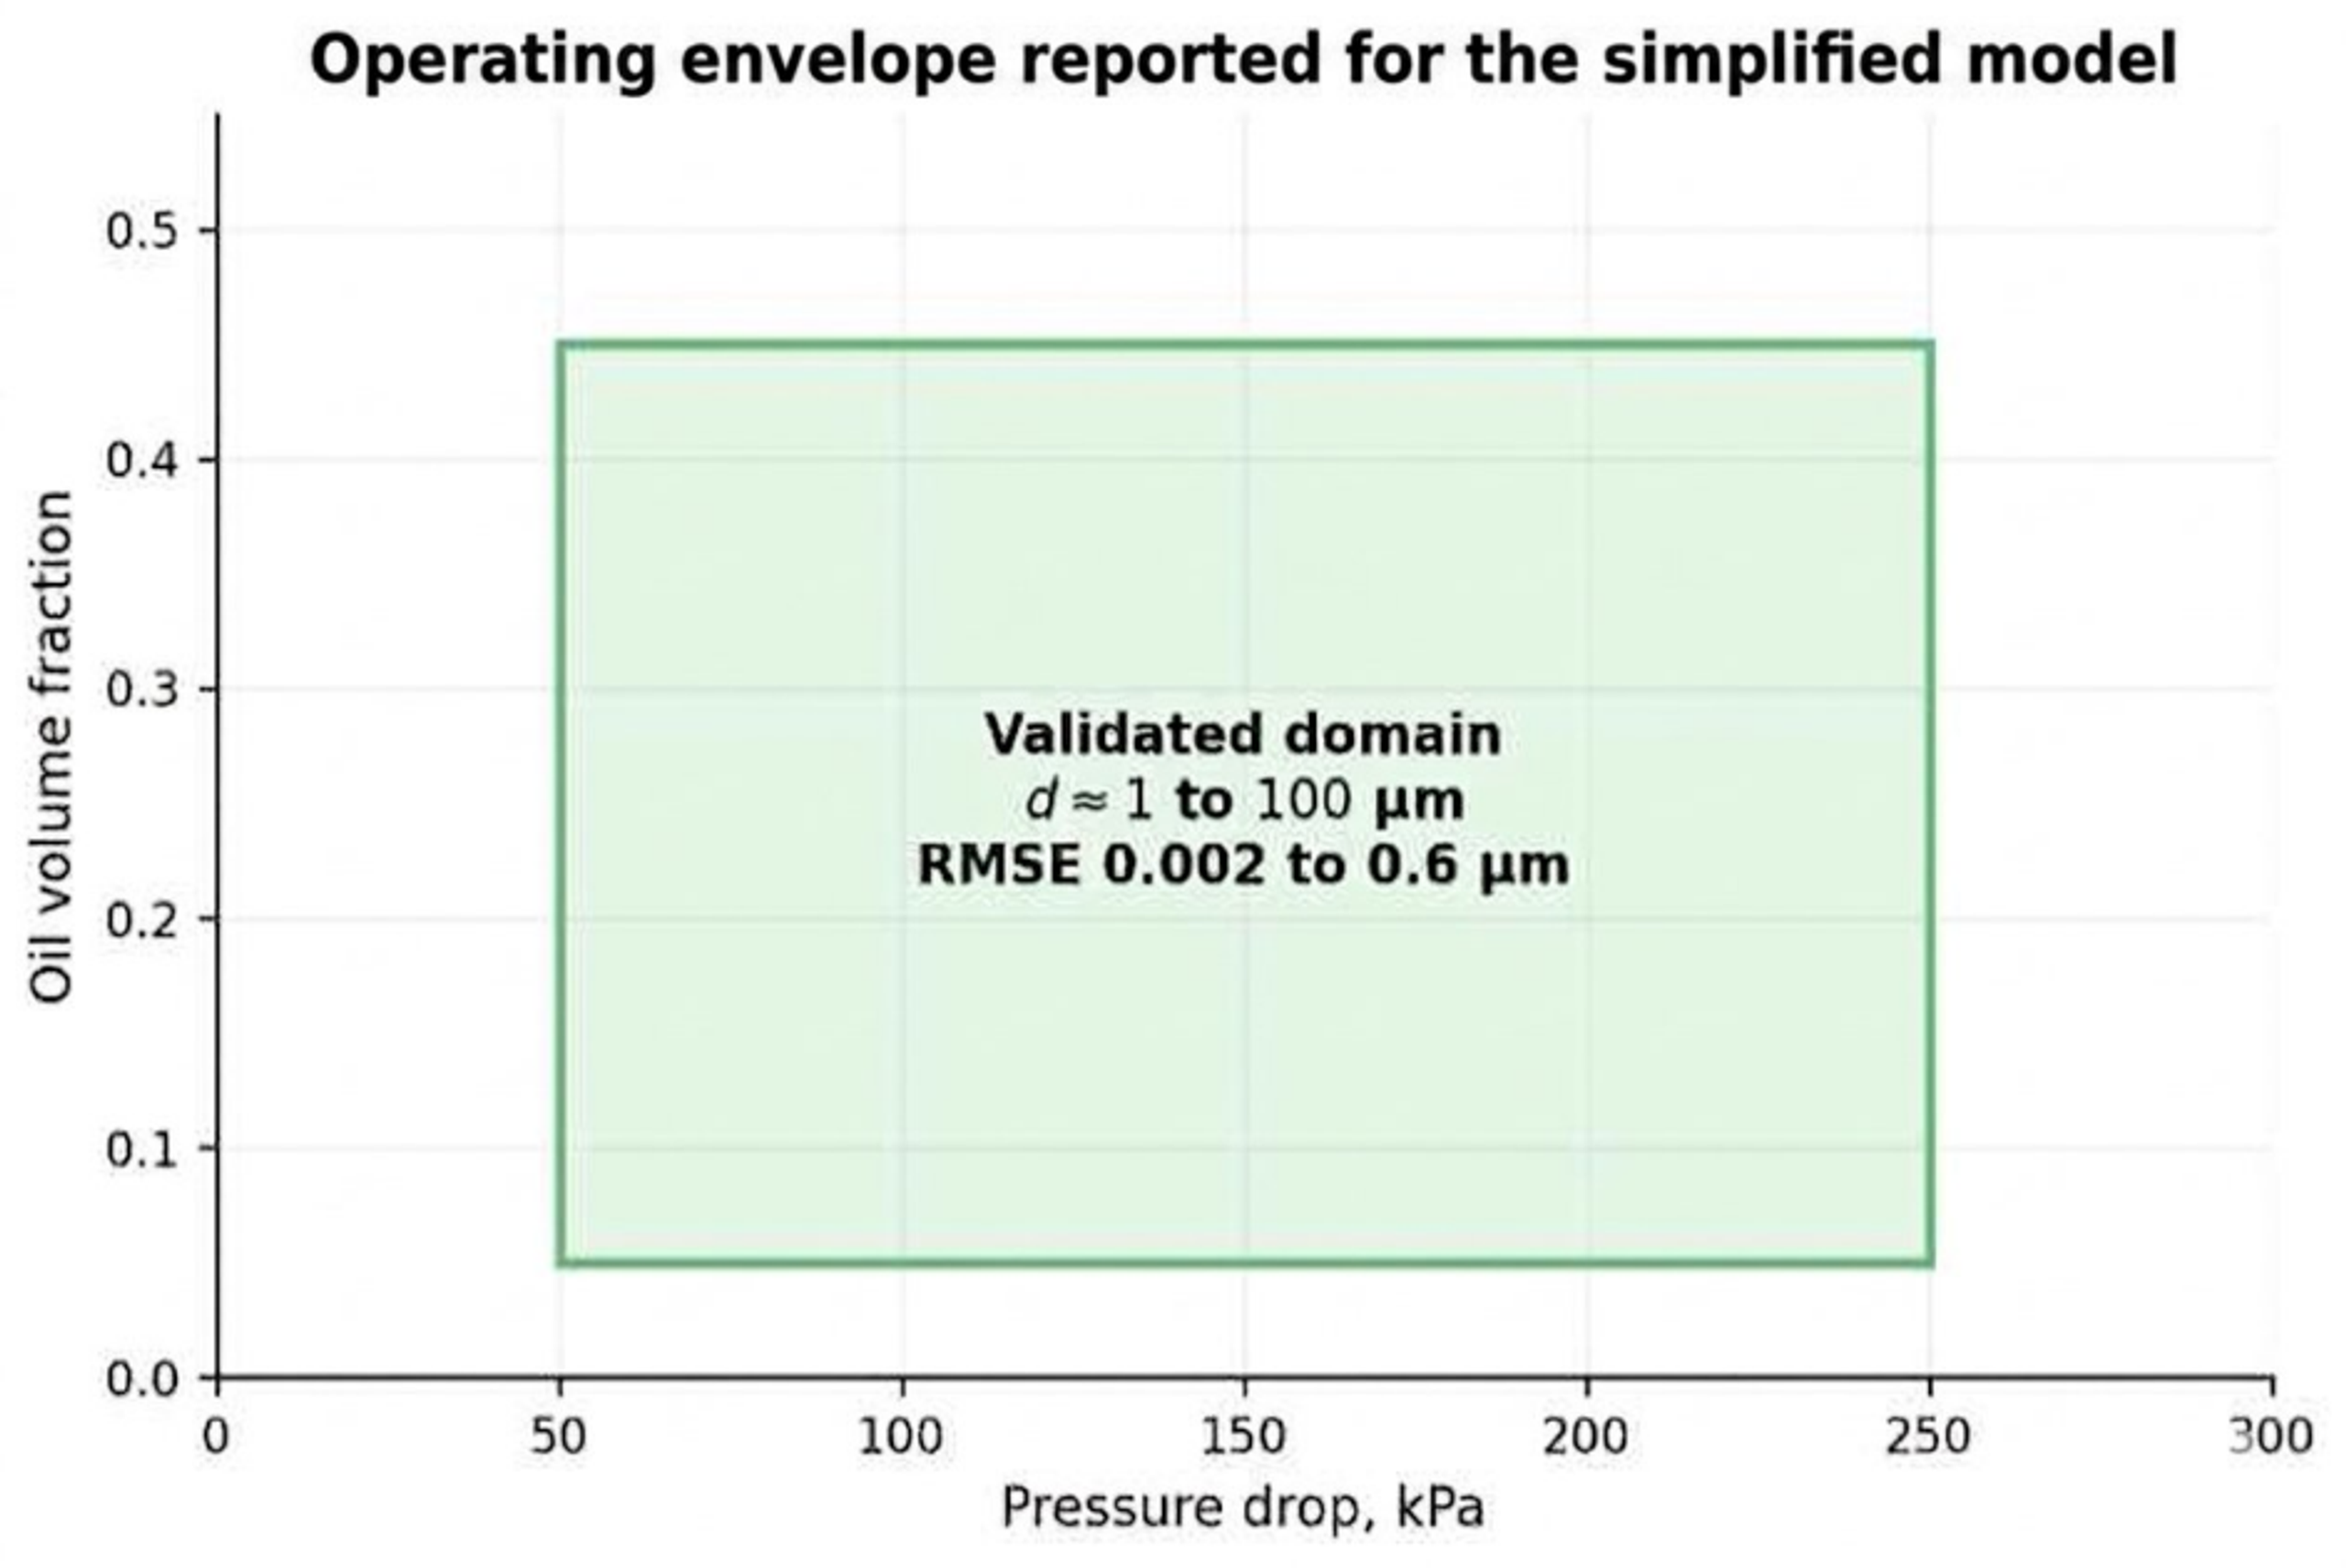
Figure 27. Reported validation envelope for the simplified continuous emulsification model [28].
7 Examples of Use for Emulsification and Homogenization
Hydrodynamic cavitation is best viewed as a platform. The same physical mechanism can produce a stable consumer emulsion, increase reagent contact in an industrial reaction, reduce milk fat globule size, disperse water in fuel, or improve extraction. Product requirements differ, so the target diameter and stability test must be defined for each application.
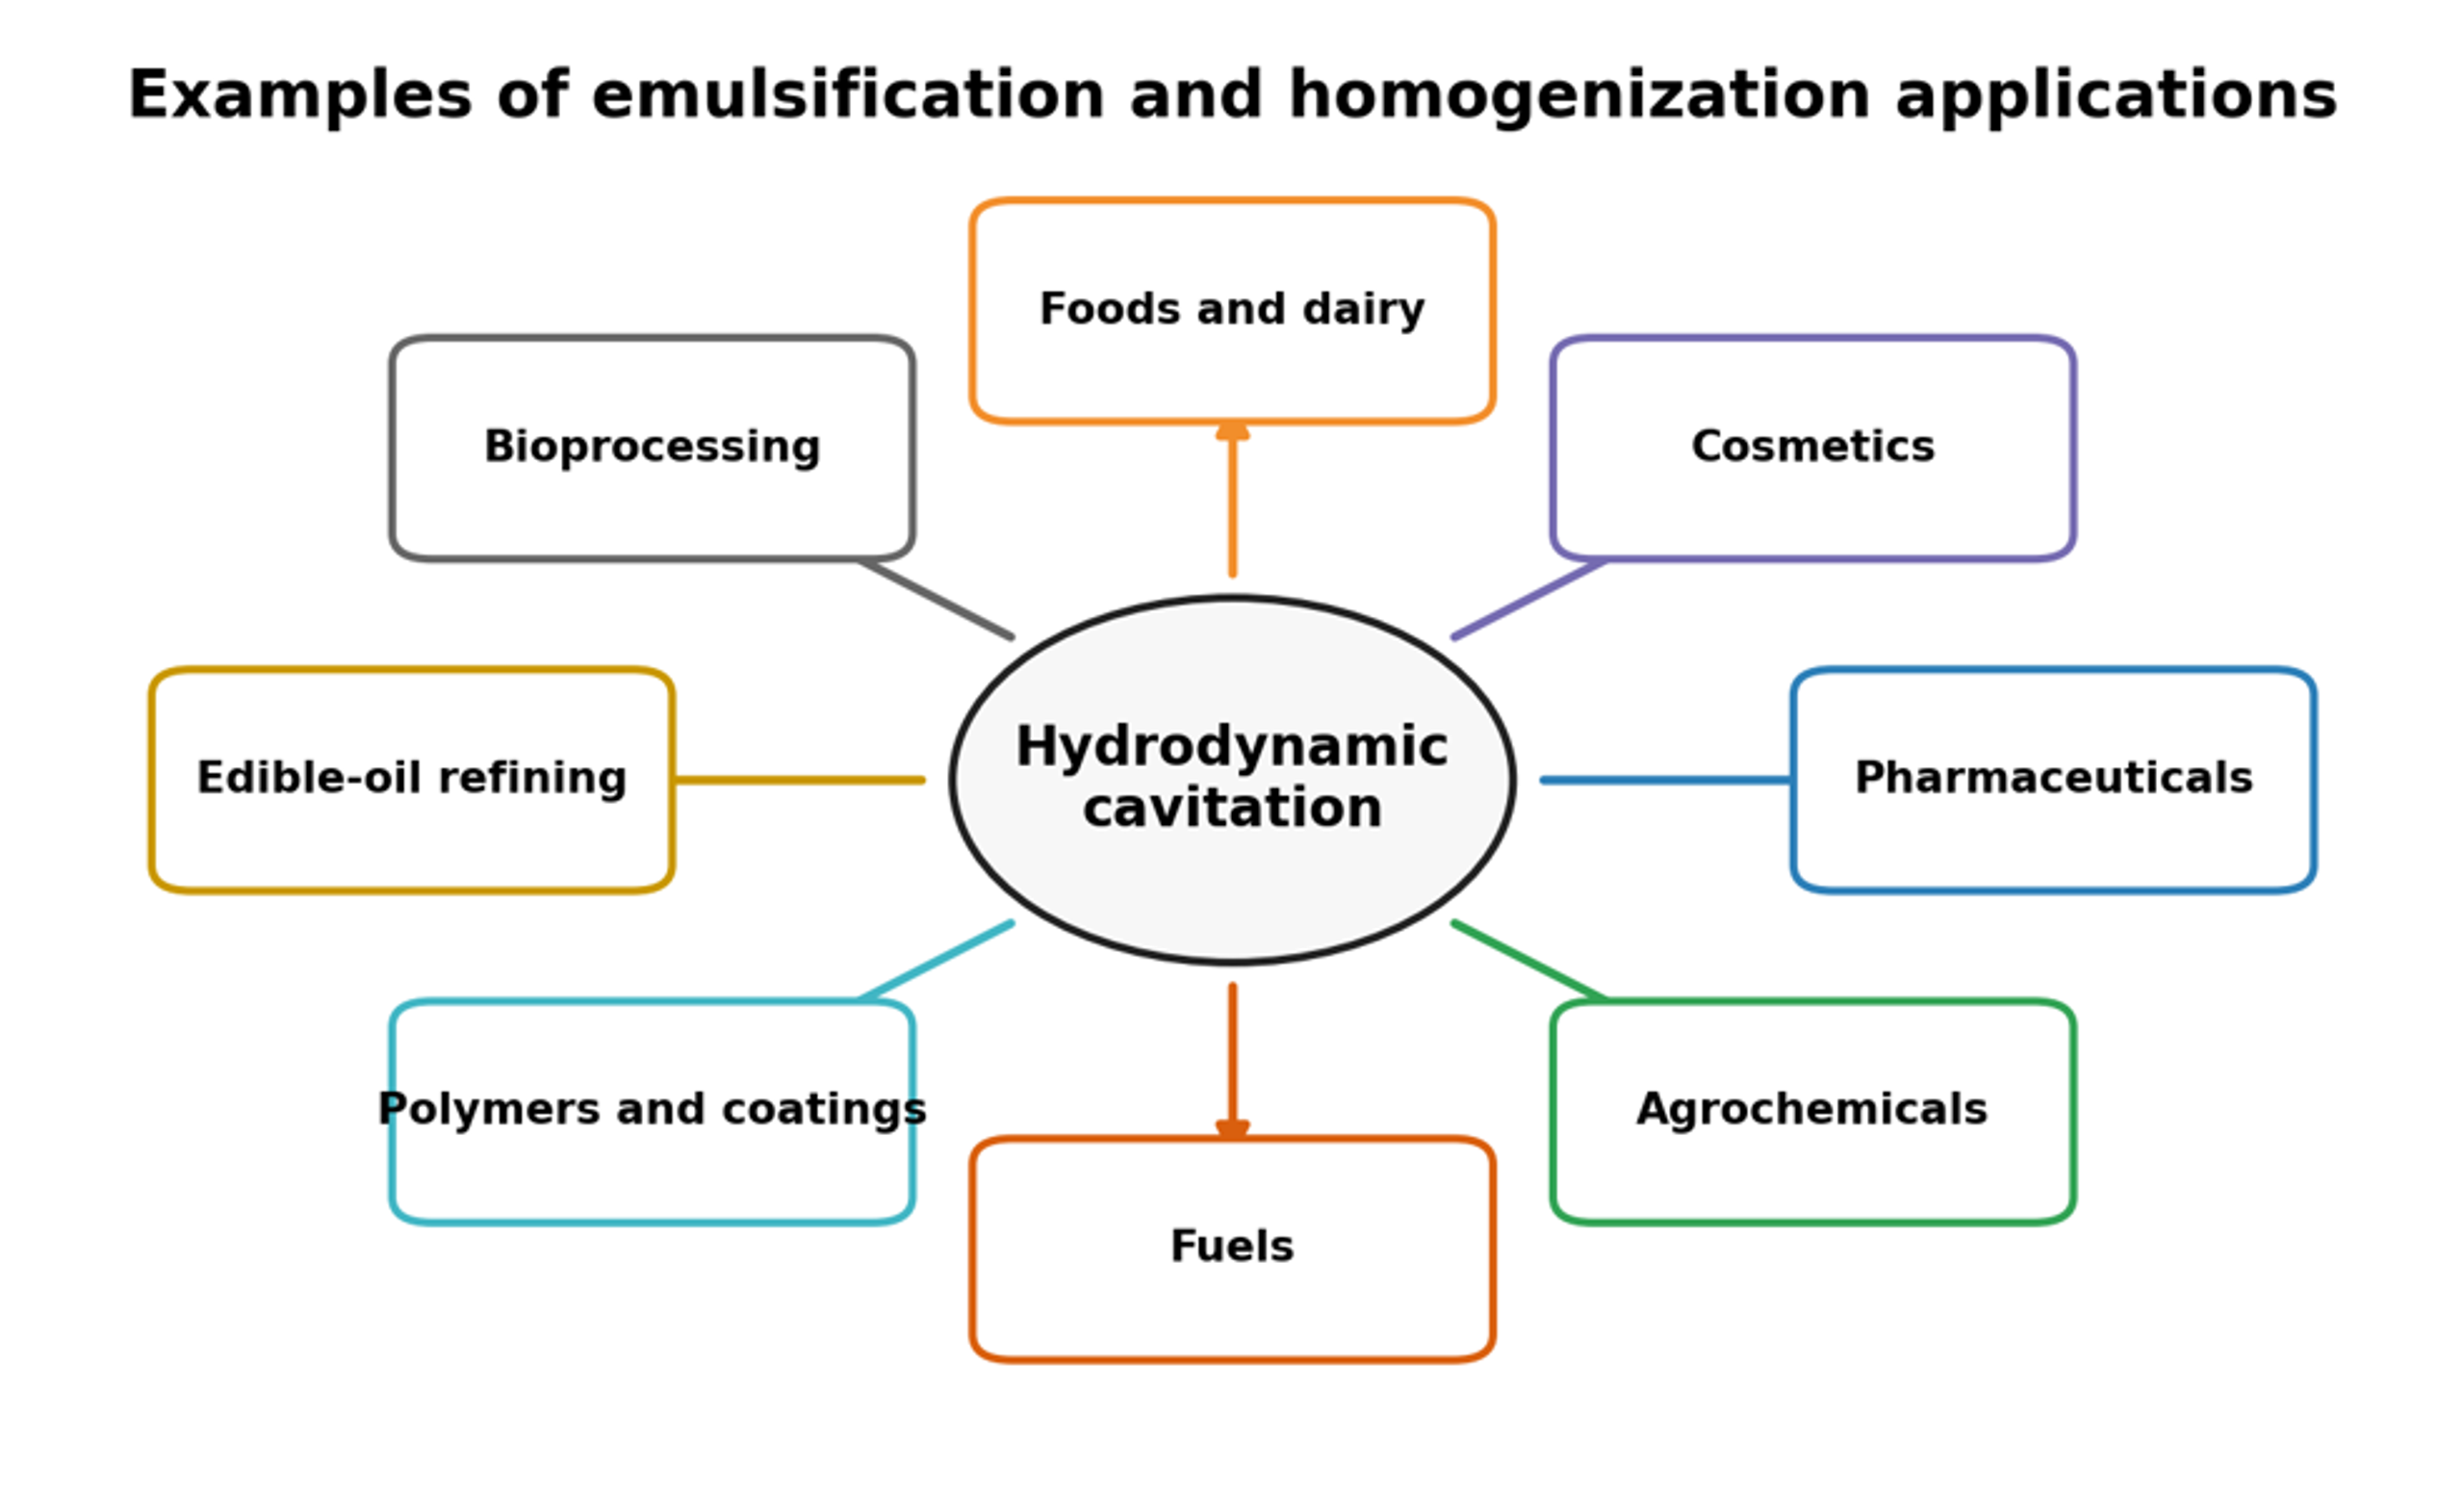
Figure 28. Representative application sectors for hydrodynamic cavitation emulsification and homogenization [9].
7.1 Results from High Pressure Cavitation Devices
Published Microfluidizer application data provide useful examples of one pass droplet size reduction in food and cosmetic formulations [50–54]. Because the reported performance depends on formulation and operating conditions, these data are most appropriately used to establish target validation parameters rather than as substitutes for pilot scale trials.
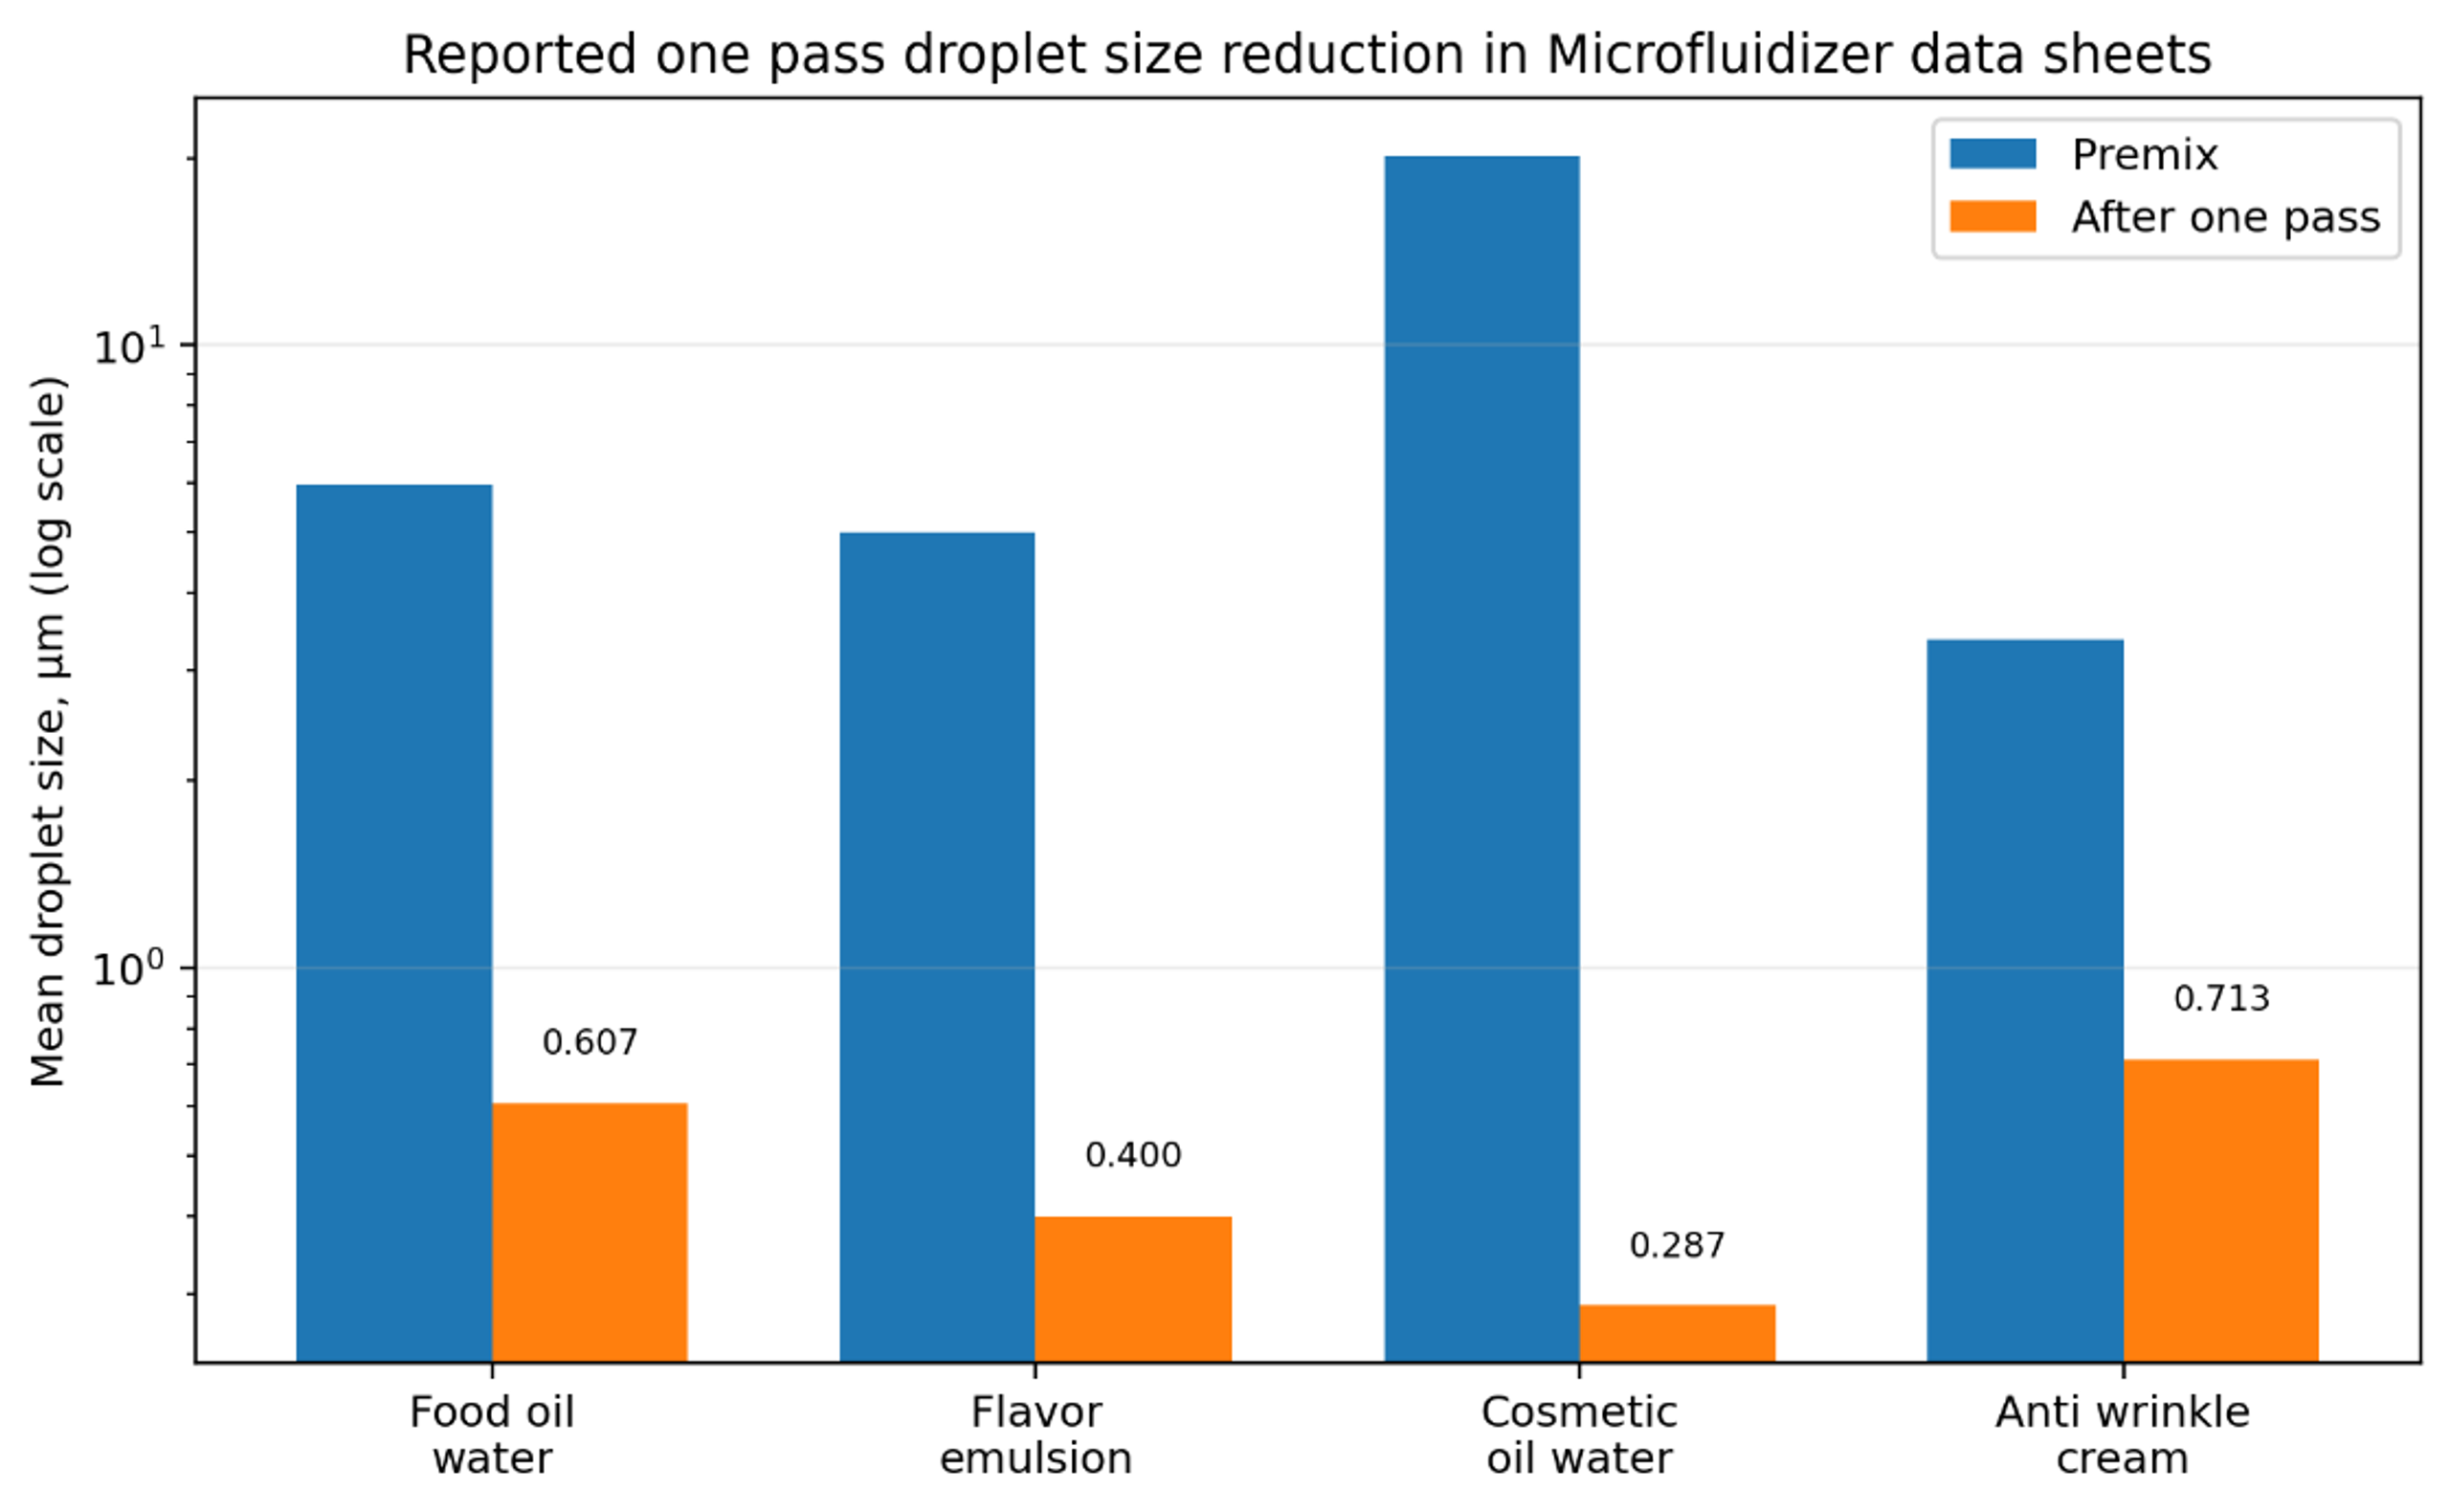
Figure 29. Comparison of reported premix and one pass mean droplet sizes for four Microfluidizer case studies [51–54].
Table 10. Reported one pass Microfluidizer case studies [51–54].
| Product | Pressure | Premix mean | One pass mean | Reported outcome |
|---|---|---|---|---|
| Food oil and water emulsion | 3,000 psi | 5.97 µm | 0.607 µm | D₉₀ reduced from 12.5 to 0.98 µm |
| Flavor emulsion | 18,000 psi | 5.0 µm | 0.40 µm | Stable at least five days at ambient or refrigerated conditions |
| Cosmetic 2% oil in water emulsion | 15,000 psi | 20.187 µm | 0.287 µm | Target below 0.3 µm achieved in one pass |
| Anti-wrinkle cream | 23,000 psi | 3.365 µm | 0.713 µm | Reported improvement in smoothness and product feel |
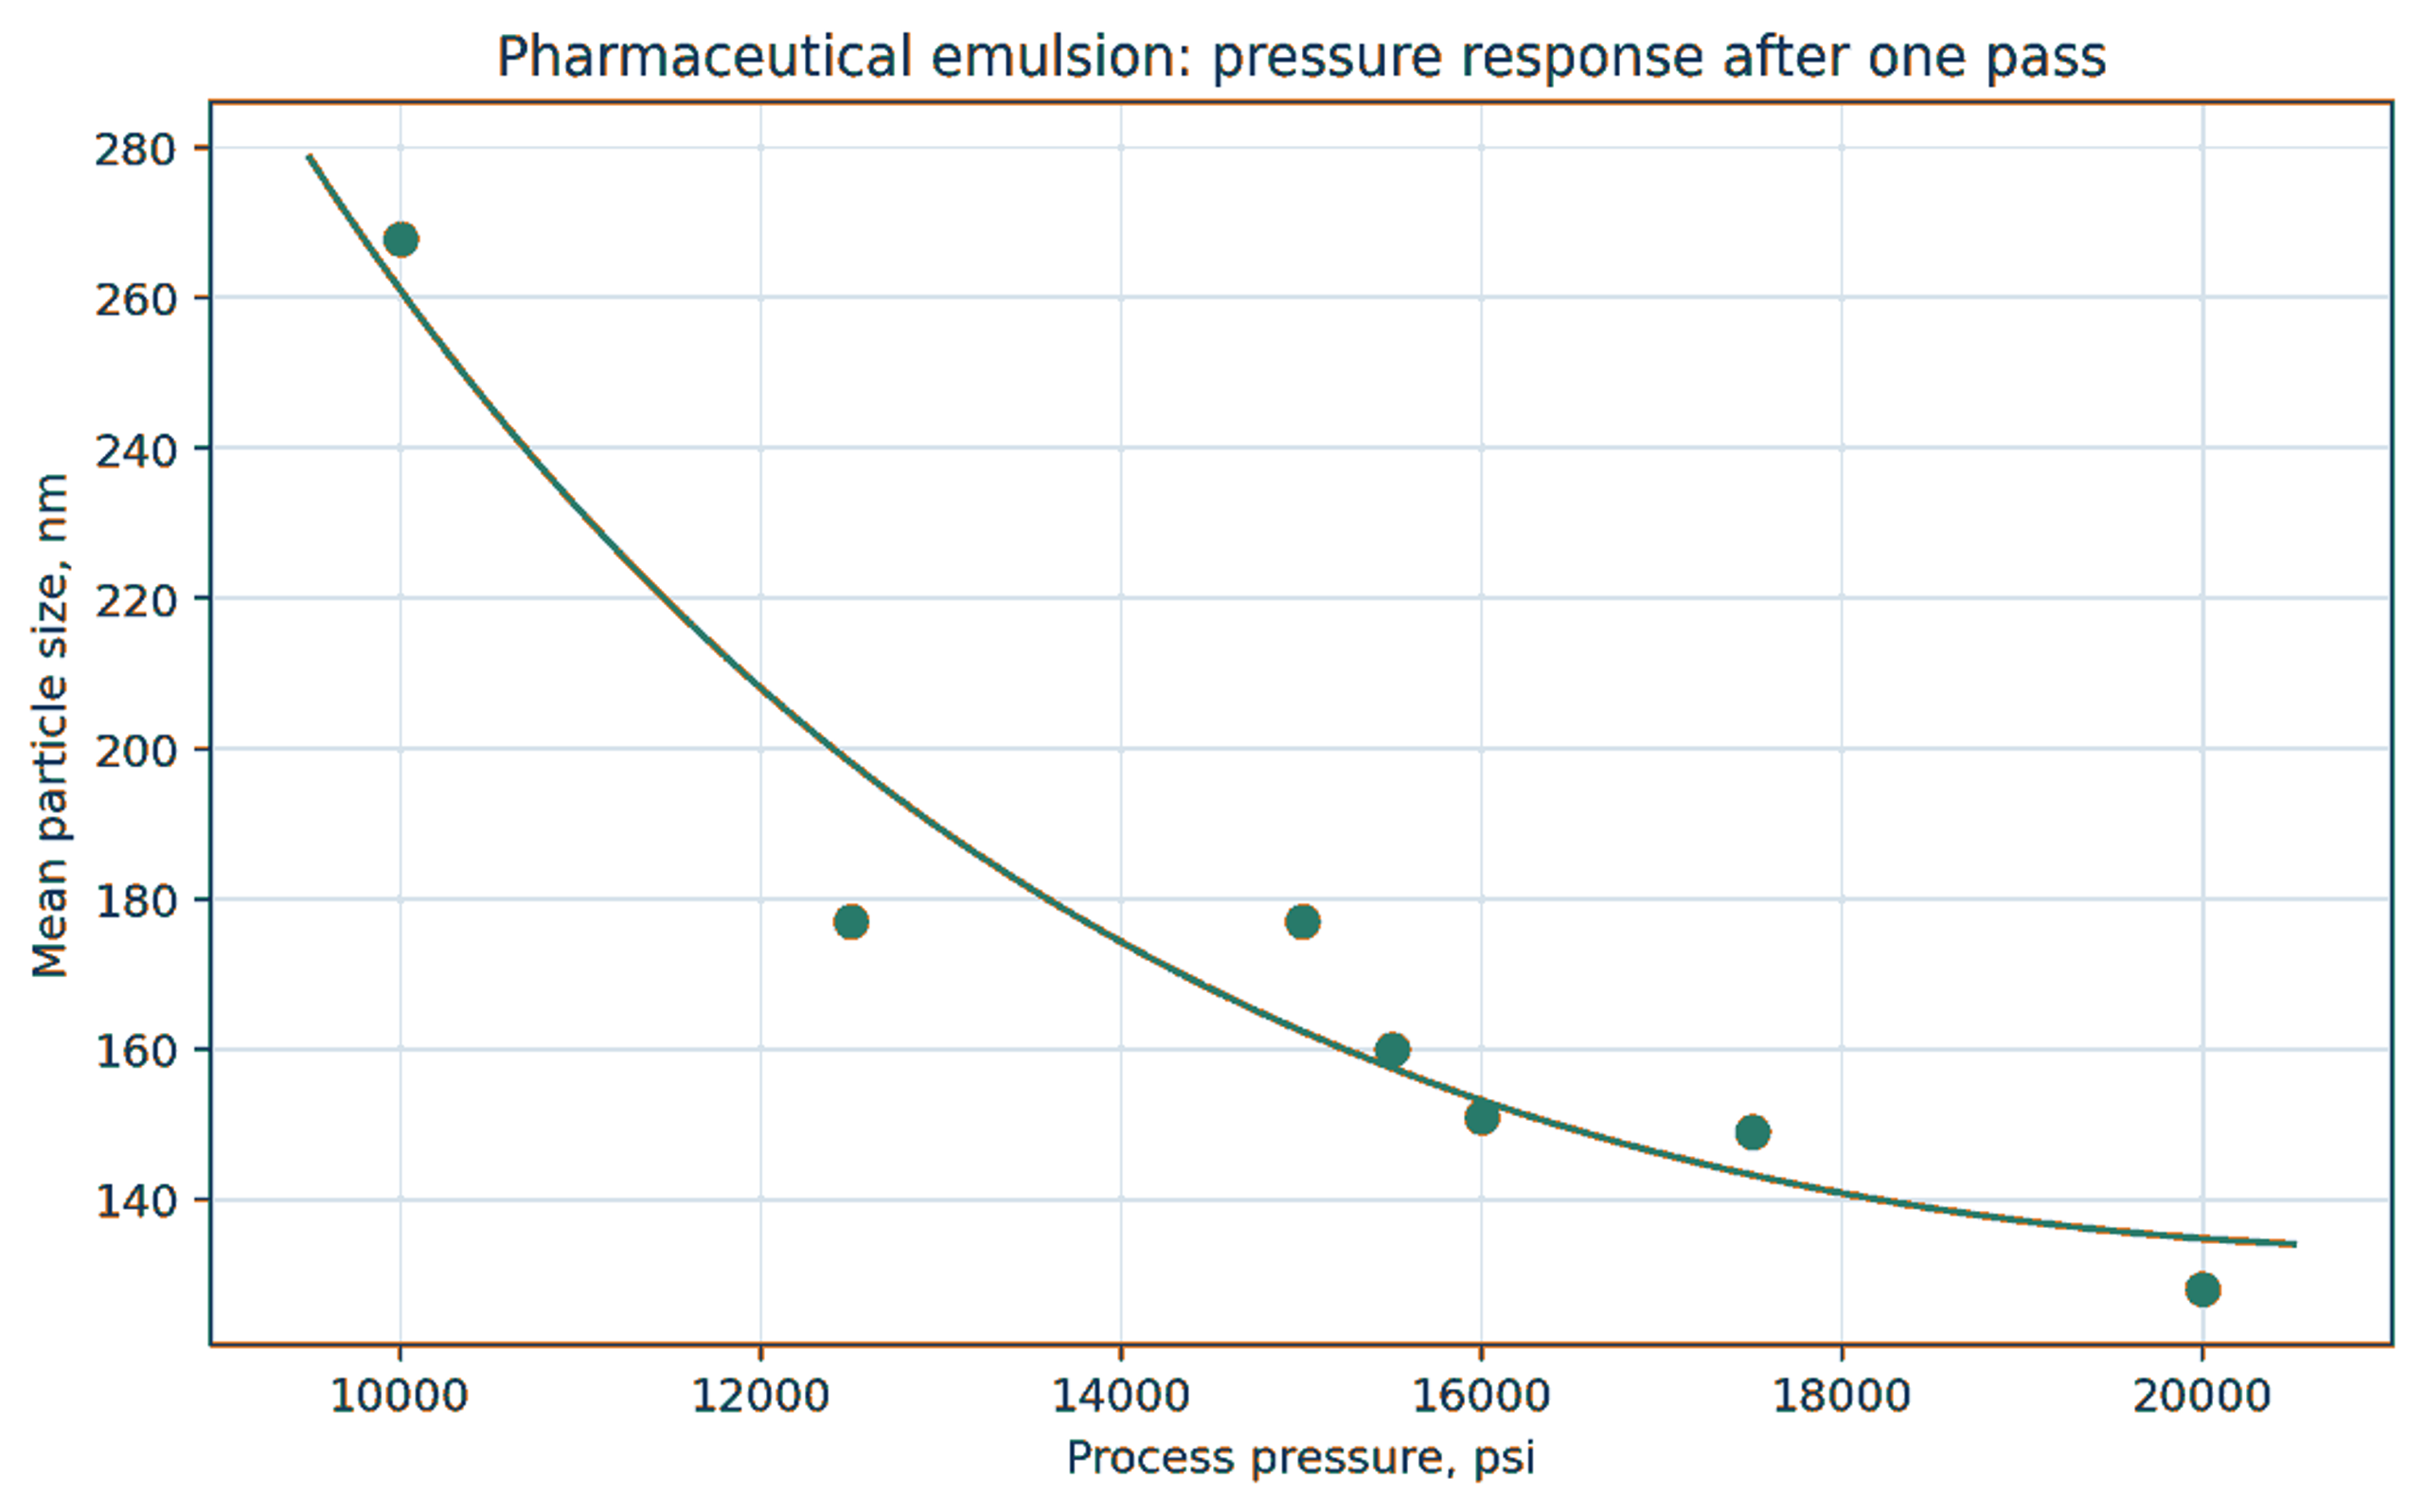
Figure 30. Approximate pressure response for a pharmaceutical emulsion processed once through an M110Y system [55].
The pressure response exhibits diminishing returns. Raising pressure from the lower end of the tested range caused a large reduction in mean size, while additional pressure produced progressively smaller gains. The same pattern appears in multiple pass cavitation systems because the coarse droplets are disrupted first and the remaining population is increasingly resistant to further breakup.
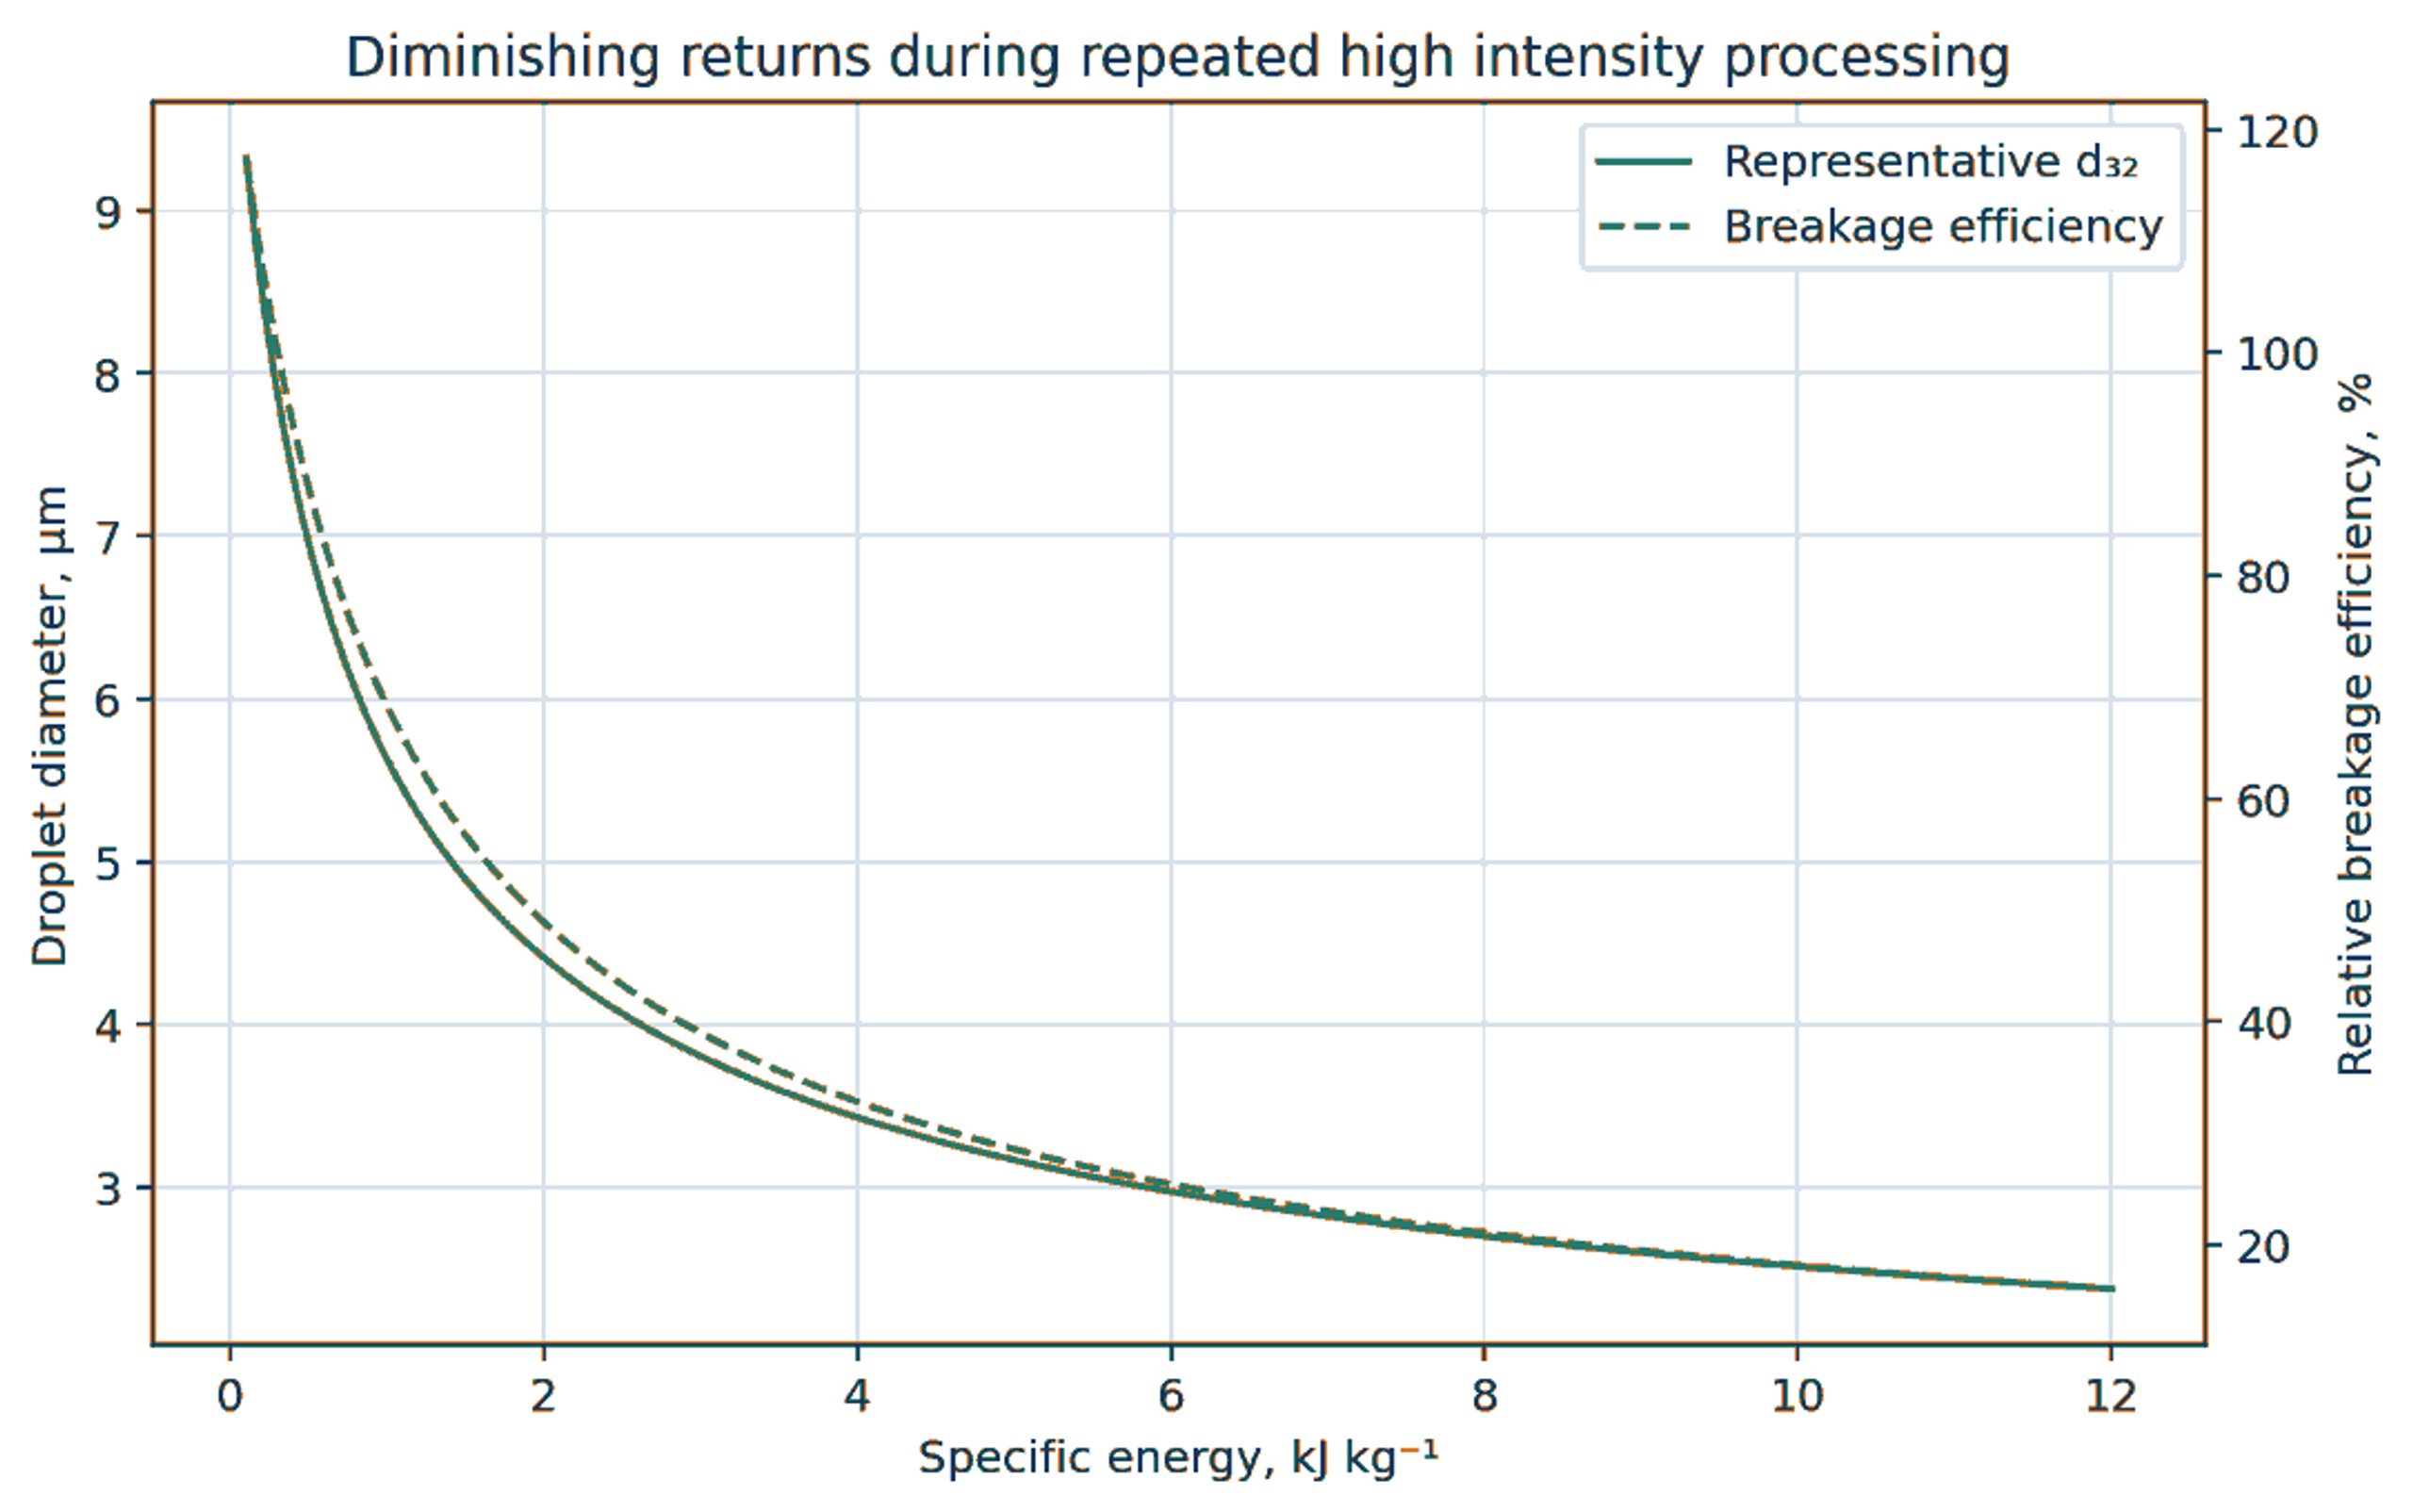
Figure 31. Conceptual relation between specific energy, droplet size, and breakage efficiency [24,28,56].
7.2 Flavor emulsion and cosmetic microscopy
The flavor emulsion data sheet reports a reduction in mean diameter from 5 µm to 0.4 µm after one pass at 18,000 psi through the Microfluidizer M-110Y. The accompanying microscopy shows the disappearance of readily visible coarse droplets after treatment. The reported stability period was at least five days. This result illustrates that droplet size, and stability must be evaluated together: a small initial mean size is not sufficient when interfacial coverage is incomplete [52].
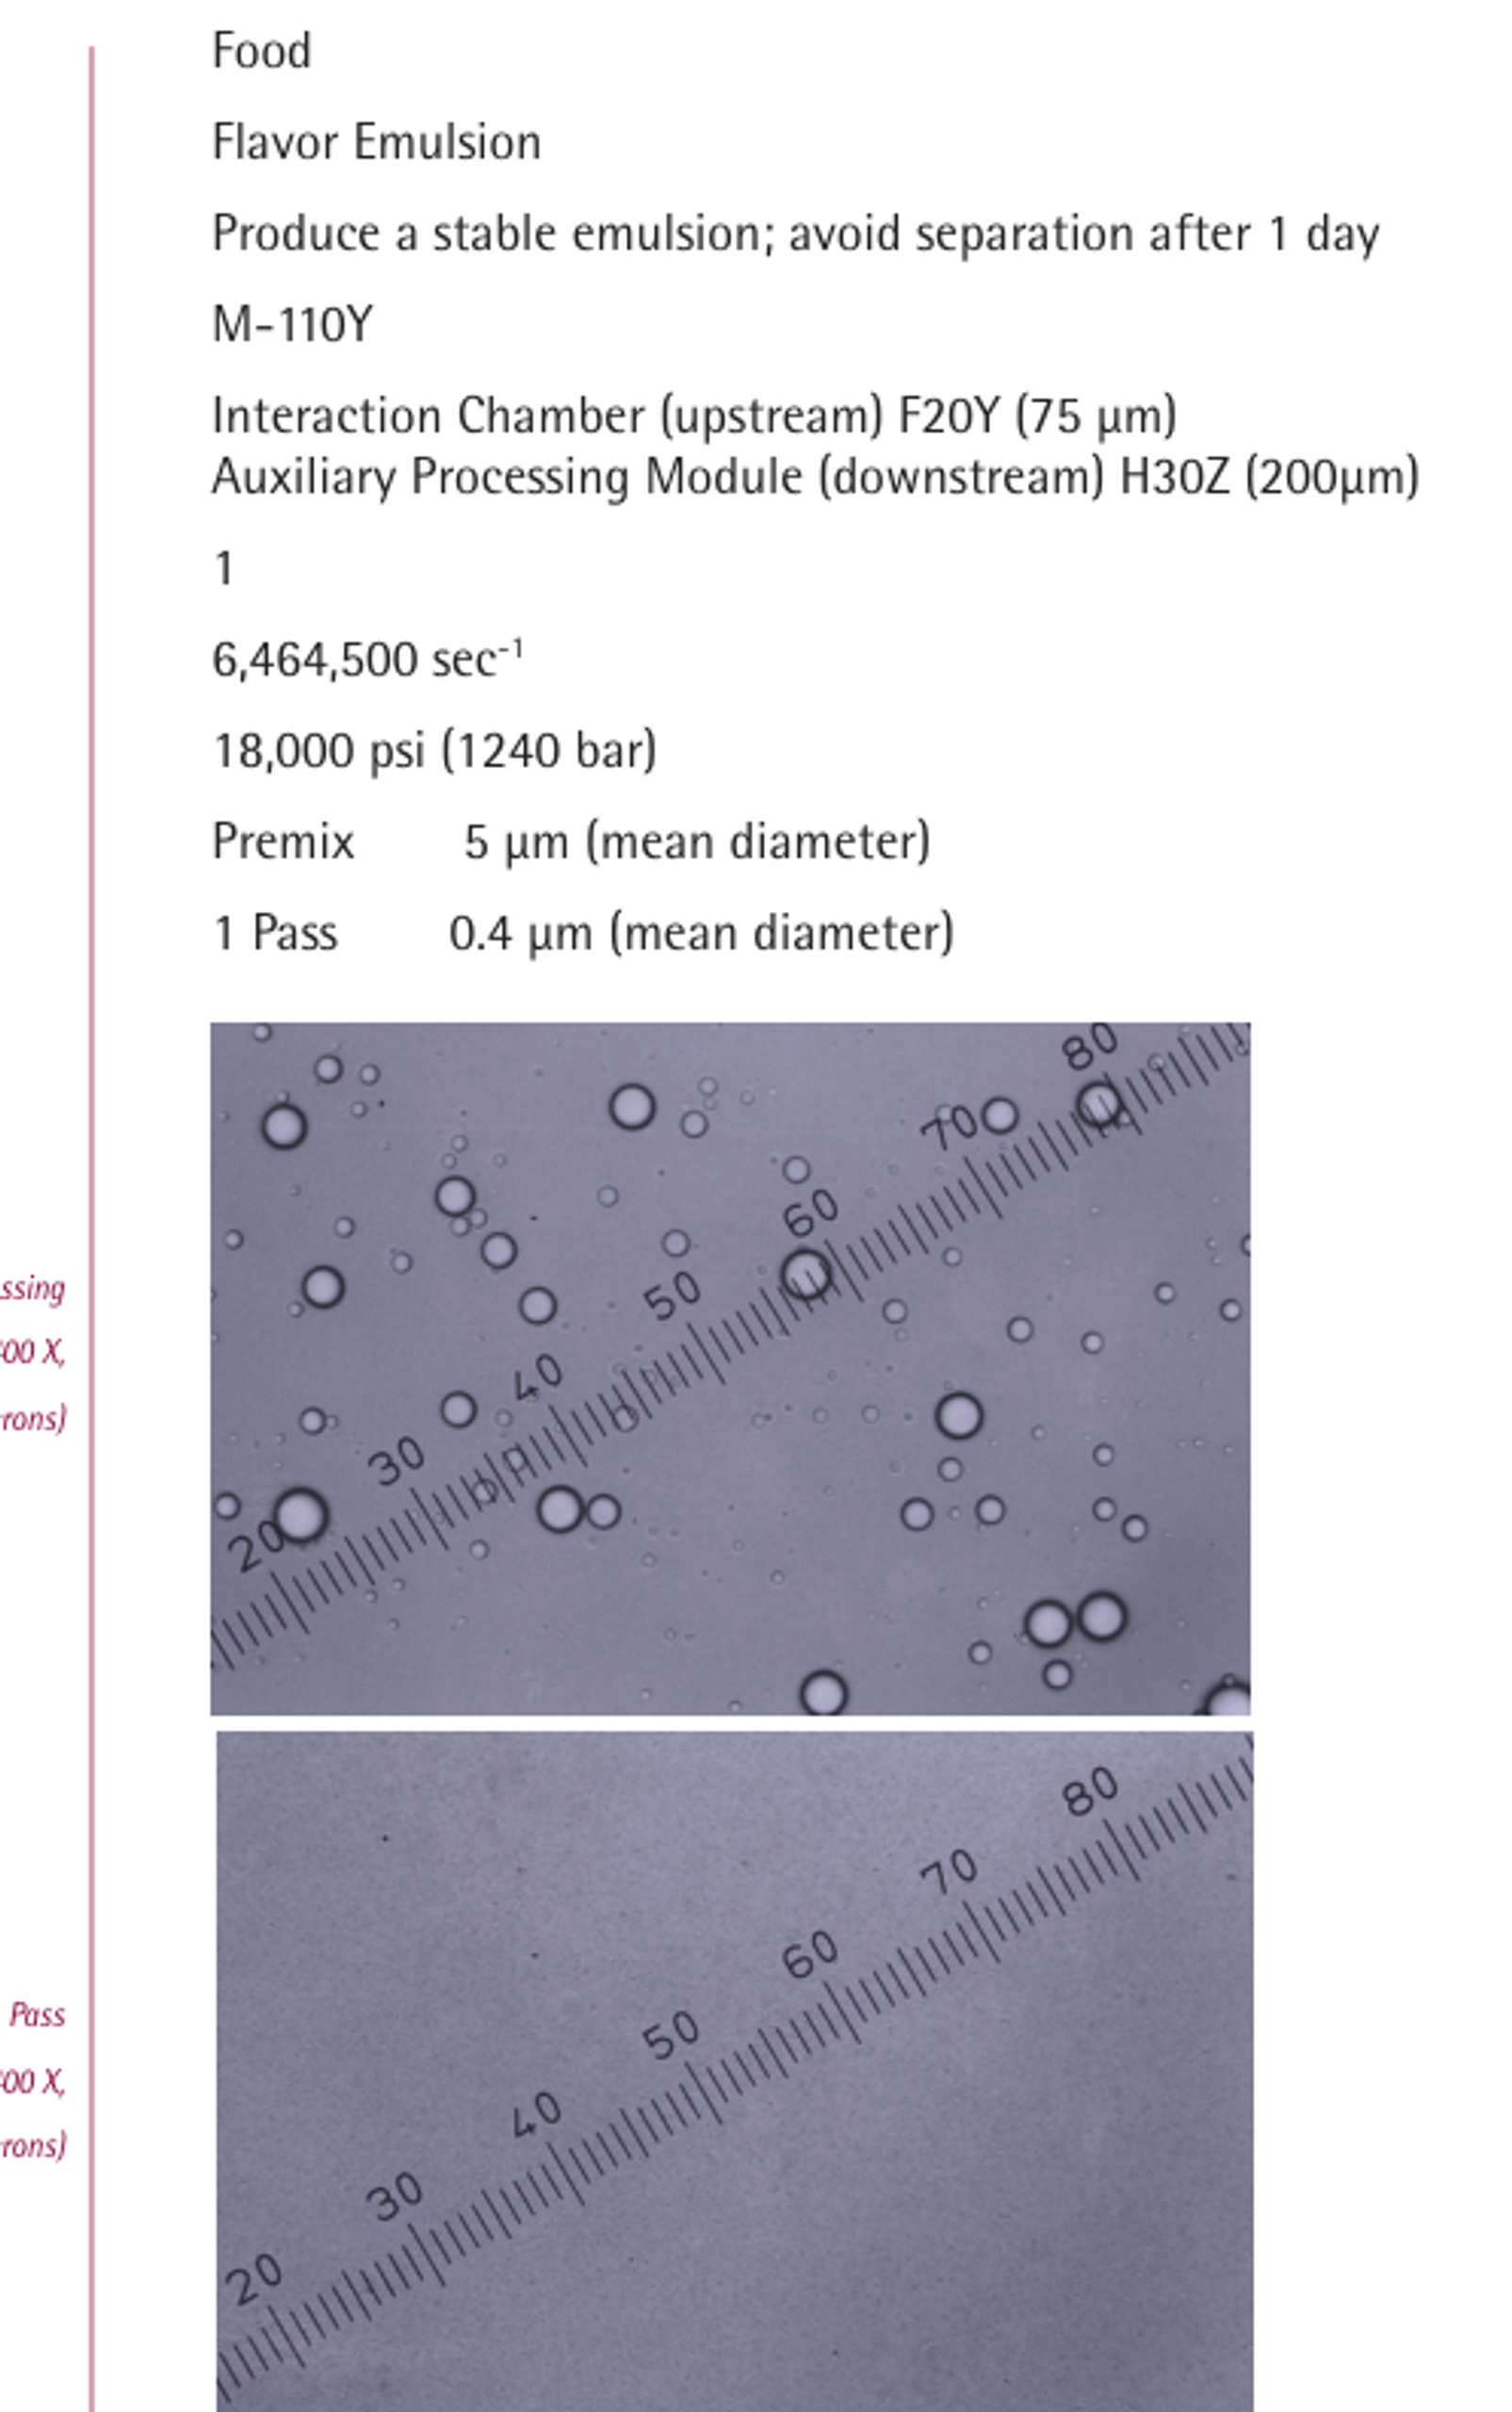
Figure 32. Flavor emulsion case showing operating conditions before and after one pass through the Microfluidizer M-110Y [52].
The anti-wrinkle cream example reports a decrease in mean particle size from 3.365 µm to 0.713 µm after one pass at 23,000 psi through the Microfluidizer M-110Y. The treated distribution shifts toward smaller sizes but retains a measurable coarse tail, which is important for sensory quality and long term stability. Cosmetic validation should therefore include microscopy, D₉₀ or D₉₉, rheology, sensory assessment, and accelerated storage rather than only the mean [54].
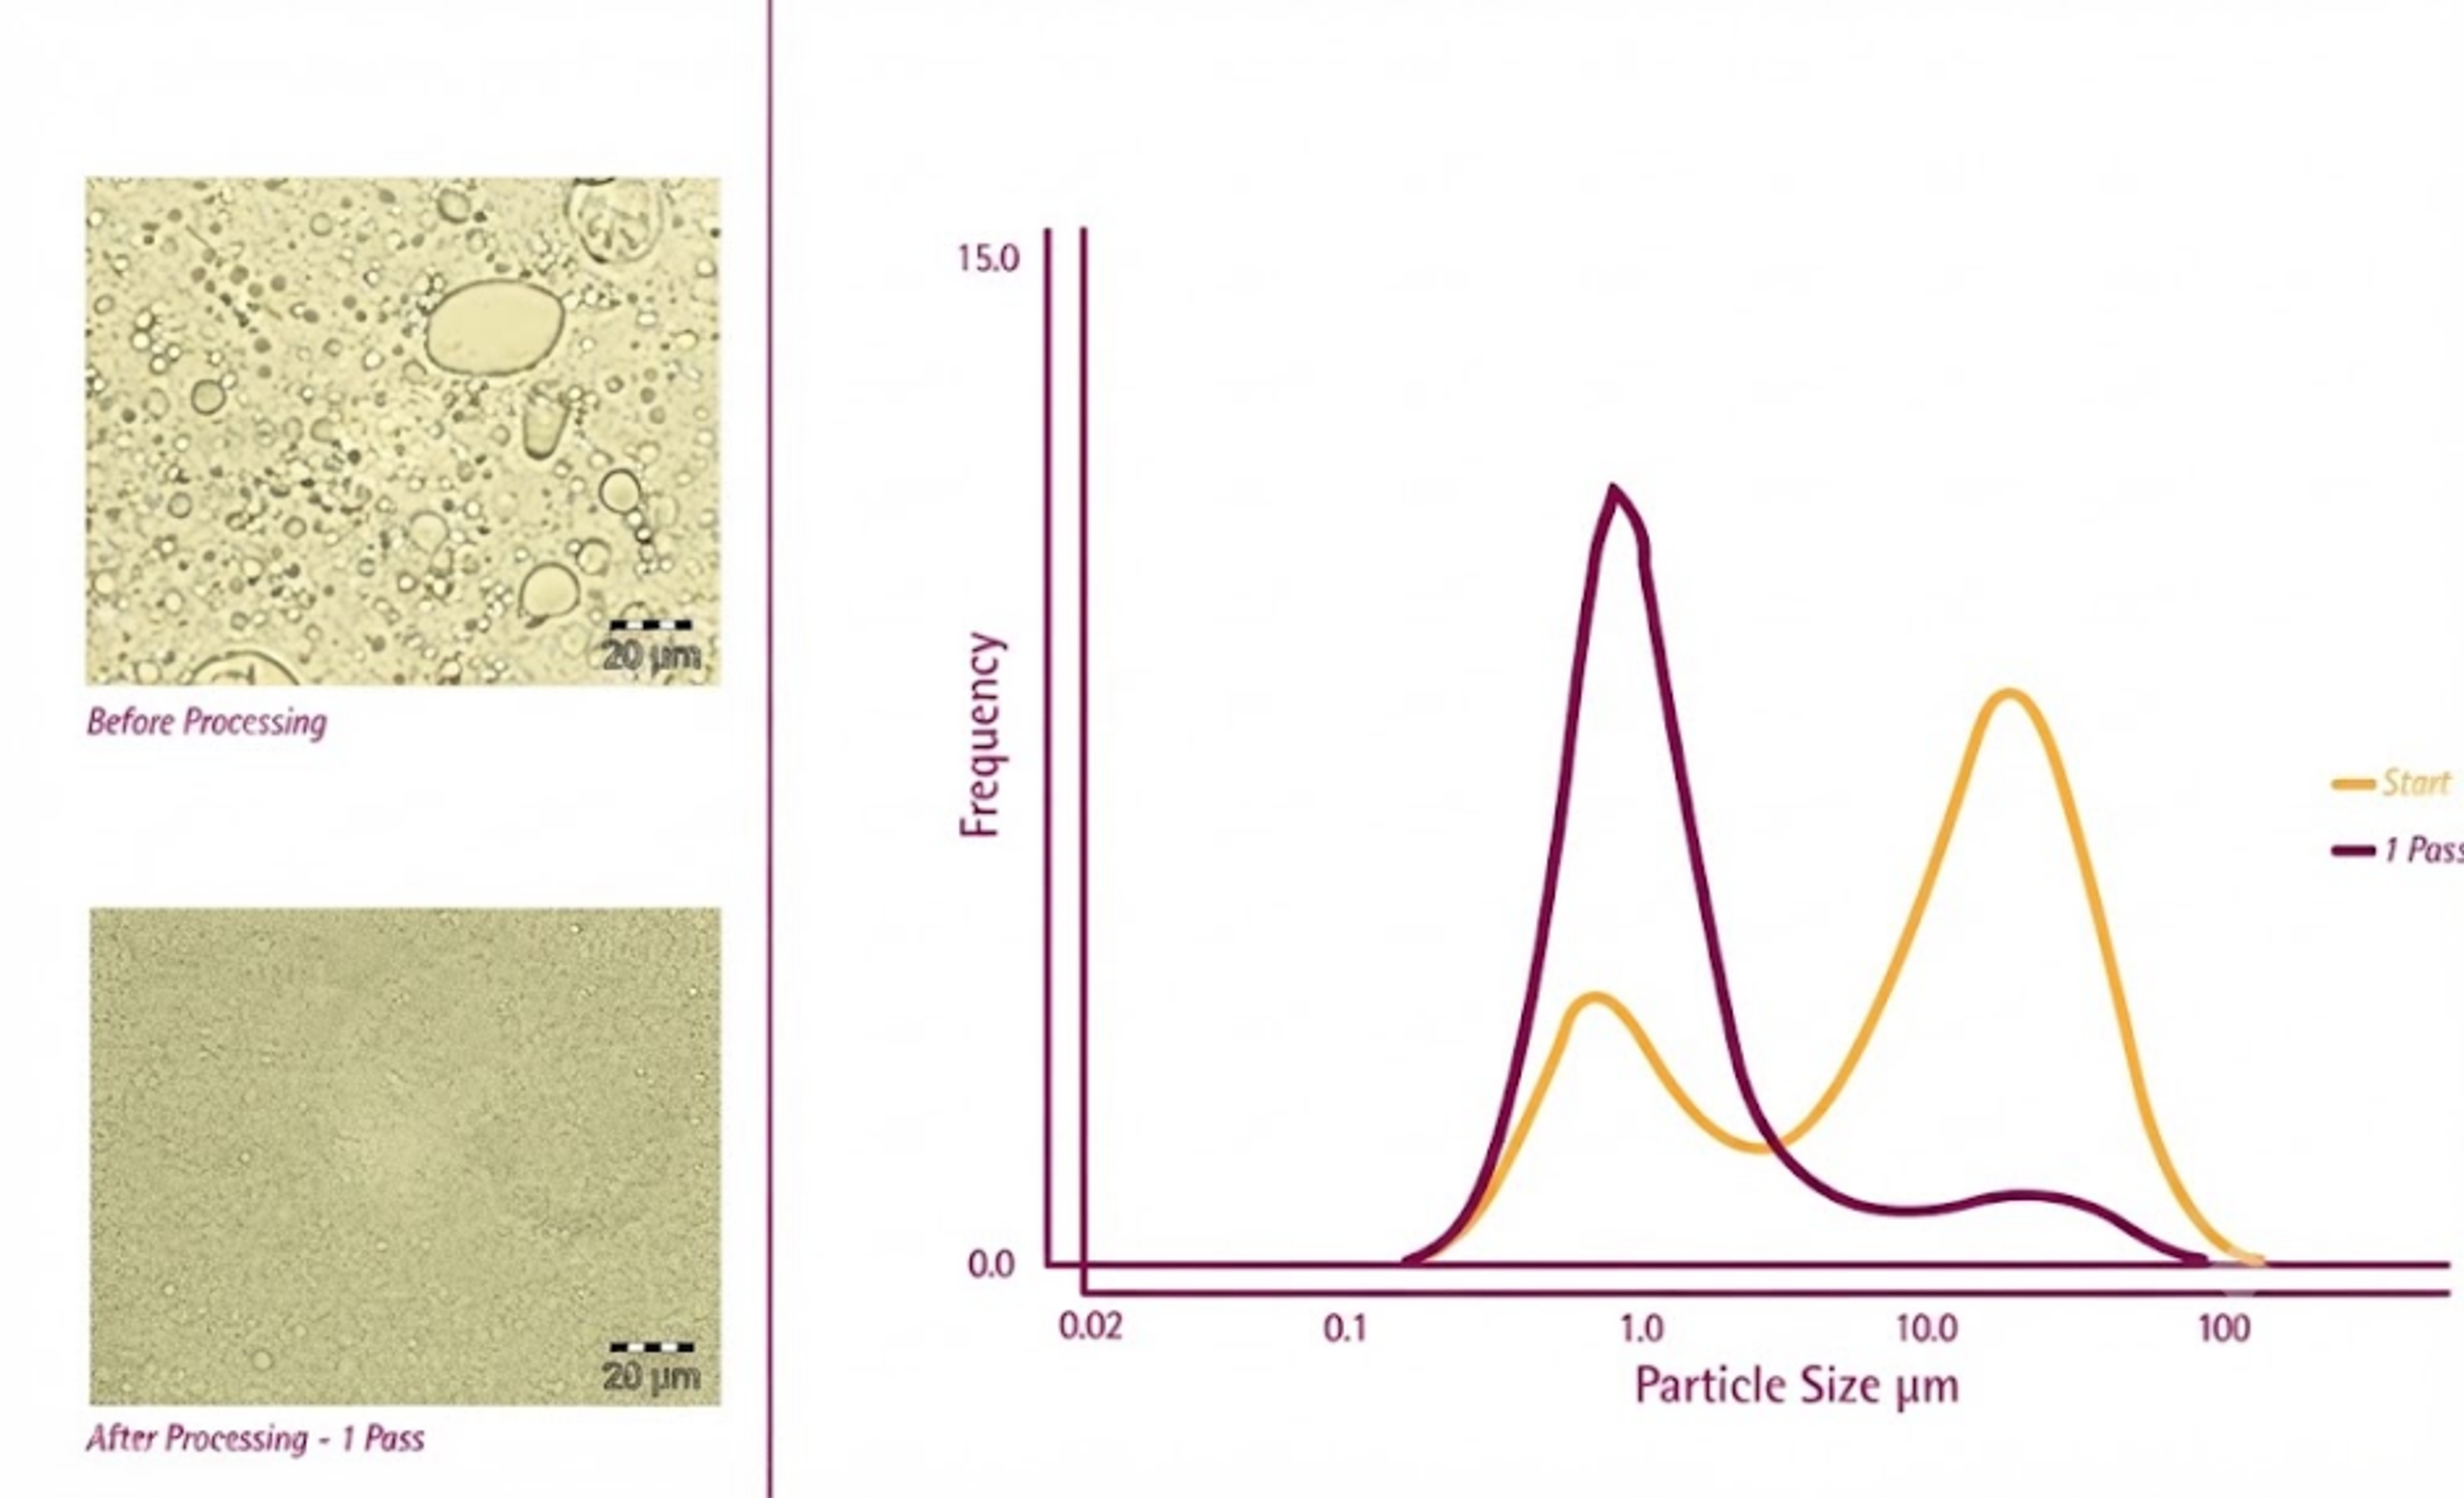
Figure 33. Anti-wrinkle cream example before and after one pass through the Microfluidizer M-110Y [54].
7.3 Foods, dairy products, and beverages
Food emulsions include milk, cream, nondairy beverages, sauces, mayonnaise, salad dressings, flavor emulsions, cloud emulsions, ice cream mixes, and encapsulated lipophilic ingredients. Cavitation can reduce droplet size, modify protein functionality, intensify mixing, and sometimes contribute to microbial reduction. Open access food and protein studies demonstrate that useful treatment windows are product specific and can reverse under overtreatment [49,57–59].
South Dakota State University evaluated hydrodynamic cavitation in dairy processing over 50 to 300 L/h, 600 to 3600 rpm, 70 to 85 °C, and 10 to 110 s residence time. Combined hydrodynamic cavitation and thermal treatment produced a 3.5 log reduction of Bacillus coagulans, compared with 2.77 log for thermal treatment alone. In cream and ice cream mix, operation at 3600 rpm and 100 L/h reduced particle size and improved stability; the resulting mixes showed medium shear viscosities at least twice those of conventionally homogenized controls under the reported conditions [57].
Mayonnaise and dressings are concentrated, non Newtonian emulsions. A suitable cavitation process usually requires a robust premix, controlled addition of oil, adequate emulsifier or egg protein, and a device with passages large enough to avoid blockage. The endpoint should include yield stress, viscosity curve, oiling off, droplet size distribution, and sensory quality. In ice cream mix, homogenization affects fat destabilization and overrun, so excessive reduction can be as undesirable as insufficient reduction.
Flavor and nutraceutical nanoemulsions benefit from small droplets for optical clarity and increased apparent solubility. Oxidation and flavor loss can become limiting because of the very large interfacial area. Nitrogen blanketing, chelators, antioxidants, low oxygen pickup, and rapid cooling may be necessary. [10,11,60–63].
7.4 Edible oil processing and interphase reaction
In edible oil degumming, neutralization, washing, and enzymatic treatment, hydrodynamic cavitation produces fine aqueous droplets in oil and increases contact between reagents and phospholipids, free fatty acids, soaps, metals, or enzymes. Controlled flow cavitation has been applied to reduce mixing time and compact the process [4,36,64,65]. The desired droplet size is not always the smallest possible. After reaction, droplets and soapstock must coalesce and separate in centrifuges. Overly stable emulsions can decrease separation efficiency. A complete design therefore includes both a high area reaction zone and a downstream coalescence or separation strategy.
The same principle applies to biodiesel reactions, liquid to liquid extraction, and reactive washing. Cavitation can accelerate mass transfer and reaction, but the final product specification may require rapid phase disengagement. Emulsifier formation during reaction, such as soaps in alkali refining, can change interfacial tension dynamically and must be included in the design.
7.5 Cosmetics and personal care products
Lotions, creams, sunscreens, cleansing products, hair conditioners, fragrances, and active delivery systems require controlled droplet size, rheology, sensory properties, oxidation resistance, and microbiological stability. Studies of essential oil, pharmaceutical, and food protein nanoemulsions show that homogenization conditions, interfacial composition, and storage temperature can materially change droplet distribution and stability [1,10,14,62,63]. Hydrodynamic cavitation can be evaluated as the energy input step, but acceptance criteria should also include centrifugation, freeze thaw cycling, thermal cycling, preservative efficacy, and package compatibility.
Cosmetic scale up should preserve addition order, phase temperature, neutralization sequence, polymer hydration, and air management. Many thickeners are shear sensitive or require time to develop viscosity. The cavitation step may therefore be placed before final thickener addition, or a low shear finishing stage may follow the reactor.
7.6 Pharmaceuticals and nutraceutical carriers
Pharmaceutical emulsions are used for parenteral nutrition, injectable drug delivery, oral delivery of poorly soluble compounds, topical products, vaccines, and diagnostic formulations. The process must control the coarse droplet tail because a small number of large droplets may be more important for safety than the mean diameter. Sterility, endotoxin, extractables, leachable, active degradation, and validated cleaning are additional constraints.
Hydrodynamic cavitation may be useful as a continuous prehomogenization or polishing step where the formulation is compatible with pressure cycling and local heat. It is not automatically interchangeable with a validated high pressure homogenizer. A regulatory development program should establish comparability of full DSD, active assay, degradation products, sterility assurance, and long term stability.
7.7 Fuel water and fuel biodiesel water emulsions
Water in oil biofuel emulsions require adequate storage stability together with acceptable ignition, emissions, and materials compatibility. Sahota and Dakka screened 14 water in sunflower oil emulsions produced by ultrasonication. Two remained stable for at least 14 days, HLB 5 gave the best tested stability, and additional specific energy between 75 and 200 W s/mL could overprocess the emulsion rather than improve it [66,67]. Although this was not a hydrodynamic cavitation study, it illustrates why a cavitation process must be optimized jointly with surfactant balance and energy exposure instead of by intensity alone.
Fuel service requires careful evaluation of flash point, electrostatic risk, seal compatibility, conductivity, corrosion, water specification, and storage stability. Cavitation equipment and motors must meet the area classification and mechanical integrity requirements for flammable liquids.
7.8 Agrochemicals, polymers, coatings, and specialty chemicals
Agrochemical emulsifiable concentrates and suspension emulsions require fine droplets for dilution stability, spray coverage, and active delivery. Cavitation can provide inline production and reduce dependence on batch high shear mixing. The formulation must remain stable in hard water, across pH, and after temperature cycling.
Polymer latexes, resin emulsions, wax dispersions, lubricants, inks, and coatings may benefit from continuous droplet or particle size control. Polymerization systems require special caution because cavitation can affect nucleation, chain scission, temperature, and gas content. Abrasive pigments and fillers increase erosion risk, so replaceable cavitation inserts or bulk flow vortex devices may be preferable. Cavitation based preparation of bitumen emulsions has also been investigated [68].
7.9 Bioprocessing, extraction, and fermentation support
Cavitation can assist extraction of lipids, flavors, pigments, and bioactive compounds by disrupting structures and increasing liquid solid contact. In fermentation and biotechnology, it may be used for media homogenization, cell disruption, or pretreatment. The same intensity that improves extraction can deactivate enzymes or damage desired cells. Process development must therefore define whether the biological structure is a target for preservation or destruction.
Table 11. Selected application examples and reported outcomes.
| Application | Device or method | Representative reported outcome | Critical qualification |
|---|---|---|---|
| Tilapia myofibrillar protein O/W emulsion | 3 mm orifice, 0.14 MPa, 550 W | At 10 min: droplet size 2754 to 2138 nm; ESI 71.28 to 91.73 min | Treatment at 15 to 20 min reversed several gains [49] |
| Coconut oil O/W emulsion | Circular and slit Venturis | Minimum about 170 nm at higher emulsifier fraction | Slit Venturi required fewer passes in the tested setup [35] |
| Palm oil submicron emulsion and curcumin encapsulation | Liquid whistle HC reactor | Submicron emulsion with encapsulated curcumin | Product and reactor specific formulation [69] |
| Dairy cream and ice cream mix | Rotational cavitation with thermal control | Reduced particle size and improved stability at 3600 rpm and 100 L/h | Open access M.S. thesis; product, temperature, and residence time specific [57] |
| Oxidized soy protein isolate | Cavitation jet treatment | Modified protein structure and improved emulsification properties | Protein oxidation state and treatment intensity were specific to the study [58] |
| Dense rapeseed oil emulsion | Vortex cavitation device | Oil fraction up to 0.60; | Critical oil fraction and diminishing energy efficiency [24] |
| Water in sunflower oil biofuel emulsion | Ultrasonication formulation benchmark | Two of 14 formulations stable for at least 14 days; HLB 5 performed best | Not an HC study; demonstrates surfactant and overprocessing constraints [66] |
| Edible oil degumming and reaction | Controlled flow cavitation | Fine reagent dispersion and shorter contacting time | Downstream coalescence and centrifugation must remain effective [4,36,64] |
8 Scale Up, Control, and Industrial Design
8.1 Scale up pathways
Three pathways are used in practice. Geometric scale up increases device size while attempting to preserve relevant similarity parameters. Scale out operates multiple validated modules in parallel. Recirculation uses a smaller device repeatedly until the product reaches its target. Each pathway changes cost, residence time distribution, heat removal, control, and cleaning [19,24–29].
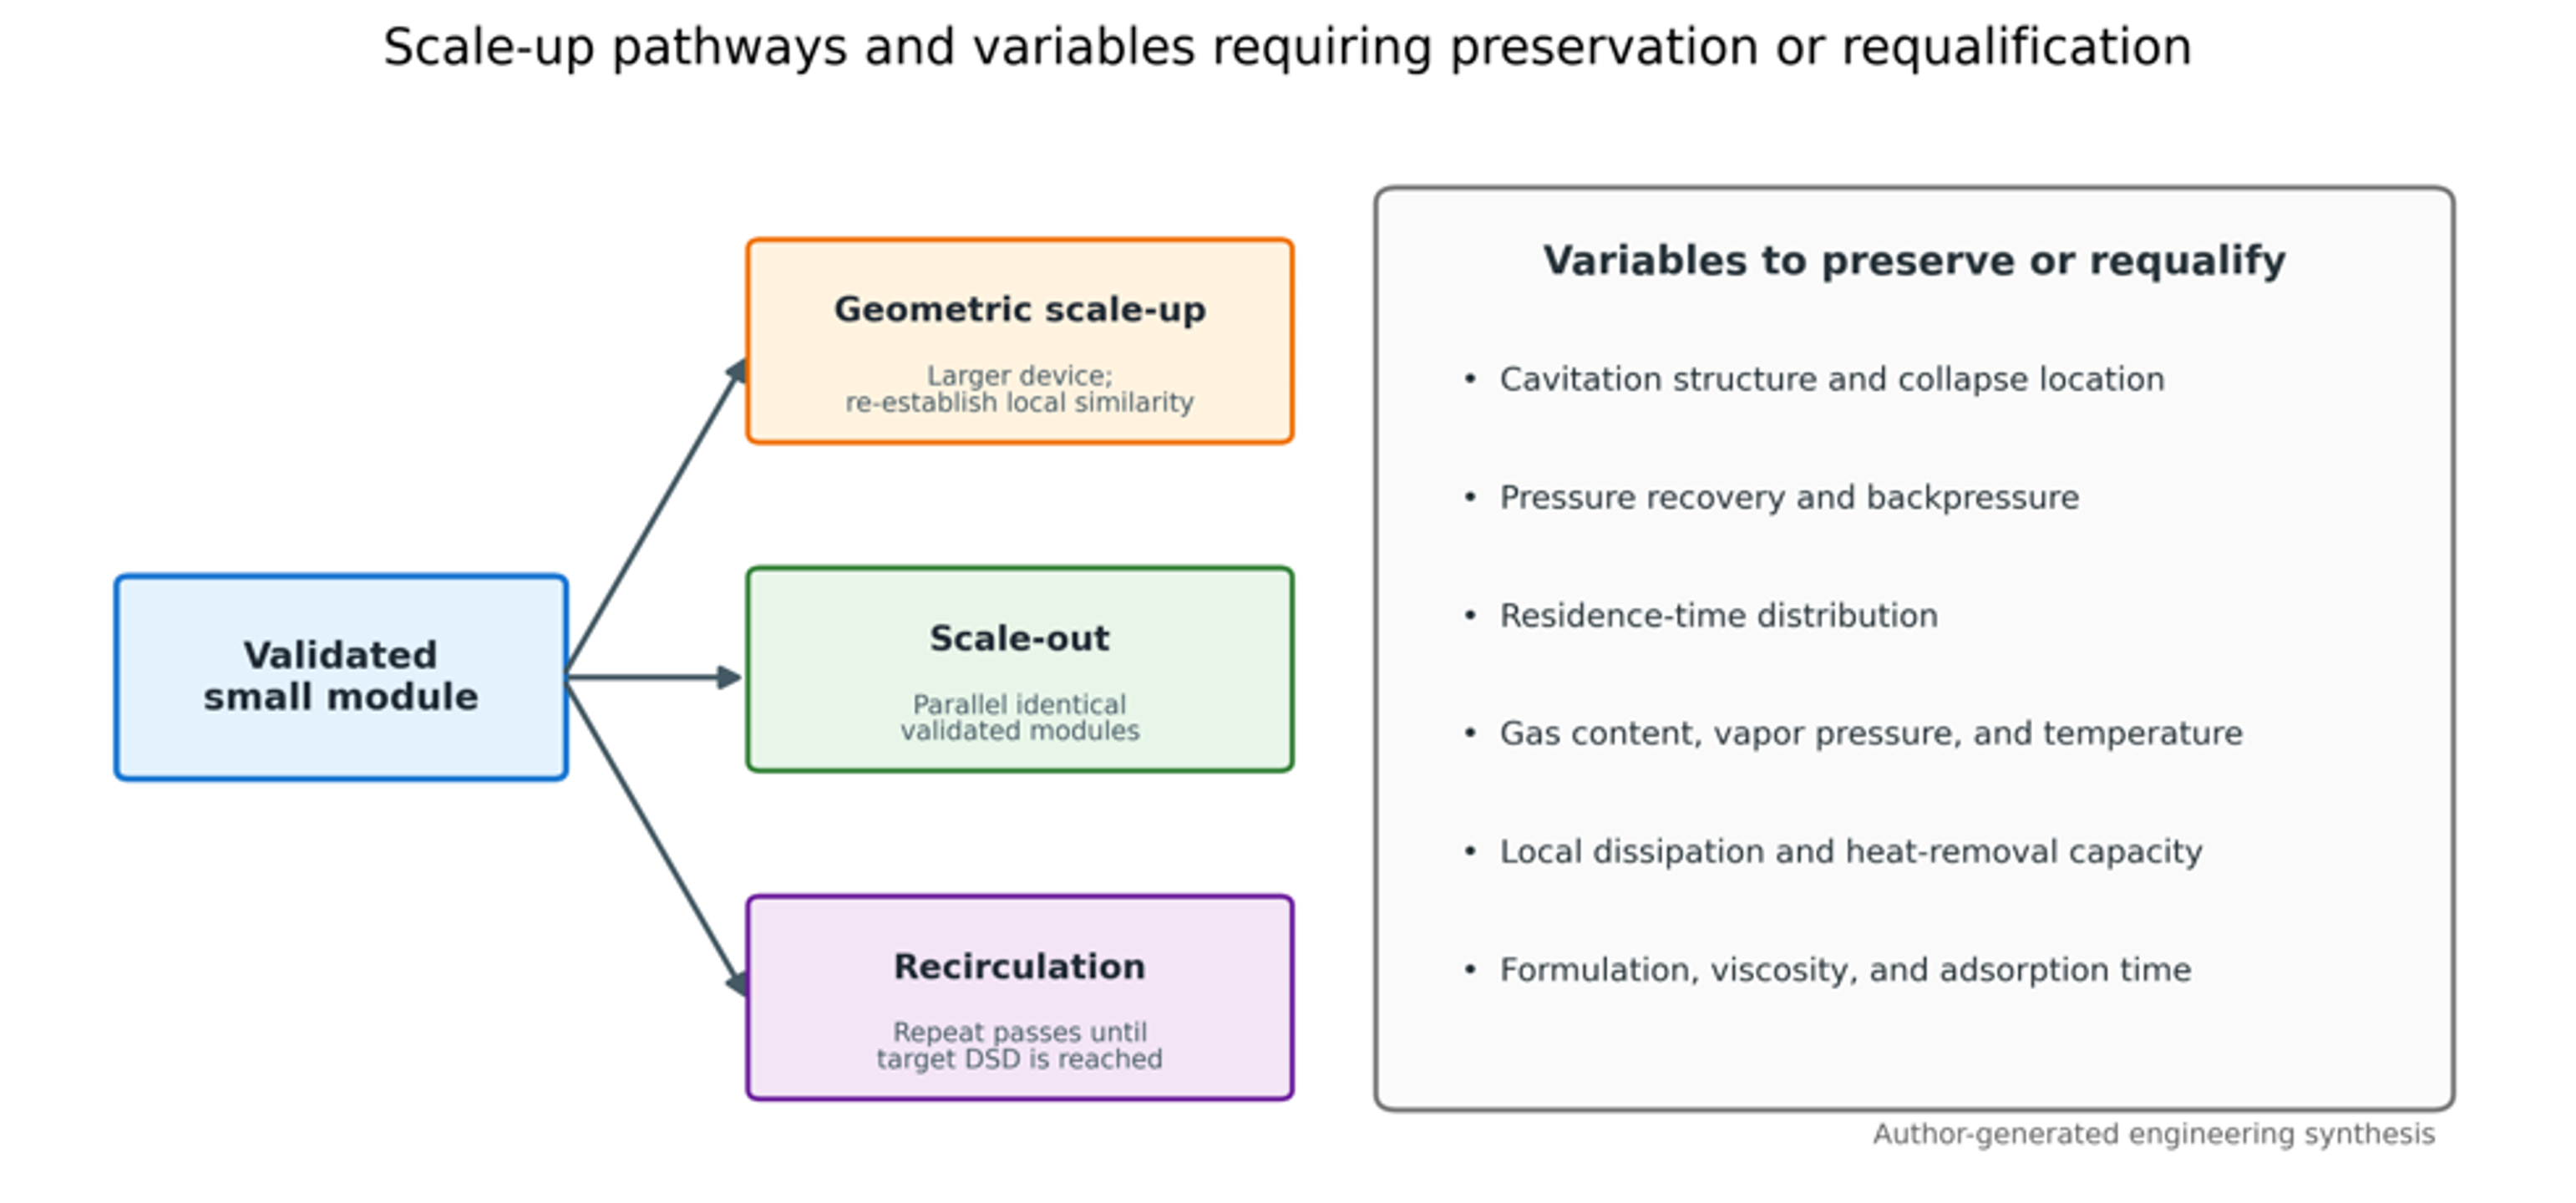
Figure 34. Scale up pathways and variables that must be preserved or requalified [9].
Geometric similarity alone is insufficient because cavitation depends on local pressure recovery, vapor volume, turbulent dissipation distribution, bubble residence, and the probability that droplets enter the active region. A device can preserve cavitation number and still change droplet size because the spatial distribution of stress has changed.
The Euler number used for hydraulic comparison is:
A useful, simulated cavitation extent metric is:
where is vapor volume in a defined region and is device volume. Neither metric alone predicts emulsification. The dispersed phase trajectory and local collapse dissipation must also be considered [29].
Scale out often preserves local hydrodynamics most reliably because each module operates near its validated point. It adds manifolds, valves, sensors, cleaning branches, and the possibility of unequal flow distribution. A well designed manifold should maintain similar pressure drop across each branch and allow isolation of a module without destabilizing the others.
Recirculation is flexible for batch production and formulation development. Its disadvantages are broader residence time distribution, repeated exposure of already fine droplets, greater oxygen pickup, and heat accumulation. A heat exchanger should be sized from measured pump and reactor heat load, not only from theoretical pressure drop power.
Table 12. Comparison of scale up strategies.
| Strategy | Main advantage | Main risk | Best use | Required qualification |
|---|---|---|---|---|
| Geometric scale up | Fewer large units and simple piping | Active cavitation structure may not scale geometrically | High throughput mature process with validated model | Pressure field, vapor extent, DSD, heat removal, erosion |
| Scale out | Preserves validated local device behavior | Manifold imbalance and more components | Modular production and regulated products | Branch flow balance, cleaning, control logic, failure isolation |
| Recirculation | Flexible endpoint and small reactor | Diminishing returns and broad exposure history | Batch products and pilot development | Pass distribution, temperature, oxidation, tank mixing |
| Multi inlet design | Higher capacity in one chamber | More complex inlet manifold and swirl interaction | Moderate capacity increase at low pressure drop | Symmetry, inlet balance, cavitation core stability |
| Hybrid train | Each stage performs a specific function | More equipment and control interactions | Premix plus cavitation plus polishing | Stage by stage DSD, energy, and compatibility |
8.2 Instrumentation and process control
At minimum, an industrial cavitation line should measure flow, upstream pressure, downstream pressure, inlet and outlet temperature, motor or pump power, and product pressure limits. High speed pressure transducers, acoustic emission sensors, turbidity, optical backscatter, and at line droplet size sensors can provide regime information. A 2025 study demonstrated at line estimation of dense emulsion droplet size distributions with a simple voltage based sensor, indicating a path toward continuous quality monitoring [70].
A control system may use flow and backpressure as manipulated variables for a static device or add rotor speed for a dynamic device. Product temperature should act as a constraint. A useful cascade is: maintain flow with pump speed, maintain downstream recovery pressure with a backpressure valve, limit outlet temperature with heat exchange, and adjust pass number or recirculation time from an at line product indicator.
Process analytical technology should be calibrated against an accepted reference method. Turbidity or voltage can correlate with only within a defined composition, optical property, temperature, and phase fraction. Formula changes require recalibration.
8.3 Materials, erosion, sanitation, and maintenance
Cavitation erosion is concentrated where collapse occurs near surfaces. Vortex designs can shift the active core away from the wall, while orifices and sharp edges may require replaceable inserts. Material selection should consider hardness, corrosion resistance, fatigue, surface finish, thermal expansion, and cleaning chemistry. For food and pharmaceutical service, weld quality, drainability, clean in place coverage, and elastomer qualification are mandatory.
Erosion monitoring can use weight loss of replaceable coupons, profilometry, pressure drop drift, vibration, metal particle analysis, or scheduled borescope inspection. A rising pressure drop at constant flow may indicate fouling or damaged geometry. A falling pressure drop may indicate edge rounding or enlargement, both of which can change the cavitation regime before a visible failure occurs.
8.4 Design workflow
A disciplined development program separates formulation limits from equipment limits. The recommended sequence is:
-
Define product quality by full DSD, rheology, stability, chemistry, and throughput.
-
Establish a premix that is pumpable and does not separate before the reactor.
-
Measure density, viscosity, vapor pressure, and dynamic interfacial tension at process temperature.
-
Screen cavitation regime, pressure, backpressure, and pass number at laboratory or pilot scale.
-
Quantify energy, temperature rise, gas pickup, and chemical degradation.
-
Fit a correlation or reduced model within the validated operating window.
-
Select geometric scale up, scale out, or recirculation and verify the active cavitation structure.
-
Conduct extended reliability, cleaning, and storage trials with production equivalent materials.
Table 13. Minimum pilot test matrix for a new formulation.
| Factor | Suggested levels or method | Primary response | Secondary response |
|---|---|---|---|
| Pressure drop | Low, intermediate, high around inception and optimum | , , Span | Temperature rise and hydraulic energy |
| Backpressure | At least three recovery pressure levels | Cavitation regime and DSD | Gas release and erosion indicator |
| Pass number | 1, 2, 3, 5, and endpoint specific higher value | Diminishing return curve | Oxidation and active retention |
| Dispersed phase fraction | Minimum, nominal, maximum formulation | DSD and rheology | Pumpability and phase inversion |
| Emulsifier level | Below, near, and above anticipated coverage | Recoalescence and storage stability | Cost, sensory or toxicity constraints |
| Temperature | Low, nominal, maximum allowed | Viscosity and diameter | Chemical degradation and vapor pressure |
| Gas condition | As received, degassed, controlled gas addition if relevant | Reproducibility and foam | Dissolved oxygen and collapse intensity |
| Residence or flow | At least three throughputs | Capacity and DSD | Pressure loss and heat transfer |
9 Comparison with Established Emulsification Technologies
Hydrodynamic cavitation is not a universal substitute for high pressure homogenization, microfluidization, ultrasonication, rotor stator mixing, colloid milling, membrane emulsification, or low energy phase inversion. The appropriate method depends on formulation, target distribution, throughput, contamination tolerance, thermal sensitivity, cleaning requirements, and capital constraints [1,8,13,26,29,71].
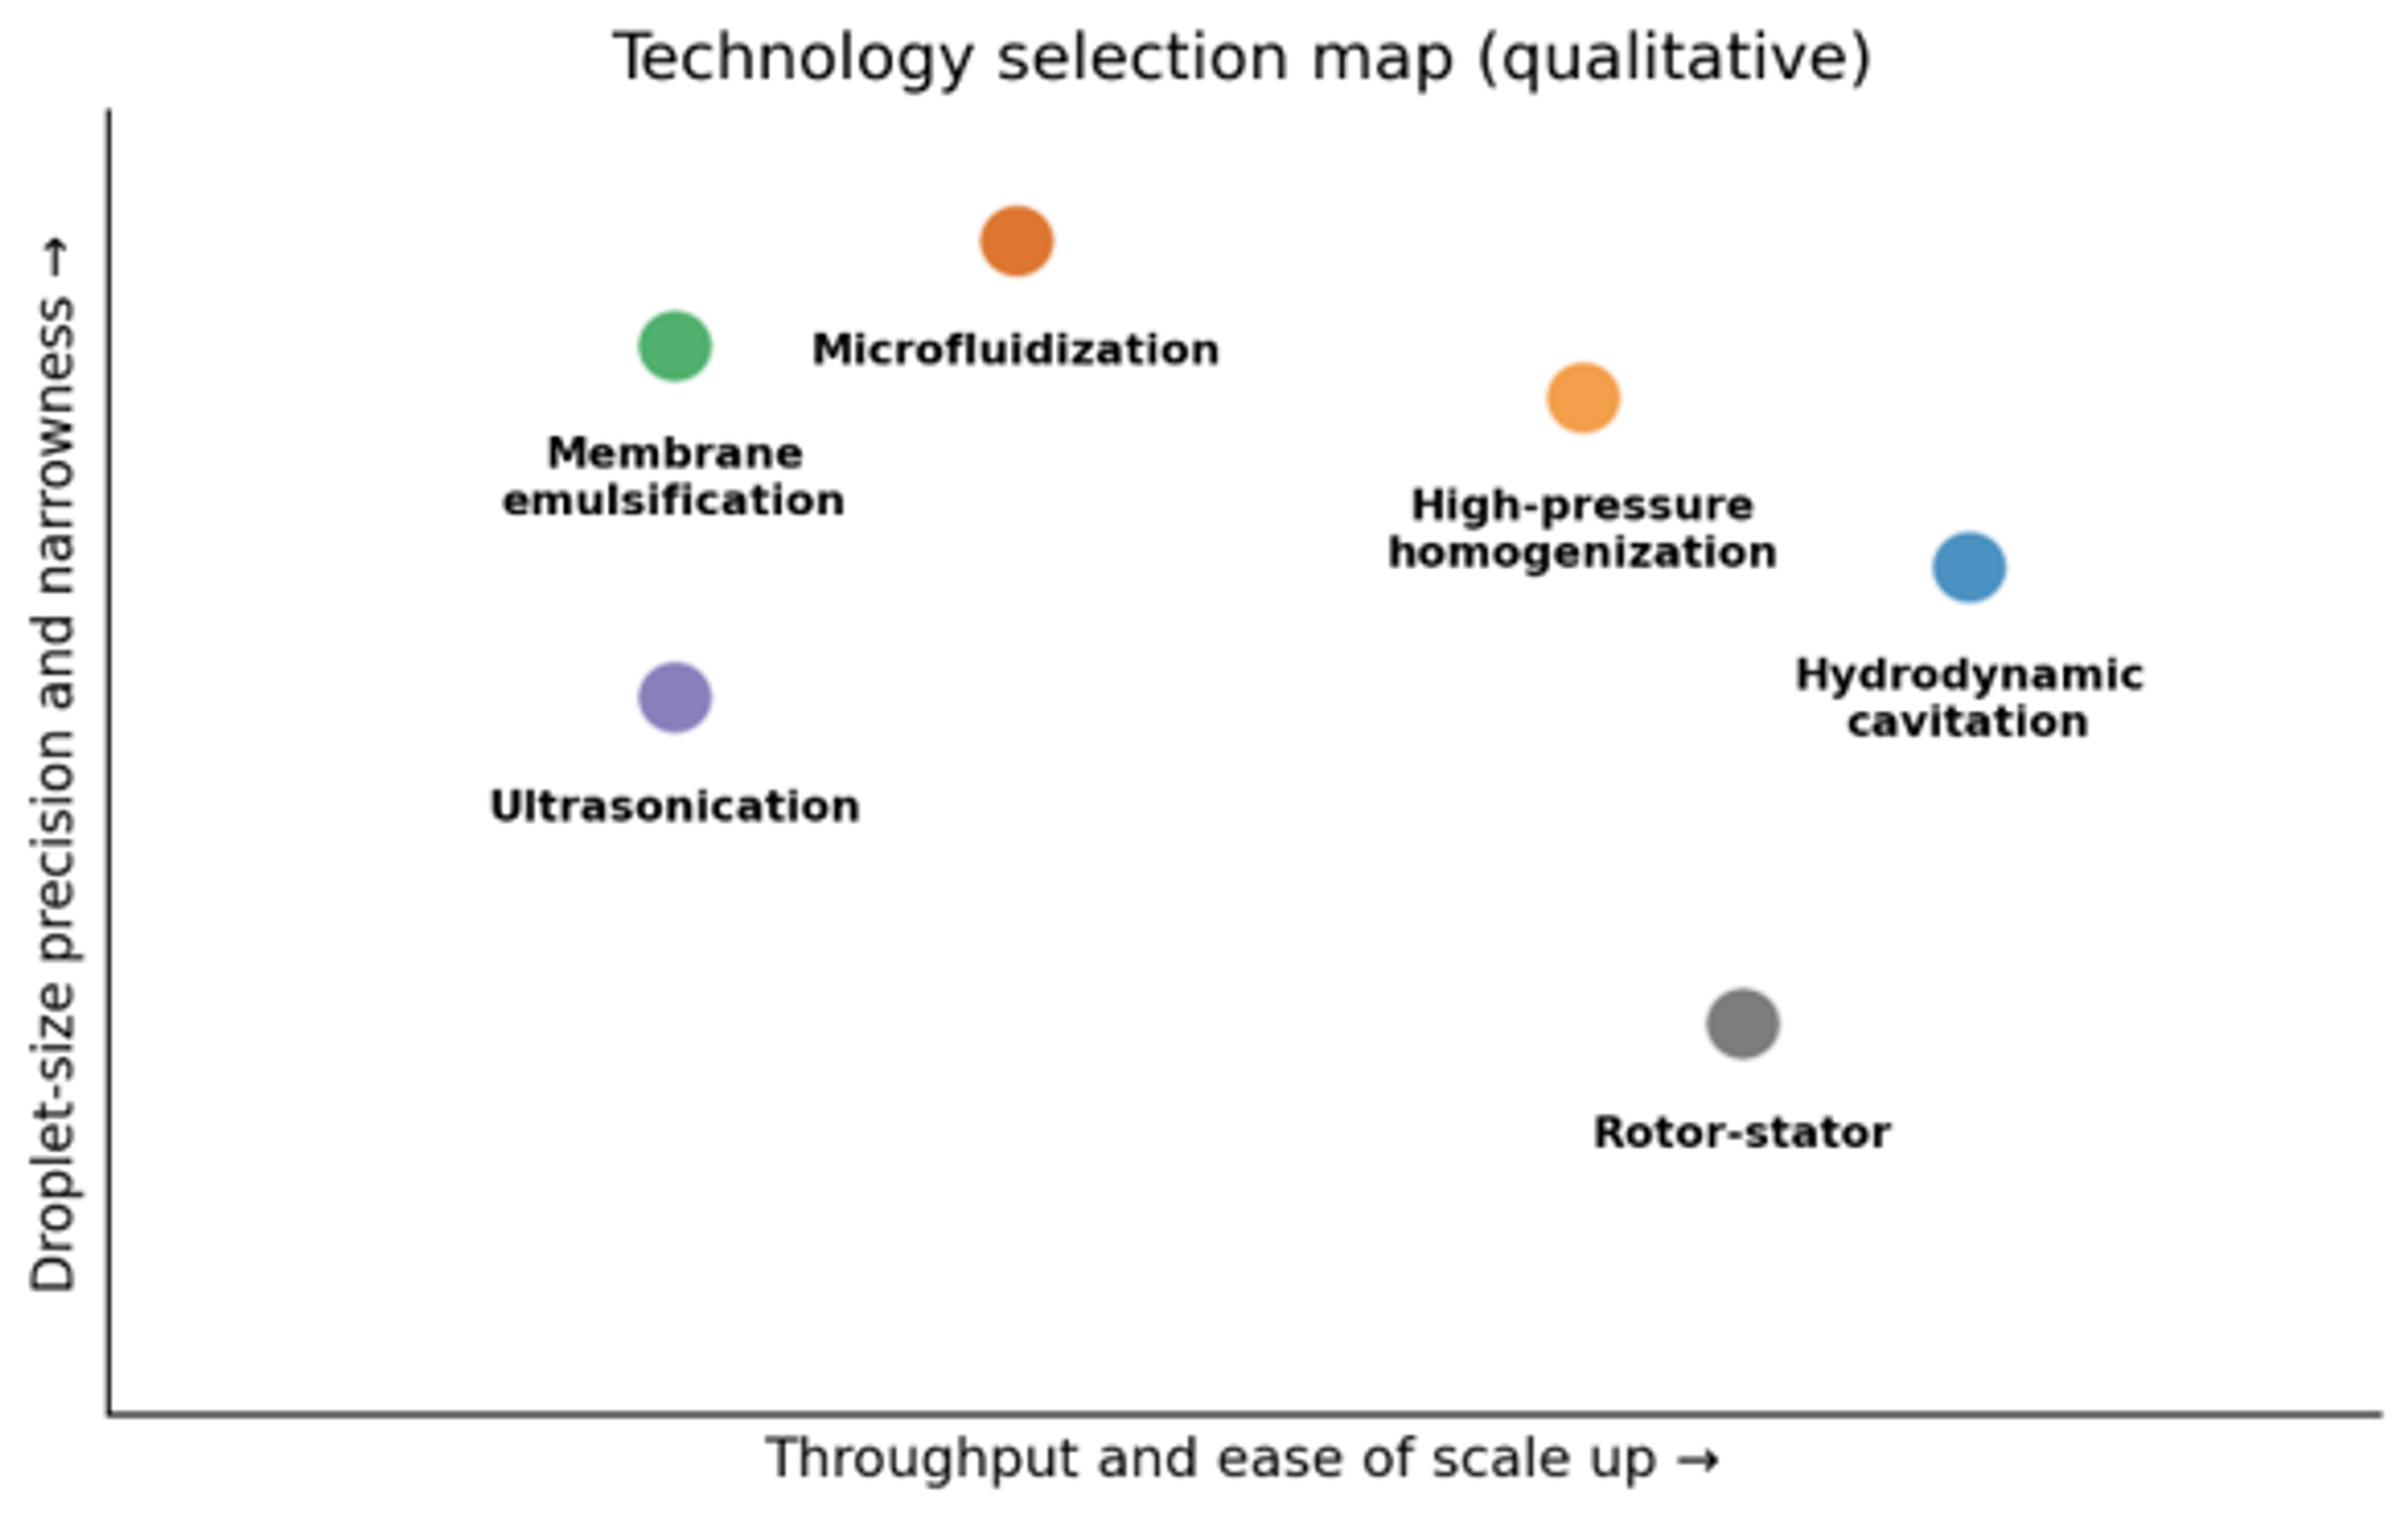
Figure 35. Qualitative selection map for emulsification technologies. Position depends on formulation and equipment scale; the diagram is intended for screening rather than specification [9].
Table 14. Critical comparison of hydrodynamic cavitation with established emulsification technologies.
| Technology | Main strengths | Main limitations | Position of hydrodynamic cavitation |
|---|---|---|---|
| High pressure homogenization | Mature, reproducible, fine droplets, validated in dairy and pharmaceuticals | High pressure, valve wear, heat, capital and maintenance | HC may produce comparable results in selected systems at lower pressure, but HPH is more standardized |
| Microfluidization | Strong extensional flow and precise interaction chambers | Very high pressure, clogging sensitivity, high capital cost | HC is generally more robust for larger passages and industrial streams |
| Ultrasonication | Effective laboratory screening and small batch nanoemulsions | Scale nonuniformity, probe erosion, noise, heat, limited penetration | HC is usually easier to scale continuously with pumps and piping |
| Rotor stator mixing | Simple, robust, excellent premixing, wide viscosity range | Often limited in submicron range; high speed and air entrainment | HC can be a polishing step or an intensified inline alternative |
| Colloid mill | Handles viscous products and provides adjustable gap | Moving surfaces, heat, wear, limited nanoscale capability | HC has no close contact grinding surfaces in static designs |
| Membrane emulsification | Narrow distributions and low shear | Low throughput, membrane fouling, pressure limitations | HC offers higher throughput but usually broader DSD |
| Phase inversion or spontaneous emulsification | Low mechanical energy for compatible formulations | Strong composition and temperature dependence, high surfactant | HC is more mechanically flexible across formulations |
| Vortex cavitation | Open passages, low pressure drop, modular continuous operation | Emerging design standards and device specific modeling | Especially promising for micron scale continuous emulsions and dense systems |
| Rotor stator cavitation | Independent speed control and combined stress mechanisms | Moving parts, seals, heat, and mechanical complexity | Useful where speed control and compact continuous processing are important |
Comparisons should be made on a common product basis: identical formulation, droplet size metric, coarse tail, throughput, pass count, hydraulic and electrical energy, temperature rise, and storage stability. Studies show that breakup morphology and useful droplet reduction depend strongly on local stress history and mixing arrangement [12,13,26,27]. Consequently, no single efficiency ratio should be transferred between devices without a controlled head to head test.
Hydrodynamic cavitation is most competitive when the process requires continuous operation, moderate to high throughput, compact equipment, simultaneous mixing and homogenization, tolerance of millimetre scale passages, and micron to submicron droplets. High pressure homogenization or microfluidization remains preferable when a tightly specified nanoscale tail has already been validated. Membrane or microchannel methods remain preferable when monodispersity is more important than capacity.
Table 15. Common failure modes and corrective actions.
| Observation | Probable cause | Diagnostic check | Corrective action |
|---|---|---|---|
| Droplet size remains coarse | Cavitation below inception; inadequate premix; high interfacial tension | Pressure profile, flow, visual or acoustic regime, premix DSD | Increase velocity within limits, improve premix, adjust emulsifier or temperature |
| Size improves then worsens at stronger cavitation | Supercavitation, gas cushioning, heating, recoalescence | Cavitation image, void fraction, outlet temperature, DSD immediately and after delay | Increase backpressure, reduce pressure drop, degas, cool, improve stabilization |
| Broad or bimodal DSD persists | Unequal exposure, bypass, too few passes, inadequate residence mixing | RTD test, branch flows, DSD bypass | Improve loop mixing, manifold balance, or active zone encounter |
| Excessive foam | Air ingress, dissolved gas release, surfactant foaming | Suction pressure, seals, tank return location | Eliminate leaks, submerge return, degas, reduce free fall and agitation |
| Rapid temperature rise | Excess recirculation, pump inefficiency, high pressure loss | Energy balance and temperature versus time | Add heat exchange, reduce passes, use scale out or single pass design |
| Oxidation or active loss | Oxygen pickup, radicals, heat, metal catalysis | Dissolved oxygen, peroxide value, assay, metal ions | Inert gas, antioxidants, lower temperature, shorter exposure, compatible materials |
| Pressure drop drifts upward | Fouling, blockage, viscosity increase | Clean water baseline, inspection, rheology | Clean, enlarge passage, revise premix or formulation sequence |
| Pressure drop drifts downward | Erosion or edge rounding | Geometry inspection and flow calibration | Replace insert, use harder material, move collapse away from wall |
| Downstream separation is poor | Emulsion is too stable or droplets too small | Centrifuge test, interfacial tension, soap or surfactant level | Add coalescence stage, reduce intensity, adjust chemistry or temperature |
10 Conclusions
Hydrodynamic cavitation is a technically credible and increasingly mature platform for emulsification and homogenization. Its distinguishing feature is the creation of intense, localized, and intermittent stresses in continuous flow equipment. These stresses can reduce droplet size at moderate bulk pressure and can be combined with mixing, heating, extraction, reaction, or microbial reduction [7,72].
The process is governed by an interaction of hydraulic, interfacial, and kinetic variables. Cavitation number, backpressure, pressure recovery, geometry, pass number, phase viscosity, dispersed phase fraction, emulsifier concentration, temperature, and gas content all influence the result. The strongest visually observed cavitation state is not necessarily the best. A field containing many discrete transient cavities can produce more useful collapse events than a large, attached vapor structure.
The mathematical description spans several levels. Kolmogorov and Hinze scaling relates stable droplet size to interfacial tension and local dissipation. Rayleigh based models estimate collapse time and local energetics. The Kozyuk and Fedotkin model links droplet size to bubble diameter, bubble concentration, bubble size distribution, and collapse pressure. Population balances and recent reduced order models predict the evolution of the full DSD and provide a path to geometry optimization and process control. Every model requires calibration because the fraction of hydraulic energy that reaches a droplet as useful breakup work is device and formulation specific.
Industrial implementation should preserve the active cavitation structure rather than only geometric similarity or nominal pressure. Scale out is often the lowest risk route; geometric scale up can be successful when pressure recovery, vapor extent, droplet trajectory, local dissipation, residence time, and heat removal are requalified. Recirculation remains useful for flexible batch processing but must be controlled for diminishing returns, temperature, oxygen pickup, and repeated exposure.
The best application is one in which continuous throughput, compact equipment, moderate pressure, robust passages, and simultaneous mixing or reaction create value. The final design criterion is not the smallest possible droplet. It is the required droplet size distribution and stability at acceptable energy, temperature, chemical quality, cleaning burden, equipment life, and downstream separability.
Nomenclature
The symbols below are used throughout this article. Unless otherwise stated, quantities are expressed in SI units.
| Symbol or abbreviation | Definition | SI unit or status |
|---|---|---|
| Interfacial area | m² | |
| Throat flow area | m² | |
| Interfacial area per unit emulsion volume | m²/m³ | |
| Birth and death rates by breakup | Model dependent | |
| Birth and death rates by coalescence | Model dependent | |
| Daughter droplet distribution for parent volume | 1/m³ | |
| Breakup model constant | Model dependent | |
| Cavitation extent, vapor volume divided by device volume | Dimensionless | |
| Hinze breakup constant | Dimensionless | |
| Surfactant concentration in the continuous phase | kg/m³ | |
| Cavitation number | Dimensionless | |
| Droplet diameter | m | |
| Cumulative percentile diameters | m | |
| Sauter mean diameter | m | |
| Volume weighted mean diameter | m | |
| Maximum stable droplet diameter in the cavitation model | m | |
| Initial cavitation bubble diameter | m | |
| Mean cavitation bubble diameter | m | |
| Parabolic cylinder function of order minus four | Special function | |
| Adsorption or stabilization ratio | Dimensionless | |
| DSD | Droplet size distribution | Abbreviation |
| Specific hydraulic or input energy | J/kg | |
| Energy assigned to collapse of one bubble | J | |
| Euler number | Dimensionless | |
| Bubble size distribution factor in the Kozyuk and Fedotkin model | Units implied by Eq. (41) | |
| HC | Hydrodynamic cavitation | Abbreviation |
| HCR | Hydrodynamic cavitation reactor | Abbreviation |
| HLB | Hydrophilic lipophilic balance | Dimensionless index |
| Third moment integral of bubble diameter | m⁴ | |
| Empirical constants in energy and pass correlations | Model dependent | |
| Coalescence kernel | m³/s | |
| Ostwald ripening rate constant | m³/s | |
| Characteristic device length | m | |
| Approximate liquid mass affected by one collapse | kg | |
| Minimum surfactant mass for interfacial coverage | kg | |
| Number of droplets in size class | Count or number density | |
| Number of passes | Dimensionless | |
| Bubble number concentration per liquid volume | 1/m³ | |
| Ohnesorge number | Dimensionless | |
| O/W | Oil in water emulsion | Abbreviation |
| Recovered downstream pressure | Pa | |
| Bubble internal pressure | Pa | |
| Vapor pressure | Pa | |
| Far field pressure | Pa | |
| Collapse zone pressure used in bubble field model | Pa | |
| Hydraulic power | W | |
| PDI | Polydispersity index | Dimensionless |
| Volumetric flow rate | m³/s | |
| Instantaneous bubble radius | m | |
| Maximum bubble radius | m | |
| Reynolds number | Dimensionless | |
| Breakup frequency | 1/s | |
| Standard deviation of bubble diameter | m | |
| Time | s | |
| Bubble collapse time | s | |
| Processing time | s | |
| Residence time | s | |
| Characteristic and throat velocities | m/s | |
| Creaming or sedimentation velocity | m/s | |
| Active or nominal reactor volume | m³ | |
| Batch or loop inventory | m³ | |
| Device volume | m³ | |
| Vapor volume in a defined region | m³ | |
| Collapse work | J | |
| W/O | Water in oil emulsion | Abbreviation |
| Droplet Weber number | Dimensionless |
Greek Letters
| Symbol | Letter name | Meaning | SI unit or status |
|---|---|---|---|
| Alpha | Dispersed phase volume fraction in droplet population | Dimensionless | |
| Beta | Droplet collision frequency | Model dependent | |
| Gamma | Liquid-liquid interfacial tension | N/m | |
| Gamma | Liquid vapor surface tension | N/m | |
| Capital gamma | Saturated surfactant surface excess | kg/m² | |
| Delta | Difference or change; for example, pressure drop | According to quantity | |
| Epsilon | Local energy dissipation rate per unit mass | W/kg | |
| Epsilon | Local collapse associated dissipation estimate | W/kg | |
| Eta | Kolmogorov length scale | m | |
| Eta | Droplet breakage efficiency | Dimensionless | |
| Eta | Thermodynamic emulsification efficiency | Dimensionless | |
| Theta | Fractional interfacial coverage | Dimensionless | |
| Lambda | Dispersed to continuous viscosity ratio | Dimensionless | |
| Mu | Dynamic viscosity | Pa s | |
| Mu | Continuous- and dispersed phase viscosities | Pa s | |
| Nu | Continuous phase kinematic viscosity | m²/s | |
| Pi | Breakup stress ratio | Dimensionless | |
| Rho | Density | kg/m³ | |
| Rho | Continuous- and dispersed phase densities | kg/m³ | |
| Tau | Disruptive and turbulent stresses | Pa | |
| Phi | Dispersed phase volume fraction | Dimensionless | |
| Gamma dot | Shear rate | 1/s | |
| Calligraphic A | Net interfacial area generated per unit energy | m²/J |
Bibliography
[1] Liu, Q.; et al. Food Grade Nanoemulsions: Preparation, Stability and Application in Encapsulation of Bioactive Compounds. Molecules 2019, 24, 4242. https://doi.org/10.3390/molecules24234242.
[2] Schroën, K.; de Ruiter, J.; Berton Carabin, C. The Importance of Interfacial Tension in Emulsification: Connecting Scaling Relations Used in Large Scale Preparation with Microfluidic Measurement Methods. ChemEngineering 2020, 4, 63. https://doi.org/10.3390/chemengineering4040063.
[3] Kozyuk, O. V. Hydrodynamic Cavitation Techniques for Emulsification and Homogenization: Mechanisms, Equipment, Scale Up, and Industrial Challenges; author supplied review, 2026.
[4] Kozyuk, O. V. Use of Hydrodynamic Cavitation for Emulsifying and Homogenizing Processes. Application Note 1999, June 6-8.
[5] Gogate, P. R.; Pandit, A. B. Hydrodynamic Cavitation Reactors: A State of the Art Review. Reviews in Chemical Engineering 2001, 17 (1), 1-85. https://doi.org/10.1515/REVCE.2001.17.1.1.
[6] Omelyanyuk, M.; Ukolov, A.; Pakhlyan, I.; Bukharin, N.; El Hassan, M. Optimization of Rotational Hydrodynamic Cavitation Reactor Geometry. Fluids 2024, 9, 244. https://doi.org/10.3390/fluids9100244.
[7] Panda, D.; Saharan, V. K.; Manickam, S. Controlled Hydrodynamic Cavitation: A Review of Recent Advances and Perspectives for Greener Processing. Processes 2020, 8 (2), 220. https://doi.org/10.3390/pr8020220.
[8] Carpenter, J.; Pinjari, D. V. Critical Review on Hydrodynamic Cavitation as an Intensifying Homogenizing Technique for Oil in Water Emulsification: Theoretical Insight, Current Status, and Future Perspectives. Industrial & Engineering Chemistry Research 2022, 61 (30), 10587-10602. https://doi.org/10.1021/acs.iecr.2c00754.
[9] Kozyuk O. Hydrodynamic Cavitation. [Unpublished technical manuscript and supporting data] 2026.
[10] Pavoni, L.; Perinelli, D. R.; Bonacucina, G.; Cespi, M.; Palmieri, G. F. An Overview of Micro- and Nanoemulsions as Vehicles for Essential Oils: Formulation, Preparation and Stability. Nanomaterials 2020, 10, 135. https://doi.org/10.3390/nano10010135.
[11] Gupta, A.; Eral, H. B.; Hatton, T. A.; Doyle, P. S. Nanoemulsions: Formation, Properties and Applications. Soft Matter 2016, 12, 2826-2841.
[12] Håkansson, A. Estimating Breakup Frequencies in Industrial Emulsification Devices: The Challenge of Inferring Local Frequencies from Global Methods. Processes 2021, 9, 645. https://doi.org/10.3390/pr9040645.
[13] Gall, V.; Karbstein, H. P. Influence of Cavitation and Mixing Conditions on Oil Droplet Size in Simultaneous Homogenization and Mixing. ChemEngineering 2020, 4, 64. https://doi.org/10.3390/chemengineering4040064.
[14] Grumbach, C.; et al. A New Control Strategy for High Pressure Homogenization to Improve the Safety of Injectable Lipid Emulsions. Pharmaceutics 2022, 14, 1603. https://doi.org/10.3390/pharmaceutics14081603.
[15] Rayleigh, Lord. On the Pressure Developed in a Liquid during the Collapse of a Spherical Cavity. Philosophical Magazine 1917, 34, 94-98.
[16] Levkovskii, Yu. L. Structure of Cavitating Flows; Sudostroenie: Leningrad, 1978.
[17] Pernik, A. D. Problems of Cavitation; Sudostroenie: Leningrad, 1966.
[18] Kozyuk, O. V. Breakup of Drops in Hydrodynamic Cavitation Flow. Presented at the North American Mixing Forum, Affiliate of AIChE, June 26, 1997.
[19] Omelyanyuk, M.; et al. Experimental and Numerical Study of Cavitation Number Limitations for Hydrodynamic Cavitation Inception Prediction. Fluids 2022, 7, 198. https://doi.org/10.3390/fluids7060198.
[20] Kolmogorov, A. N. The Local Structure of Turbulence in Incompressible Viscous Fluid for Very Large Reynolds Numbers. Doklady Akademii Nauk SSSR 1941, 30, 301-305.
[21] Braginskii, P. N.; Begachev, V. I.; Barabash, V. M. Mixing in Liquid Media: Physical Fundamentals and Engineering Calculation Methods; Khimiya: Leningrad, 1984.
[22] Kozulin, Yu. V.; Pivovarov, V. G. Application of Isotropic Turbulence Theory to the Description of Cavitation Dispersion. In Automation, Mechanization, and Equipment for Pulp and Paper Production Processes; Khimiya: Leningrad, 1979; pp 64-67.
[23] Moser, W. R.; Giang, T.; Nguyen, S.; Kozyuk, O. V. A New Route to Cavitational Chemistry and Chemical Processing by Controlled Flow Cavitation. In Process Intensification for the Chemical Industry; BHR Group: Antwerp, 1999; pp 173-187.
[24] Upadhyay, M.; Ravi, A.; Ranade, V. V. Dense Oil in Water Emulsions Using Vortex Based Hydrodynamic Cavitation: Effective Viscosity, Sauter Mean Diameter, and Droplet Size Distribution. Industrial & Engineering Chemistry Research 2024, 63 (11), 4977-4990. https://doi.org/10.1021/acs.iecr.3c04555.
[25] Pandey, D. K.; Kumar, R.; Ranade, V. V. Breakage of a Single Oil Drop in Water via Acoustic and Hydrodynamic Cavitation. Physics of Fluids 2025, 37, 063311. https://doi.org/10.1063/5.0273687.
[26] Håkansson, A.; Olad, P.; Innings, F. Identification and Mapping of Three Distinct Breakup Morphologies in the Turbulent Inertial Regime of Emulsification: Effect of Weber Number and Viscosity Ratio. Processes 2022, 10, 2204. https://doi.org/10.3390/pr10112204.
[27] Håkansson, A. The Role of Stochastic Time Variations in Turbulent Stresses When Predicting Drop Breakup: A Review of Modelling Approaches. Processes 2021, 9, 1904. https://doi.org/10.3390/pr9111904.
[28] Pandey, D. K.; Kumar, R.; Ranade, V. V. A Simplified Droplet Breakage Model to Simulate Continuous Emulsification by Hydrodynamic Cavitation. ACS Omega 2026, 11 (10), 16248-16258. https://doi.org/10.1021/acsomega.5c11513.
[29] Gode, A.; Kourousis, K. I.; Ranade, V. V. Vortex Based Cavitation Devices for Continuous Emulsification: Influence of the Device Design, Scale Up, and Scale Out. Industrial & Engineering Chemistry Research 2026, 65 (15), 8081-8101. https://doi.org/10.1021/acs.iecr.6c00278.
[30] Kozyuk, O. V.; Fedotkin, I. M. Mathematical Model of the Process of Emulsification in Flow Cavitation Mixers. Chemical Apparatus Engineering 1988, K-47, 35-38.
[31] Zhang, W.; Xie, C.; Fan, H.; Liu, B. Influence of Hole Geometry on Performance of a Rotational Hydrodynamic Cavitation Reactor. Frontiers in Energy Research 2022, 10, 881811. https://doi.org/10.3389/fenrg.2022.881811.
[32] Achour, L.; Specklin, M.; Belaidi, I.; Kouidri, S. Numerical Assessment of the Hydrodynamic Behavior of a Volute Centrifugal Pump Handling Emulsion. Entropy 2022, 24, 221. https://doi.org/10.3390/e24020221.
[33] Kozyuk, O. V.; Fedotkin, I. M.; Osinin, S. G. On Certain Operating Regularities of a Cavitation Disperser. Khimicheskoe Mashinostroenie: Republican Interdepartmental Scientific and Technical Collection 1986, No. 44, 39-43.
[34] Kozyuk, O. V.; Fedotkin, I. M. The Efficiency of Emulsification in the Basic Types of Flow Cavitation Mixers. Chemical Apparatus Engineering 1989, K-49, 37-40.
[35] Ramisetty, K. A.; Pandit, A. B.; Gogate, P. R. Novel Approach of Producing Oil in Water Emulsion Using Hydrodynamic Cavitation Reactor. Industrial & Engineering Chemistry Research 2014, 53 (42), 16508-16515. https://doi.org/10.1021/ie502753d.
[36] Kozyuk, O. V. Method of obtaining a free disperse system in liquid and device for effecting the same. U.S. Patent 5810052 B1, July 7, 1997.
[37] Ranade, V. V.; et al. Vortex Diode Based Hydrodynamic Cavitation Device. U.S. Patent US9422952B2.
[38] Petrakov, A. D.; Maltsev, L. I.; et al. Rotor Hydrodynamic Cavitation Apparatus for Flow Cavitation in Liquid, Emulsion, or Suspension. Russian Patent RU2357791C1, 2009.
[39] SPX FLOW Technology Danmark A/S. Oil in Water Emulsion Food Product Produced Using Hydrodynamic Cavitation. Patent family including DK2895002T3 and WO2014040918A1.
[40] Vugrinec, B.; Kusec, G. Hydrodynamic Cavitation Mixer. European Patent Application EP4514524A1, 2025.
[41] Kozyuk, O. V. Method and Apparatus for Producing Ultra-Thin Emulsions and Dispersions. U.S. Patent 5,931,771, 3 August 1999.
[42] SPX FLOW. APV Cavitator Product Information. Technical information.
[43] Hydro Dynamics, Inc. ShockWave Power Reactor Product Line and Cavitation Technology. Vendor technical information.
[44] Soldo Cavitators. Homogenization and Emulsification Applications. Vendor technical information.
[45] Preiss, F. J.; Mutsch, B.; Kähler, C. J.; Karbstein, H. P. Scaling of Droplet Breakup in High Pressure Homogenizer Orifices. Part I: Comparison of Velocity Profiles in Scaled Coaxial Orifices. ChemEngineering 2021, 5, 7. https://doi.org/10.3390/chemengineering5010007.
[46] Mutsch, B.; Preiss, F. J.; Dagenbach, T.; Karbstein, H. P.; Kahler, C. J. Scaling of Droplet Breakup in High Pressure Homogenizer Orifices. Part II: Visualization of the Turbulent Droplet Breakup. ChemEngineering 2021, 5 (2), 31. https://doi.org/10.3390/chemengineering5020031.
[47] Bisten, A.; et al. Optical Measuring Methods for the Investigation of High Pressure Homogenisation. Processes 2016, 4, 41. https://doi.org/10.3390/pr4040041.
[48] Gall, V.; Runde, M.; Schuchmann, H. P. Extending Applications of High Pressure Homogenization by Using Simultaneous Emulsification and Mixing: An Overview. Processes 2016, 4, 46. https://doi.org/10.3390/pr4040046.
[49] Hou, Y.; Ren, X.; Huang, Y.; Xie, K.; Wang, K.; Wang, L.; Wei, F.; Yang, F. Effects of Hydrodynamic Cavitation on Physicochemical Structure and Emulsifying Properties of Tilapia (Oreochromis niloticus) Myofibrillar Protein. Frontiers in Nutrition 2023, 10, 1116100. https://doi.org/10.3389/fnut.2023.1116100.
[50] Microfluidics. Nano Encapsulation Using Microfluidizer Technology Platform; company technical presentation; Newton, Massachusetts.
[51] Microfluidics. Materials Processing Data Sheet: Food Oil and Water Emulsion, Reference FY90998, 2005.
[52] Microfluidics. Materials Processing Data Sheet: Flavor Emulsion, Reference FY88995, 2005.
[53] Microfluidics. Materials Processing Data Sheet: Cosmetic 2% Oil in Water Emulsion, Reference CSY99093, 2005.
[54] Microfluidics. Materials Processing Data Sheet: Anti-Wrinkle Cream, Reference CSY959971,2008.
[55] Panagiotou, T.; Bernard, J. M.; Mesite, S. V. Nanoemulsions Using the Microfluidizer Technology; Microfluidics technical report, 8 December 2005.
[56] Ravi, A.; Ranade, V. V. Droplet Size Distribution of Oil in Milk Emulsions: Continuous Emulsification via a Vortex Based Hydrodynamic Cavitation Device. ACS Omega 2025, 10, 57503–57519. https://doi.org/10.1021/acsomega.5c08173.
[57] Sim, J. Y. Applications of Hydrodynamic Cavitation in Dairy Manufacturing: Process Development and Standardization. M.S. Thesis, South Dakota State University, Brookings, SD, 2020. Electronic Theses and Dissertations, No. 3940.
[58] He, M.; et al. Effects of Cavitation Jet Treatment on the Structure and Emulsification Properties of Oxidized Soy Protein Isolate. Foods 2021, 10, 2. https://doi.org/10.3390/foods10010002.
[59] Psakis, G.; et al. Exploring Hydrodynamic Cavitation for Citrus Waste Valorisation in Malta: From Beverage Enhancement to Potato Sprouting Suppression and Water Remediation. Frontiers in Chemistry 2024, 12, 1411727. https://doi.org/10.3389/fchem.2024.1411727.
[60] Zhang, Z.; Wang, G.; Nie, Y.; Ji, J. Hydrodynamic Cavitation as an Efficient Method for the Formation of Sub-100 nm O/W Emulsions with High Stability. Chinese Journal of Chemical Engineering 2016, 24 (10), 1477-1480.
[61] Hidajat, M. J.; Jo, W.; Kim, H.; Noh, J. Effective Droplet Size Reduction and Excellent Stability of Limonene Nanoemulsion Formed by High Pressure Homogenizer. Colloids and Interfaces 2020, 4, 5. https://doi.org/10.3390/colloids4010005.
[62] Gawin Mikołajewicz, A.; et al. The Effect of High Pressure Homogenization Conditions on the Properties and Stability of Nanoemulsions. Pharmaceutics 2024, 16, 11. https://doi.org/10.3390/pharmaceutics16010011.
[63] Li, Y.; Jin, H.; Sun, X.; Sun, J.; Liu, C.; Liu, C.; Xu, J. Physicochemical Properties and Storage Stability of Food Protein Stabilized Nanoemulsions. Nanomaterials 2019, 9, 25. https://doi.org/10.3390/nano9010025.
[64] Michel, F. C., Jr.; Kozyuk, O. Hydrodynamic Cavitation Processing. In Chemical Processes for a Sustainable Future; Royal Society of Chemistry: Cambridge, 2014; Chapter 5, pp 84-142.
[65] Arisdyne Systems. Controlled Flow Cavitation Equipment and Edible Oil Processing Applications. Technical information.
[66] Sahota, R. S.; Dakka, S. M. Investigation of the Stability of Water in Oil Biofuel Emulsions Using Sunflower Oil. ChemEngineering 2020, 4, 36. https://doi.org/10.3390/chemengineering4020036.
[67] Griffin, W. C. Classification of Surface Active Agents by HLB. Journal of the Society of Cosmetic Chemists 1949, 1, 311-326.
[68] Bauman, K. V.; Kots, I. V. Experimental Studies of a New Cavitation Technology for Preparation of Bitumen Emulsions. Transactions of Kremenchuk Mykhailo Ostrohradskyi National University 2012, 3 (74), 76–79.
[69] Parthasarathy, S.; Tang, S. Y.; Manickam, S. Generation and Optimization of Palm Oil Based Oil in Water Submicron Emulsions and Encapsulation of Curcumin Using a Liquid Whistle Hydrodynamic Cavitation Reactor. Industrial & Engineering Chemistry Research 2013, 52 (34), 11829-11837. https://doi.org/10.1021/ie401254t.
[70] Ravi, A.; Ganjare, A. V.; Ranade, V. V. At Line Characterization of Droplet Size Distributions Using a Simple, Voltage Based Sensor for Continuous Production of Dense Oil in Water Emulsions. Industrial & Engineering Chemistry Research 2025. https://doi.org/10.1021/acs.iecr.4c03979.
[71] Lee, L. Processing Nanoemulsions Using High Pressure Devices; University of Birmingham, Food Microstructure Group, research report, date not stated.
[72] Chidambaranathapillai, S.; Cravotto, C.; Kamler, A. V.; Nikonov, R. V.; Sivakumar, M.; Cravotto, G. An Overview of Current Insights and New Perspectives for Semi Industrial Applications of Cavitation Reactors. Processes 2025, 13, 4033. https://doi.org/10.3390/pr13124033.