
Technical publication
Back to publications
Other
Fabrication of High Performance Catalysts by Controlled Flow Cavitation
okozyuk.com
Published
Read complete publication for whole-document Find and printing. Browser Find and native printing on this reader include only loaded content.
2 Coupled Engineering and Materials Framework
Catalyst formation under cavitation is governed by two coupled histories. The hydrodynamic history includes acceleration through a restriction, low pressure exposure, bubble growth, turbulent shear, pressure recovery, collapse, and possible recycle. The material history includes supersaturation, nucleation, gel formation, fragmentation, solute transfer, crystallite growth, aggregation, washing, drying, and activation. A rigorous process description must document both histories.
The following equations provide an engineering framework for interpreting experiments, but they do not replace direct measurement. Loss coefficients, discharge coefficients, non-Newtonian rheology, dissolved gas, multiphase slip, and solids blockage can cause substantial deviations from ideal relations. Their principal value is to require explicit definition of pressure reference locations, geometry, fluid properties, and exposure time.
2.1 Pressure, Velocity, Reynolds Number, and Cavitation Number
For an incompressible liquid between an upstream point and a restriction throat, the mechanical energy balance can be written with a lumped irreversible loss term. Elevation is usually small in a compact processor, but it is retained in Equation 2.1 for completeness.
Here, and are the upstream and throat static pressures, and are the corresponding average velocities, is elevation, is liquid density, is gravitational acceleration, and represents irreversible pressure loss. For a restriction with a calibrated discharge coefficient , a useful estimate of throat velocity is given by Equation 2.2:
The Reynolds number describes the ratio of inertial to viscous effects and helps distinguish changes in jet structure and turbulence. For a noncircular throat, the hydraulic diameter should be reported.
Cavitation number is commonly used to compare the recovered pressure with vapor pressure relative to the throat dynamic pressure. The value is highly sensitive to the selected downstream pressure location. Investigators must state whether is measured immediately after the restriction, after pressure recovery, or in the recycle tank.
A low value of generally favors vapor cavity formation, but it does not uniquely define collapse intensity. Increasing back pressure can shorten the bubble cloud and move collapse closer to the restriction. Increasing temperature raises vapor pressure and may increase cavity volume while simultaneously cushioning collapse with more vapor. Solids and dissolved gas can provide nuclei, attenuate pressure waves, or change the recovery profile. These competing effects explain why crystallite size and strain often respond nonmonotonically to an orifice setting.
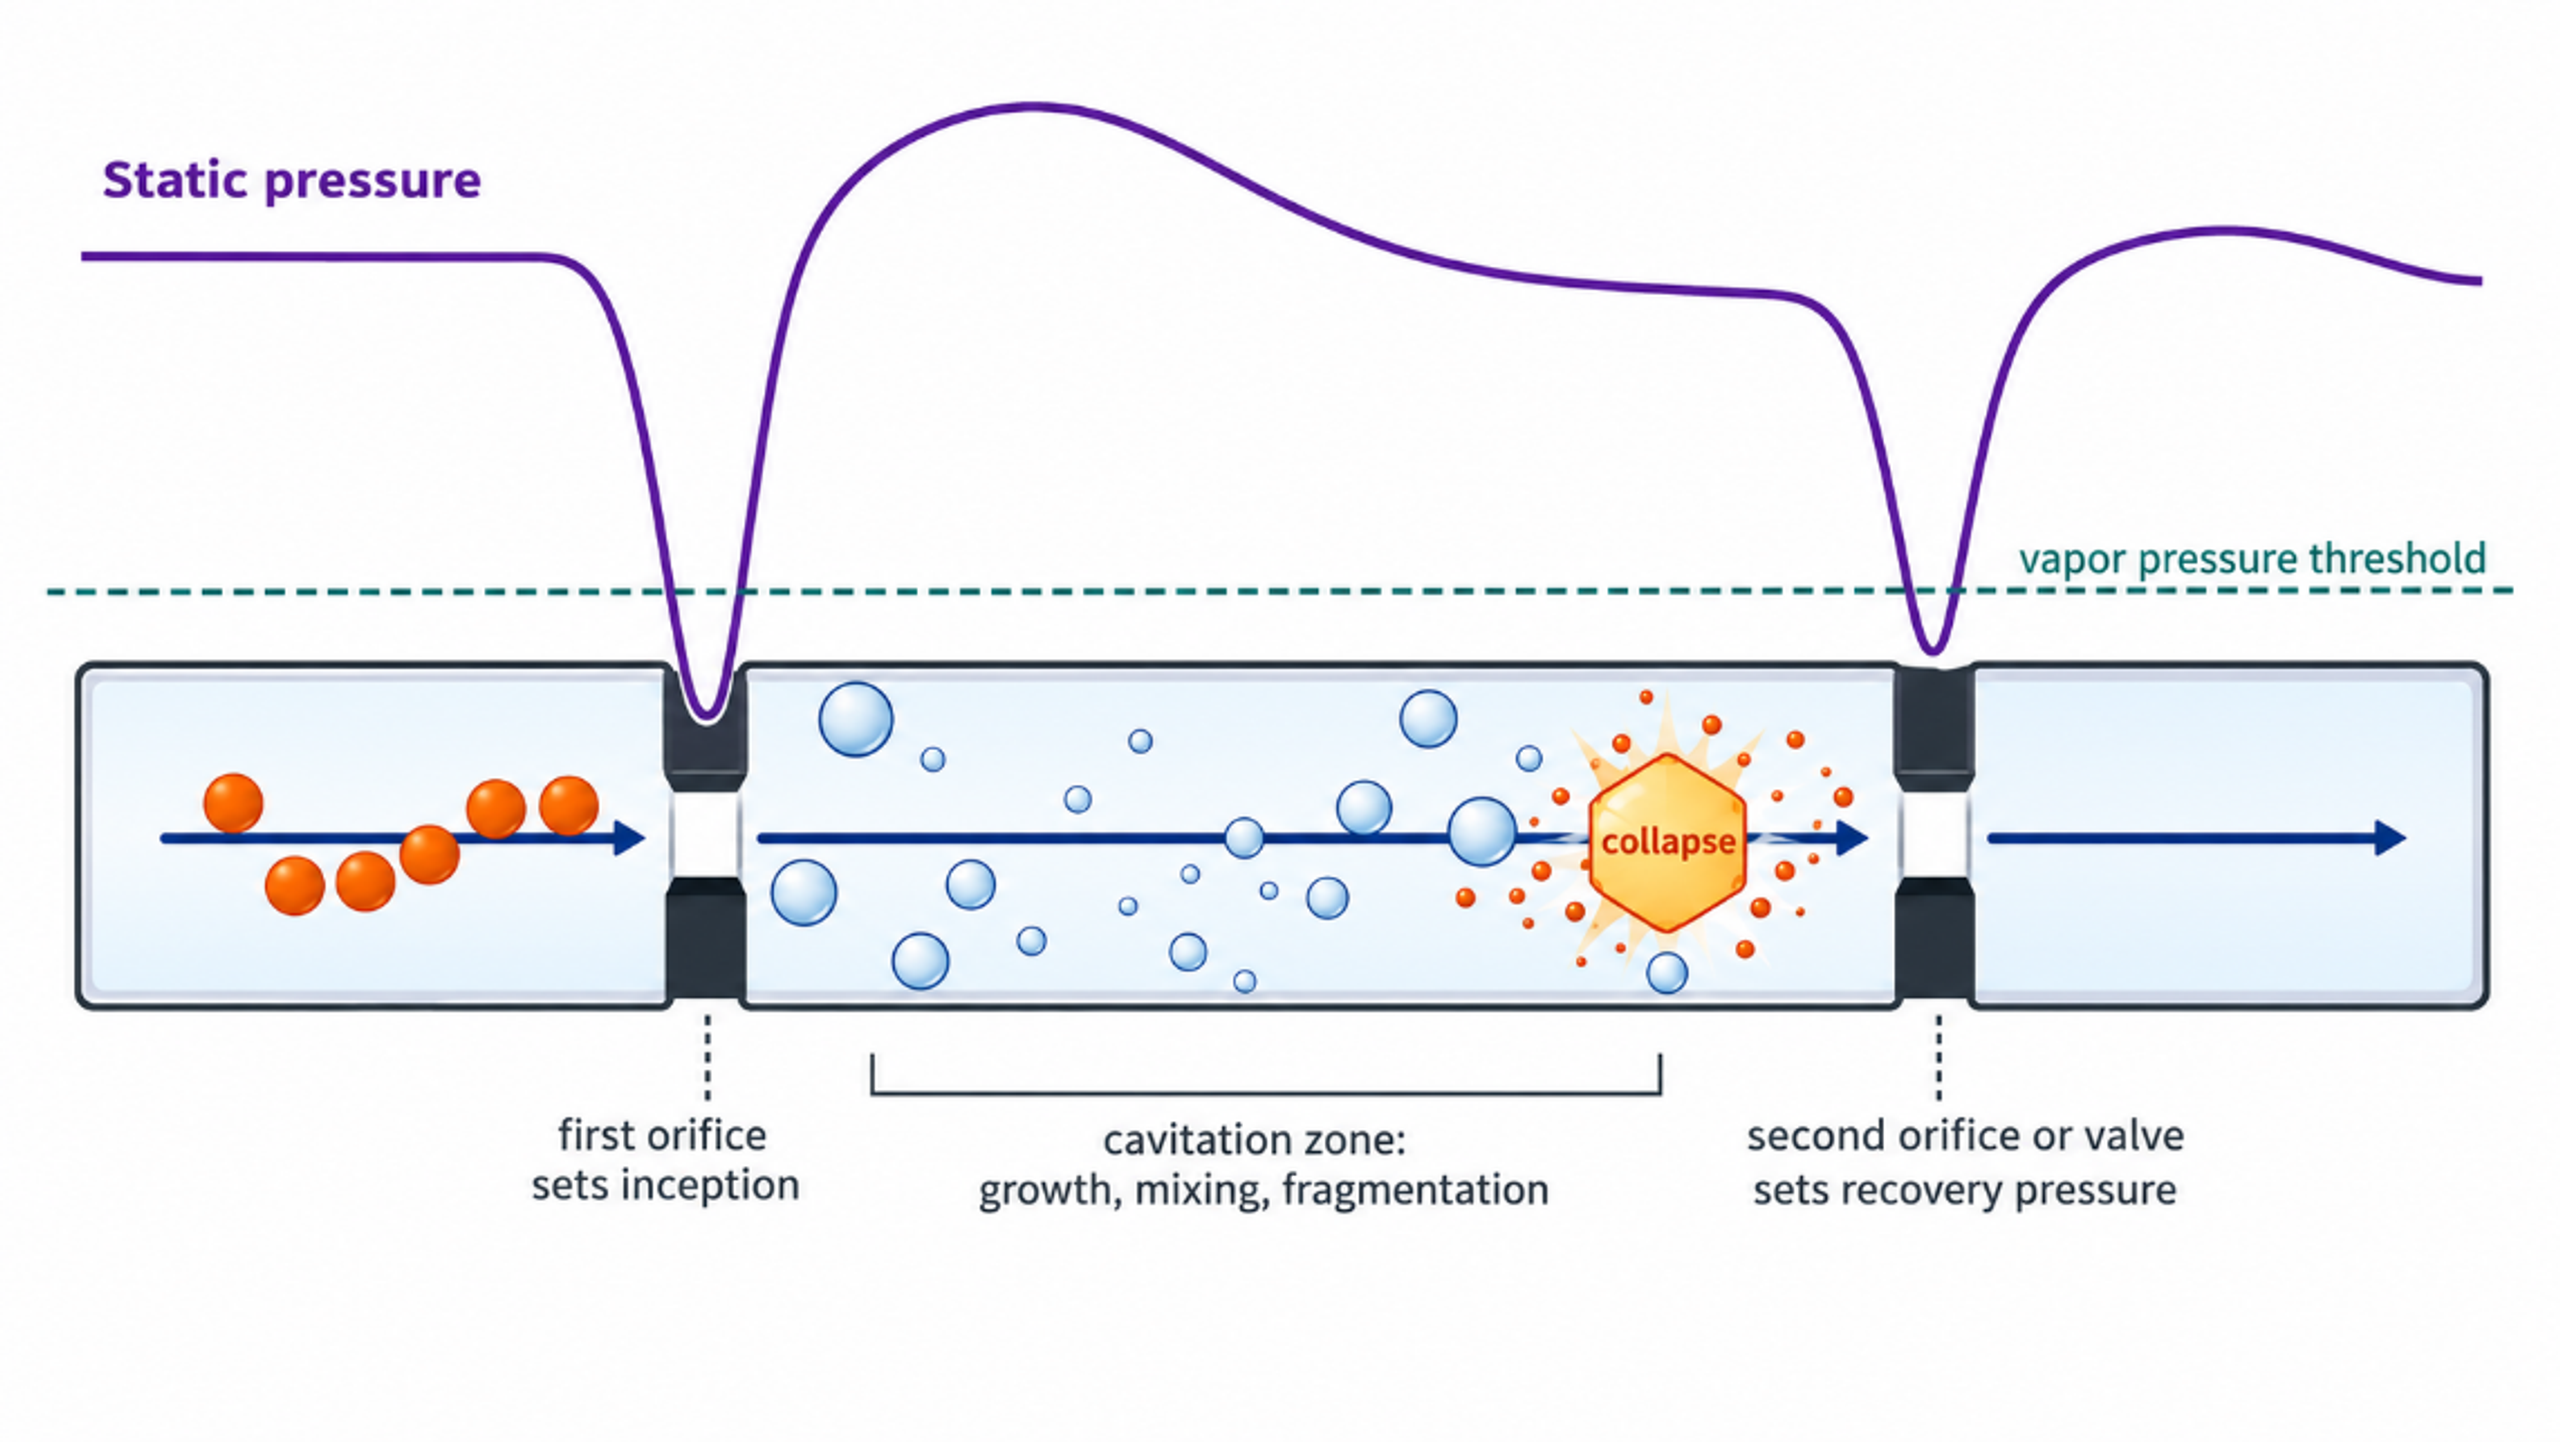
Figure 2.2. Conceptual pressure history and material events in a dual restriction cavitation processor. The pressure trace is schematic and is not a measured record. [29].
2.2 Bubble Growth, Collapse, and Particle Interaction
A spherical bubble in a Newtonian liquid can be described by the Rayleigh-Plesset equation:
Although a real CFC cloud contains interacting, nonspherical bubbles in a turbulent pressure field, the Rayleigh-Plesset relation identifies the principal roles of far field pressure, internal bubble pressure, surface tension, viscosity, and bubble radius [15-17,21].
For an ideal empty cavity that begins collapse at radius under a constant pressure difference, the Rayleigh collapse time is approximated by Equation 2.6:
An order of magnitude estimate of mechanical work available from collapse is the pressure difference multiplied by the maximum cavity volume:
Only a fraction of this idealized work is transferred to a particle. Energy is partitioned among liquid compression, pressure waves, microjets, viscous dissipation, rebound, and thermal effects. Near a solid surface, asymmetric collapse can direct a microjet toward the particle or wall. In a slurry, particle-bubble contact depends on solids concentration, bubble population, particle size, surface wetting, and cloud residence time. Equation 2.7 should therefore be used for scaling and sensitivity analysis rather than to assign a unique particle temperature.
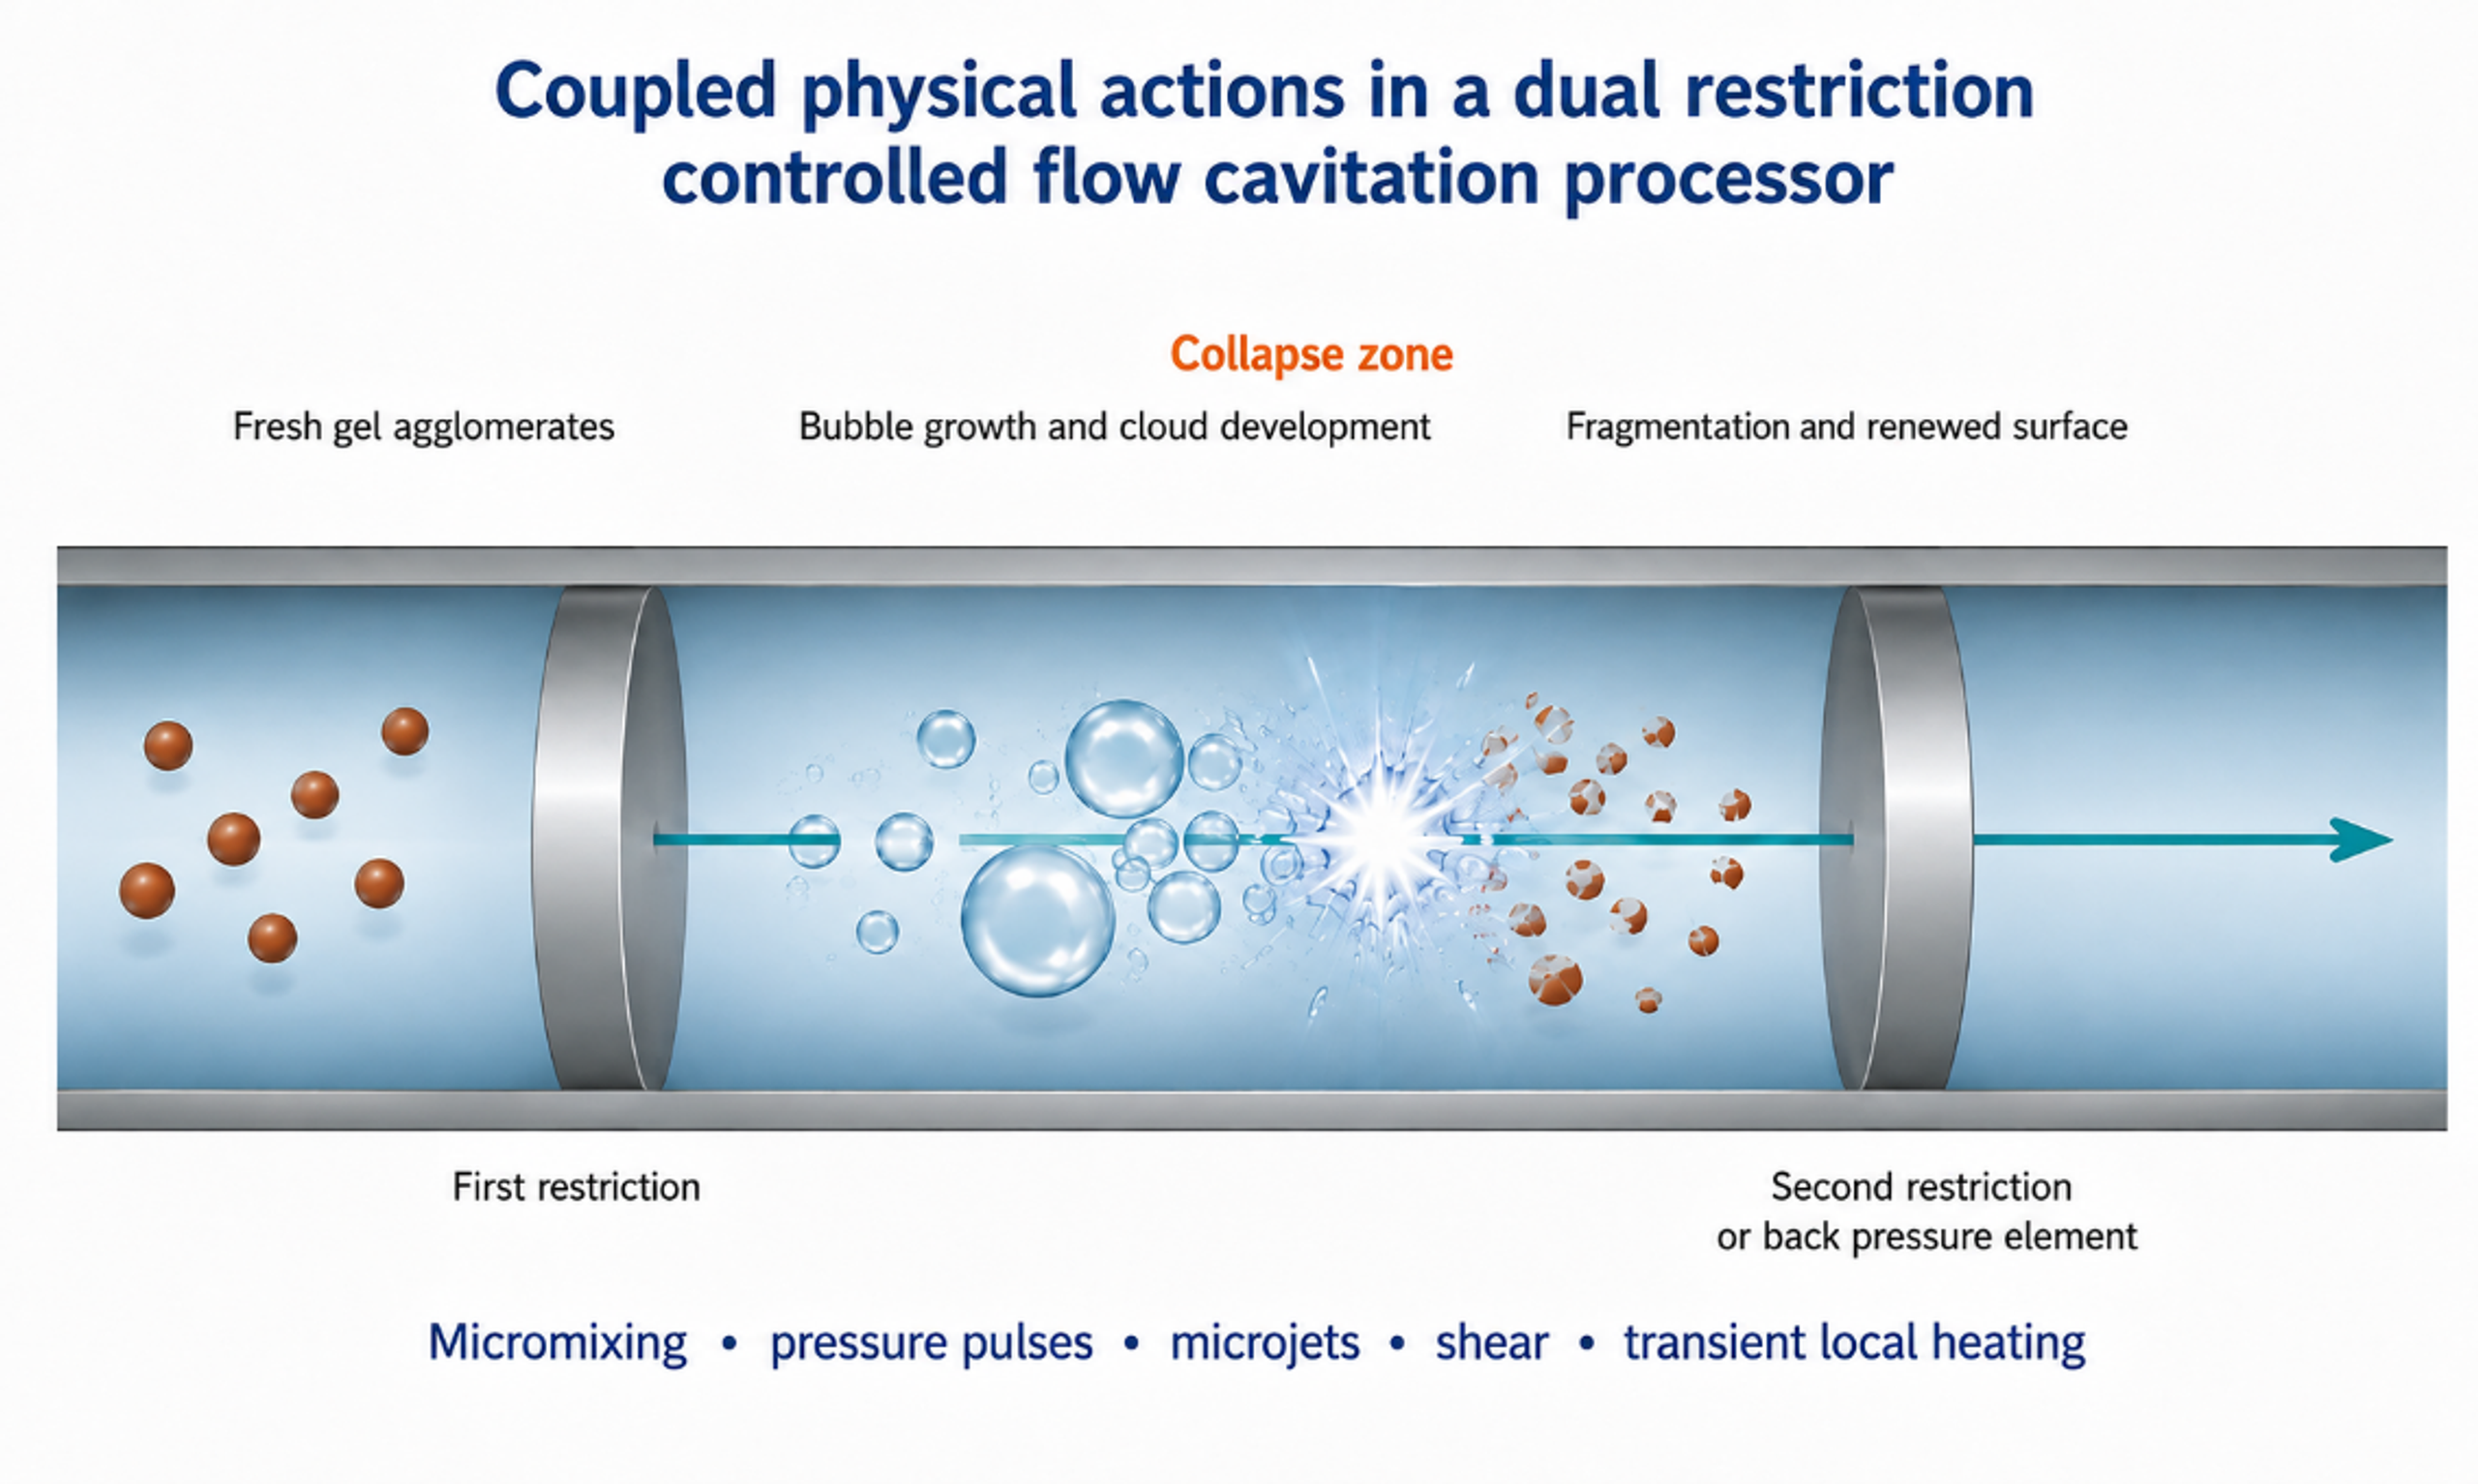
Figure 2.3. Coupled bubble and particle mechanisms in cavitation device. Rapid mixing, gel fragmentation, asymmetric collapse, surface renewal, and short local thermal events can act simultaneously. [29].
2.3 Hydraulic Power, Cumulative Exposure, and Residence Time
Hydraulic power transferred across the processor is estimated from pressure drop and volumetric flow. Pump efficiency must be included when electrical energy is compared:
For a recycle run, the specific hydraulic energy referred to isolated dry solids is given by Equation 2.9. The isolated mass rather than the theoretical precursor mass should be used so that yield loss is included:
The nominal number of loop passes, and the mean loop residence time are useful descriptors, provided that bypass volume and dead volume are included:
Single pass operation provides the clearest exposure definition and is preferred for kinetic studies. Recycle can increase cumulative treatment and narrow a weak agglomerate distribution, but it creates a distribution of exposure counts in which some particles pass through the restriction more often than others. Excessive recycle can promote dissolution and reprecipitation, pump heating, wear contamination, or irreversible agglomeration during warm storage. The optimum is therefore defined by a product quality window rather than by the maximum number of passes.
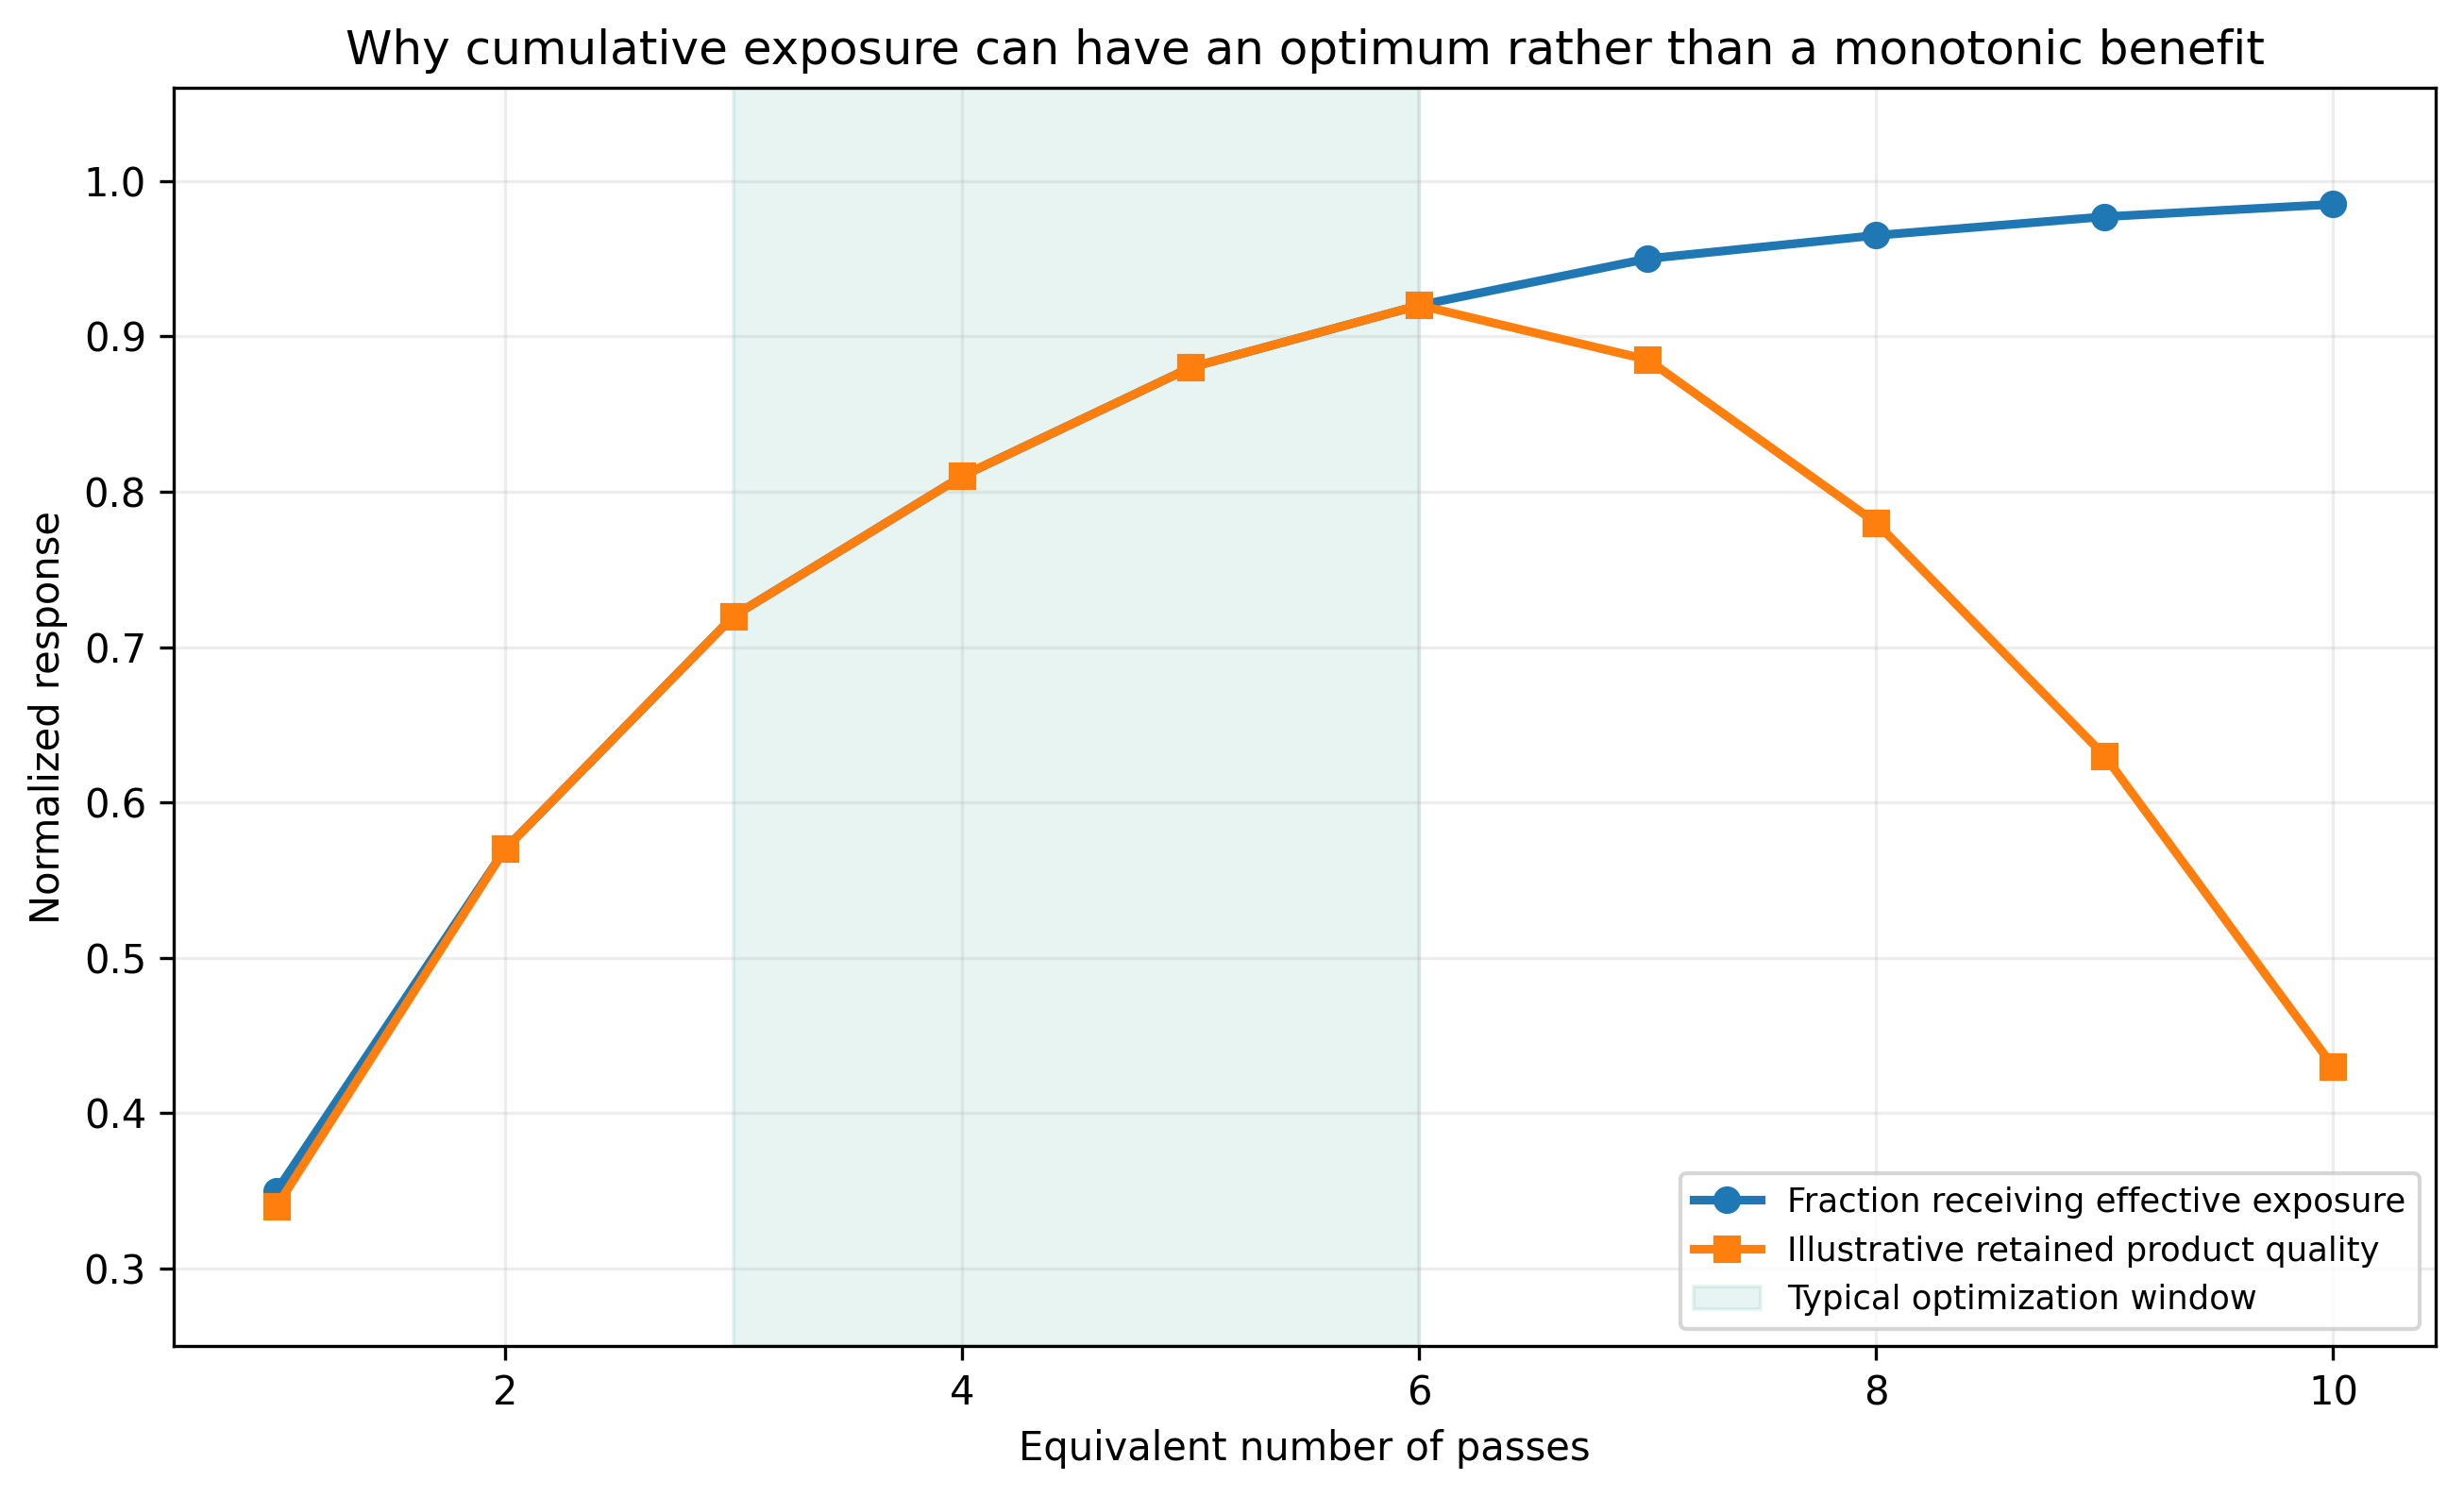
Figure 2.4. Conceptual relation between cumulative passes and product quality. Initial treatment improves mixing and deagglomeration, followed by a plateau and a possible overprocessing region. [29].
2.4 Micromixing, Supersaturation, Nucleation, and Growth
The smallest turbulent length scale is often estimated with the Kolmogorov relation. It is an ideal isotropic turbulence concept, but it provides a useful connection between local energy dissipation and the size of concentration fluctuations:
The associated mixing time scale is approximated by Equation 2.13:
Here, is kinematic viscosity and is the mass specific turbulent energy dissipation rate. The Microfluidics reaction study supplied with the source materials reported estimated mixing scales in the tens of nanometers and mixing times in the microsecond range for high pressure impinging jets [12]. Cavitation device geometries differ, but the study illustrates the degree to which intense, fixed geometry processing can reduce the lifetime of concentration gradients.
Supersaturation is the chemical driving force for precipitation. It may be represented as a concentration ratio or as relative excess concentration. The chosen definition must be stated:
Classical nucleation theory gives the critical radius of a spherical nucleus as Equation 2.15, where is the solid-liquid interfacial energy, is molar volume, is the gas constant, and is absolute temperature:
The nucleation rate is commonly represented in an Arrhenius form with a barrier :
Cavitation can modify both the preexponential factor and the effective nucleation barrier by changing local supersaturation, collision frequency, surface renewal, and heterogeneous nucleation sites. It can also accelerate growth by reducing diffusion resistance. These effects compete: higher nucleation density tends to reduce the mass available per nucleus, whereas enhanced transport and local warming can accelerate growth. Consequently, a smaller orifice, higher pressure, or lower cavitation number does not necessarily produce a smaller final crystallite.
Table 2.1. Engineering variables and the material forming responses they can influence
| Engineering variable | Primary physical effect | Material response to measure | Common interpretation error |
|---|---|---|---|
| Upstream pressure | Changes jet velocity, pump heating, and pressure differential | Phase, agglomerate size, crystallite size, strain, yield | Assuming pressure alone equals cavitation intensity |
| Restriction geometry | Changes inception, jet contraction, cloud shape, and blockage sensitivity | Residence history, particle size distribution, erosion metals | Comparing only nominal diameter |
| Back pressure | Moves pressure recovery and collapse zone | Structure, temperature rise, erosion, repeatability | Assuming visible cavitation is the strongest collapse |
| Flow rate | Changes Reynolds number, renewal frequency, and pass time | Productivity, conversion, pass distribution | Ignoring loop inventory and bypass volume |
| Temperature | Changes viscosity, vapor pressure, kinetics, and ripening | Yield, phase, grain size, bulk temperature history | Treating temperature only as a fluid property |
| Solids loading | Changes attenuation, rheology, collision frequency, and pressure loss | Recovery, blockage, abrasion, agglomeration | Scaling dilute results directly to concentrated slurry |
| Feed timing | Sets the age of precipitate at first exposure | Composition uniformity, induction time, phase purity | Treating hydrodynamics separately from precipitation chemistry |
2.5 Surface Area, Diffraction Size, Microstrain, and Active Area
For ideal, non-porous spherical particles of equivalent diameter and solid density , the mass-specific surface area () is inversely proportional to the particle diameter:
This relation explains why small crystallites can expose a large fraction of surface atoms, but it does not predict BET area when pores, necks, platelets, support interfaces, or inaccessible internal surfaces are present. X-ray line broadening provides an independent estimate of crystallite size. The Scherrer equation is given in Equation 2.18:
If both finite size and strain contribute to broadening, the Williamson Hall form is useful:
Here, is the shape factor, is X-ray wavelength, is corrected integral breadth, is the Bragg angle, and is microstrain. Instrument broadening must be measured with a standard. Whole pattern refinement and microscopy are preferable to a single peak estimate. X-ray crystallite size, electron microscopy particle size, dynamic light scattering diameter, and laser diffraction agglomerate size describe different structural levels and should not be used interchangeably.
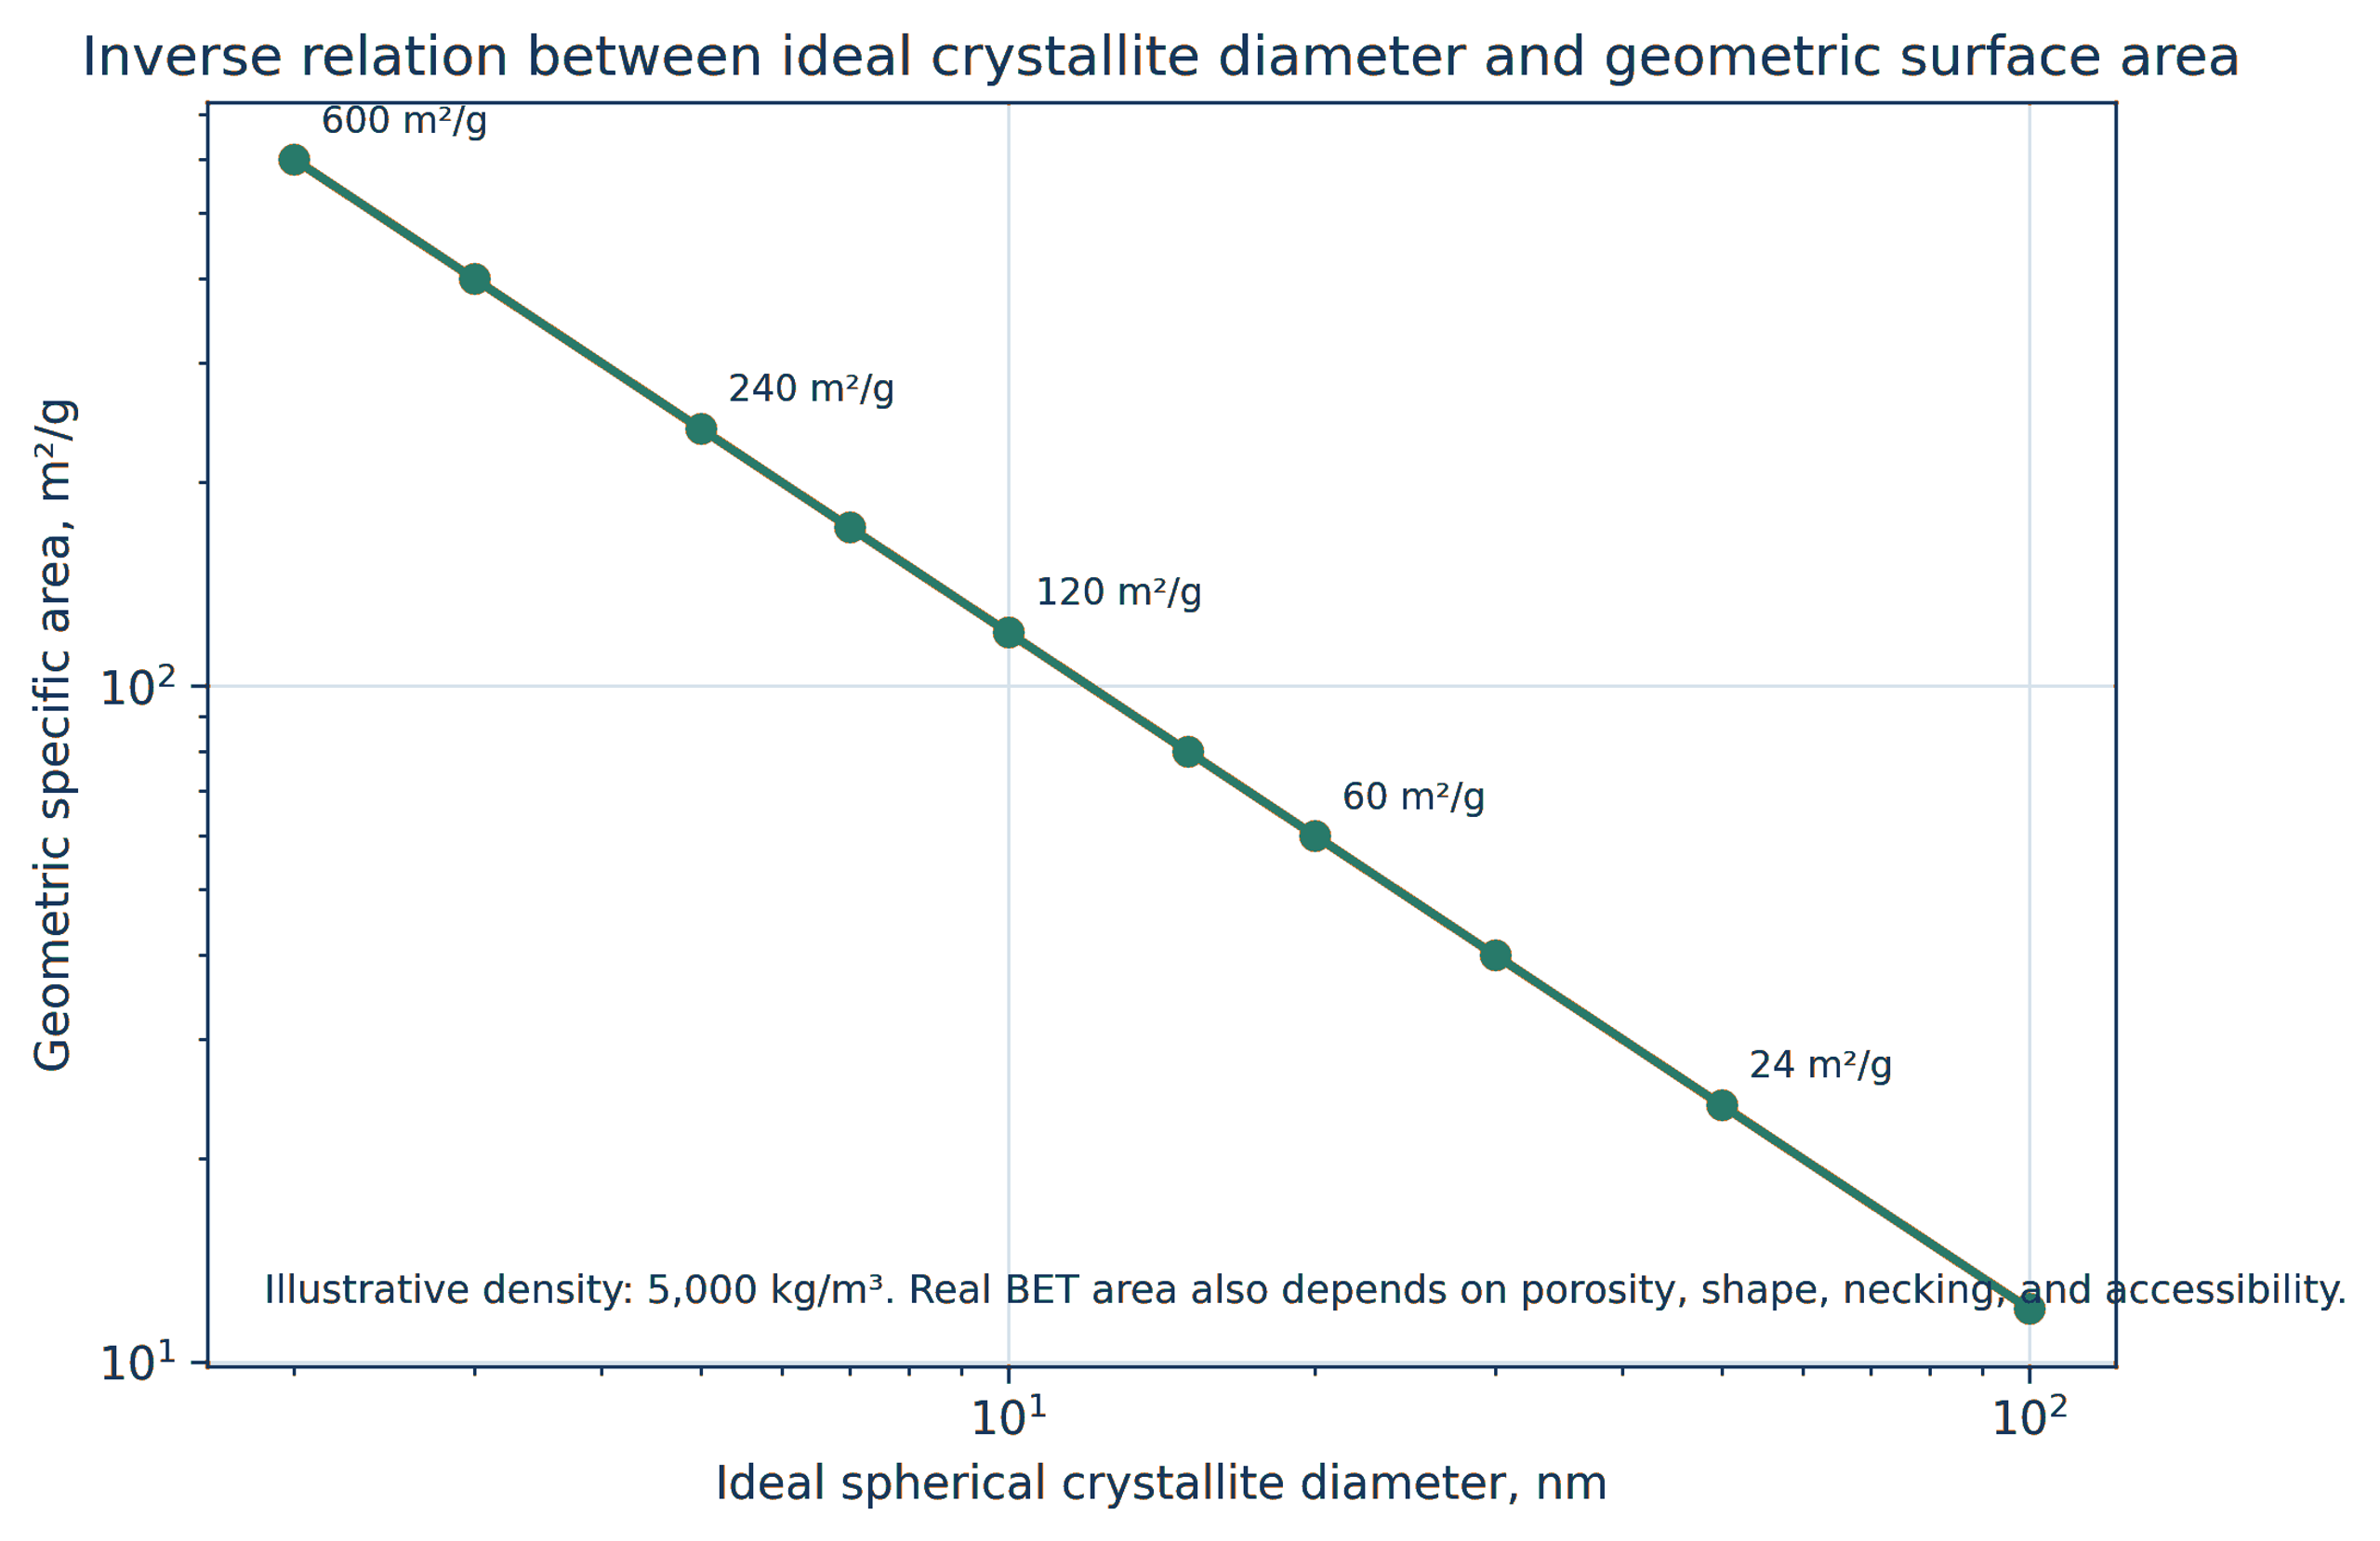
Figure 2.5. Ideal geometric area per unit mass as a function of crystallite diameter for representative oxide densities. The graph illustrates Equation 2.17. [29].
Table 2.2. Characterization methods and interpretation limits for CFC catalyst products
| Method | Primary output | Required control | Important limitation |
|---|---|---|---|
| X ray diffraction | Phase, crystallite size, lattice parameter, microstrain | Instrument standard and multiple reflections | Insensitive to amorphous material and very small or dilute phases |
| Electron microscopy | Primary particles, agglomerates, interfaces, morphology | Representative fields and calibrated scale | Drying and sampling can bias morphology |
| BET gas adsorption | Accessible surface area and pore volume | Degassing protocol and adsorption model | Does not identify active chemical sites |
| Chemisorption | Metal dispersion and exposed active area | Defined reduction and adsorption stoichiometry | Strong support interaction can complicate uptake |
| X ray photoelectron spectroscopy | Surface composition and oxidation state | Charge correction and reference materials | Shallow sampling depth and air transfer effects |
| X ray absorption spectroscopy | Local coordination and oxidation state | Appropriate standards and in situ cell | Average signal can mask multiple populations |
| Particle size analysis | Hydrodynamic or optical agglomerate distribution | Refractive index, viscosity, dispersion protocol | Result depends strongly on dispersion state |
| ICP OES or ICP MS | Bulk composition and wear contamination | Digestion recovery and blanks | No information about spatial distribution |