
Technical publication
Back to publications
Fabrication of High Performance Catalysts by Controlled Flow Cavitation
okozyuk.com
Published
Fabrication of High Performance Catalysts by Controlled Flow Cavitation
Abstract
Controlled flow cavitation (CFC) is evaluated as a process intensification method for the synthesis and conditioning of high performance catalyst materials. The method couples rapid precipitation or reduction with pressure driven cavitation so that micromixing, bubble collapse, shear, microjet impact, fragmentation, interfacial renewal, and transient thermal effects act on reactive intermediates before extensive aging. This article integrates hydrodynamic and materials frameworks for interpreting catalyst formation, including pressure and velocity relations, cavitation number, bubble dynamics, hydraulic energy, residence time, micromixing, supersaturation, nucleation, and diffraction based structural metrics. Reported CFC results are reviewed for perovskites, copper-zinc-aluminum oxides, cobalt molybdate, supported gold, silver, platinum, bismuth molybdate, titania, lead zirconate titanate, nanocalcite, nano ZnO, iron oxide, and catalyst slurries. The evidence indicates that CFC can improve phase homogeneity, control crystallite and agglomerate size, modify microstrain, and increase dispersion in selected systems, but responses are often nonmonotonic and strongly coupled to precursor chemistry, pressure recovery, solids loading, residence history, washing, drying, and activation. Structural improvement does not by itself establish catalytic improvement; active state characterization, intrinsic kinetics, selectivity, stability, and transport controls remain necessary. Experimental design, scale up, process analytical technology, safety, erosion, energy, and product equivalence requirements are also defined. Scale up should preserve material forming history and active state performance rather than nominal pressure or cavitation number alone.
1 Introduction
This article establishes the hydraulic definitions, energy boundaries, residence time expressions, uncertainty requirements, and scale translation principles needed to evaluate controlled flow cavitation for catalyst manufacture. The framework is then applied to the mechanisms, models, characterization methods, and acceptance criteria specific to catalyst synthesis and conditioning.
High performance catalyst manufacture requires simultaneous control across several length scales. The composition of a mixed precursor must remain uniform at the molecular or colloidal scale, primary crystallites must nucleate and grow within a defined size range, and weak agglomerates must remain recoverable without excessive hard sintering. Active metals and promoters must contact the support in the intended spatial arrangement. The structure formed during precipitation must also survive filtration, washing, drying, calcination, reduction, sulfidation, or other activation procedures.
Conventional stirred precipitation can produce high quality materials, but performance may be limited by local pH gradients, feed segregation, long micromixing times, broad residence time distributions, and aging before the slurry experiences intense mechanical treatment. Controlled flow cavitation (CFC) addresses these limitations by exposing a newly formed gel, hydroxide, carbonate, reduced metal, or support slurry to a pressure driven cavitation field immediately after formation. The short interval between chemical formation and hydrodynamic exposure is a defining feature because mixing and particle engineering occur while the intermediate remains soft, reactive, and susceptible to fragmentation [1-7].
Accordingly, CFC is best regarded as a synchronized reaction and particle engineering platform rather than as a cavitation device applied after synthesis. Pressure alone does not define the treatment condition. Material response depends on precursor chemistry, feed sequence, pH, temperature, restriction geometry, upstream pressure, pressure recovery, flow rate, dissolved gas, solids loading, viscosity, number of passes, and downstream stabilization. Identical nominal cavitation numbers can therefore produce different bubble populations and catalyst structures when these variables differ.
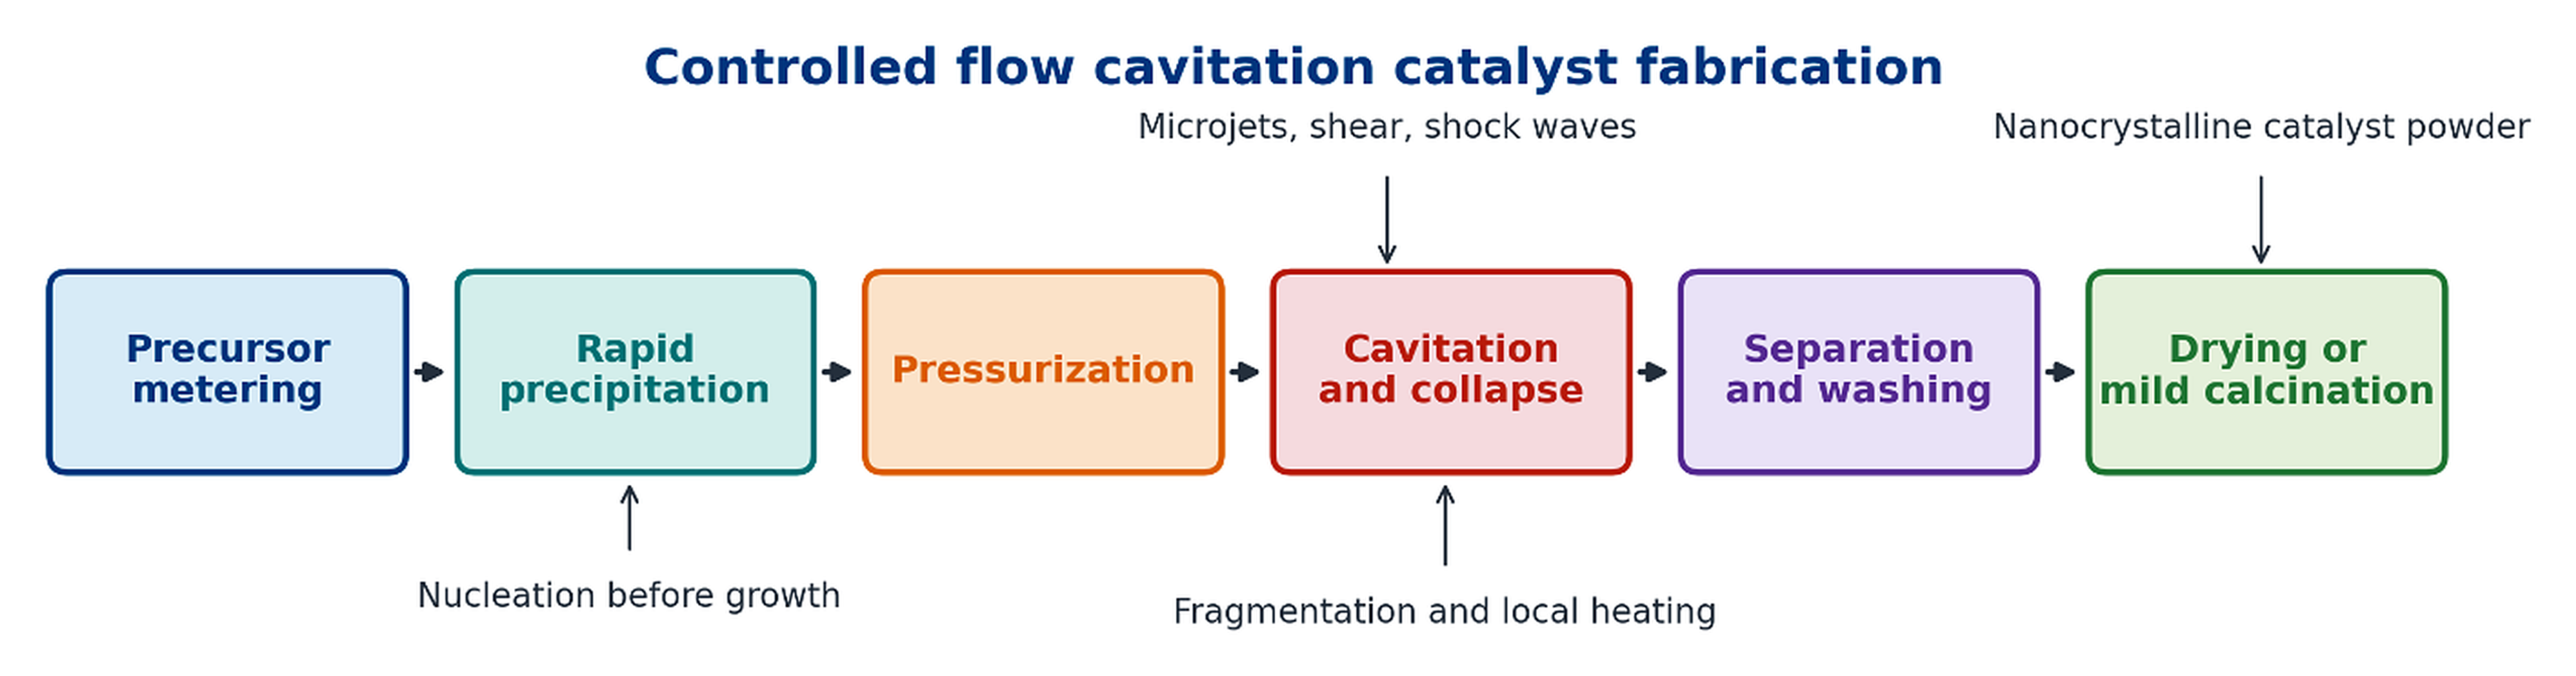
Figure 1.1. Integrated sequence for cavitation catalyst fabrication. [1-7].
Table 1.1. Evidence hierarchy for evaluating claims about CFC catalyst manufacture
| Evidence class | Typical measurements | What the evidence establishes | Principal limitation |
|---|---|---|---|
| Direct structural evidence | X ray diffraction, selected area electron diffraction, electron microscopy, BET area, chemisorption | Phase identity, crystallite size, morphology, dispersion, strain, and porosity after isolation | The isolated structure may differ from the catalyst under reaction conditions |
| Indirect process evidence | Pressure and flow records, precursor decomposition, rounded particles, bulk temperature rise | Compatibility with intense mixing, impact, localized heating, or accelerated conversion | Does not directly measure the pressure or temperature of individual collapse events |
| Catalytic evidence | Conversion, selectivity, intrinsic rate, turnover frequency, deactivation | Whether a defined catalyst performs better in a defined reaction | Must normalize loading, surface area, dispersion, transport, and activation history |
| Scale evidence | Mass balance, specific energy, run length, erosion, product statistics | Manufacturability, durability, and economic relevance | Laboratory pressure and throughput cannot be scaled by a single geometric ratio |
| Promotional or conceptual claim | Equipment literature, schematic mechanism, estimated local temperature | Useful hypothesis and development direction | Requires independent measurement and controlled comparison |
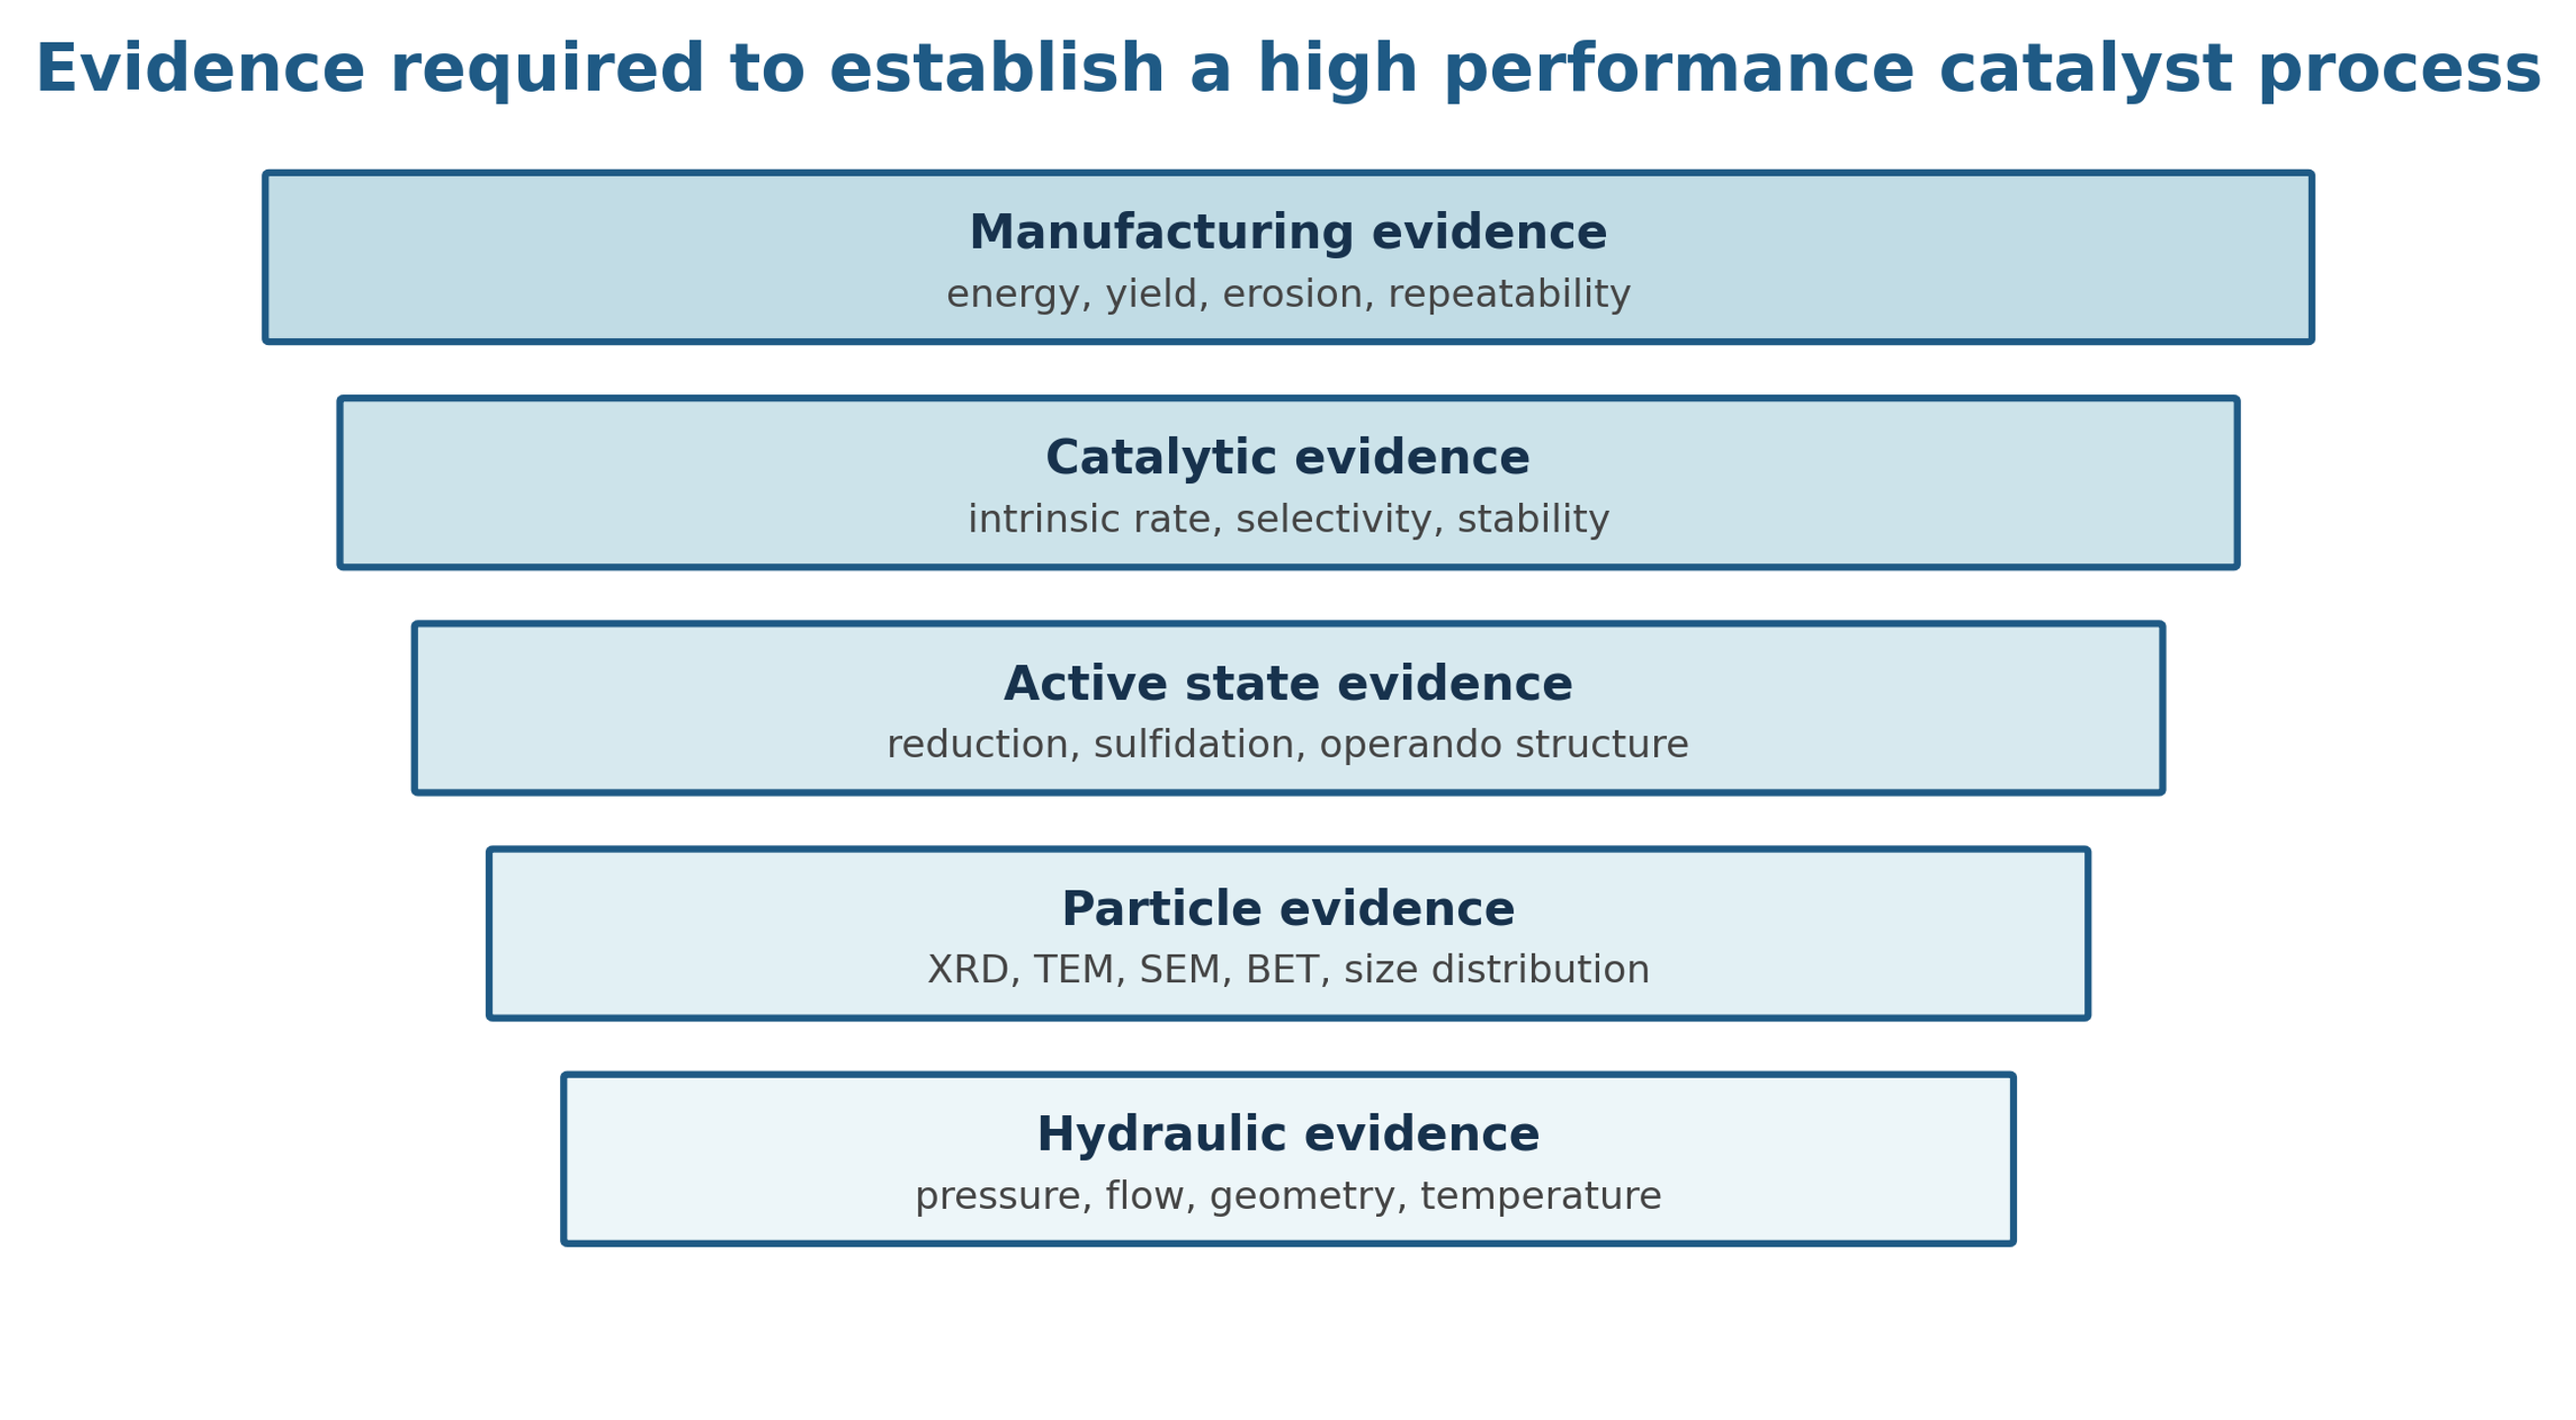
Figure 2.1. Evidence ladder for cavitation catalyst development. [29].
2 Coupled Engineering and Materials Framework
Catalyst formation under cavitation is governed by two coupled histories. The hydrodynamic history includes acceleration through a restriction, low pressure exposure, bubble growth, turbulent shear, pressure recovery, collapse, and possible recycle. The material history includes supersaturation, nucleation, gel formation, fragmentation, solute transfer, crystallite growth, aggregation, washing, drying, and activation. A rigorous process description must document both histories.
The following equations provide an engineering framework for interpreting experiments, but they do not replace direct measurement. Loss coefficients, discharge coefficients, non-Newtonian rheology, dissolved gas, multiphase slip, and solids blockage can cause substantial deviations from ideal relations. Their principal value is to require explicit definition of pressure reference locations, geometry, fluid properties, and exposure time.
2.1 Pressure, Velocity, Reynolds Number, and Cavitation Number
For an incompressible liquid between an upstream point and a restriction throat, the mechanical energy balance can be written with a lumped irreversible loss term. Elevation is usually small in a compact processor, but it is retained in Equation 2.1 for completeness.
Here, and are the upstream and throat static pressures, and are the corresponding average velocities, is elevation, is liquid density, is gravitational acceleration, and represents irreversible pressure loss. For a restriction with a calibrated discharge coefficient , a useful estimate of throat velocity is given by Equation 2.2:
The Reynolds number describes the ratio of inertial to viscous effects and helps distinguish changes in jet structure and turbulence. For a noncircular throat, the hydraulic diameter should be reported.
Cavitation number is commonly used to compare the recovered pressure with vapor pressure relative to the throat dynamic pressure. The value is highly sensitive to the selected downstream pressure location. Investigators must state whether is measured immediately after the restriction, after pressure recovery, or in the recycle tank.
A low value of generally favors vapor cavity formation, but it does not uniquely define collapse intensity. Increasing back pressure can shorten the bubble cloud and move collapse closer to the restriction. Increasing temperature raises vapor pressure and may increase cavity volume while simultaneously cushioning collapse with more vapor. Solids and dissolved gas can provide nuclei, attenuate pressure waves, or change the recovery profile. These competing effects explain why crystallite size and strain often respond nonmonotonically to an orifice setting.
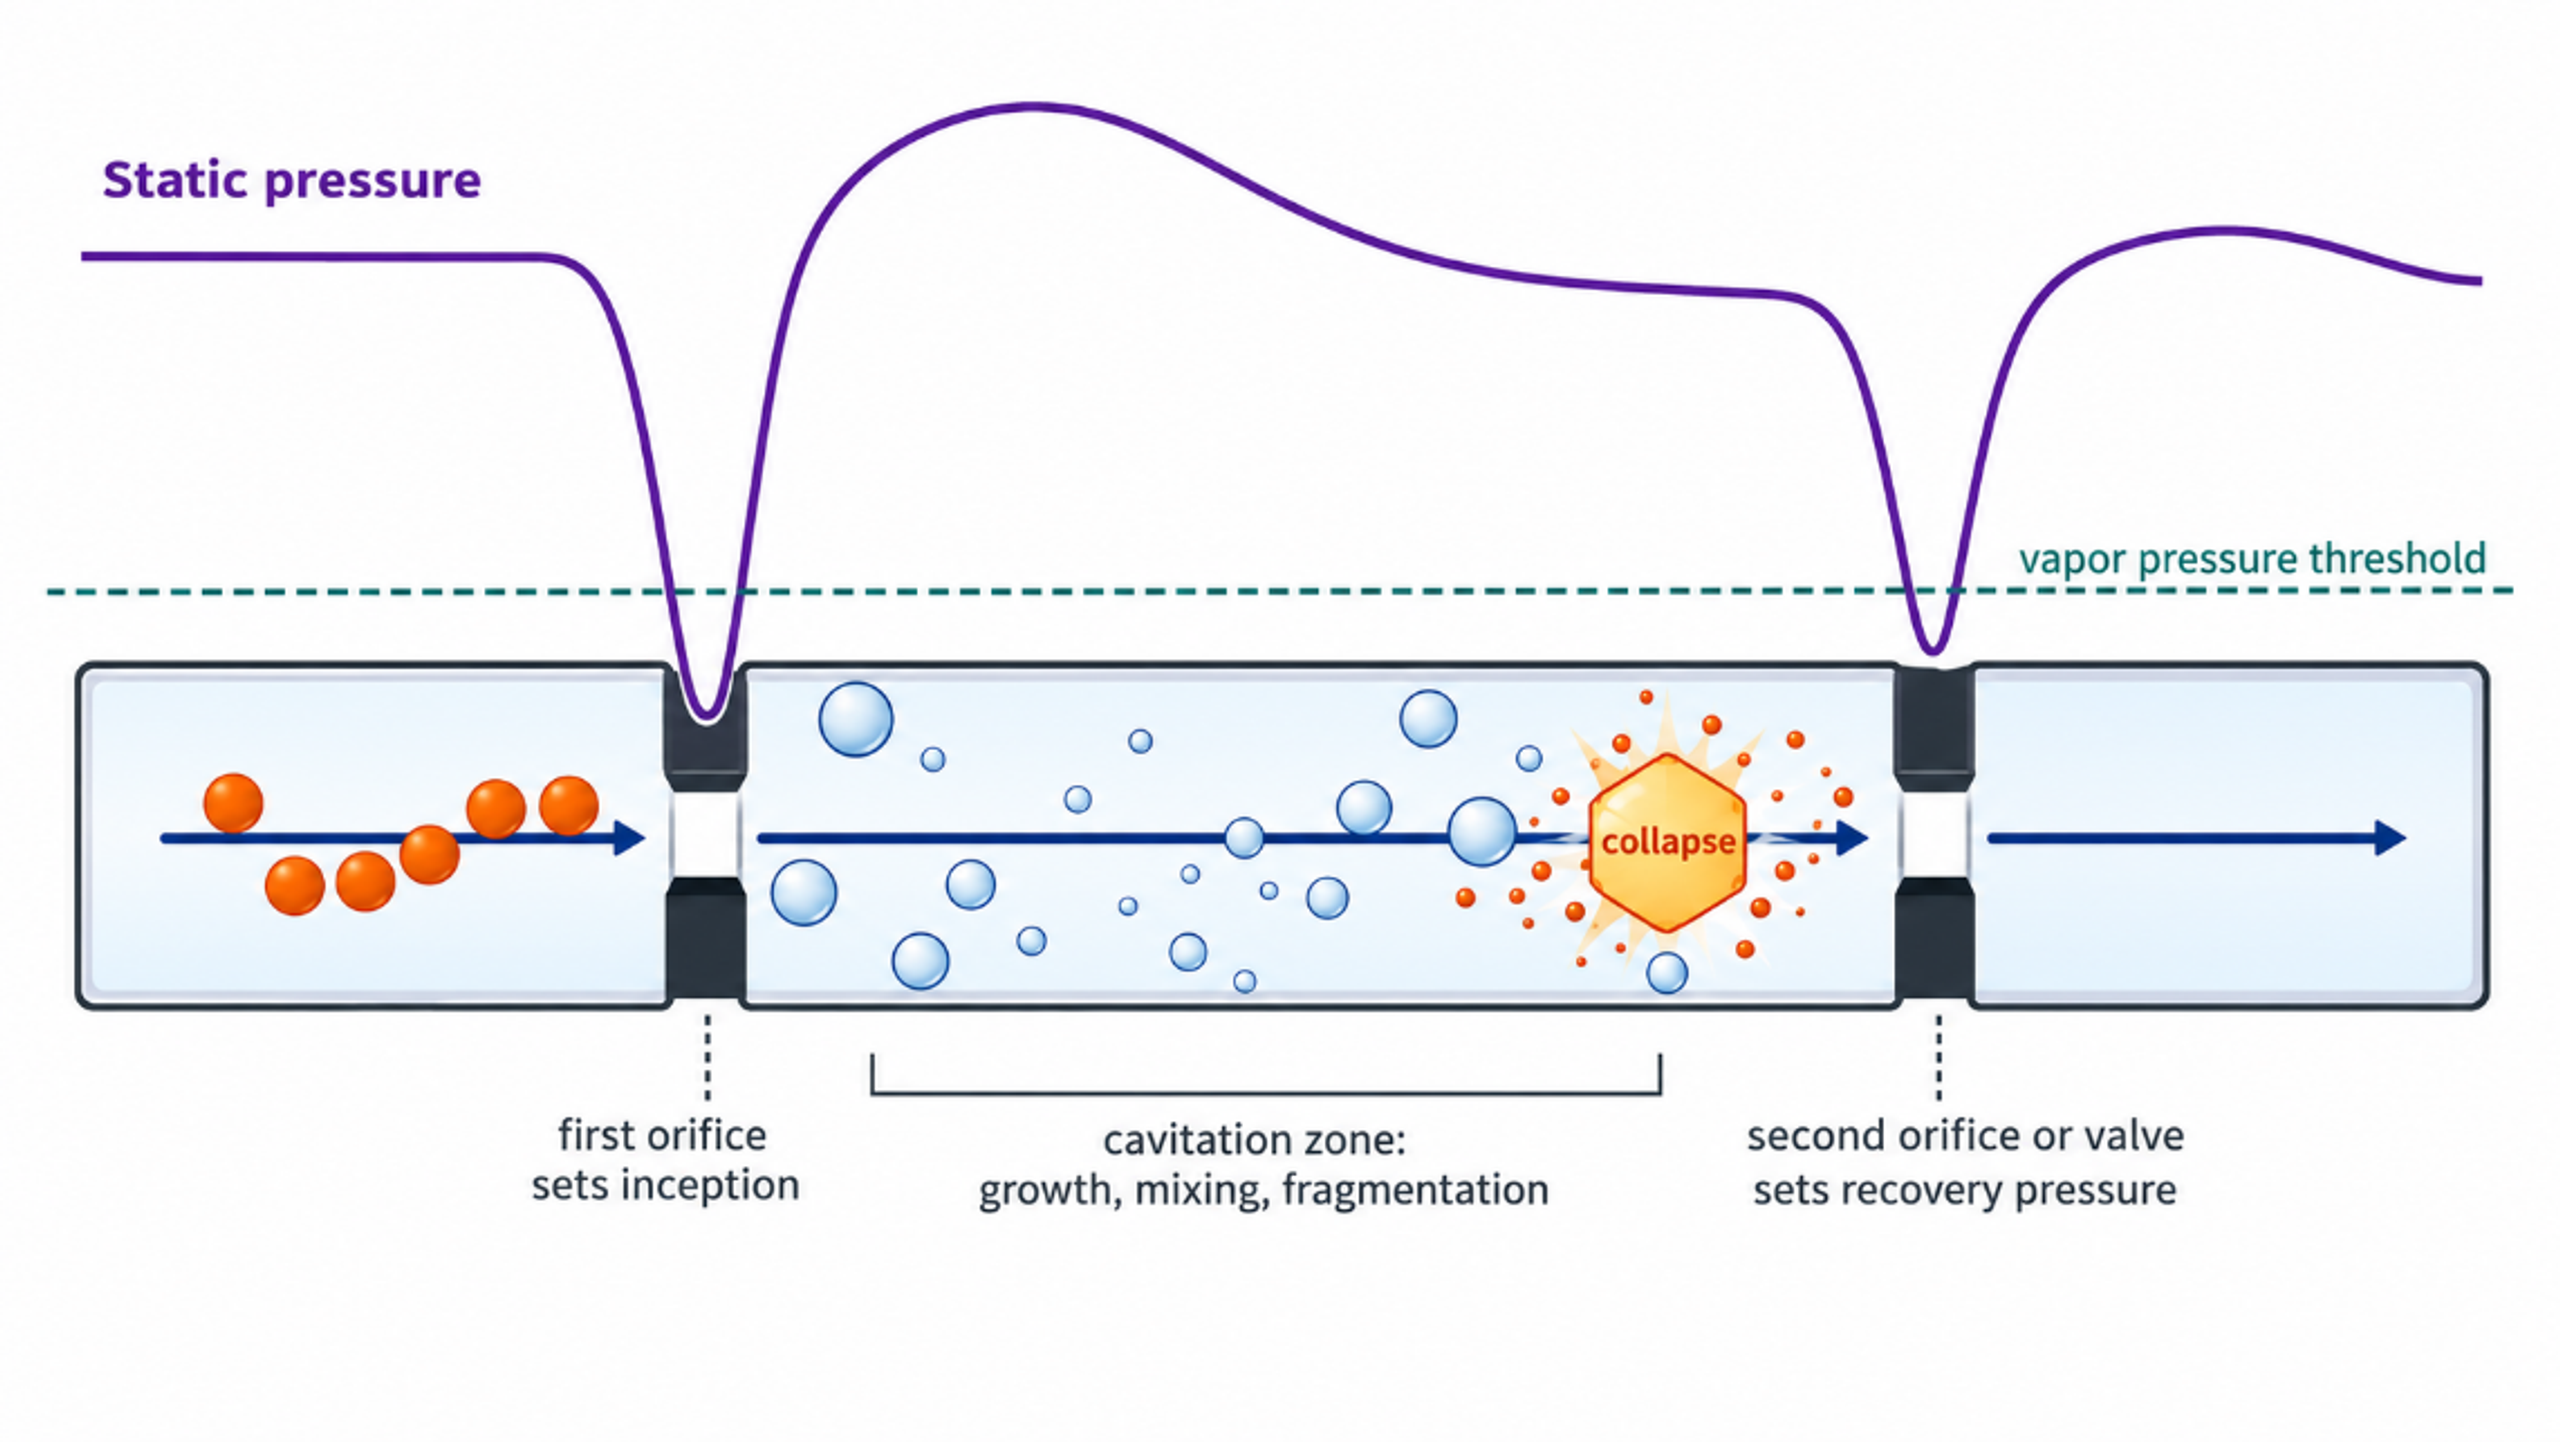
Figure 2.2. Conceptual pressure history and material events in a dual restriction cavitation processor. The pressure trace is schematic and is not a measured record. [29].
2.2 Bubble Growth, Collapse, and Particle Interaction
A spherical bubble in a Newtonian liquid can be described by the Rayleigh-Plesset equation:
Although a real CFC cloud contains interacting, nonspherical bubbles in a turbulent pressure field, the Rayleigh-Plesset relation identifies the principal roles of far field pressure, internal bubble pressure, surface tension, viscosity, and bubble radius [15-17,21].
For an ideal empty cavity that begins collapse at radius under a constant pressure difference, the Rayleigh collapse time is approximated by Equation 2.6:
An order of magnitude estimate of mechanical work available from collapse is the pressure difference multiplied by the maximum cavity volume:
Only a fraction of this idealized work is transferred to a particle. Energy is partitioned among liquid compression, pressure waves, microjets, viscous dissipation, rebound, and thermal effects. Near a solid surface, asymmetric collapse can direct a microjet toward the particle or wall. In a slurry, particle-bubble contact depends on solids concentration, bubble population, particle size, surface wetting, and cloud residence time. Equation 2.7 should therefore be used for scaling and sensitivity analysis rather than to assign a unique particle temperature.
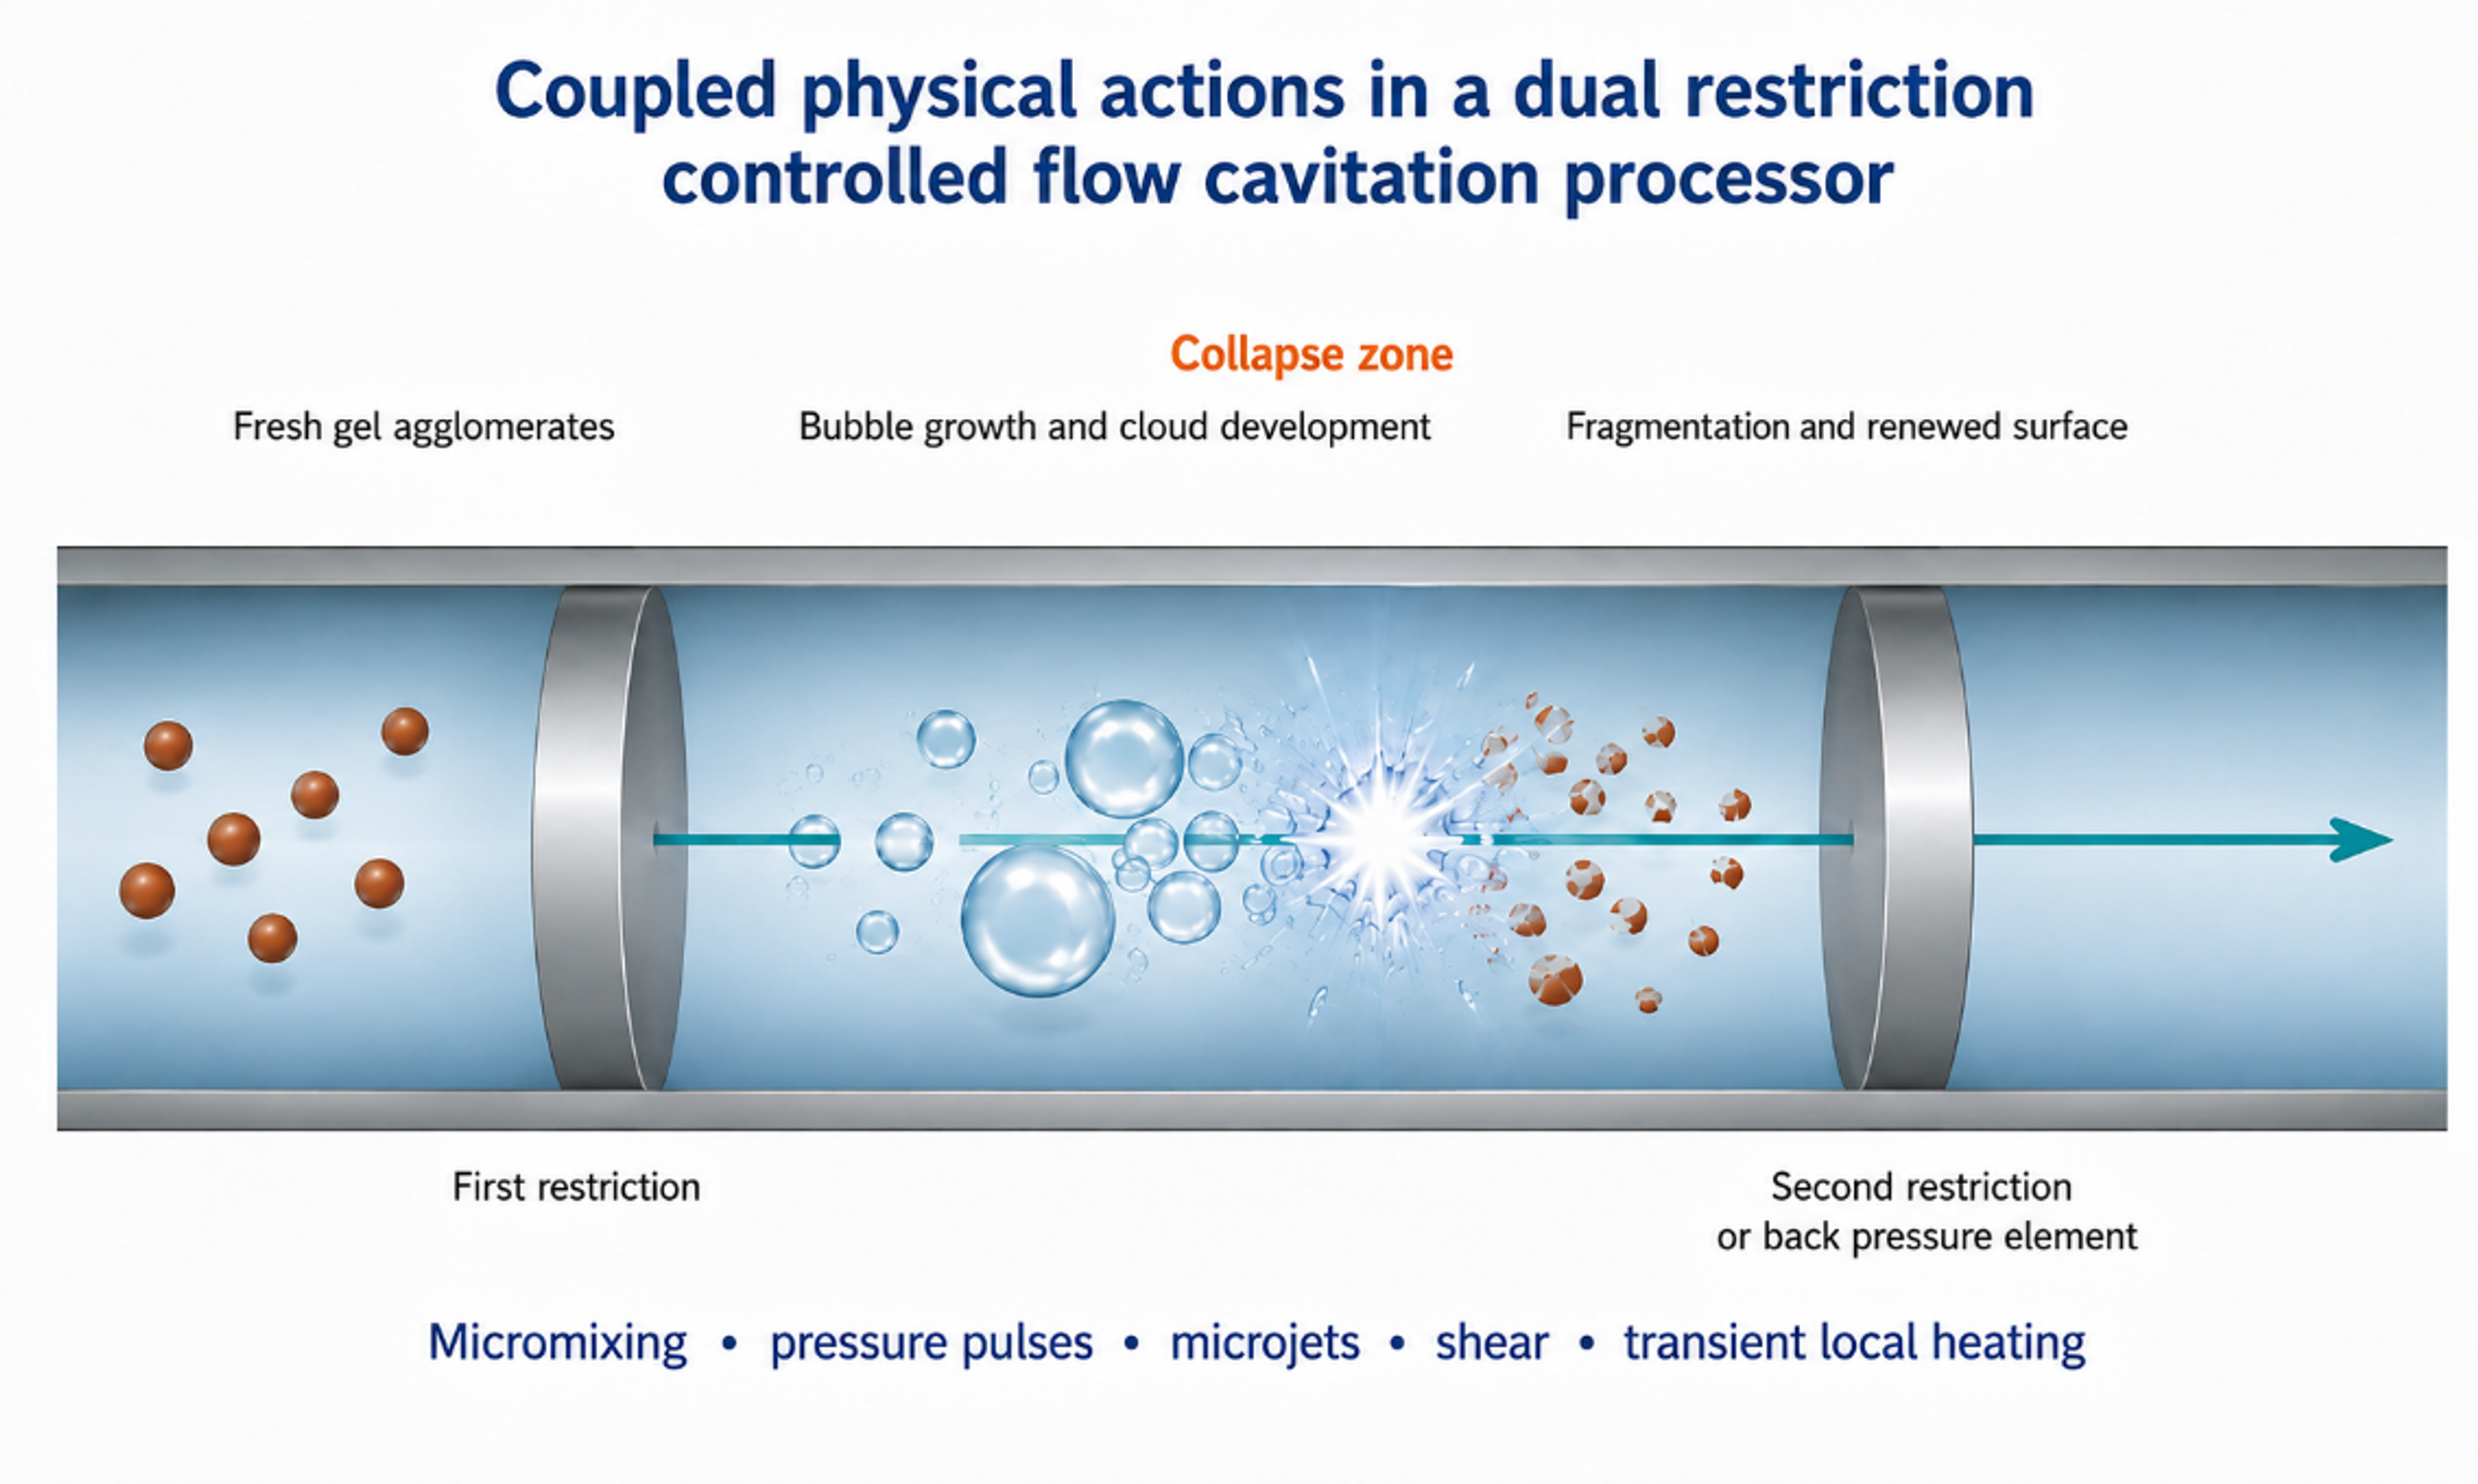
Figure 2.3. Coupled bubble and particle mechanisms in cavitation device. Rapid mixing, gel fragmentation, asymmetric collapse, surface renewal, and short local thermal events can act simultaneously. [29].
2.3 Hydraulic Power, Cumulative Exposure, and Residence Time
Hydraulic power transferred across the processor is estimated from pressure drop and volumetric flow. Pump efficiency must be included when electrical energy is compared:
For a recycle run, the specific hydraulic energy referred to isolated dry solids is given by Equation 2.9. The isolated mass rather than the theoretical precursor mass should be used so that yield loss is included:
The nominal number of loop passes, and the mean loop residence time are useful descriptors, provided that bypass volume and dead volume are included:
Single pass operation provides the clearest exposure definition and is preferred for kinetic studies. Recycle can increase cumulative treatment and narrow a weak agglomerate distribution, but it creates a distribution of exposure counts in which some particles pass through the restriction more often than others. Excessive recycle can promote dissolution and reprecipitation, pump heating, wear contamination, or irreversible agglomeration during warm storage. The optimum is therefore defined by a product quality window rather than by the maximum number of passes.
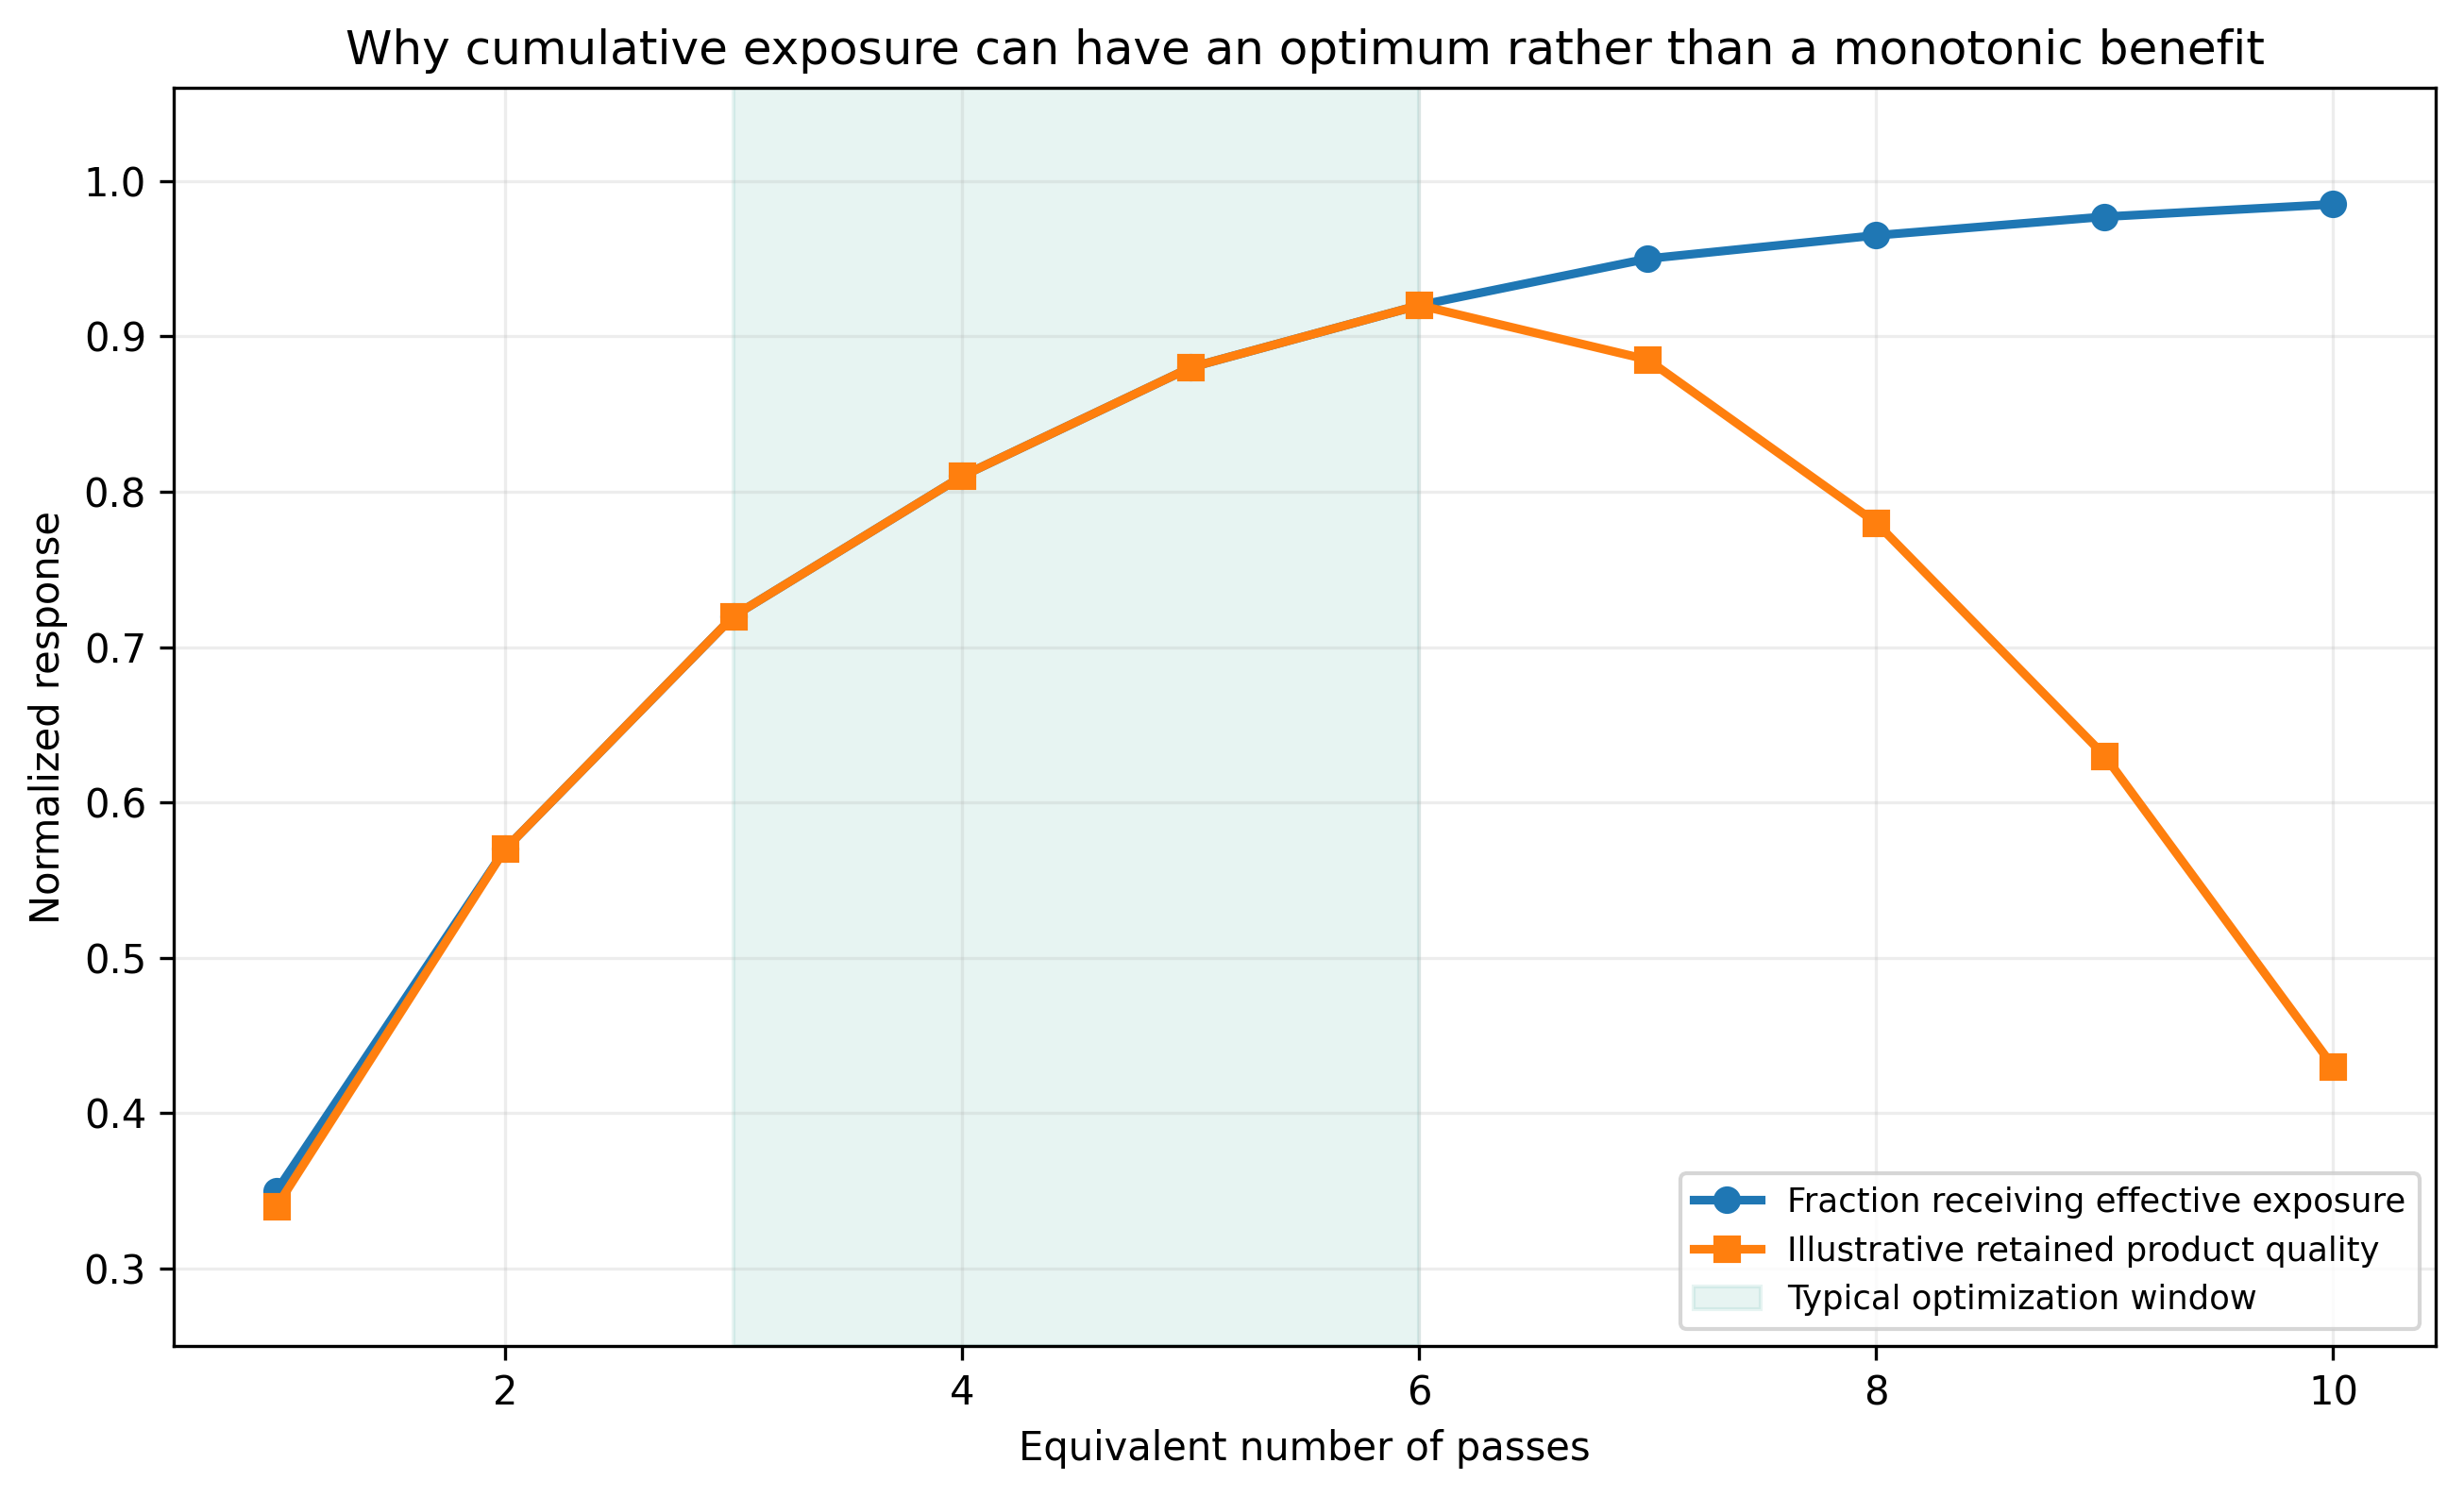
Figure 2.4. Conceptual relation between cumulative passes and product quality. Initial treatment improves mixing and deagglomeration, followed by a plateau and a possible overprocessing region. [29].
2.4 Micromixing, Supersaturation, Nucleation, and Growth
The smallest turbulent length scale is often estimated with the Kolmogorov relation. It is an ideal isotropic turbulence concept, but it provides a useful connection between local energy dissipation and the size of concentration fluctuations:
The associated mixing time scale is approximated by Equation 2.13:
Here, is kinematic viscosity and is the mass specific turbulent energy dissipation rate. The Microfluidics reaction study supplied with the source materials reported estimated mixing scales in the tens of nanometers and mixing times in the microsecond range for high pressure impinging jets [12]. Cavitation device geometries differ, but the study illustrates the degree to which intense, fixed geometry processing can reduce the lifetime of concentration gradients.
Supersaturation is the chemical driving force for precipitation. It may be represented as a concentration ratio or as relative excess concentration. The chosen definition must be stated:
Classical nucleation theory gives the critical radius of a spherical nucleus as Equation 2.15, where is the solid-liquid interfacial energy, is molar volume, is the gas constant, and is absolute temperature:
The nucleation rate is commonly represented in an Arrhenius form with a barrier :
Cavitation can modify both the preexponential factor and the effective nucleation barrier by changing local supersaturation, collision frequency, surface renewal, and heterogeneous nucleation sites. It can also accelerate growth by reducing diffusion resistance. These effects compete: higher nucleation density tends to reduce the mass available per nucleus, whereas enhanced transport and local warming can accelerate growth. Consequently, a smaller orifice, higher pressure, or lower cavitation number does not necessarily produce a smaller final crystallite.
Table 2.1. Engineering variables and the material forming responses they can influence
| Engineering variable | Primary physical effect | Material response to measure | Common interpretation error |
|---|---|---|---|
| Upstream pressure | Changes jet velocity, pump heating, and pressure differential | Phase, agglomerate size, crystallite size, strain, yield | Assuming pressure alone equals cavitation intensity |
| Restriction geometry | Changes inception, jet contraction, cloud shape, and blockage sensitivity | Residence history, particle size distribution, erosion metals | Comparing only nominal diameter |
| Back pressure | Moves pressure recovery and collapse zone | Structure, temperature rise, erosion, repeatability | Assuming visible cavitation is the strongest collapse |
| Flow rate | Changes Reynolds number, renewal frequency, and pass time | Productivity, conversion, pass distribution | Ignoring loop inventory and bypass volume |
| Temperature | Changes viscosity, vapor pressure, kinetics, and ripening | Yield, phase, grain size, bulk temperature history | Treating temperature only as a fluid property |
| Solids loading | Changes attenuation, rheology, collision frequency, and pressure loss | Recovery, blockage, abrasion, agglomeration | Scaling dilute results directly to concentrated slurry |
| Feed timing | Sets the age of precipitate at first exposure | Composition uniformity, induction time, phase purity | Treating hydrodynamics separately from precipitation chemistry |
2.5 Surface Area, Diffraction Size, Microstrain, and Active Area
For ideal, non-porous spherical particles of equivalent diameter and solid density , the mass-specific surface area () is inversely proportional to the particle diameter:
This relation explains why small crystallites can expose a large fraction of surface atoms, but it does not predict BET area when pores, necks, platelets, support interfaces, or inaccessible internal surfaces are present. X-ray line broadening provides an independent estimate of crystallite size. The Scherrer equation is given in Equation 2.18:
If both finite size and strain contribute to broadening, the Williamson Hall form is useful:
Here, is the shape factor, is X-ray wavelength, is corrected integral breadth, is the Bragg angle, and is microstrain. Instrument broadening must be measured with a standard. Whole pattern refinement and microscopy are preferable to a single peak estimate. X-ray crystallite size, electron microscopy particle size, dynamic light scattering diameter, and laser diffraction agglomerate size describe different structural levels and should not be used interchangeably.
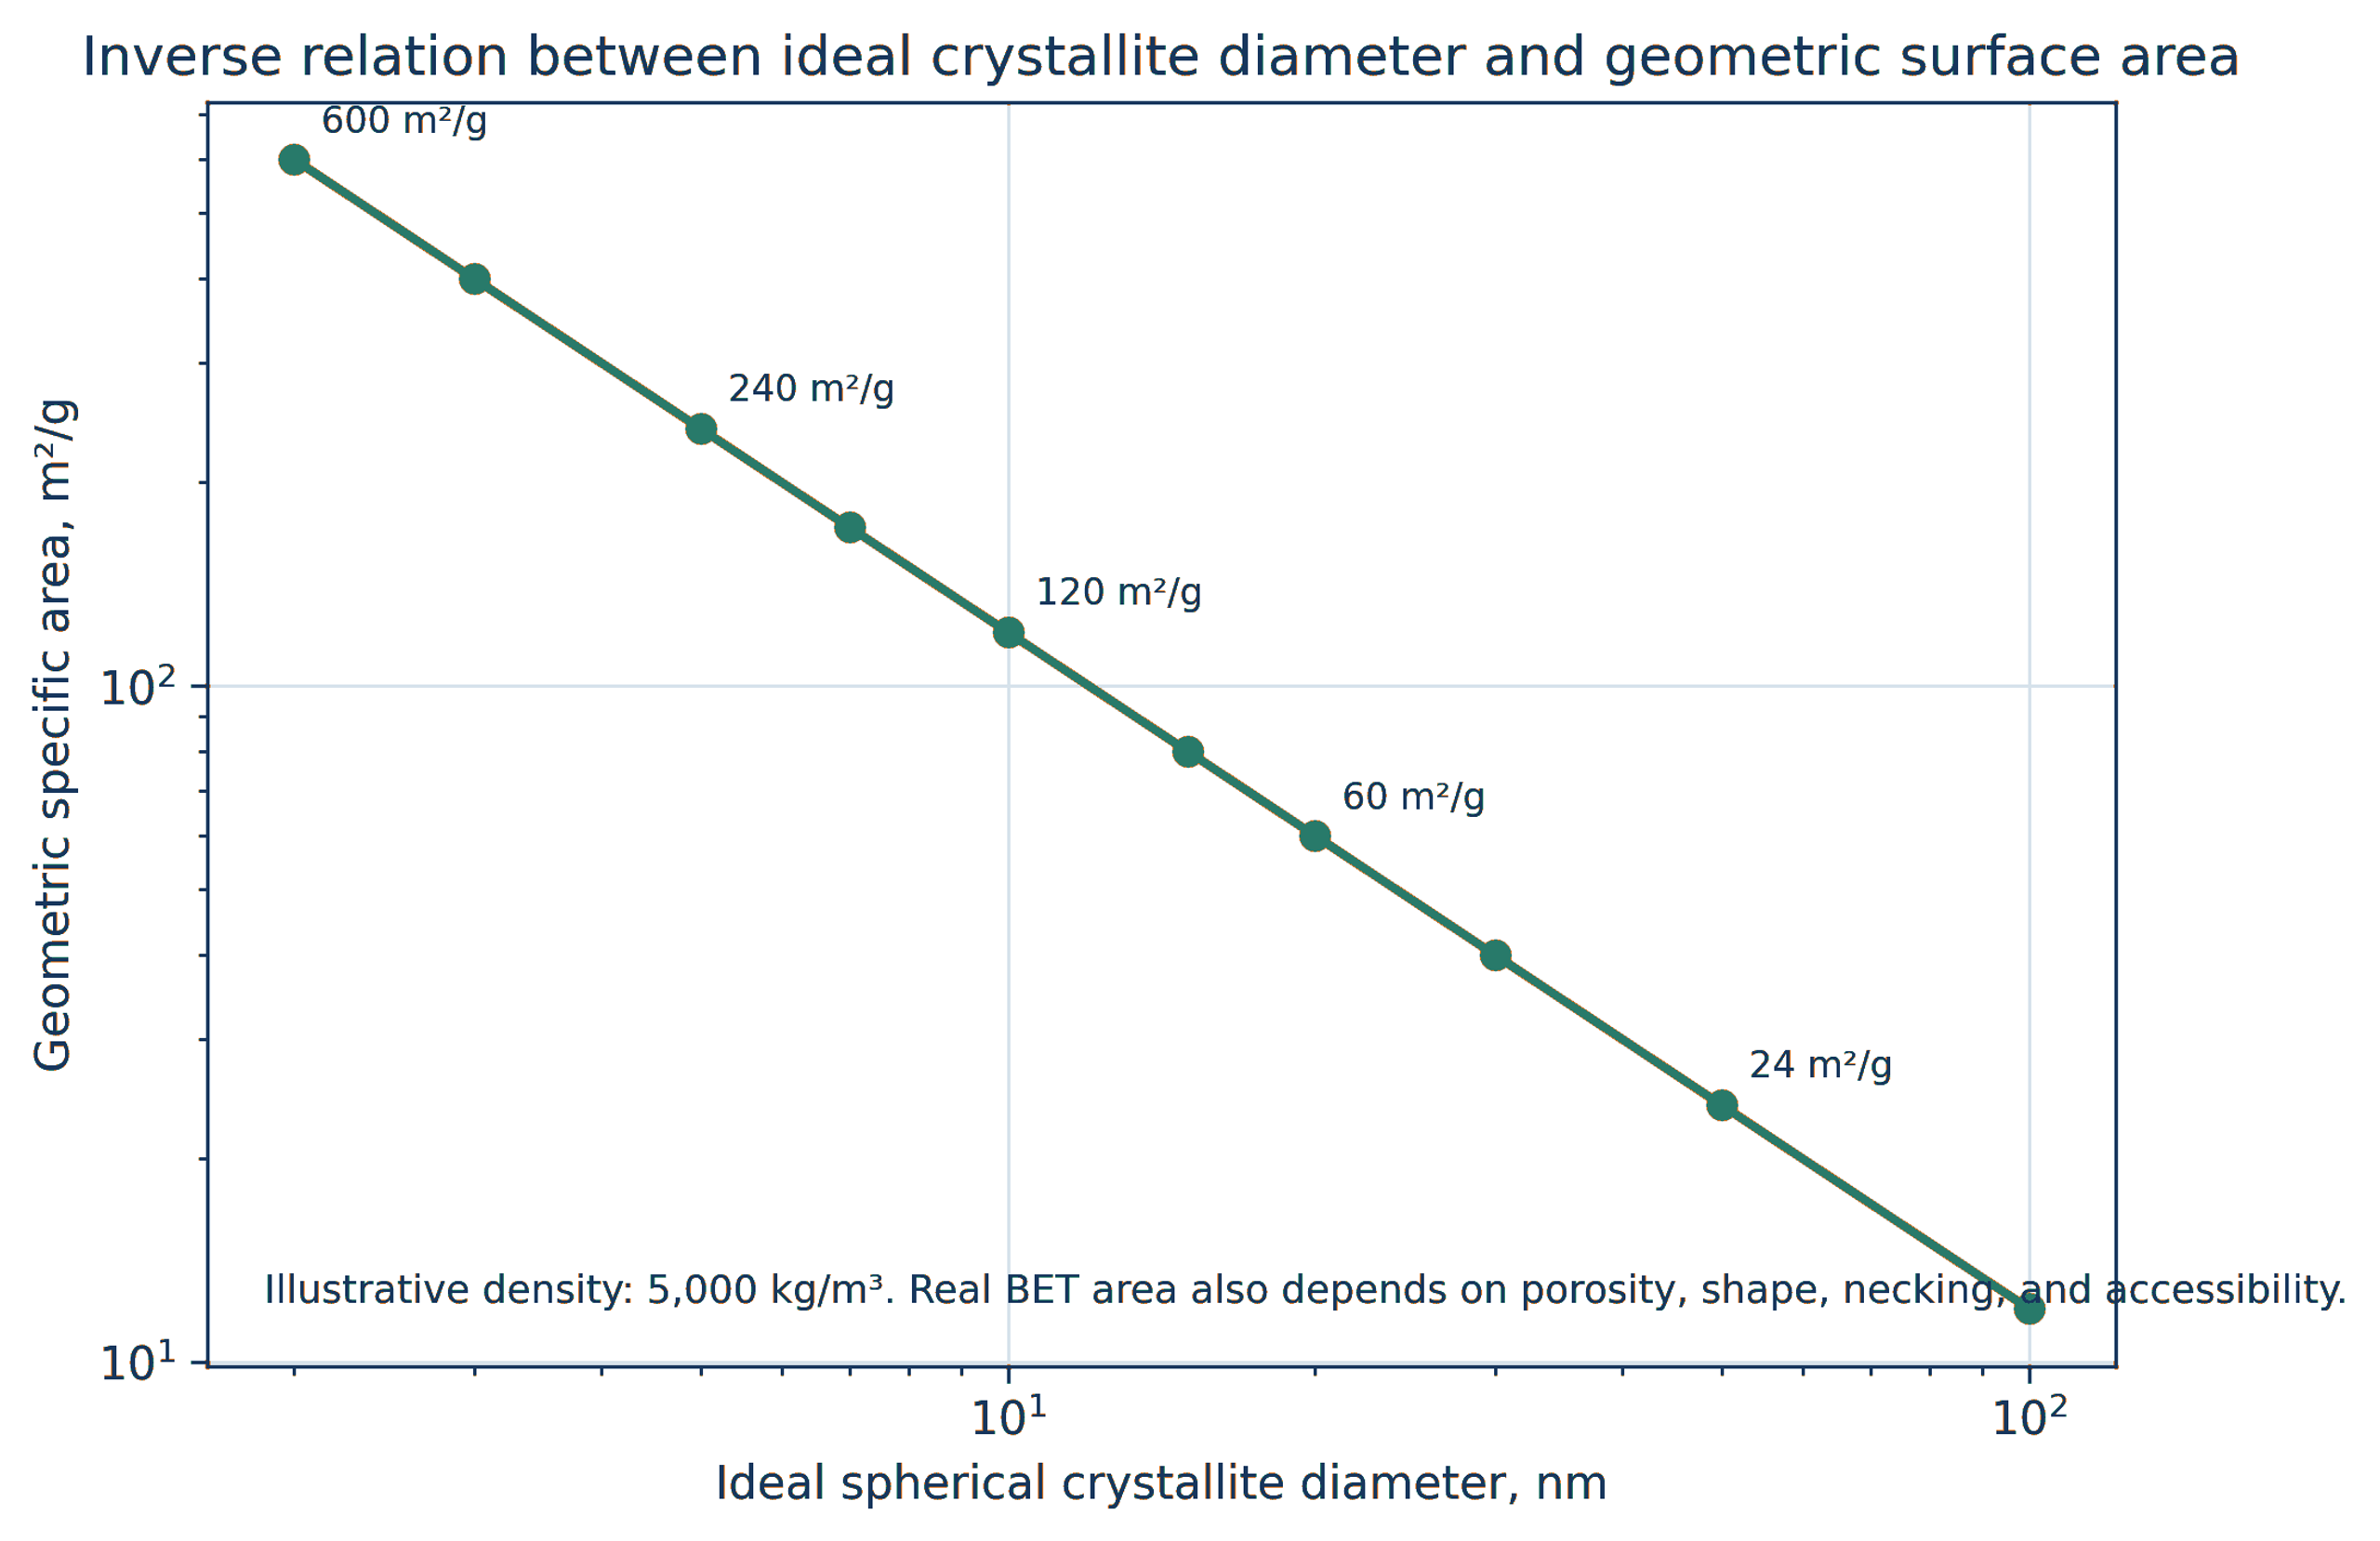
Figure 2.5. Ideal geometric area per unit mass as a function of crystallite diameter for representative oxide densities. The graph illustrates Equation 2.17. [29].
Table 2.2. Characterization methods and interpretation limits for CFC catalyst products
| Method | Primary output | Required control | Important limitation |
|---|---|---|---|
| X ray diffraction | Phase, crystallite size, lattice parameter, microstrain | Instrument standard and multiple reflections | Insensitive to amorphous material and very small or dilute phases |
| Electron microscopy | Primary particles, agglomerates, interfaces, morphology | Representative fields and calibrated scale | Drying and sampling can bias morphology |
| BET gas adsorption | Accessible surface area and pore volume | Degassing protocol and adsorption model | Does not identify active chemical sites |
| Chemisorption | Metal dispersion and exposed active area | Defined reduction and adsorption stoichiometry | Strong support interaction can complicate uptake |
| X ray photoelectron spectroscopy | Surface composition and oxidation state | Charge correction and reference materials | Shallow sampling depth and air transfer effects |
| X ray absorption spectroscopy | Local coordination and oxidation state | Appropriate standards and in situ cell | Average signal can mask multiple populations |
| Particle size analysis | Hydrodynamic or optical agglomerate distribution | Refractive index, viscosity, dispersion protocol | Result depends strongly on dispersion state |
| ICP OES or ICP MS | Bulk composition and wear contamination | Digestion recovery and blanks | No information about spatial distribution |
3 Reactor Architecture and Operating Envelope
The original research employed two principal equipment families. CaviPro research systems operated at high pressure and commonly used two restrictions in series. The first restriction created a low pressure jet and cavitation cloud. The second restriction, or an adjustable downstream valve, controlled pressure recovery and the probable collapse location. CaviMax systems used a larger single restriction at lower pressure and higher volumetric flow. Production scale machines increased active flow capacity rather than simply increasing batch volume [1-7].
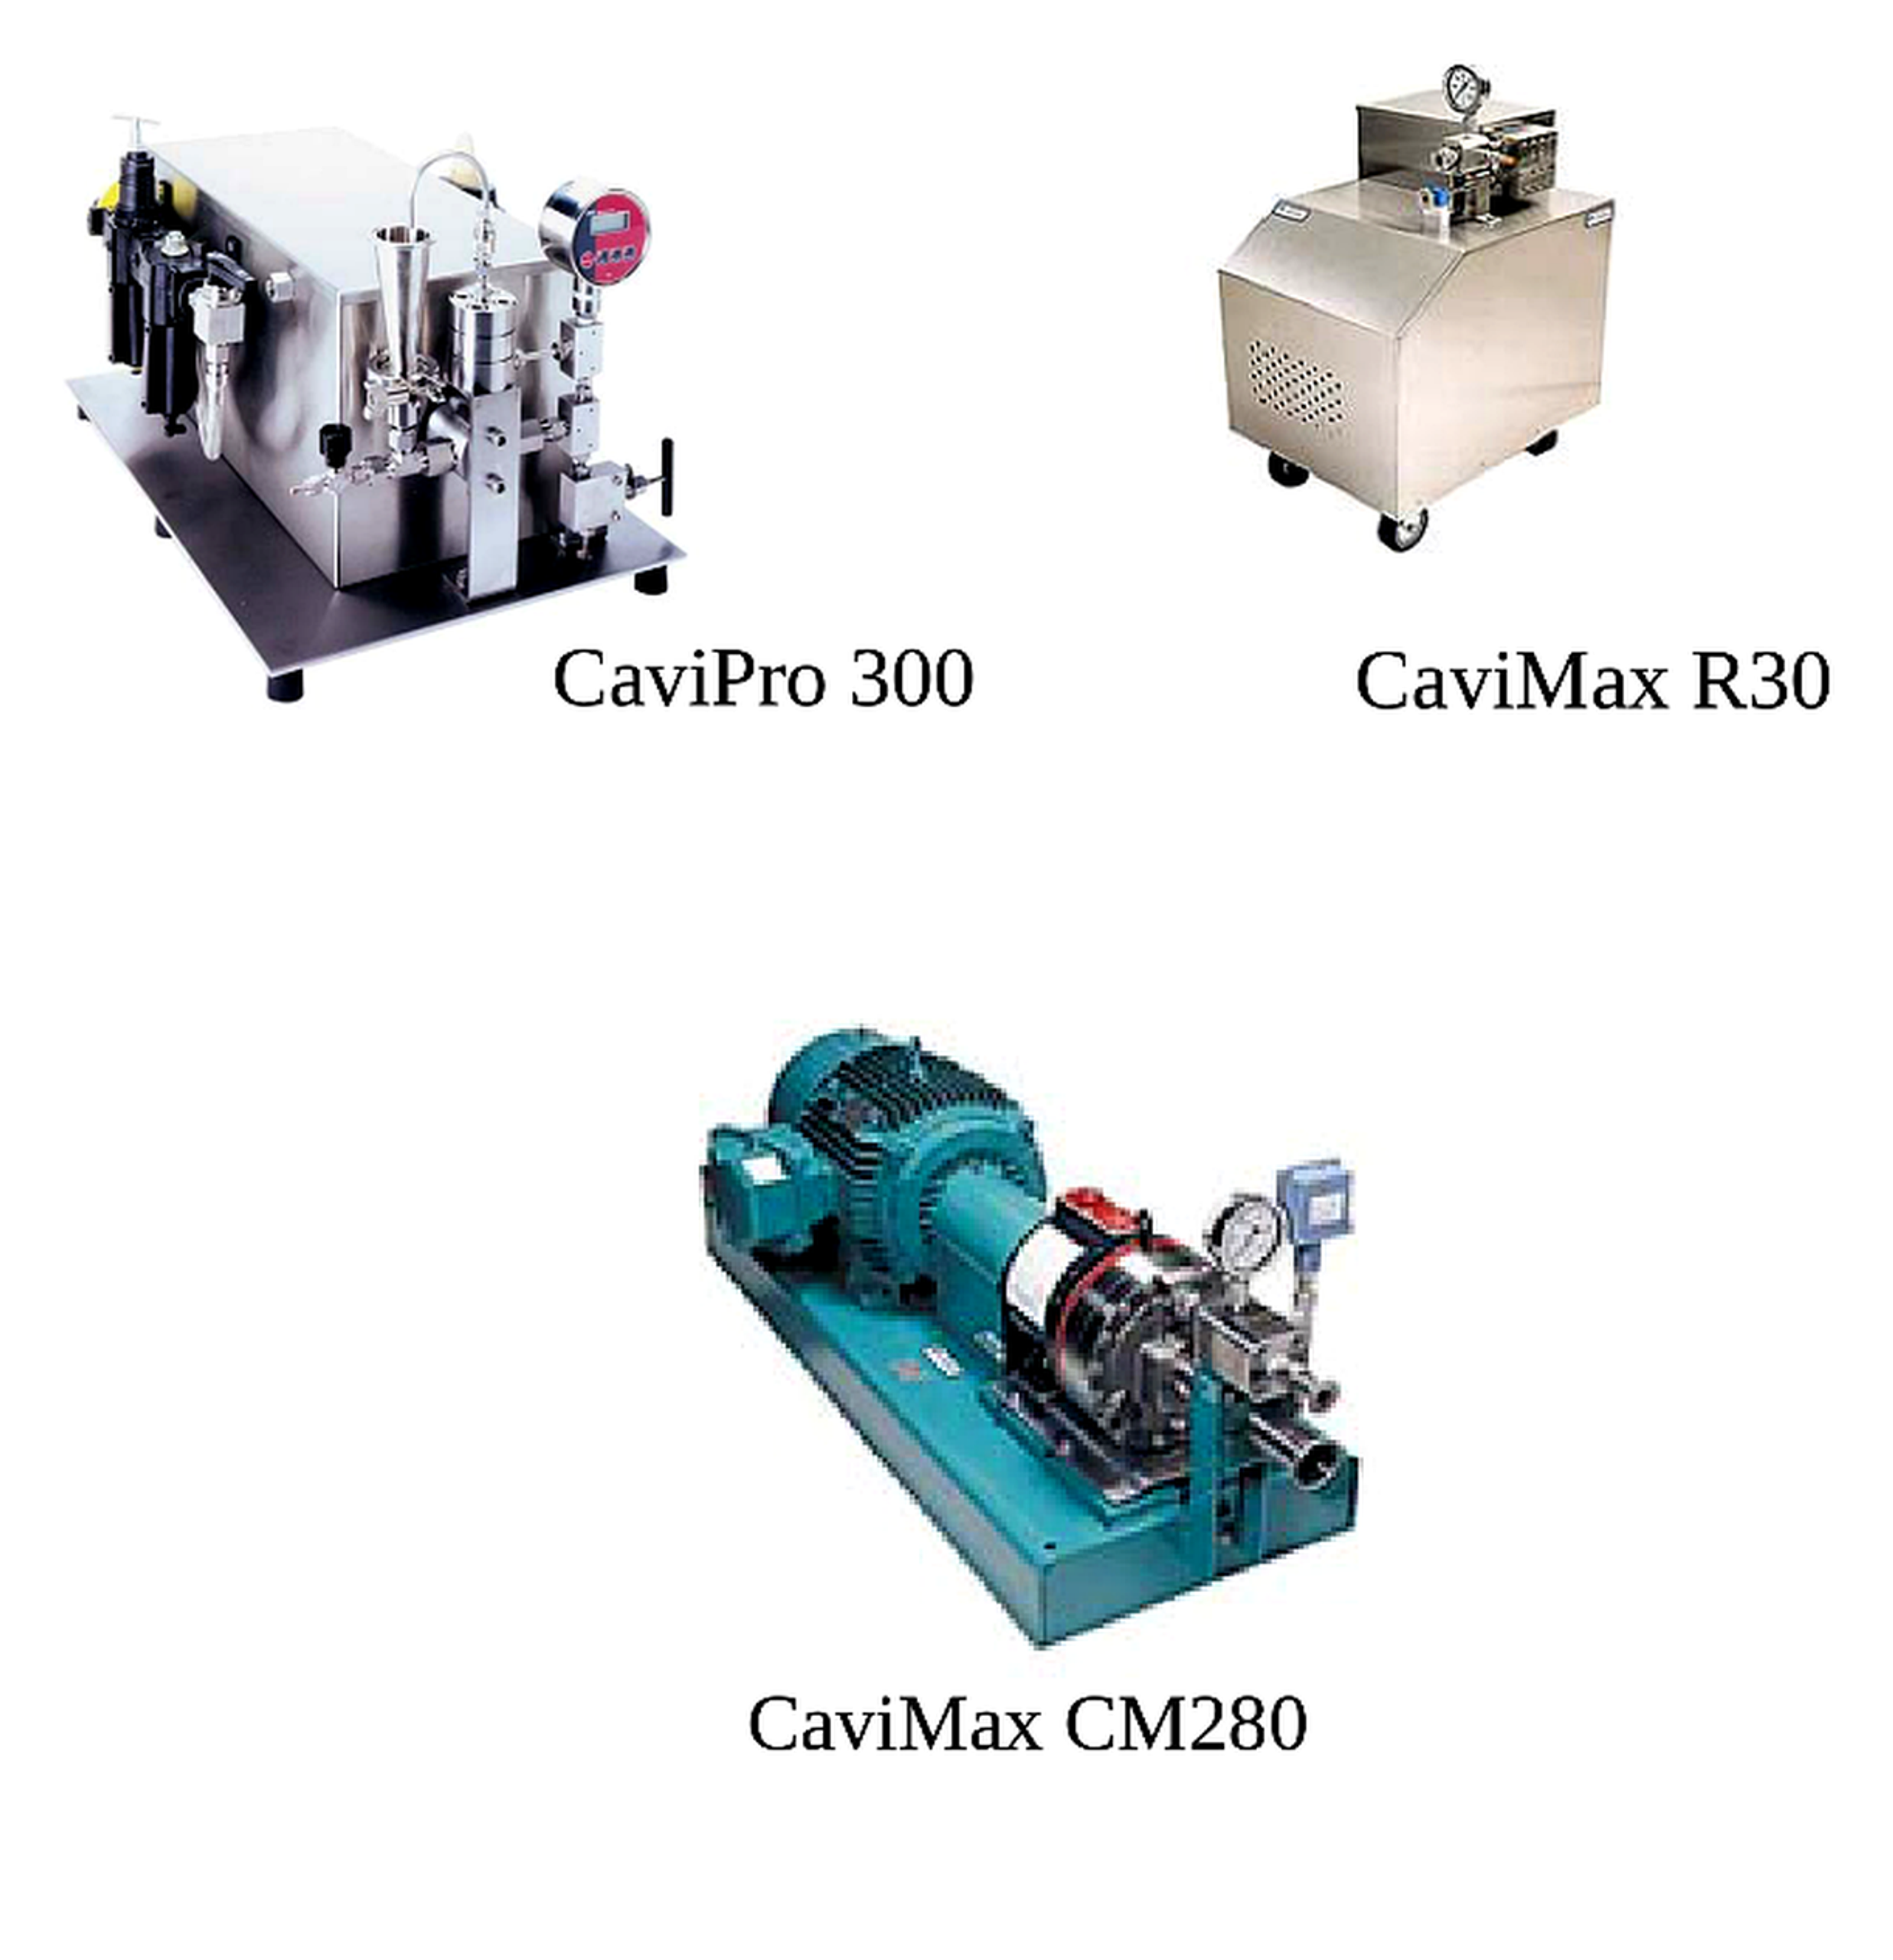
Figure 3.1. Laboratory and production scale cavitation equipment: CaviPro 300, CaviMax R30, and CaviMax CM280 [6].
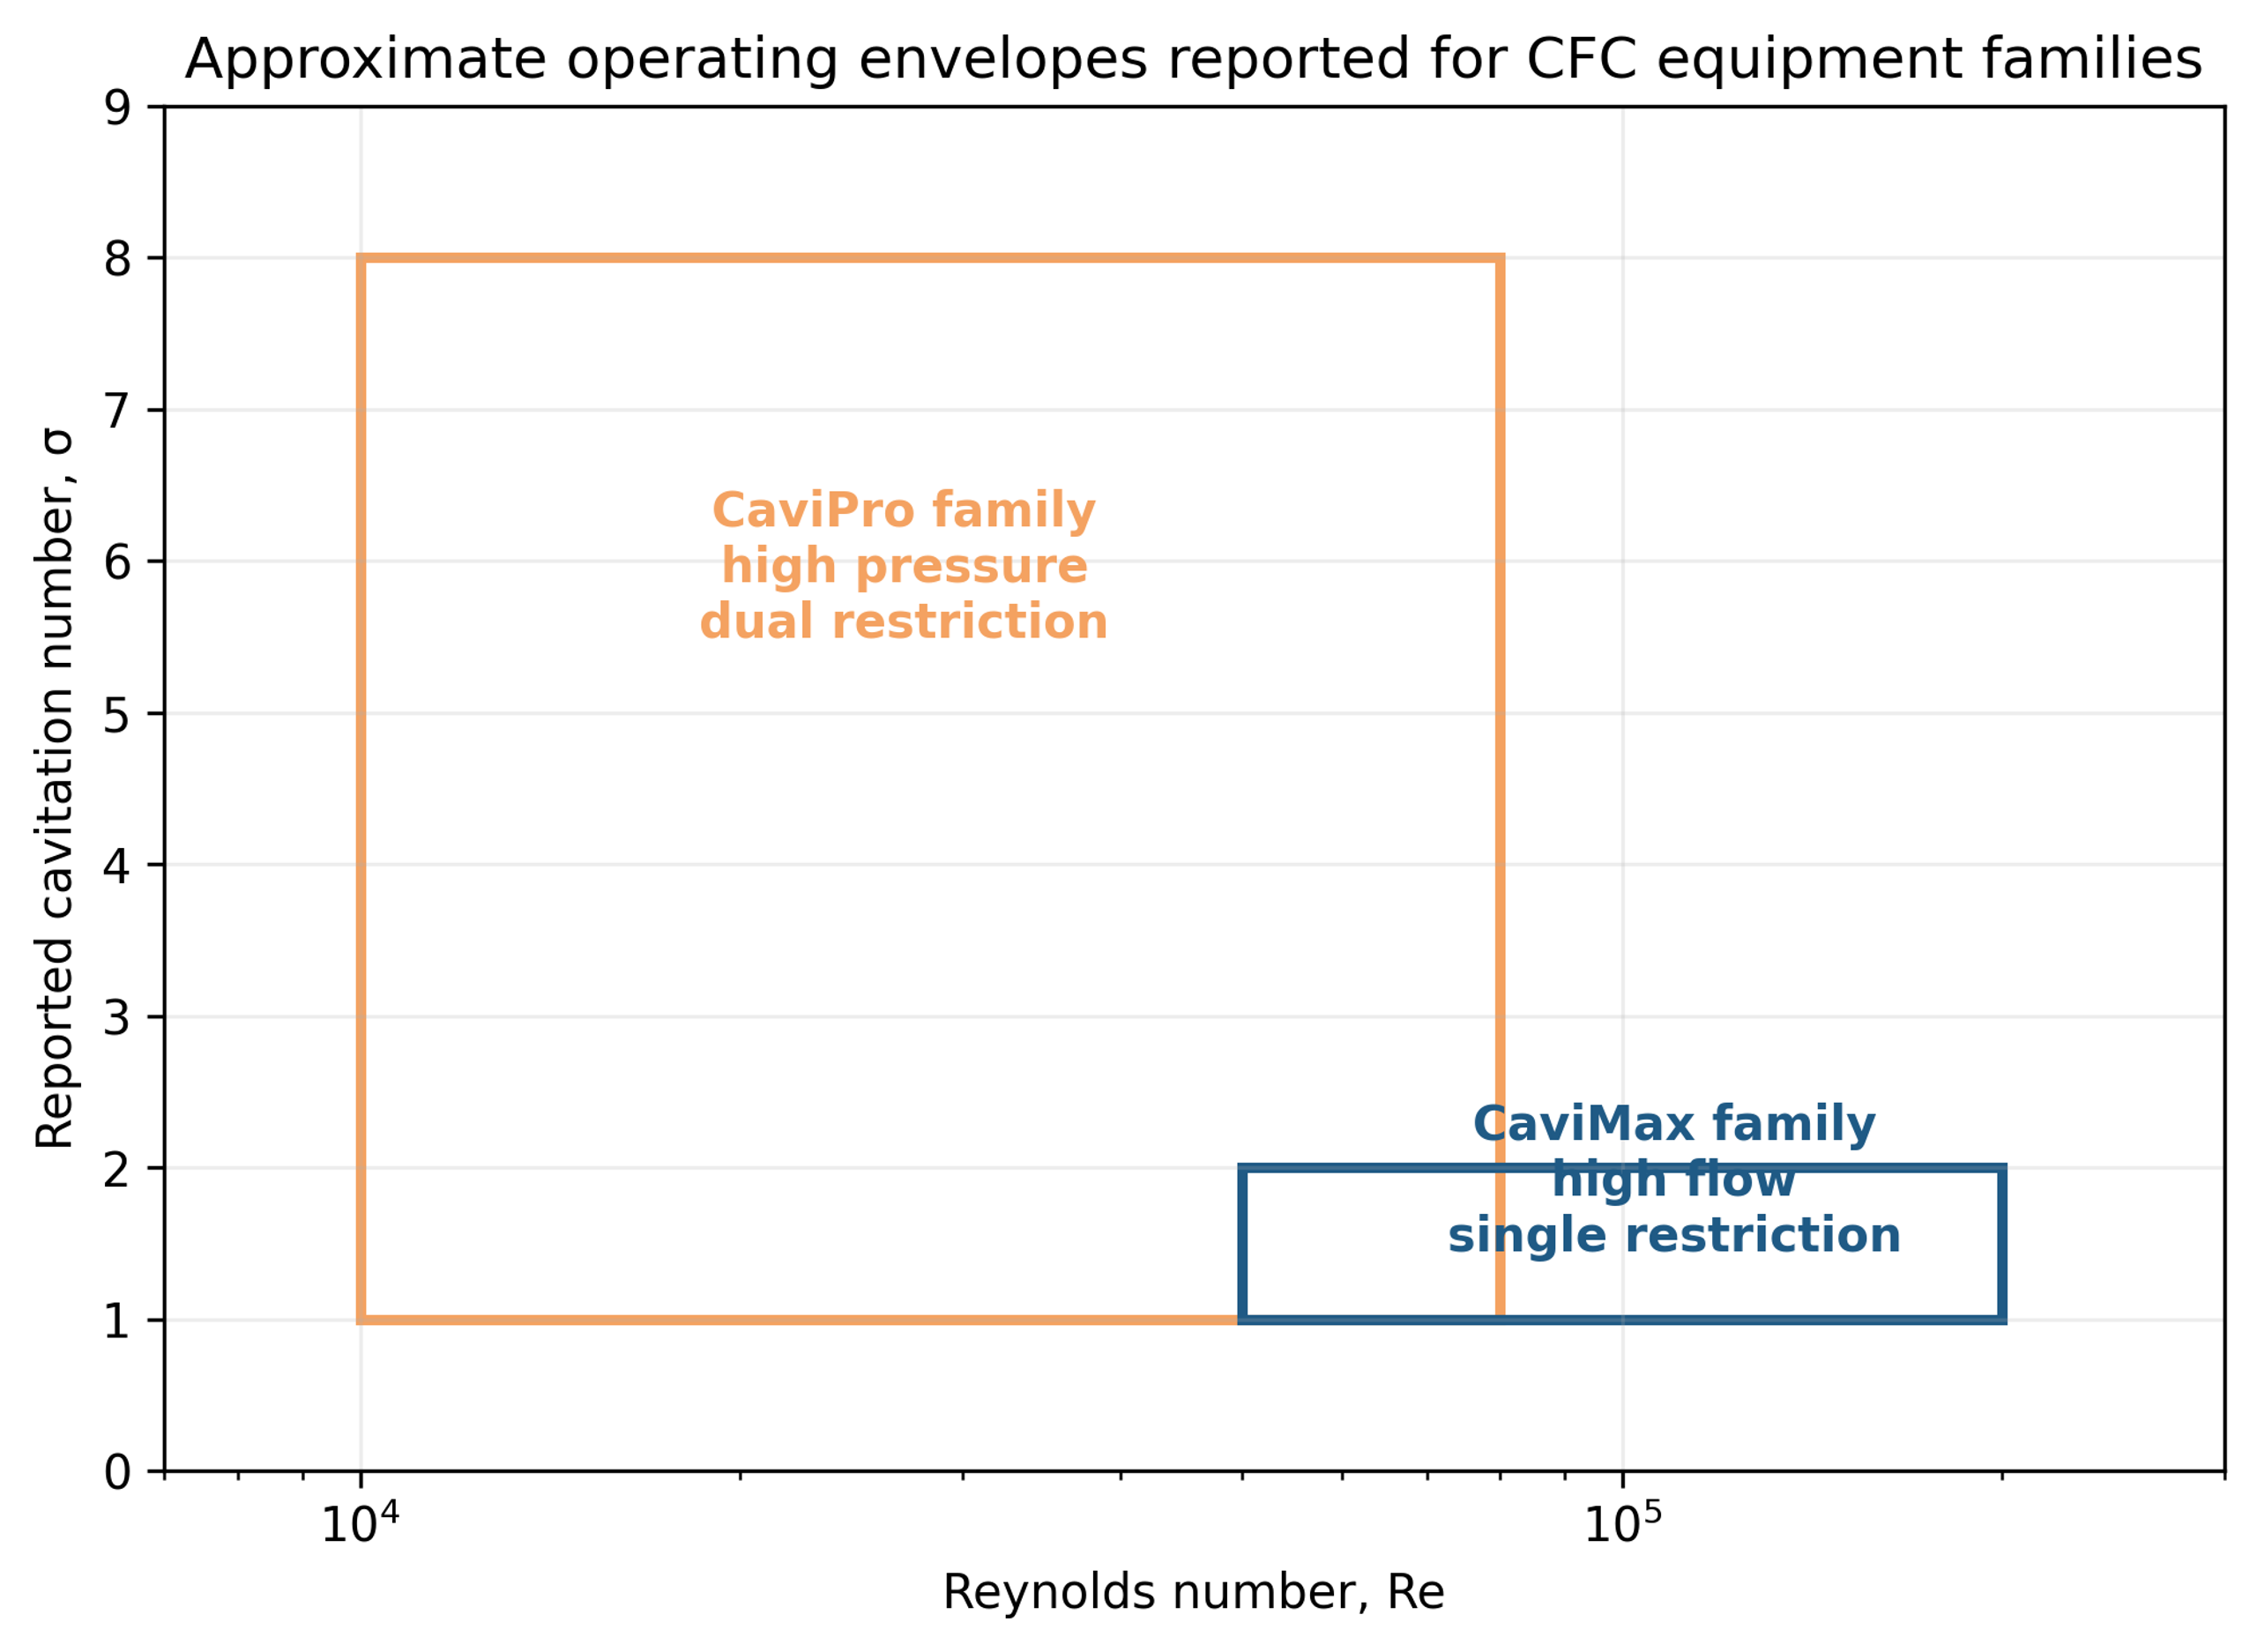
Figure 3.2. Approximate Reynolds number and cavitation number envelopes reported for the CaviPro and CaviMax families. The rectangles summarize ranges, not product equivalence. [6,7,23-27].
Table 3.1. Representative operating characteristics reported for CFC systems
| Characteristic | CaviPro family | CaviMax family | Design implication |
|---|---|---|---|
| Configuration | Dual restriction with adjustable pressure and recovery | Single restriction with nominally high flow | The same cavitation number can represent different bubble and residence histories |
| Pressure range in source materials | Approximately 6–206 MPa, model dependent | Approximately 0.7–6.9 MPa | Pressure rating alone does not define treatment |
| Reported Reynolds number | About 10,000–80,000 | About 50,000–200,000 | High flow increases renewal frequency and active volume |
| Reported cavitation number | About 1–8 | About 1–2 | Pressure reference location must be documented |
| Primary controls | First and second restriction, upstream pressure, back pressure, flow, passes | Restriction, upstream pressure, back pressure, flow, recycle time | Variables are coupled and require designed experiments |
| Scale emphasis | High intensity research and small flow | Lower pressure, larger flow, production development | Scale by product equivalence rather than by nominal pressure |
The practical operating window is governed by more than the pump pressure rating. A very small passage can increase velocity but can also cause feed pulsation, low throughput, plugging, and severe erosion. Higher solids loading may increase particle-bubble contact while attenuating pressure fluctuations and altering rheology. Increased back pressure can stabilize a compact collapse zone, whereas excessive recovery pressure can suppress cavity growth. A robust design therefore requires pressure transducers before and after each restriction, a calibrated flow meter, bulk temperature measurement, and a defined back pressure control point.
Table 3.2. Control variables, favorable responses, and adverse responses
| Variable | Possible favorable response | Possible adverse response | Recommended monitoring |
|---|---|---|---|
| Upstream pressure | Faster micromixing and stronger fragmentation | Pump heating, erosion, excessive nucleation | Pressure, flow, temperature, wear metals |
| First restriction | Controlled inception and gel breakup | Plugging and unstable feed pressure | Differential pressure and inspection |
| Second restriction or back pressure | Collapse near suspended particles and shorter cloud | Cavitation suppression and severe localized erosion | Recovery pressure and acoustic signal |
| Flow rate | High throughput and frequent renewal | Insufficient exposure per pass | Calibrated flow and loop volume |
| Temperature | Lower viscosity and faster reaction | Vapor cushioning, ripening, solvent loss | Continuous inlet and outlet temperature |
| Solids loading | Higher productivity and collision frequency | Nonuniform exposure, abrasion, non-Newtonian flow | Density, viscosity, pressure loss, settling test |
| Passes | Improved mixing and agglomerate control | Overprocessing and energy penalty | Total volume processed and residence distribution |
4 Catalyst Fabrication Workflow
4.1 Precursor Selection and Precipitation Timing
The chemical step is inseparable from the hydrodynamic step. Reported oxide syntheses used metal nitrate, chloride, or related salt solutions with ammonium hydroxide, sodium hydroxide, sodium carbonate, ammonium carbonate, or mixed precipitating agents. Reduction routes for noble and base metals used hydrazine or other reductants. Supports included gamma alumina, alpha alumina, silica, fumed silica, titania, and zirconia [1-7].
For multimetal oxides, compatible hydrolysis and precipitation behavior is essential. If one cation precipitates well before the others, intense mixing cannot reconstruct compositional homogeneity that was never established. Useful strategies include separately metered feeds, a low volume premixer, pH controlled addition, staged precipitation, complexing ligands, solvent selection, and temperature control. The design target is a reproducible interval between the onset of supersaturation and the first cavitation exposure, and this interval should be measured or bounded rather than described only as immediate.
Support deposition requires the same level of control. The support may be present during precipitation, added after formation of a metal colloid, or contacted in a second cavitation stage. These alternatives create different nucleation sites and different probabilities of burying the active phase. The WPI gold studies showed that precursor concentration, reduction chemistry, feed rate, support addition, and drying can dominate final properties even when the hydrodynamic equipment is unchanged [7].
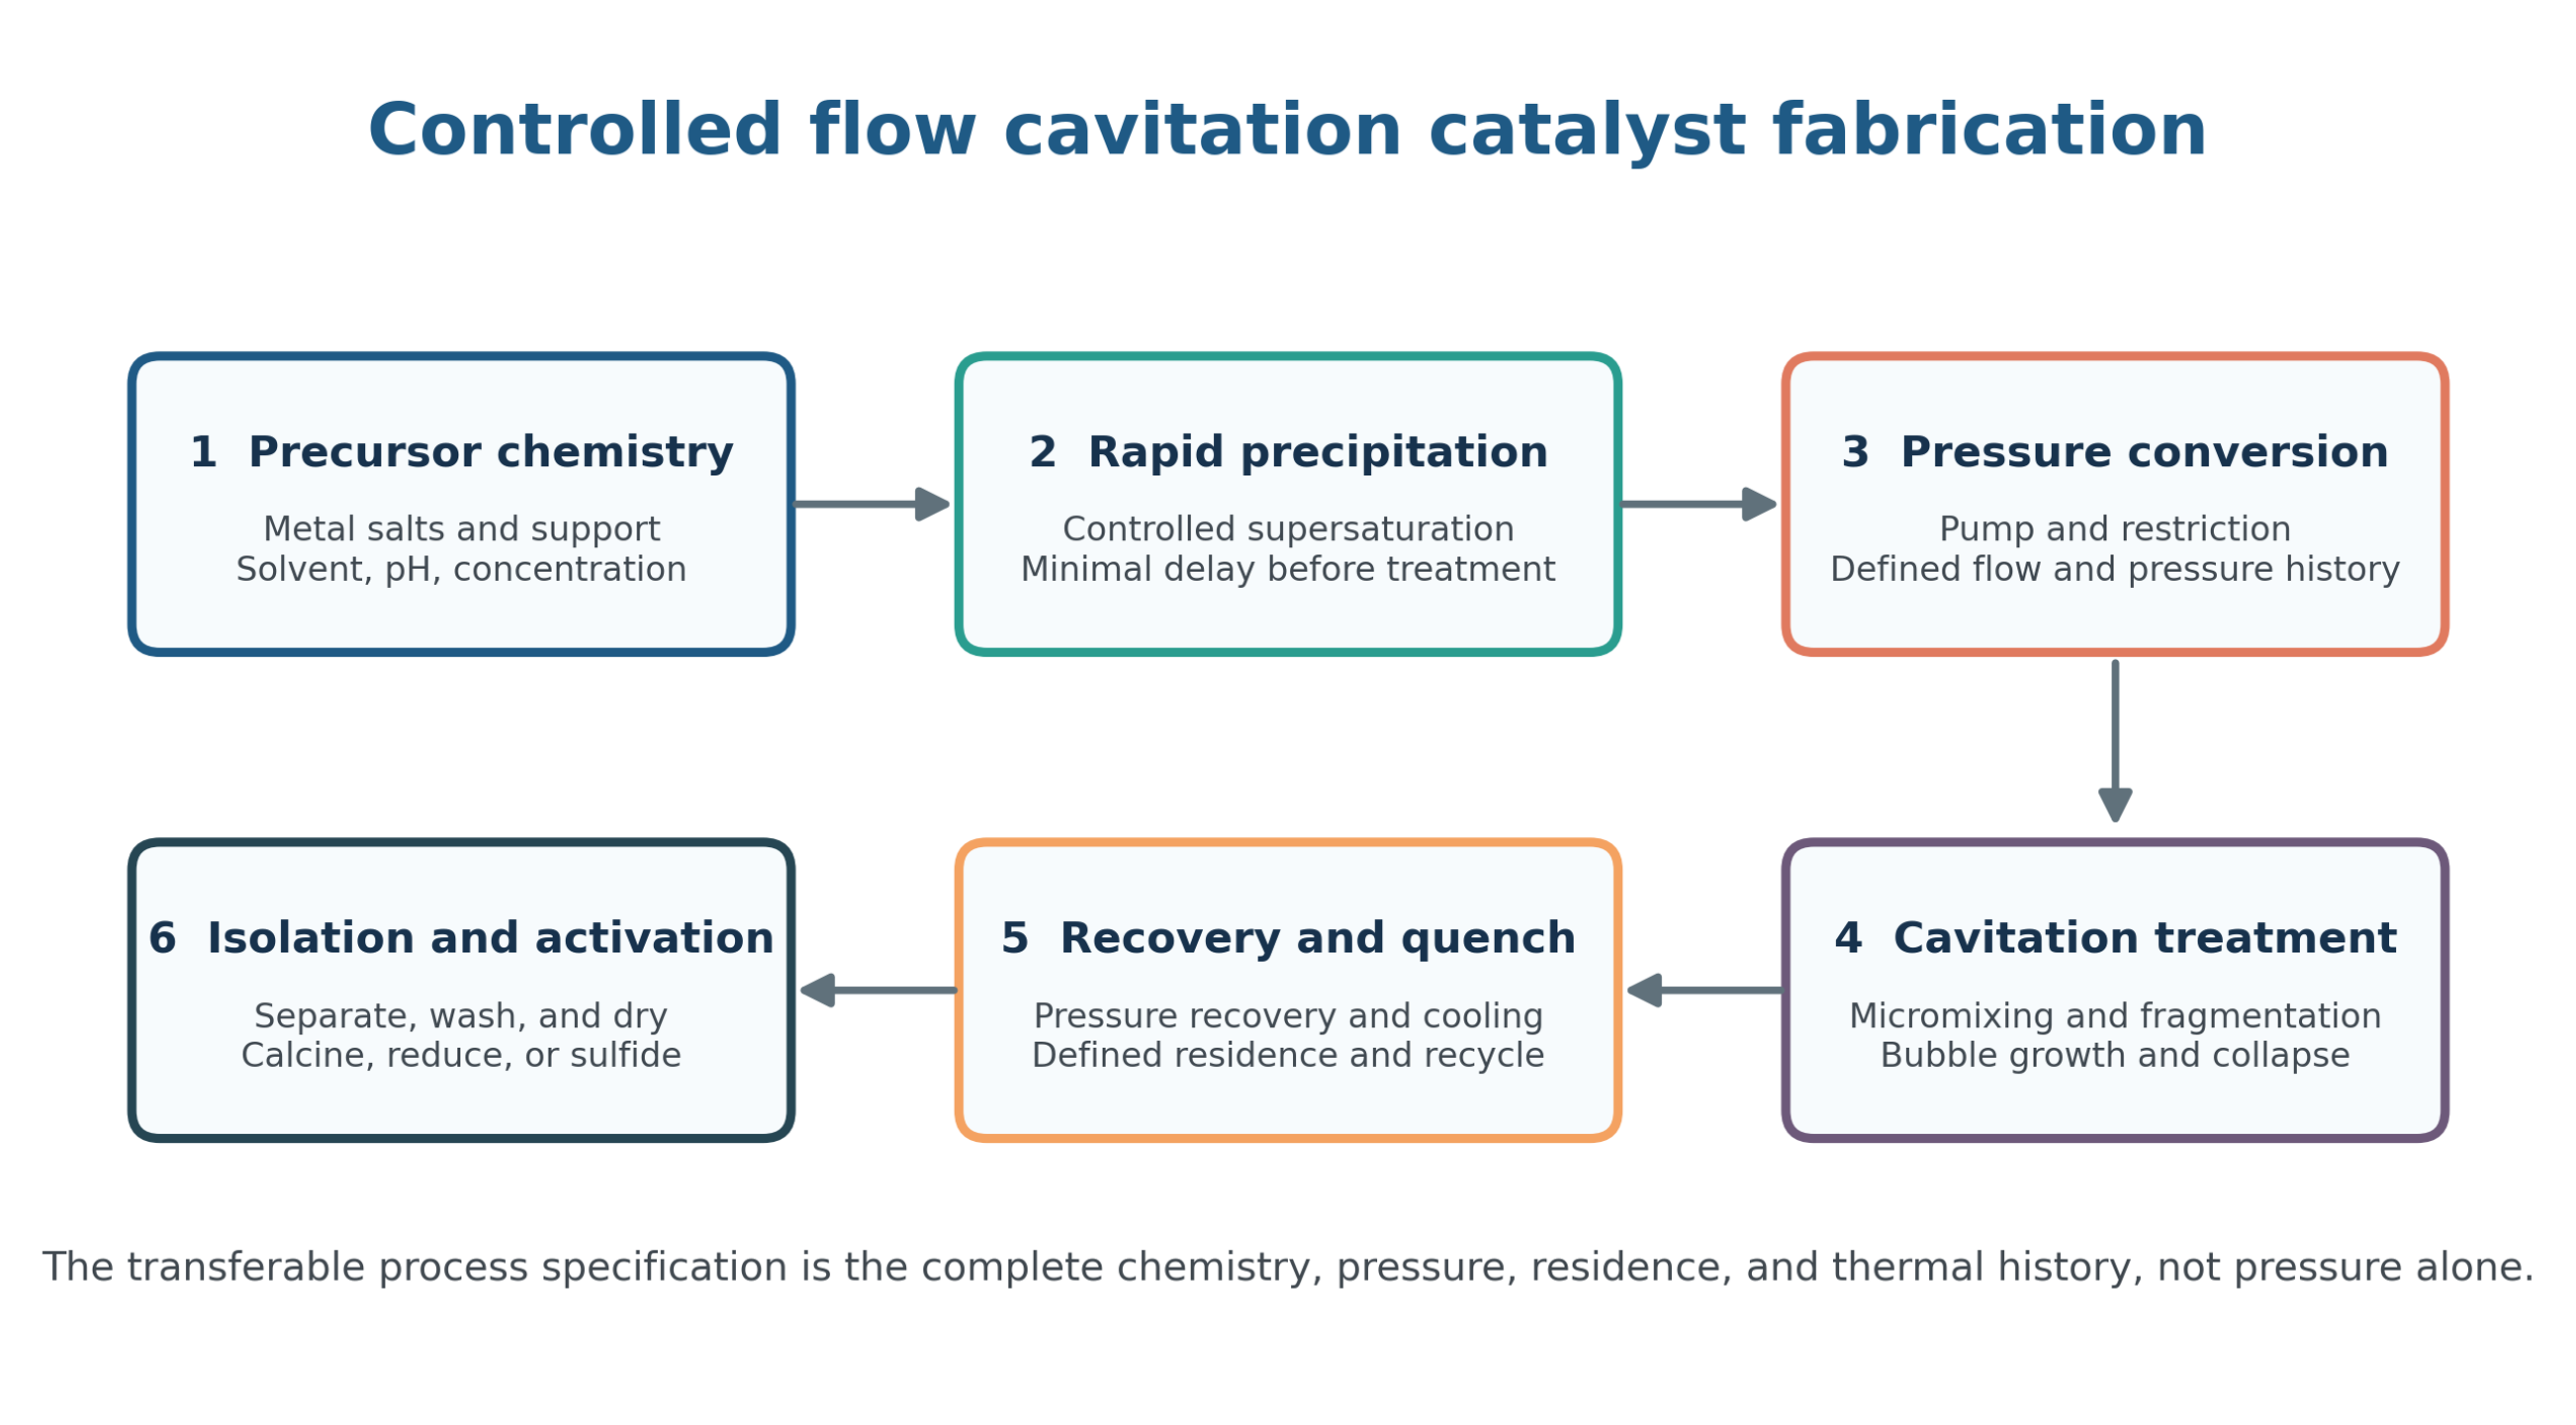
Figure 4.1. Engineering control points from precursor preparation through isolation and activation. [29].
4.2 Single Pass and Recycle Operation
Single pass operation is preferred when the objective is to identify reaction and nucleation kinetics because it provides a narrow definition of the interval between feed contact, pressurization, restriction passage, and product collection. Recycle is useful when one pass does not provide sufficient deagglomeration or conversion and can also smooth feed disturbances. Its principal disadvantage is the distribution of pass counts together with continued aging in the loop.
A recycle experiment should report slurry inventory, line and heat exchanger volume, flow rate, processing time, solids concentration, bypass fraction, and final isolated yield. Reporting only a processing time is insufficient because a given duration can correspond to less than one nominal pass or to hundreds of passes depending on loop volume and flow. Samples removed during recycle should be returned only when the sampled mass is included in the material balance.
4.3 Separation, Washing, Drying, and Activation
Cavitation does not eliminate downstream solids handling. The finest fraction can be selectively lost during filtration, retained in wash liquor, or agglomerated during drying. The separation method should therefore be selected according to particle size, solids concentration, filter cake compressibility, solvent properties, and required purity. Centrifugation, cross flow filtration, pressure filtration, and membrane concentration can recover different particle distributions.
Washing must remove counterions and residual precipitant without redispersing or dissolving the active component. Conductivity and ion analysis of the wash stream are more informative than a fixed number of wash cycles. Drying can be as influential as cavitation treatment: oven drying can create capillary necks, whereas freeze drying, spray drying, supercritical drying, or solvent exchange can preserve a more open structure. The WPI gold work identified drying history as a significant source of crystallite size variability [7].
Additional calcination, reduction, sulfidation, or other activation may remain necessary after synthesis. In this article, the term in situ calcination refers primarily to partial decomposition of a precipitated salt during processing and does not establish that every catalyst exits the processor in its final active state. Copper-zinc oxide catalysts require reduction, cobalt molybdate hydrotreating precursors require sulfidation, and supported noble metals can restructure under the reaction gas.
Table 4.1. Fabrication stages, critical variables, and acceptance criteria
| Stage | Critical variables | Recommended measurements | Acceptance criterion |
|---|---|---|---|
| Precursor preparation | Purity, concentration, metal ratio, solvent | ICP composition, density, pH, conductivity | Verified composition and no uncontrolled precipitation |
| Feed contact | Feed ratio, addition rate, premix time, temperature | Calibrated pumps and residence estimate | Reproducible supersaturation history |
| CFC treatment | Pressure, flow, geometry, back pressure, passes | Pressure traces, flow, temperature, acoustic or vibration signal | Stable hydraulic window without plugging |
| Separation and washing | Recovery method, wash volume, ion removal | Mass balance and filtrate analysis | High yield with counterions below specification |
| Drying | Temperature, time, atmosphere, capillary stress | Moisture, agglomerate size, BET area | Structure retained within target range |
| Activation | Temperature program, gas composition, space velocity | TPR, TPO, XRD, chemisorption, mass change | Defined active phase and dispersion |
| Final qualification | Composition, phase, area, size, activity, stability | Statistical product testing | All critical quality attributes within control limits |
5 Structure Forming Mechanisms
5.1 Micromixing and Suppression of Compositional Segregation
In conventional coprecipitation, local pH and supersaturation can differ substantially from bulk measurements. One metal hydroxide may nucleate near the precipitant inlet while another remains soluble. Cavitation can shorten the lifetime and spatial scale of these gradients by exposing the fresh intermediate to high velocity gradients, turbulent eddies, extensional deformation, and repeated pressure fluctuations. The improved phase purity reported for perovskites and cobalt molybdates is consistent with more uniform local composition before substantial aging occurs [1-7,23-27].
Micromixing is not equivalent to molecular equilibrium. Extremely rapid precipitation can occur before complete mixing, and the initial feed contact can determine the first nuclei. The preferred configuration places the principal mixing event at or immediately before the restriction, minimizes stagnant premix volume, and uses feed rates that maintain the required stoichiometry throughout the run. A pH measurement in the recycle tank cannot resolve transient pH at the feed contact point.
5.2 Fragmentation, Deagglomeration, and Surface Renewal
Fresh precipitates are often fractal gels or weak agglomerates rather than dense primary crystallites. Pressure waves, turbulent stress, and microjets can rupture these networks. Fragmentation increases external area, shortens diffusion distances for washing and precursor decomposition, exposes new support surface, and can distribute a secondary phase more uniformly across a support.
Fragmentation of soft agglomerates must be distinguished from comminution of dense crystallites. X-ray diffraction may show unchanged crystallite size while laser diffraction shows a large decrease in agglomerate size. Conversely, nucleation and growth can change crystallite size without a comparable change in measured hydrodynamic diameter. A complete study should therefore include at least one primary structure method and one suspension scale particle size method.
5.3 Local Heating and the In Situ Calcination Hypothesis
The early cavitation program reported three principal observations consistent with localized precursor decomposition. Selected area electron diffraction of selected dried products indexed to oxide phases. Ammonium molybdate processed in an insoluble medium produced X-ray patterns interpreted as indicating greater decomposition than oven treated references exposed for several hours. A kinetic back calculation suggested bulk particle heating above approximately 200 °C and a short inferred event near 675 °C. Calcium fluoride particles recirculated through a CaviMax processor became more rounded and developed necklike contacts [6,23-27].
These observations are important but indirect. They do not measure bubble temperature, heat flux into a suspended particle, or the temperature distribution within a gel agglomerate. Rounded particles may also result from impact, fracture followed by redeposition, dissolution and reprecipitation, or preferential abrasion. The Cu-Zn-Al study in the source materials did not observe the expected in situ calcination under its test conditions. A modern investigation should therefore combine high speed pressure measurements, calorimetry, thermally sensitive probe reactions, rapid product sampling, and thermal controls before assigning a unique local temperature.
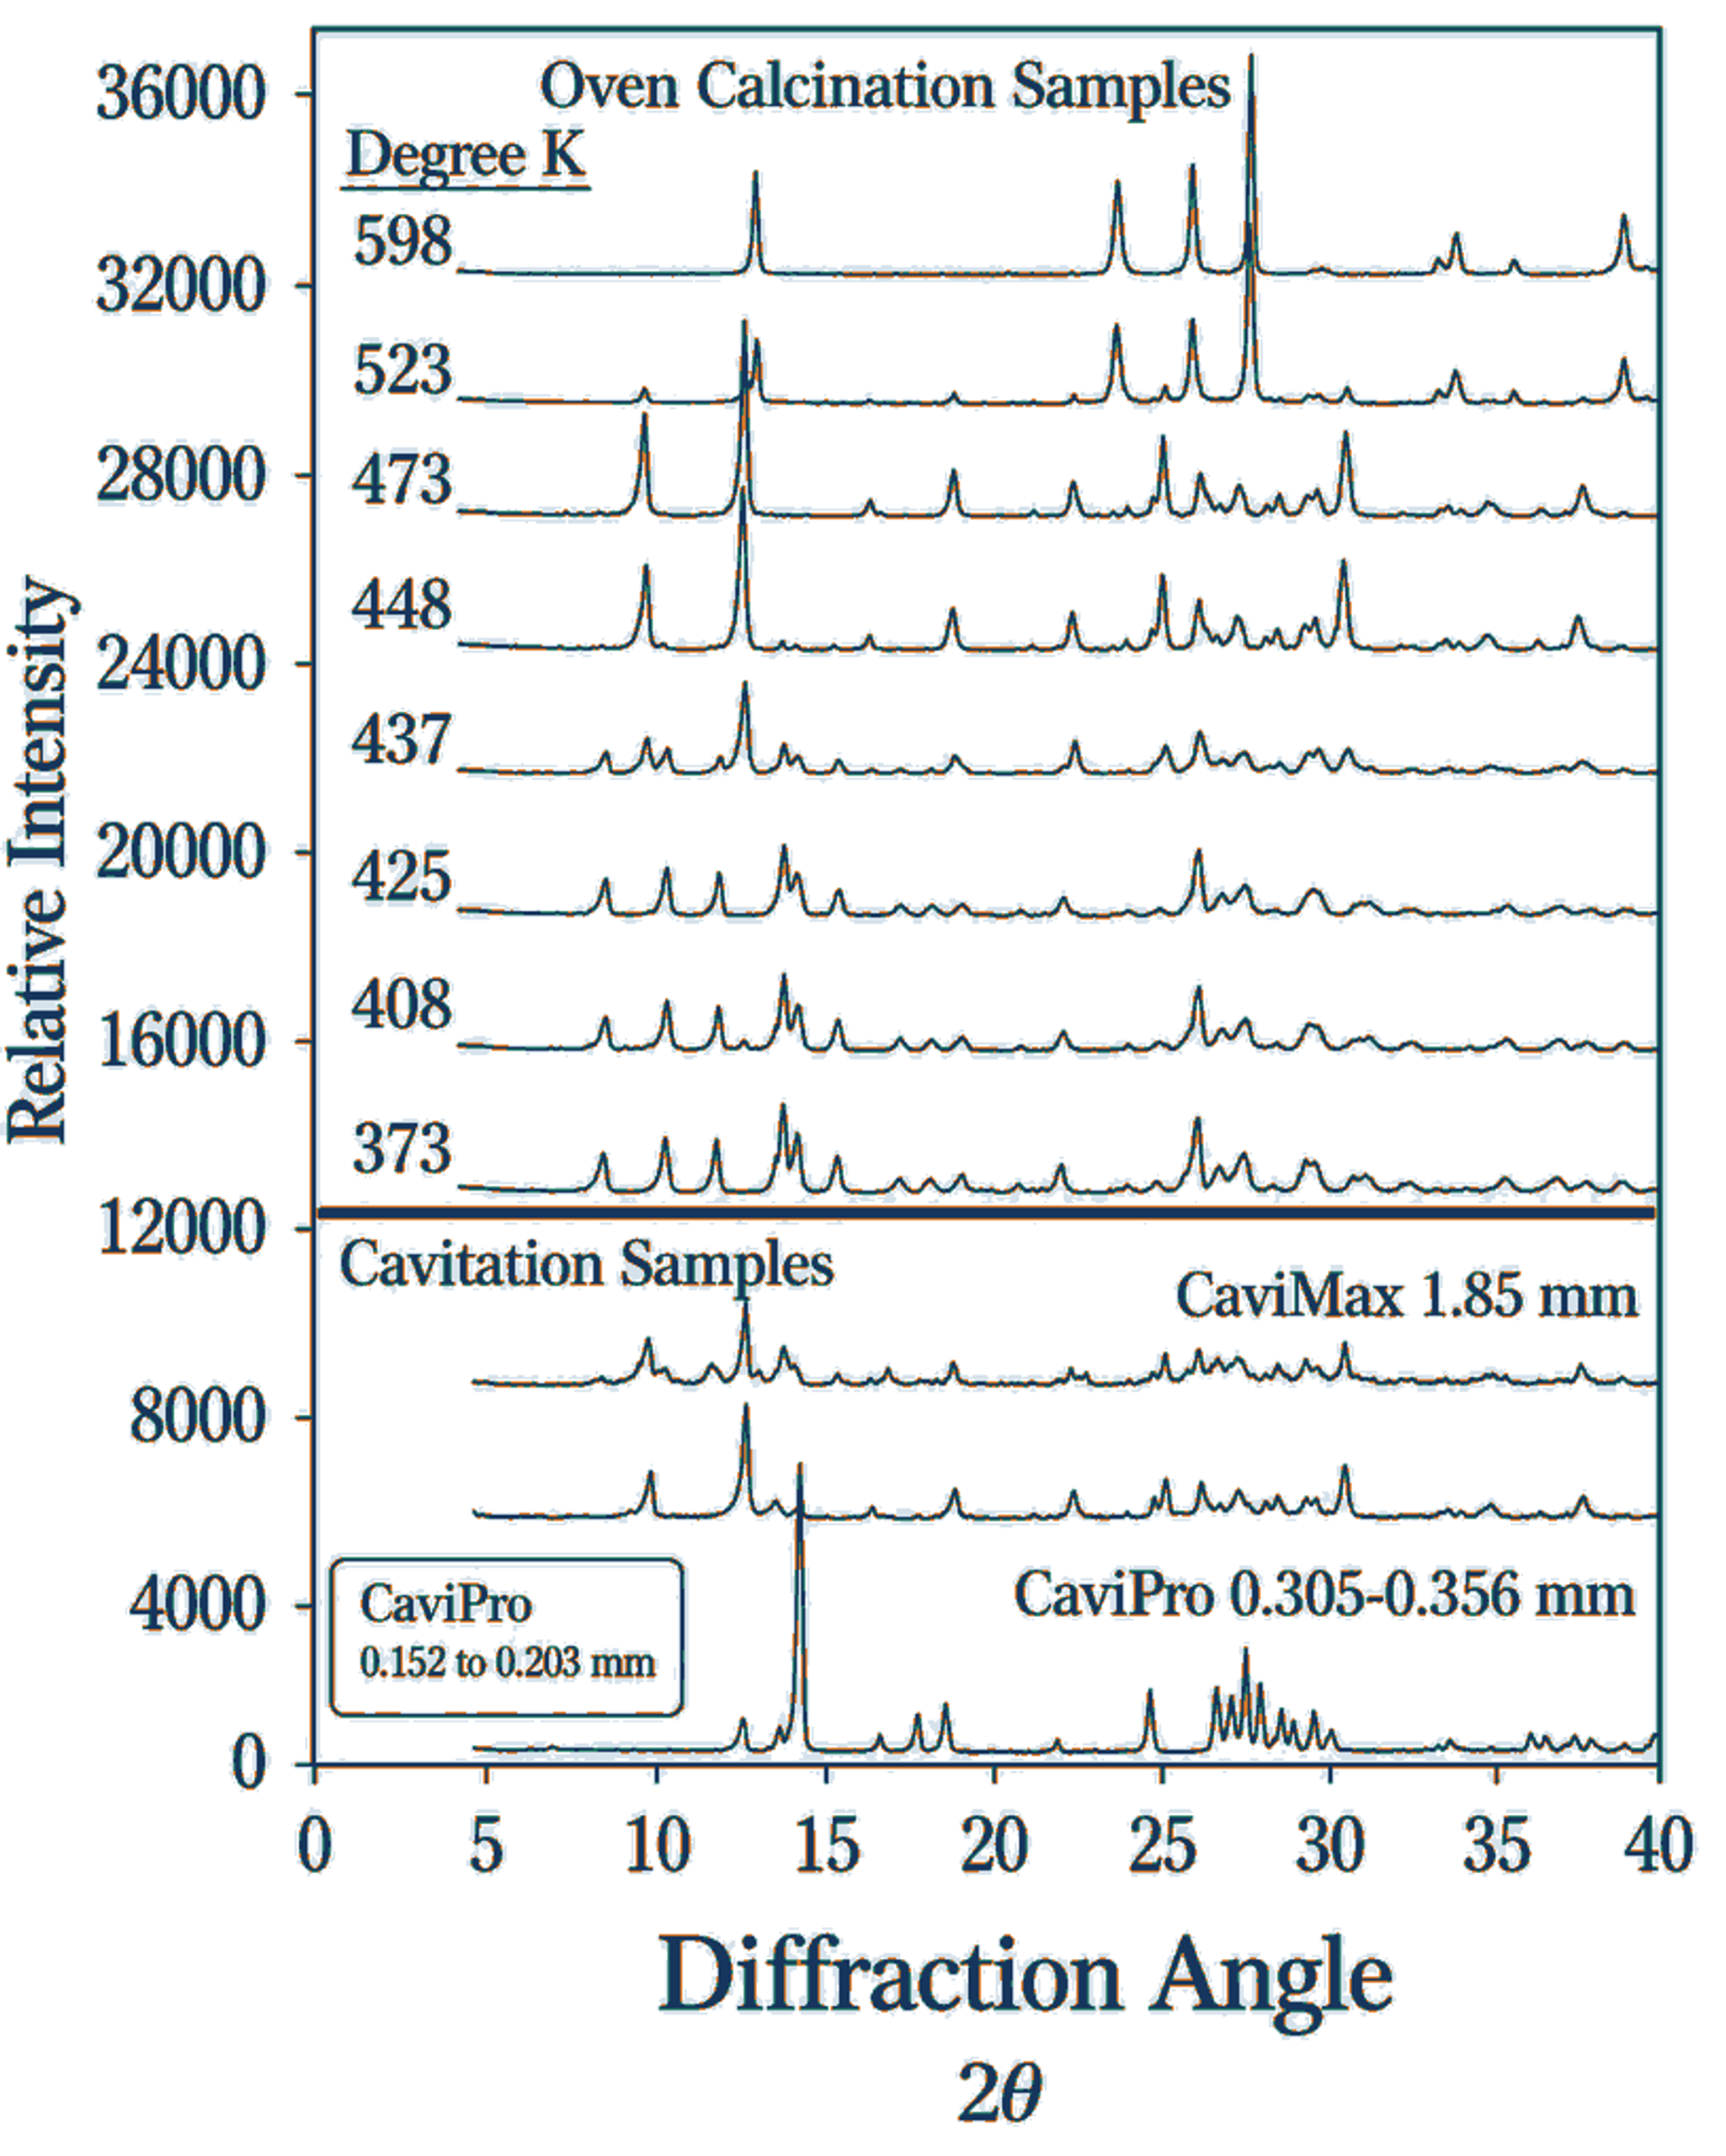
Figure 5.1. X-ray diffraction comparison was used in the early cavitation program to infer ammonium molybdate decomposition during processing. [6] The result is indirect evidence of thermal or mechanically assisted conversion.
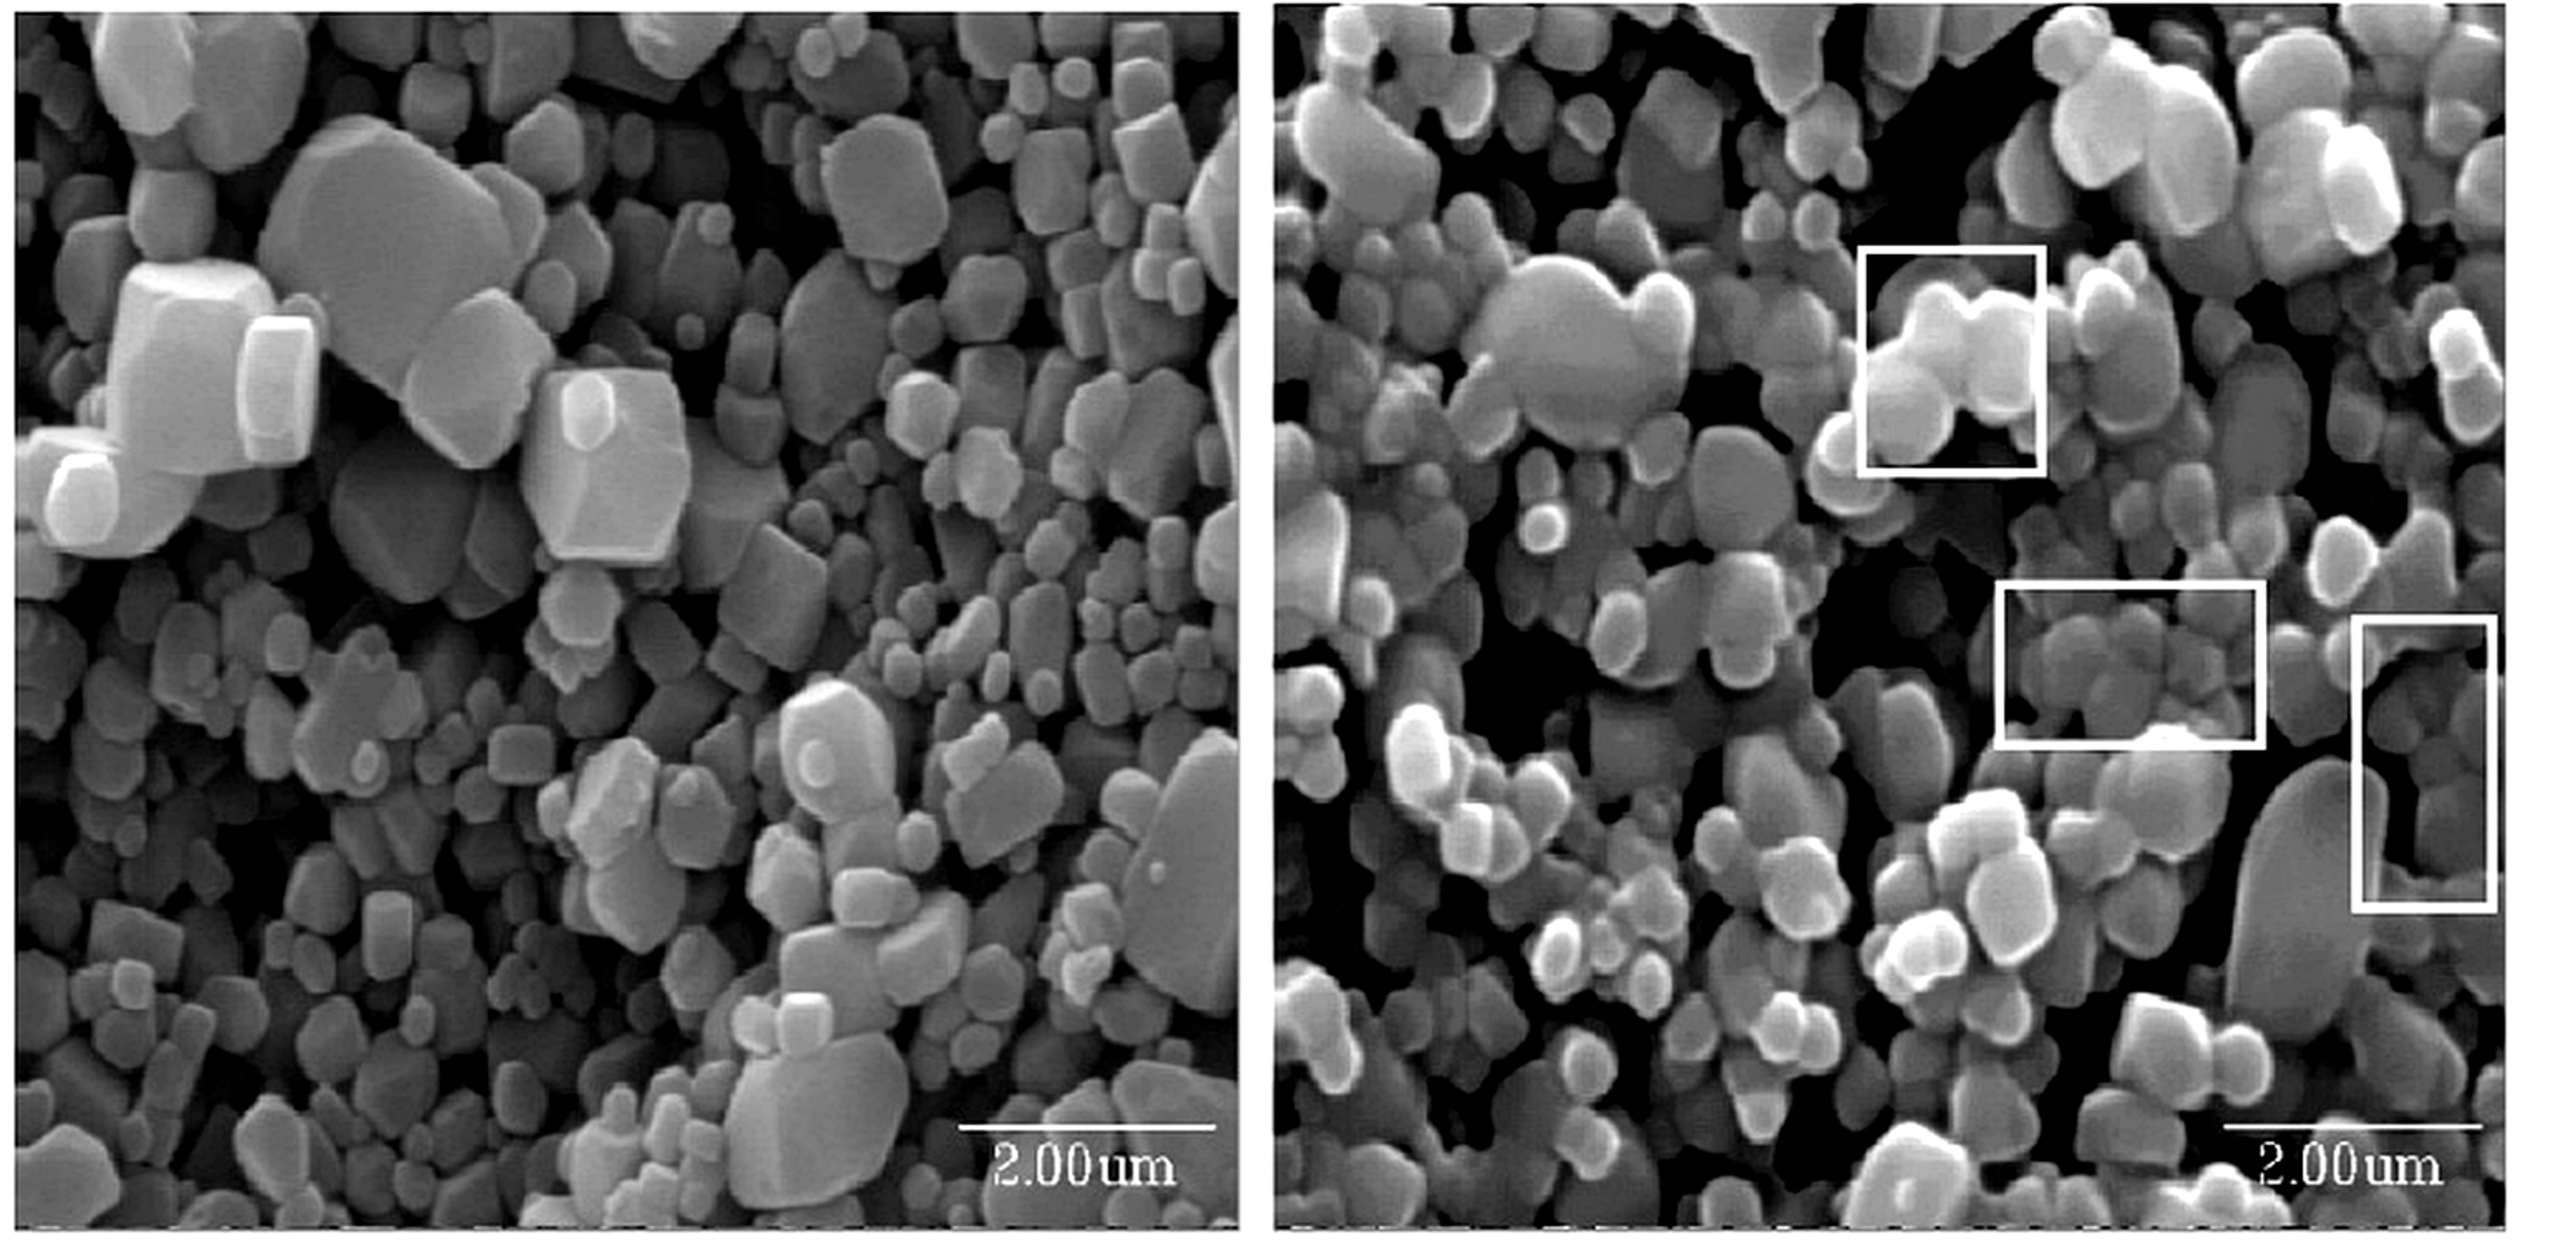
Figure 5.2. Calcium fluoride before and after CaviMax recirculation. The processed material shows rounding and necklike contacts that were interpreted as evidence of local softening. [25].
5.4 Nucleation, Growth Arrest, and Microstrain
CFC can increase nucleation by rapidly establishing a more uniform supersaturation field, dispersing embryos, and providing particle or bubble interfaces for heterogeneous nucleation. Sustained growth can be limited because residence time in the most intense zone is short and the slurry rapidly returns toward bulk temperature. Conversely, recycle and warm holding can promote ripening. Final size is therefore an emergent response to chemistry, hydrodynamics, and downstream thermal history.
Microstrain measured by diffraction line broadening can arise from lattice mismatch, coherent interfaces, compositional gradients, vacancies, dislocations, or residual stress, but it can also reflect analysis artifacts. Early work reported adjustable strain in copper-zinc-aluminum oxides, titania, and lead zirconate titanate, suggesting that mechanical and thermal history may alter defect retention independently of mean crystallite size. The catalytic significance depends on whether those defects survive activation and contribute to a measurable active site population.
Table 5.1. Mechanistic hypotheses and decisive experiments
| Hypothesis | Consistent observations | Decisive experiment | Interpretation risk |
|---|---|---|---|
| Rapid micromixing improves composition uniformity | Higher phase purity in multimetal oxides | Time resolved feed tracer and spatial composition mapping | Phase purity can also result from calcination |
| Collapse fragments soft gels | Smaller agglomerates and improved dispersion | In situ particle size before and after one pass | Drying can create or destroy agglomerates |
| Local heating decomposes precursor | Oxide diffraction and decomposition pattern | Fast product quench with thermal markers and calorimetry | Pressure, abrasion, and dissolution may mimic heating |
| CFC increases nucleation density | Shorter induction and smaller crystallites | Nucleation rate measured at constant supersaturation | Higher mass transfer can also accelerate growth |
| CFC introduces useful defects | Higher microstrain or altered lattice parameter | Operando spectroscopy linked to intrinsic rate | Line broadening can include instrument and size effects |
| Pressure recovery controls collapse location | Back pressure changes structure and erosion | Synchronized pressure field and high speed visualization | A single downstream pressure cannot describe the cloud |
6 Representative Catalyst and Precursor Systems
6.1 Multimetal Oxides and Perovskites
La₀.₆Sr₀.₄FeO₃ was used to demonstrate phase formation in a multication oxide. The cavitation prepared patterns closely matched the reference perovskite, whereas the conventional preparation in the technical disclosure contained additional reflections. Reported calcined crystallite sizes were approximately 16-18 nm [6,23-27]. The result supports rapid coprecipitation and compositional homogenization but does not by itself establish improved oxygen transport, redox capacity, or catalytic durability. These properties require measurement after a defined thermal history.
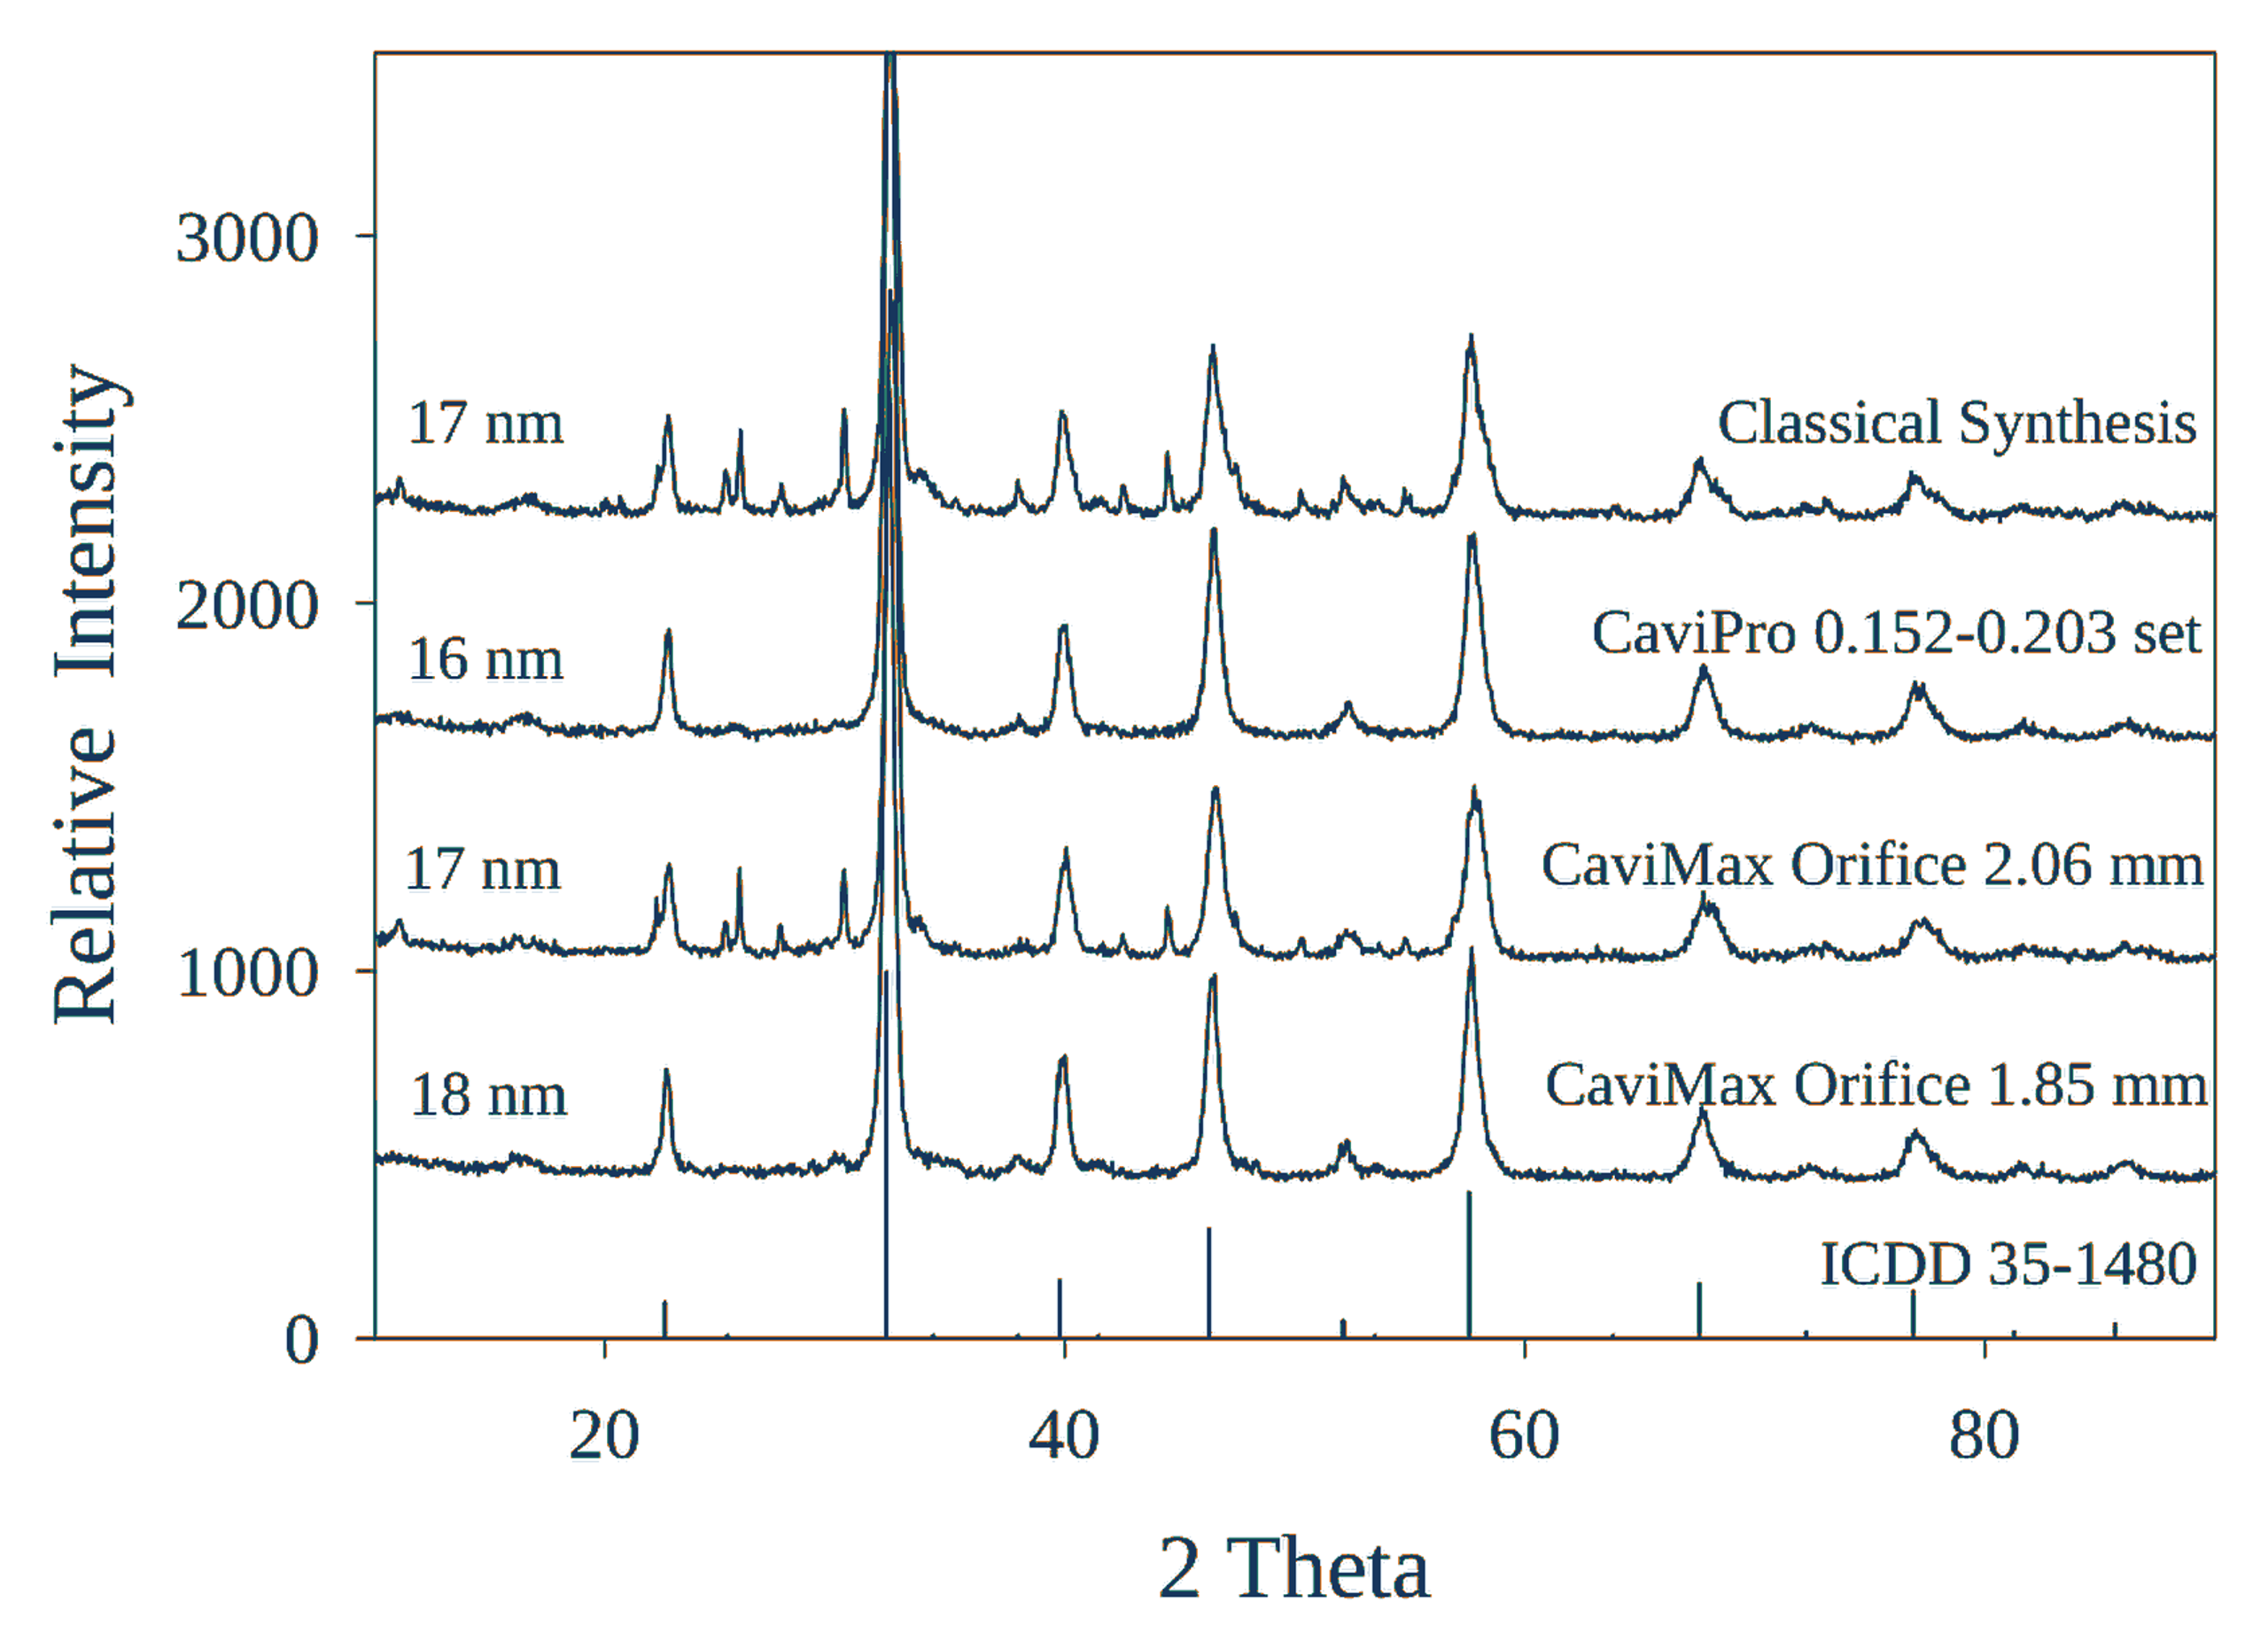
Figure 6.1. X-ray diffraction comparison for La₀.₆Sr₀.₄FeO₃ prepared by cavitation and conventional precipitation. [6].
6.2 Copper Zinc Aluminum Oxide for Methanol Synthesis
Copper-zinc-aluminum oxide illustrates the interaction between precursor chemistry and mechanical settings. In the source data, changing the second restriction produced CuO crystallite sizes of approximately 6-13 nm after calcination and a nonmonotonic microstrain response. The highest strain occurred near the smallest reported crystallite size. The result demonstrates mechanical control of a structural response within a fixed formulation, but the dependence is not monotonic and cannot be transferred to another chemistry without calibration [6,7,23-27].
For methanol synthesis, CuO size before reduction is only a precursor metric. The active catalyst contains metallic copper interacting with ZnO and an oxide matrix, and reduction can reconstruct dispersion and interfacial structure. A valid comparison therefore requires identical reduction conditions, copper surface area by chemisorption, microscopy or absorption spectroscopy of the reduced state, productivity normalized to copper area, selectivity, and deactivation under identical gas composition and heat transfer conditions.
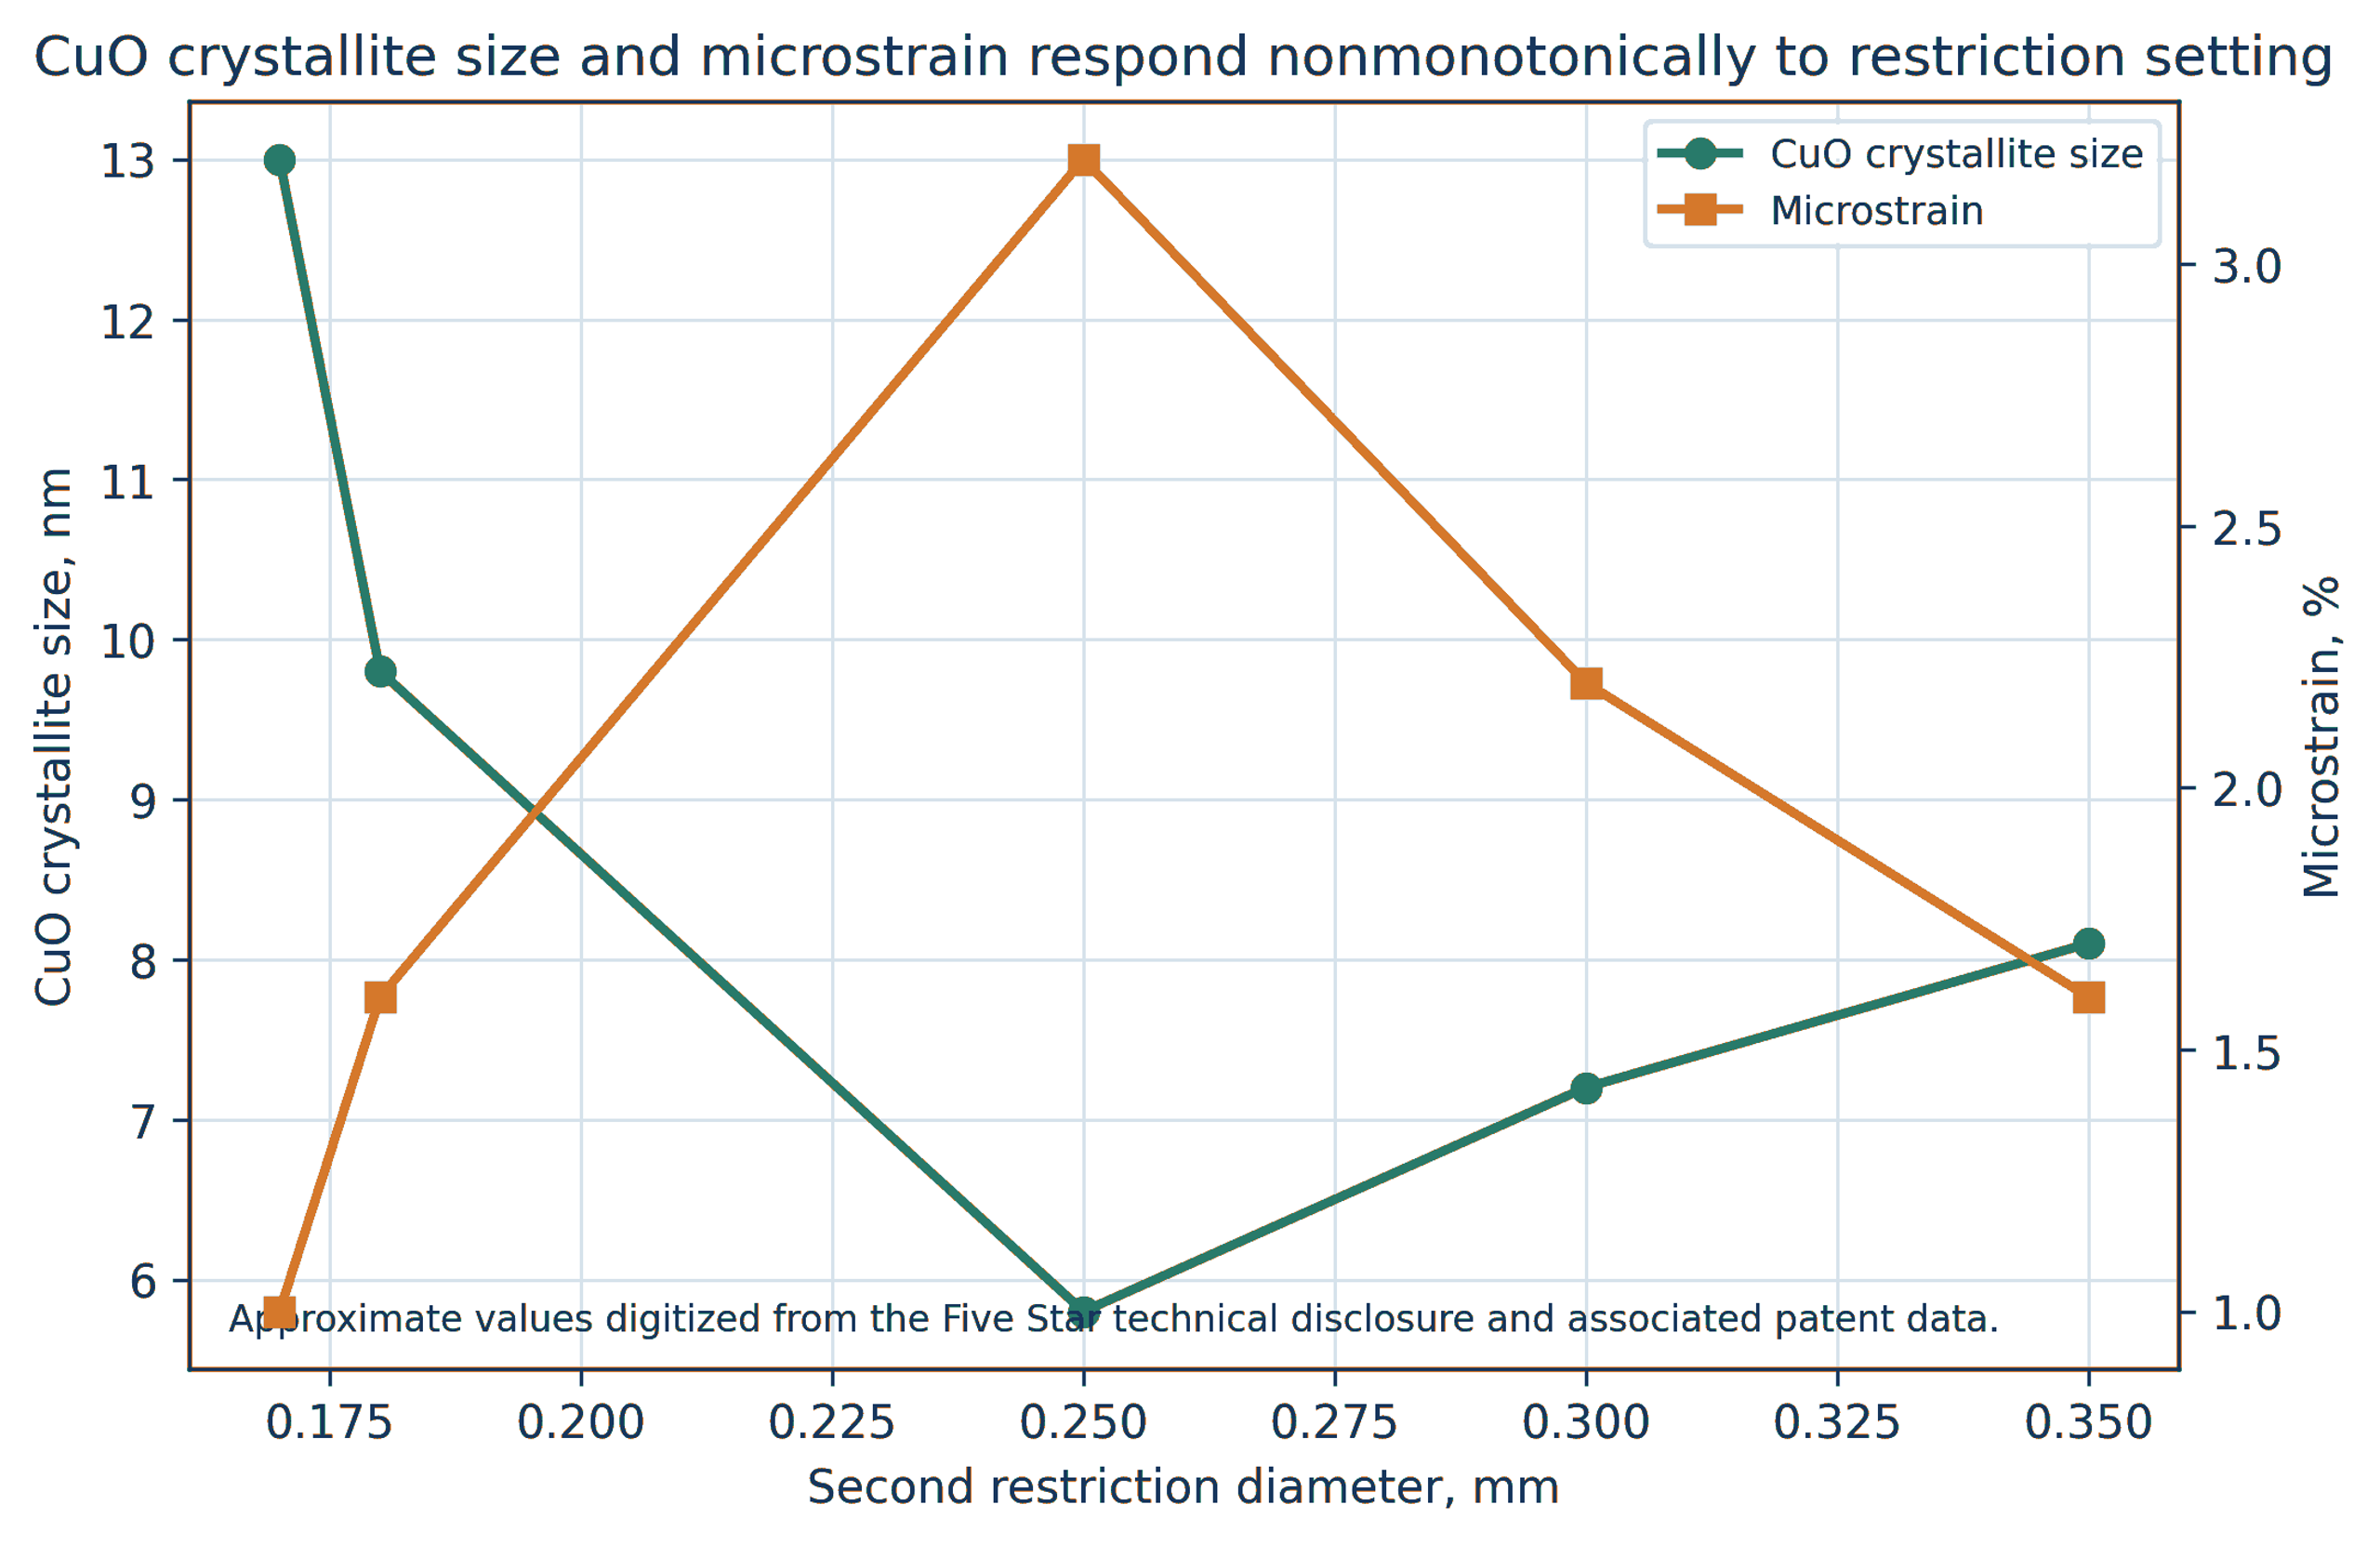
Figure 6.2. Reported CuO crystallite size and microstrain as a function of second restriction diameter for Cu₀.₂₂Zn₀.₆₈Al₀.₁₀Oₓ. [6,7,23-27].
6.3 Cobalt Molybdate on Alumina and Silica
Cobalt molybdate was examined because phase segregation is readily detected by X-ray diffraction and because cobalt molybdenum precursors are industrially important. In supported and unsupported formulations, cavitation generally increased the fraction of CoMoO₄ and reduced separate MoO₃ relative to mechanically stirred precipitation. On gamma alumina, reported cavitation crystallites were approximately 18-20 nm compared with about 38 nm for the conventional sample. Under selected conditions on silica, separate MoO₃ reflections were substantially reduced [1-7].
The active hydrotreating phase is not crystalline CoMoO₄. After sulfidation, performance depends on MoS₂ slab length and stacking, cobalt promotion at edge sites, sulfur vacancies, support interactions, and resistance to sintering and poisoning. Precursor phase purity is therefore a useful process response but not the final performance metric.
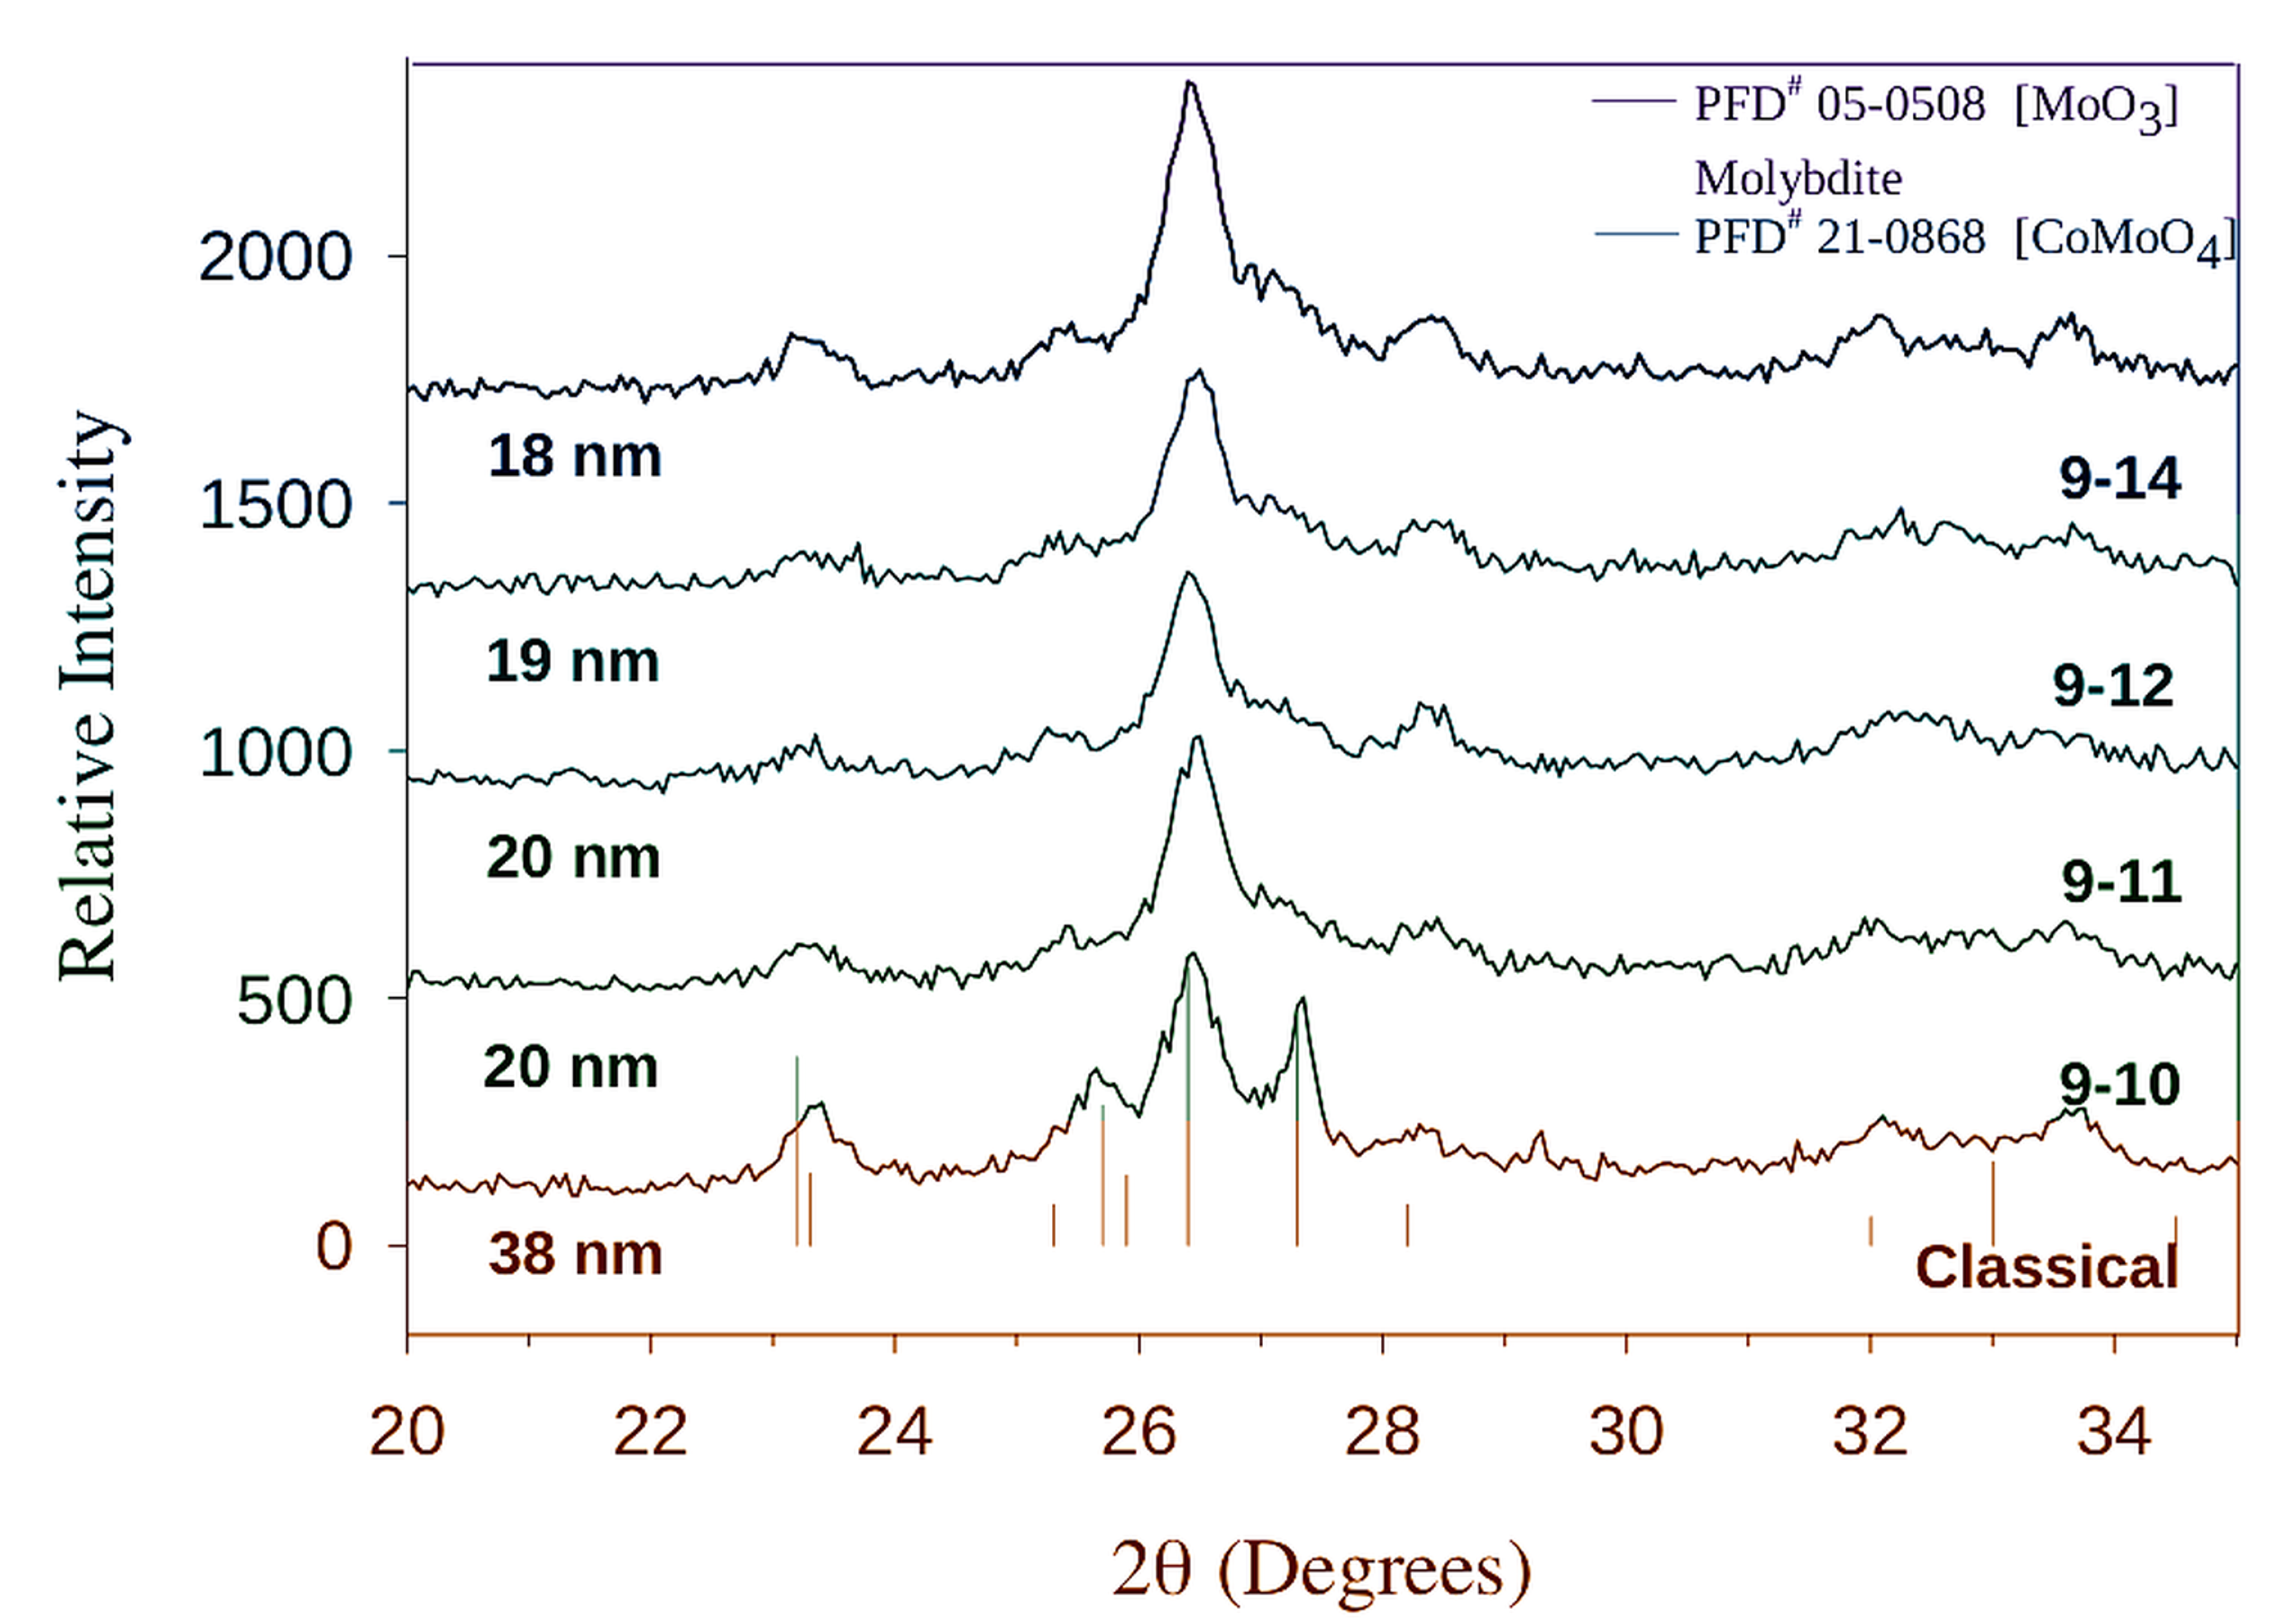
Figure 6.3. X-ray diffraction patterns for cobalt molybdate on gamma alumina prepared with several CaviPro restriction sets and by conventional precipitation. [6].
6.4 Gold on Titania and the Importance of Chemical Regime
Supported gold provides a clear warning against attributing every response to cavitation severity. Emerson found that low pressure hydrodynamic cavitation, approximately 6.9-48 bar, had little effect on gold crystallite size at fixed gold content for several precipitation systems. When hydrazine reduction chemistry, precursor dilution, restriction diameter, and reductant addition rate were changed together, gold size could be adjusted from approximately 8-80 nm. Individual factors were weak, whereas their interactions were important [7].
A modified basic hydrazine route at pressures above approximately 689.5 bar produced 2-9 nm gold crystallites at a gold content near 2.27%. In selected single restriction experiments, the dissertation reported 2.5 nm at 10,000 psig, 8.2 nm at 13,000 psig, 5.8 nm at 17,000 psig, and replicate values of 3.8 and 2.7 nm at 20,000 psig. Gold yield was generally higher in the hydrodynamic runs than in conventional preparation. However, CO oxidation activity was low for most high pressure basic hydrazine samples, and sodium titanate formation was identified as a likely cause. Thus, smaller crystallites and higher incorporation did not necessarily produce a better catalyst [7].
The same source showed that gold loading dominated activity in another synthesis series. Reducing loading from about 0.50% to 0.05% by weight increased the rate per mole of gold by approximately nineteenfold, presumably because of improved dispersion. A cavitation development program should therefore vary chemical concentration and hydrodynamic conditions independently and include conventional controls at matched composition.
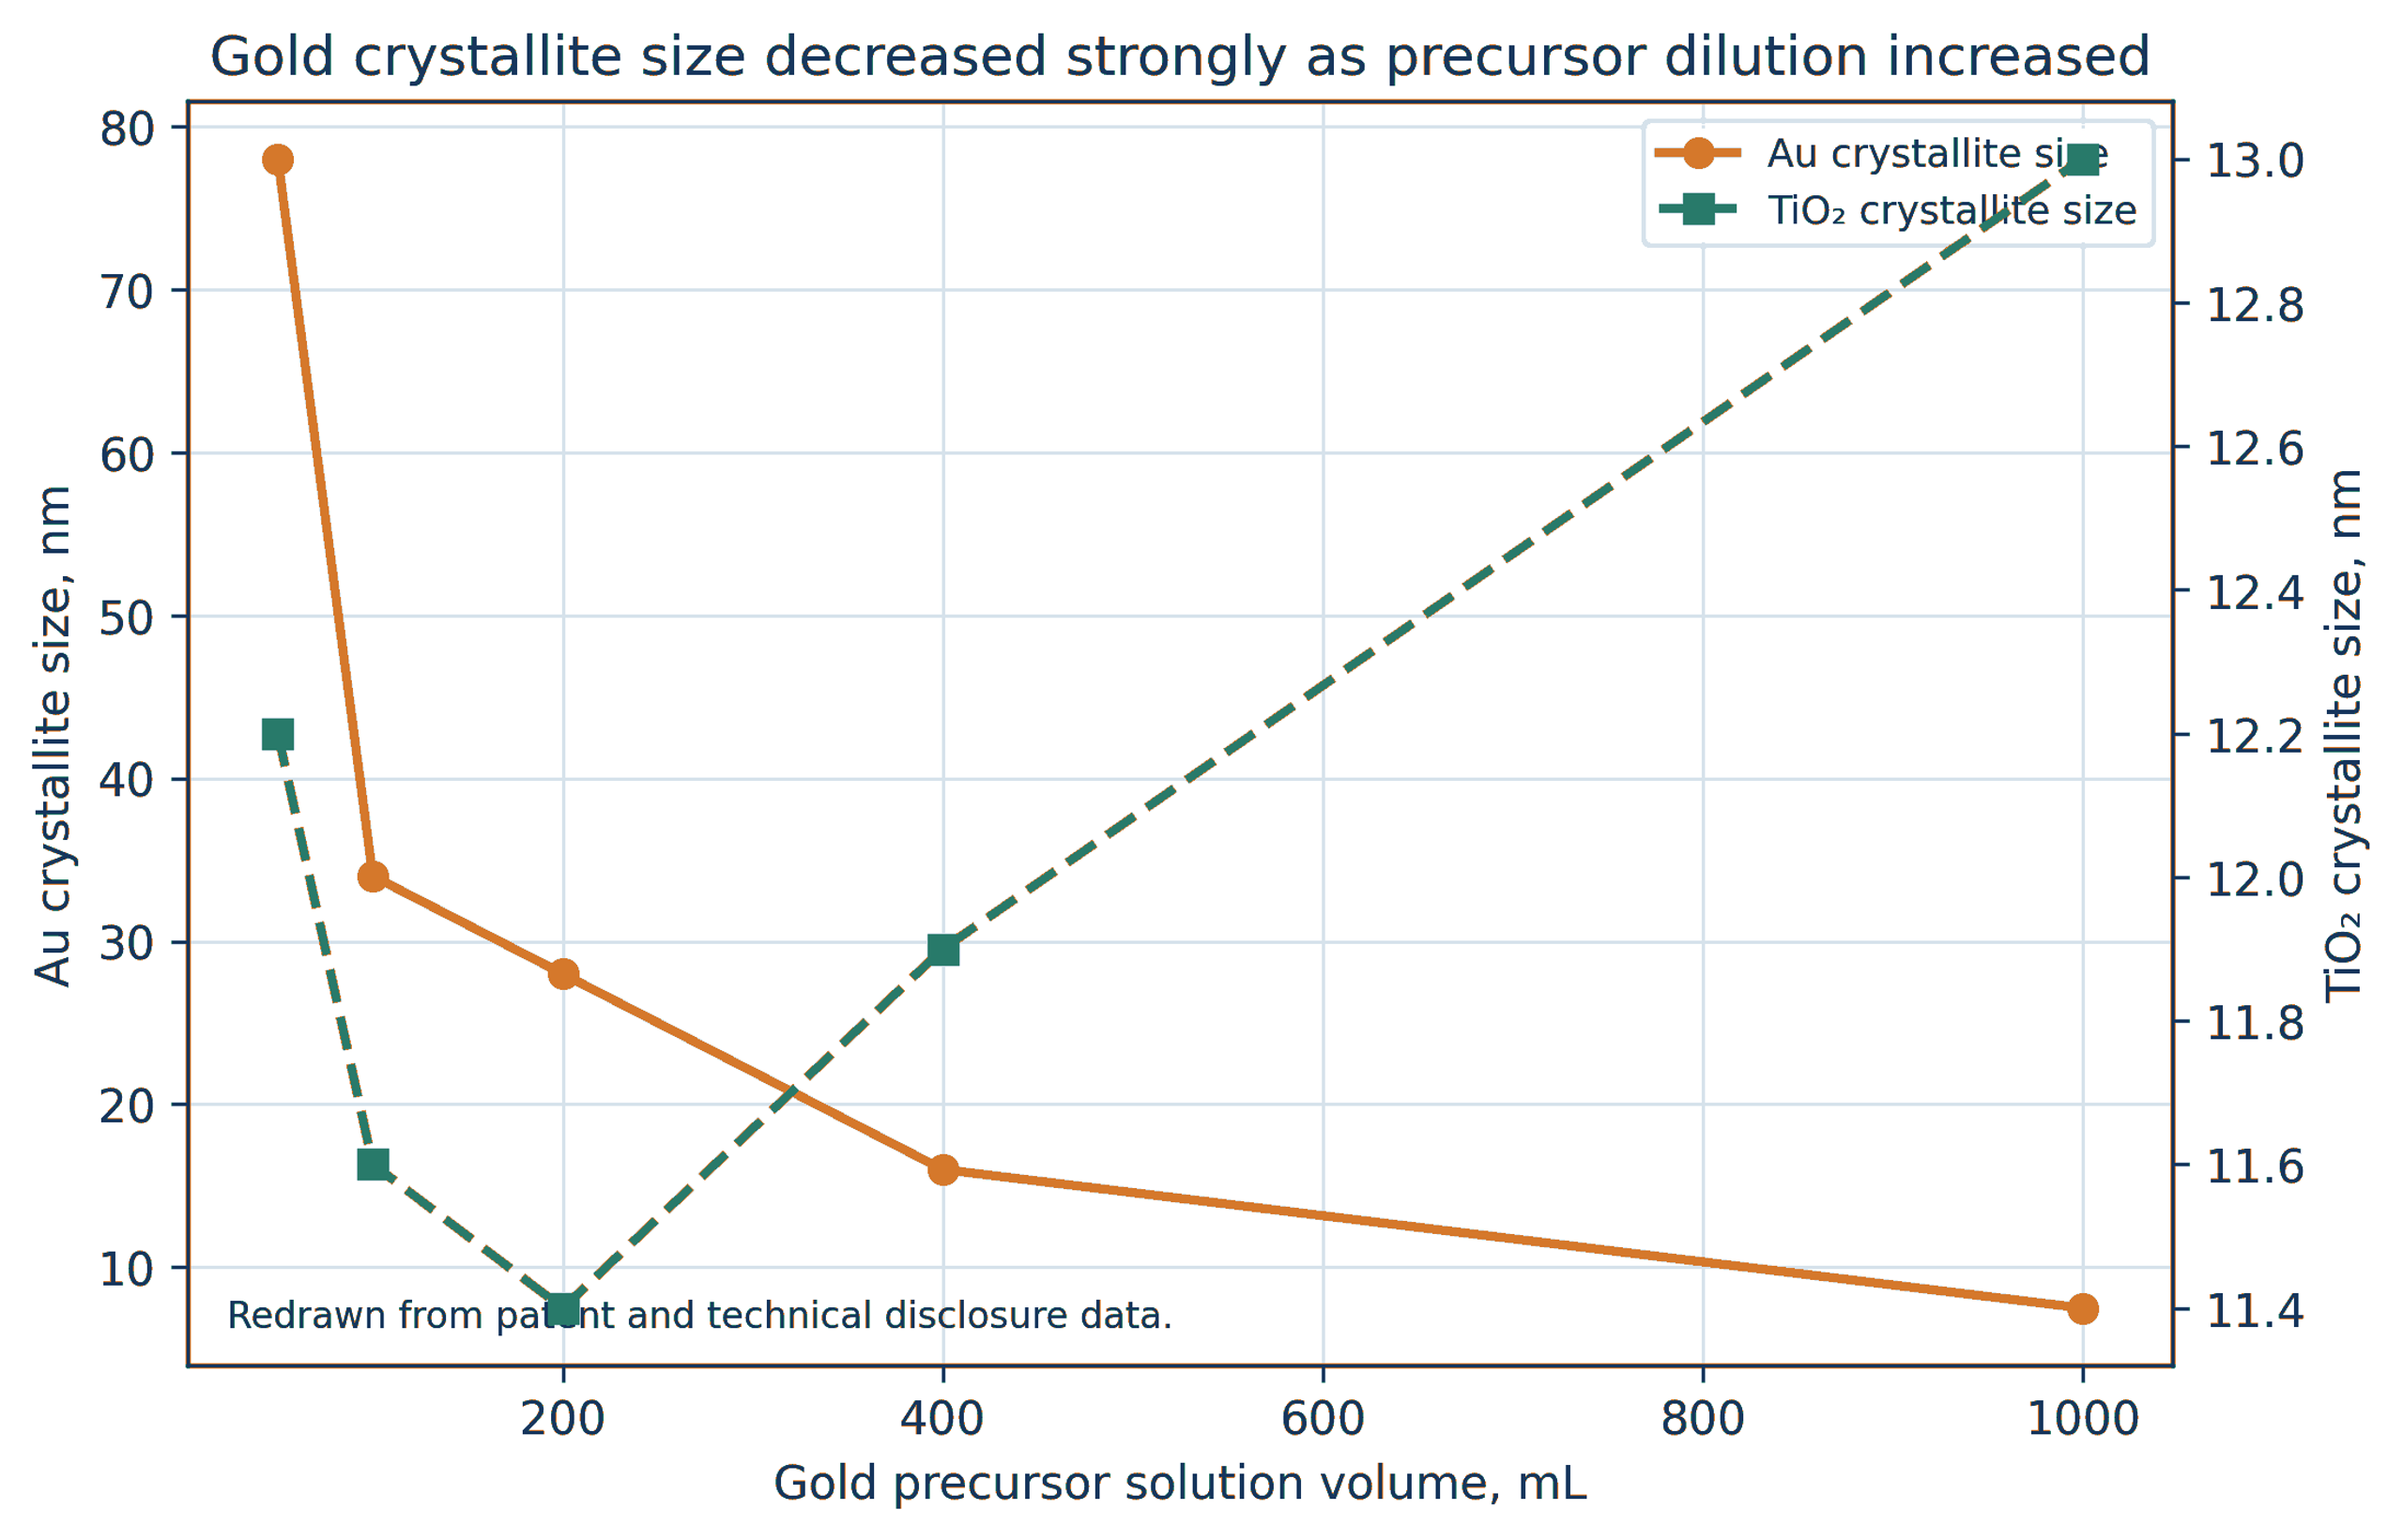
Figure 6.4. Gold crystallite size on titania as a function of precursor solution volume at fixed nominal loading. [1-3,6,7].
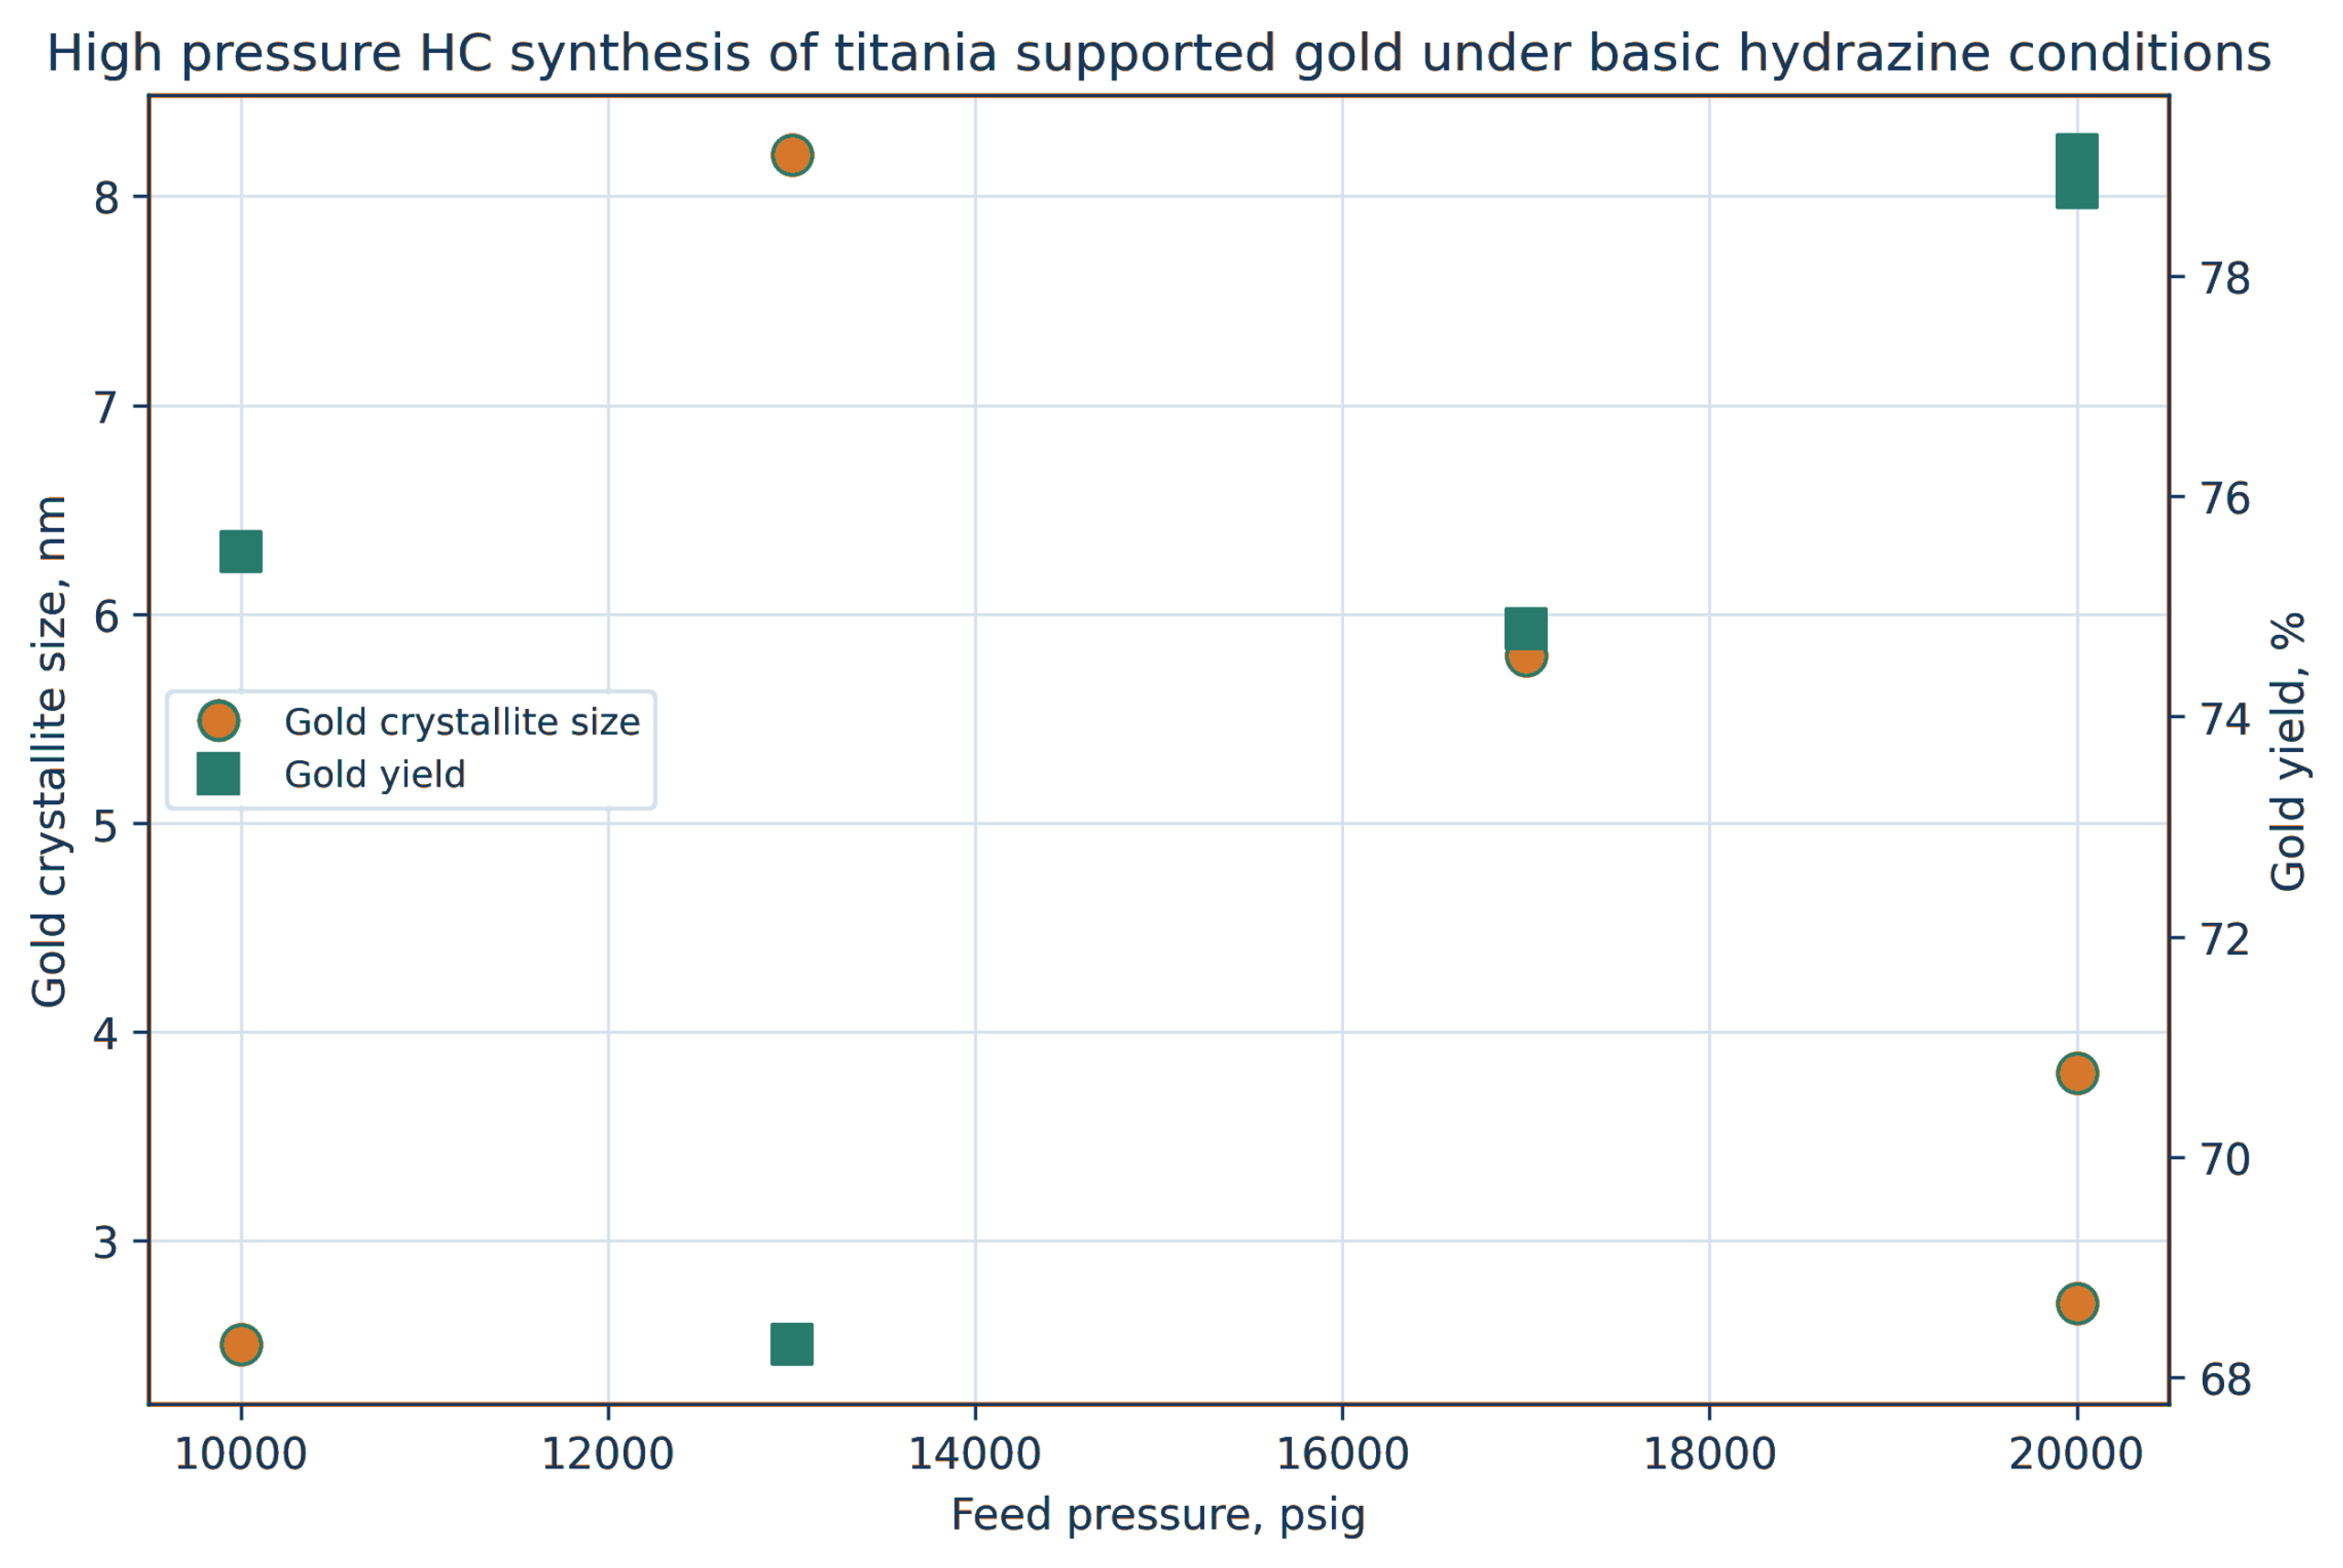
Figure 6.5. High pressure hydrodynamic synthesis of titania supported gold under basic hydrazine conditions. Crystallite size and gold yield are plotted from single 0.006 inch restriction data [7]. Replicate 20,000 psig runs are shown separately.
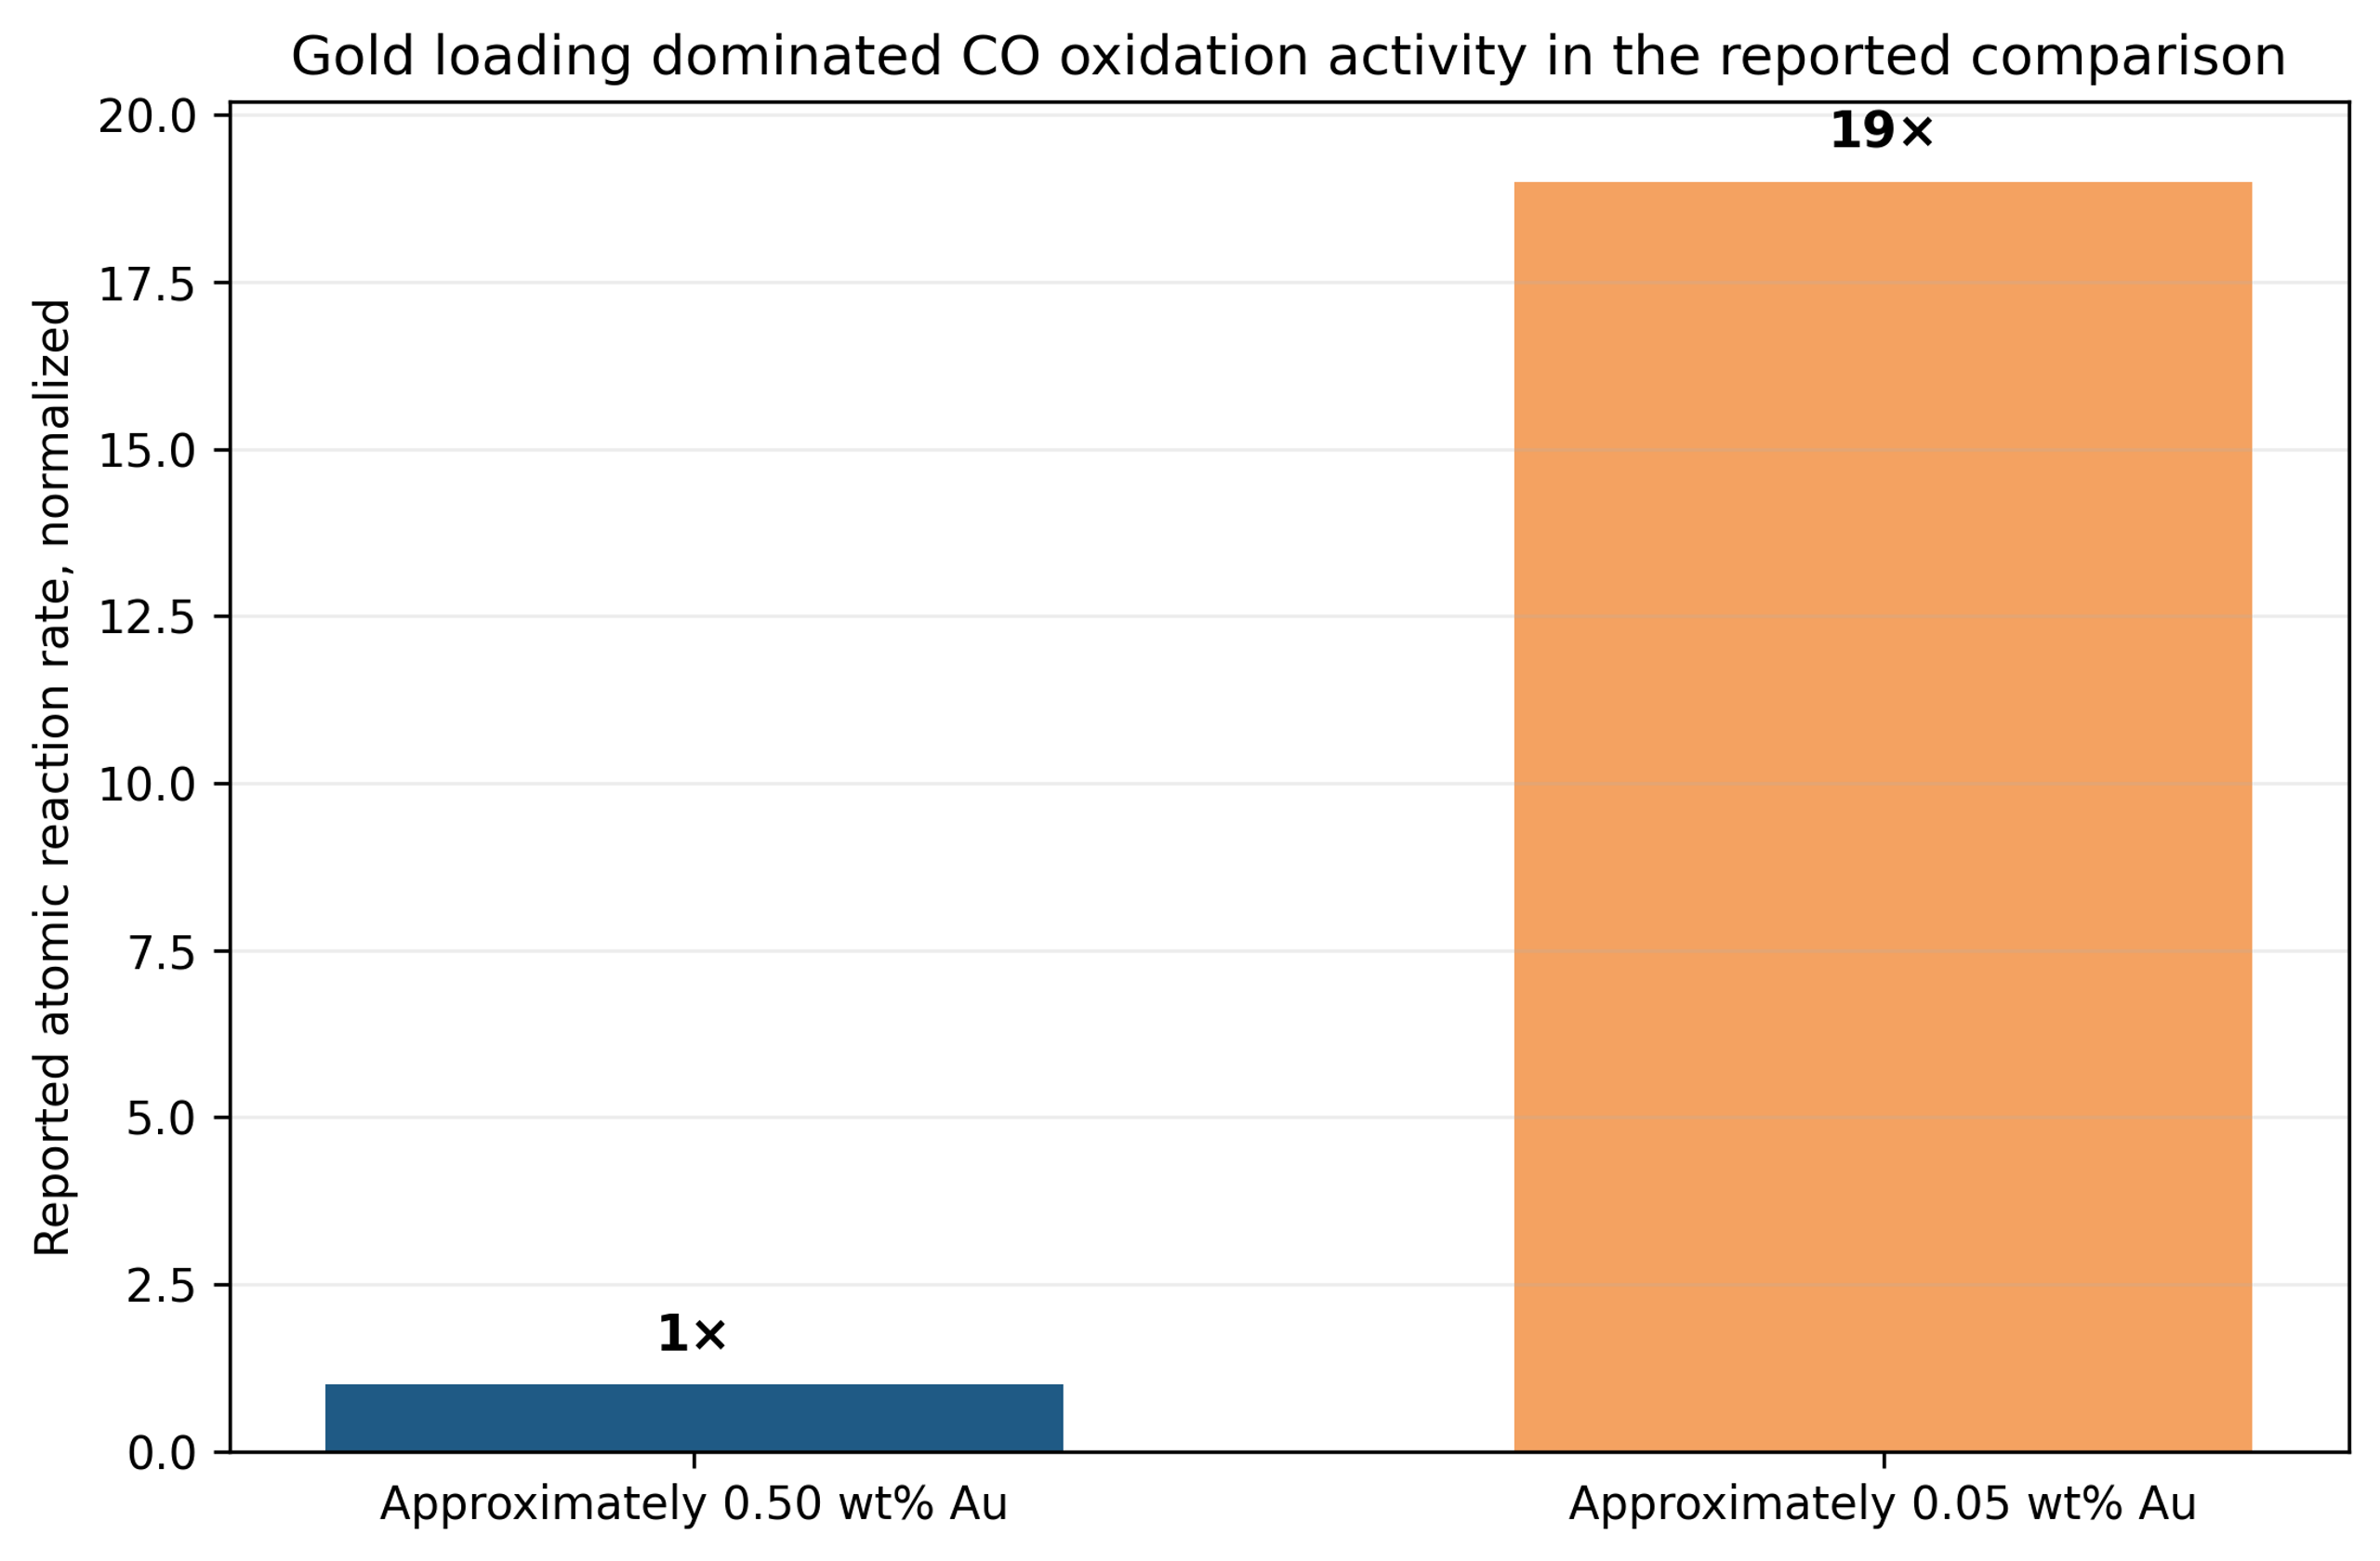
Figure 6.6. Normalized effect of gold loading on atomic CO oxidation rate. The rate per mole of gold increased approximately nineteen fold as loading decreased from about 0.50-0.05 weight percent [7].
6.5 Silver, Platinum, Palladium, and Supported Noble Metals
Patent and technical disclosure data indicate size control for several supported noble metals. Silver on titania prepared by cavitation showed less growth during calcination at 400 °C than a conventional sample. Reported platinum crystallites were approximately 3.7-4.1 nm for selected CaviPro conditions compared with about 5.4 nm for conventional preparation. Silver on alpha alumina and unsupported palladium showed nonmonotonic responses to throat cavitation number [1-7].
These comparisons require careful interpretation. X-ray diffraction may not detect the smallest or most dilute particles. Oxidation state, support hydroxylation, chloride retention, reduction temperature, and strong metal-support interactions can dominate catalytic activity. Thermal stability should therefore be evaluated through repeated reaction and regeneration cycles rather than at a single calcination condition.
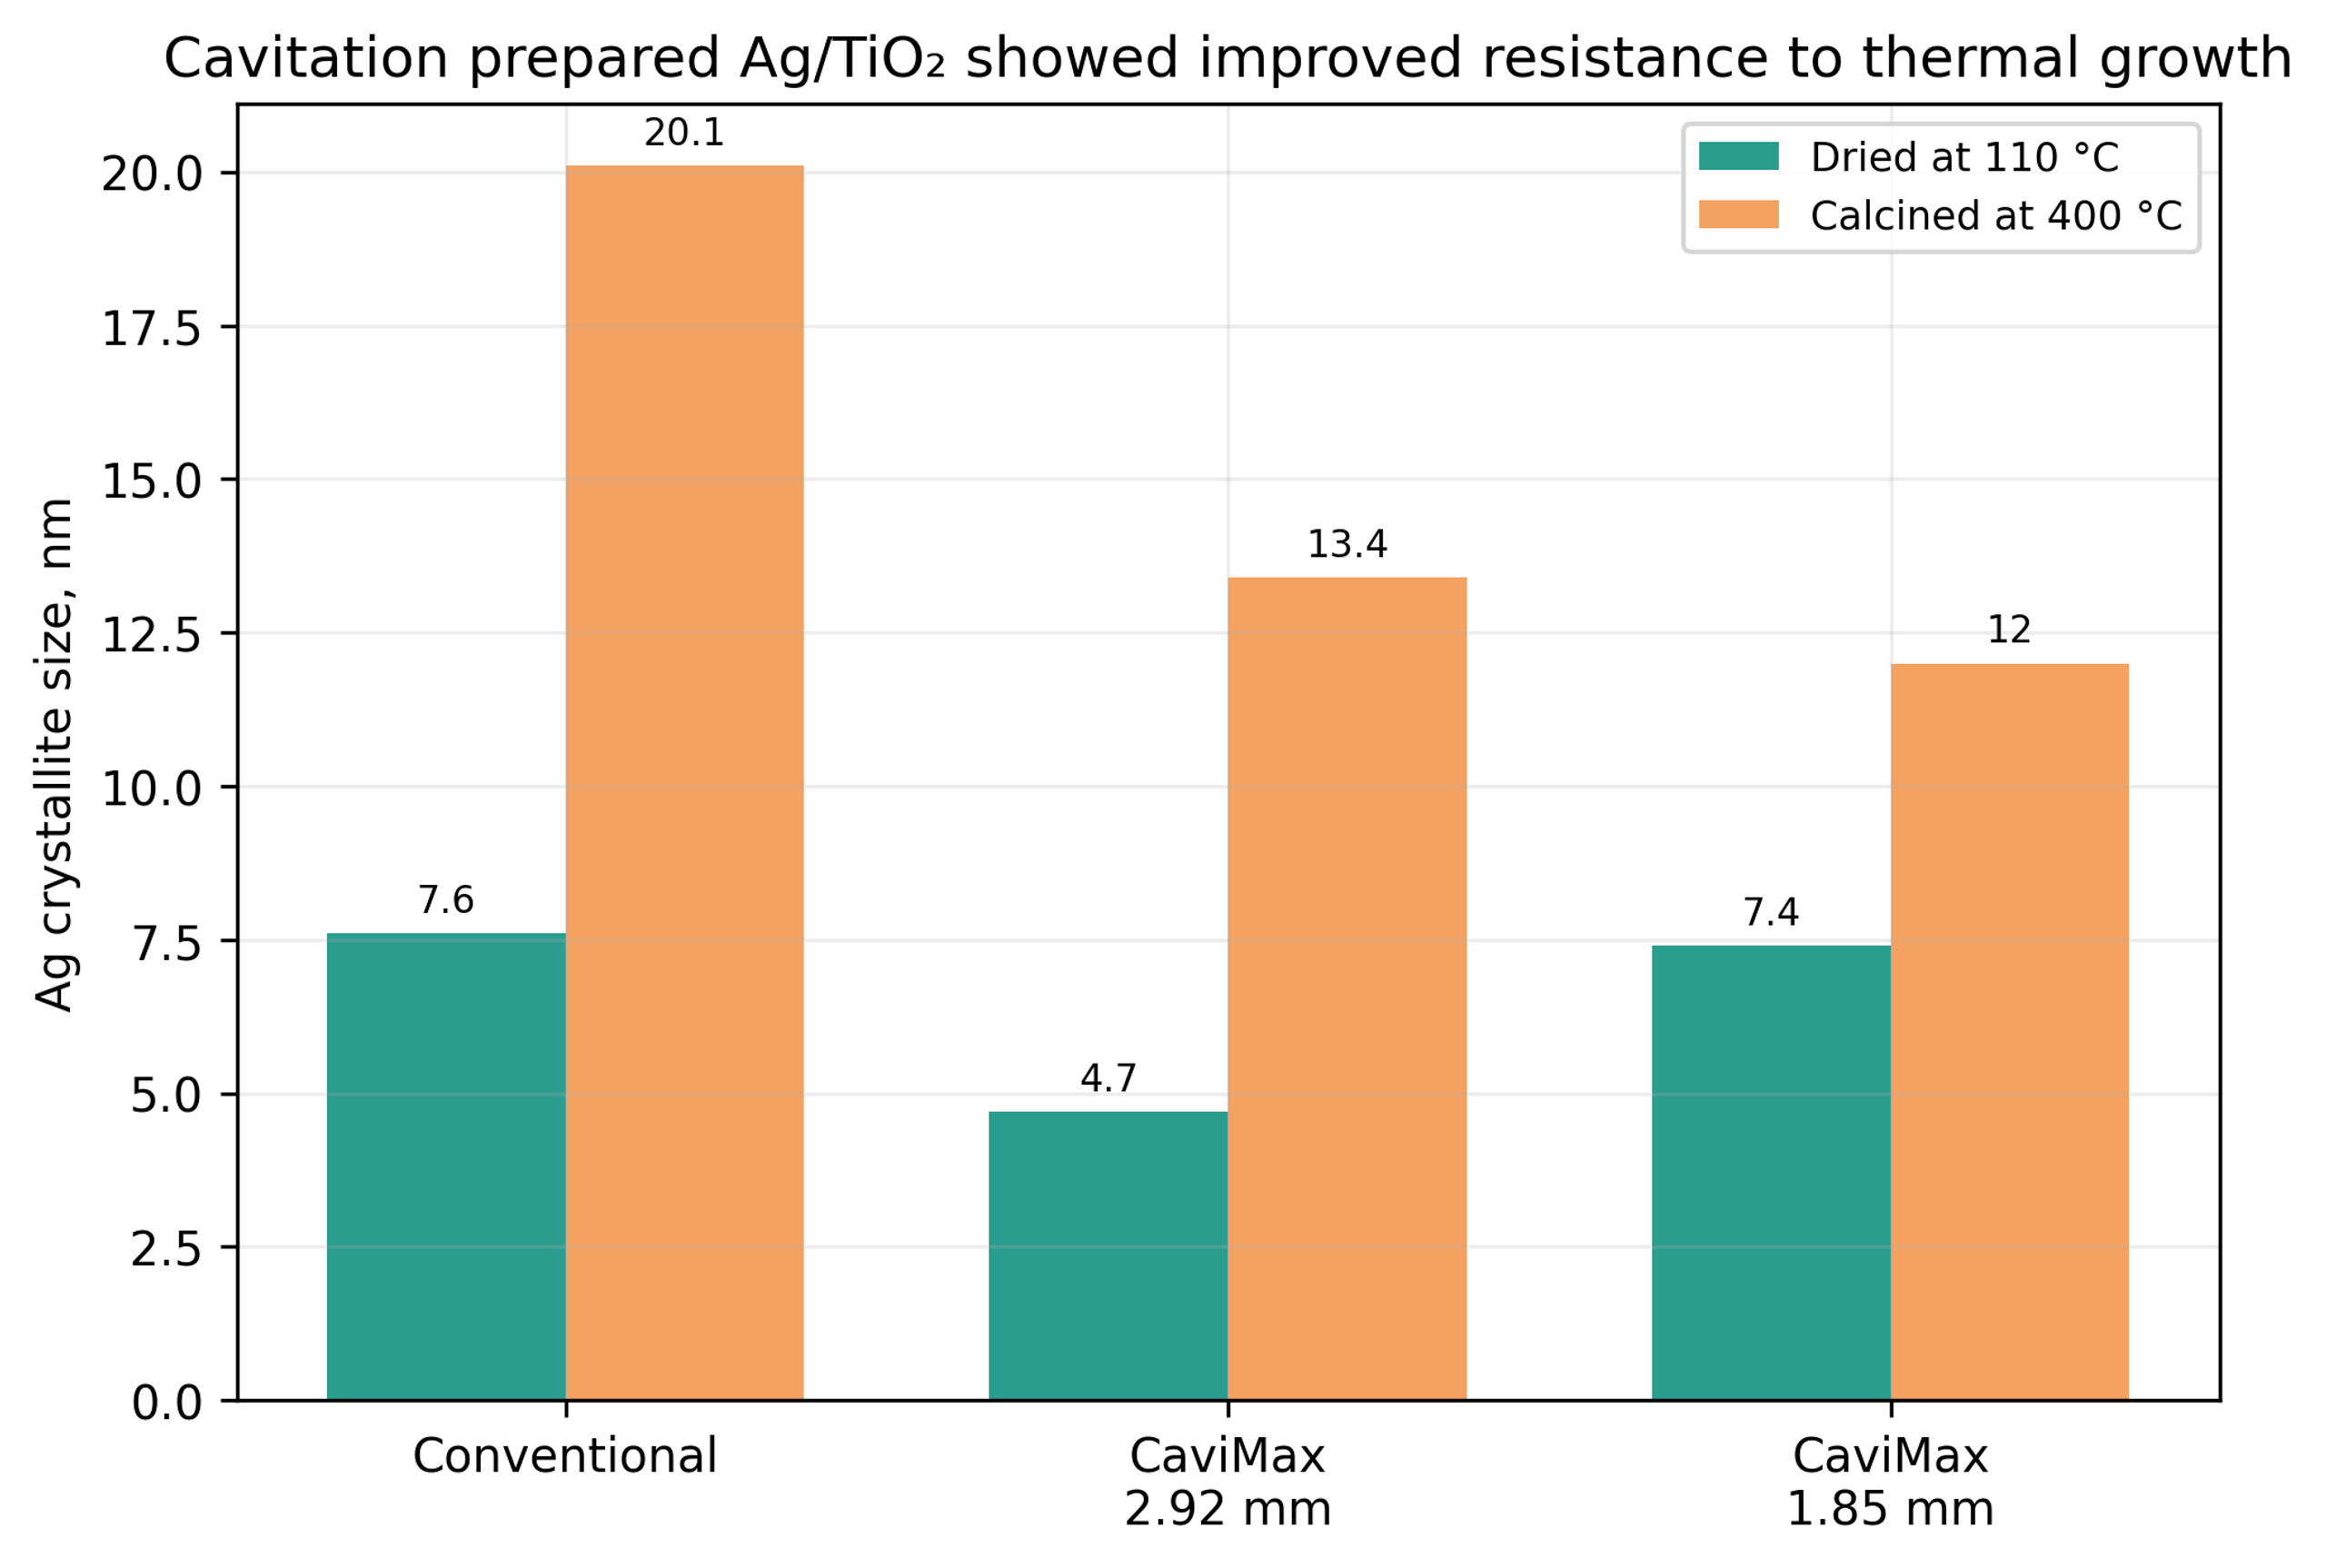
Figure 6.7. Silver crystallite size on titania before and after 400 degree Celsius calcination. [1-3].
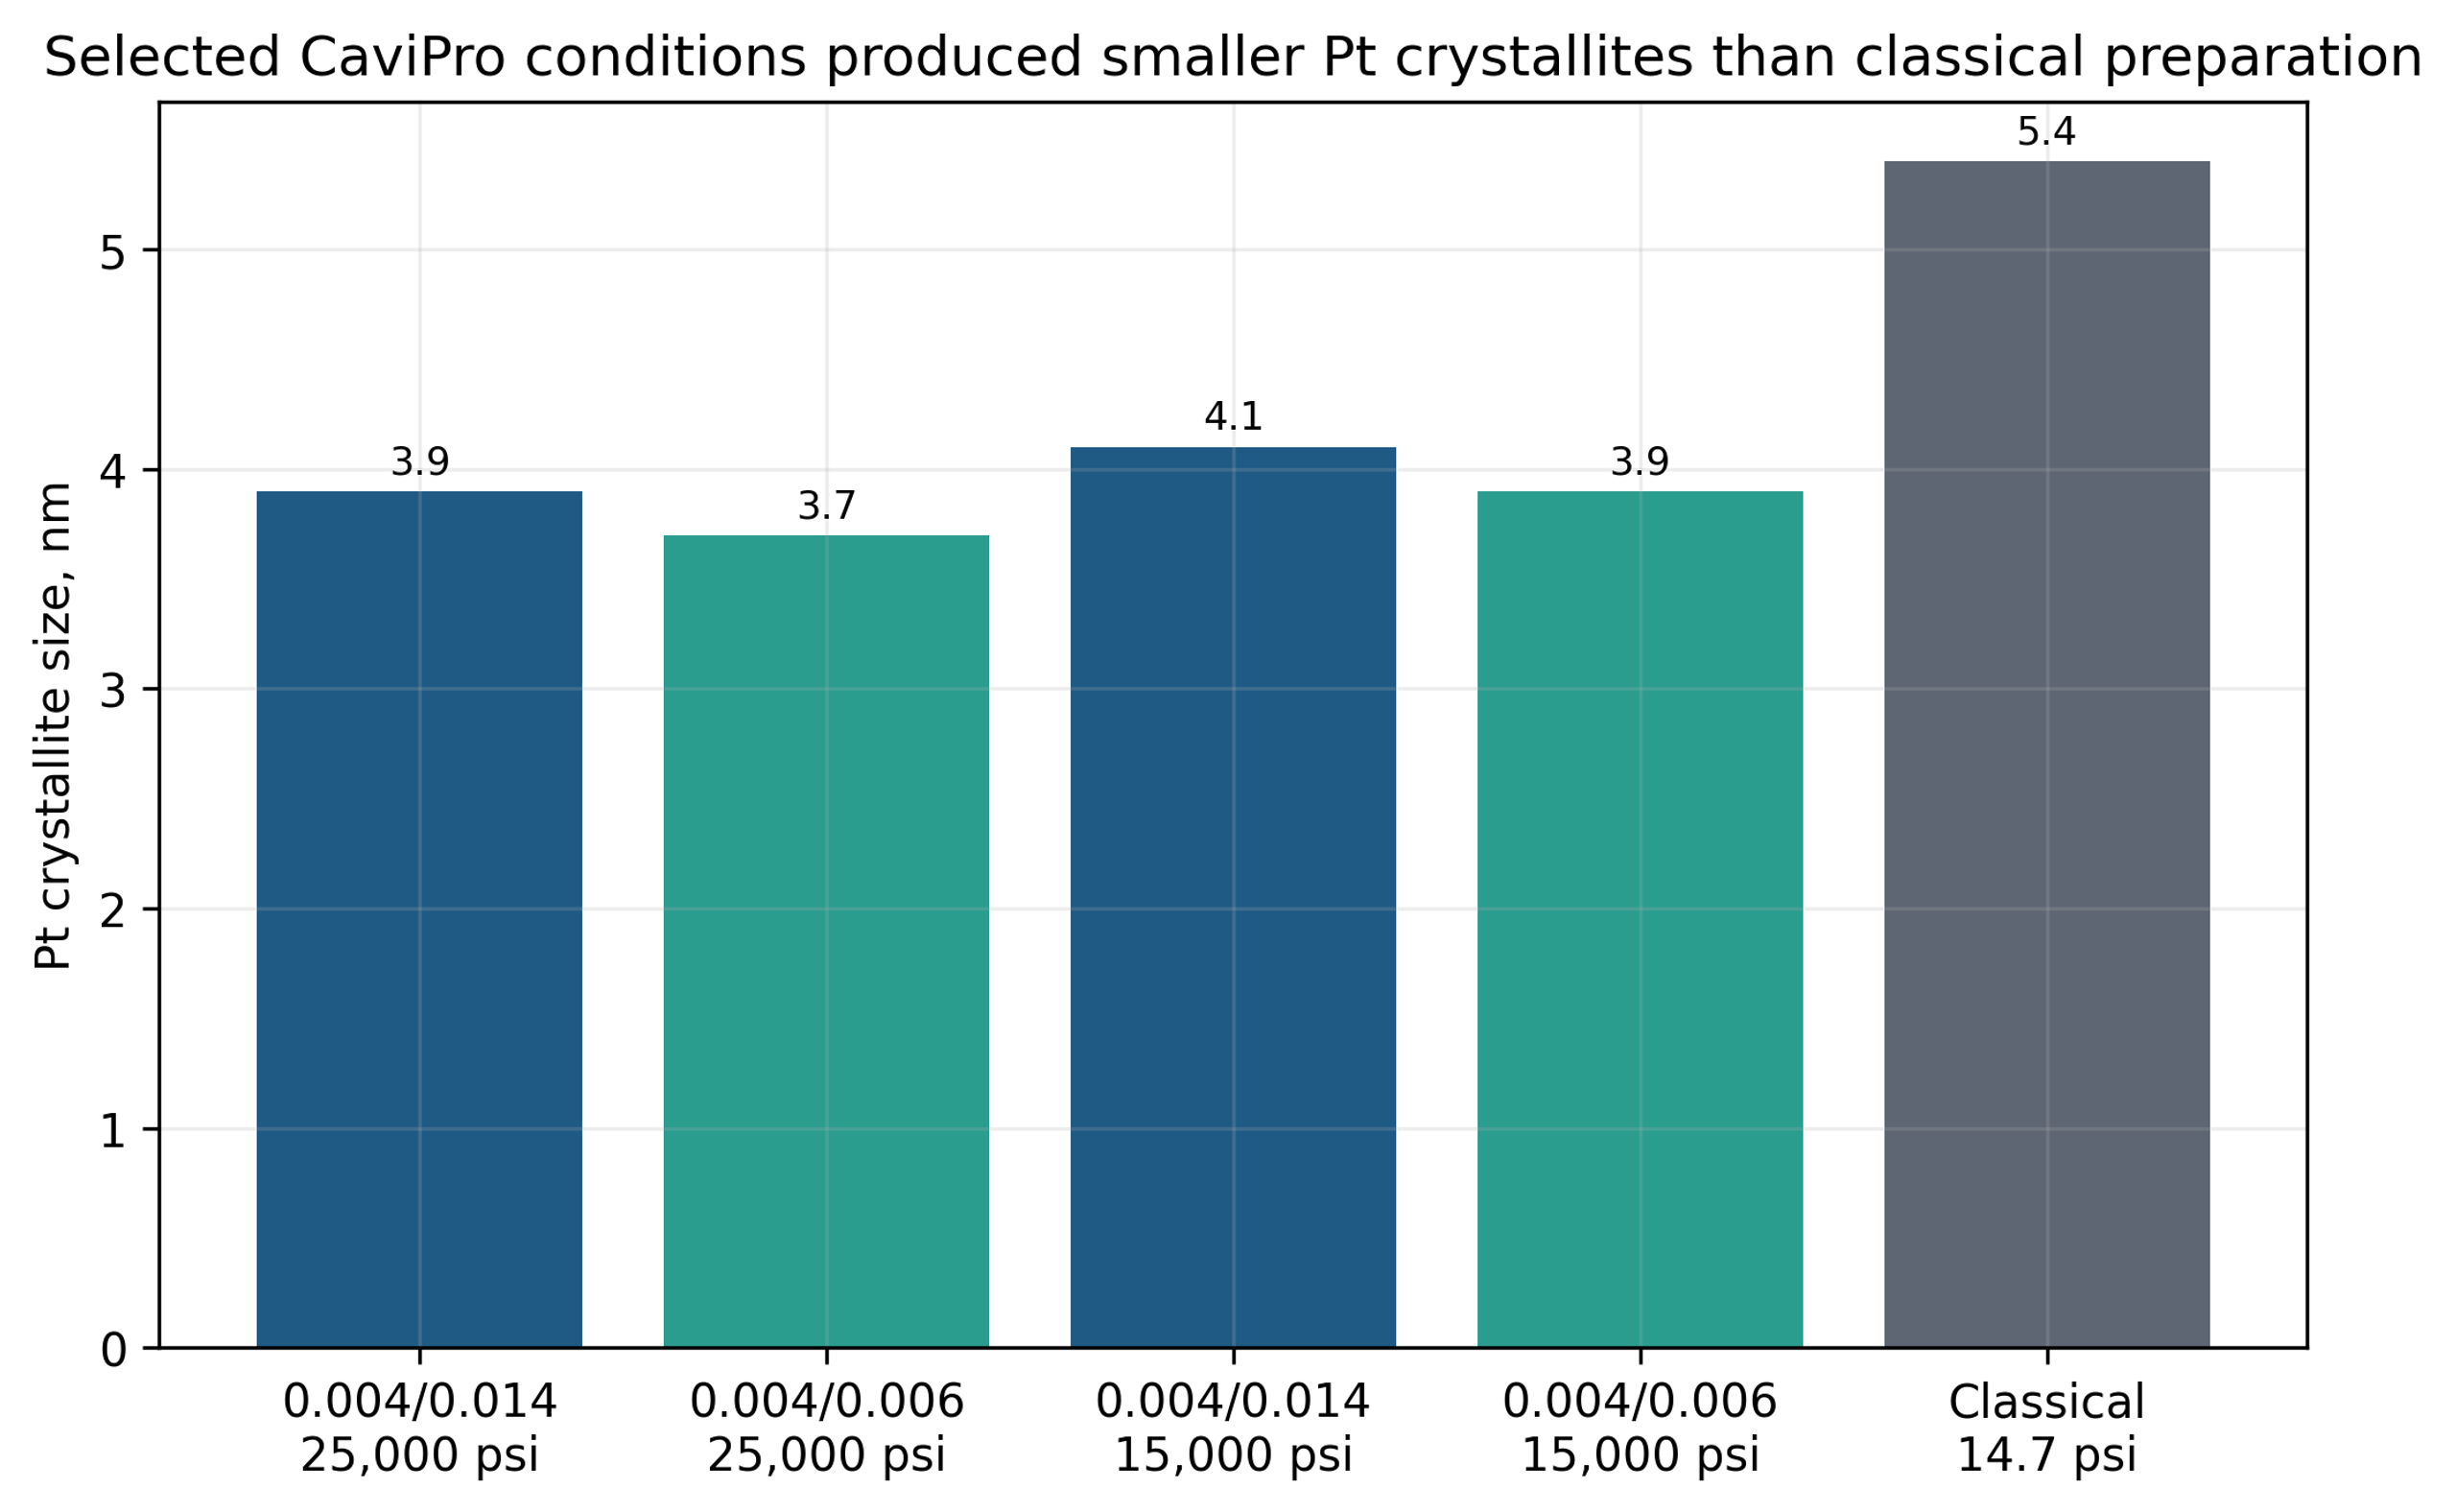
Figure 6.8. Platinum crystallite size for selected CaviPro pressure and restriction conditions compared with conventional preparation. [1-3].
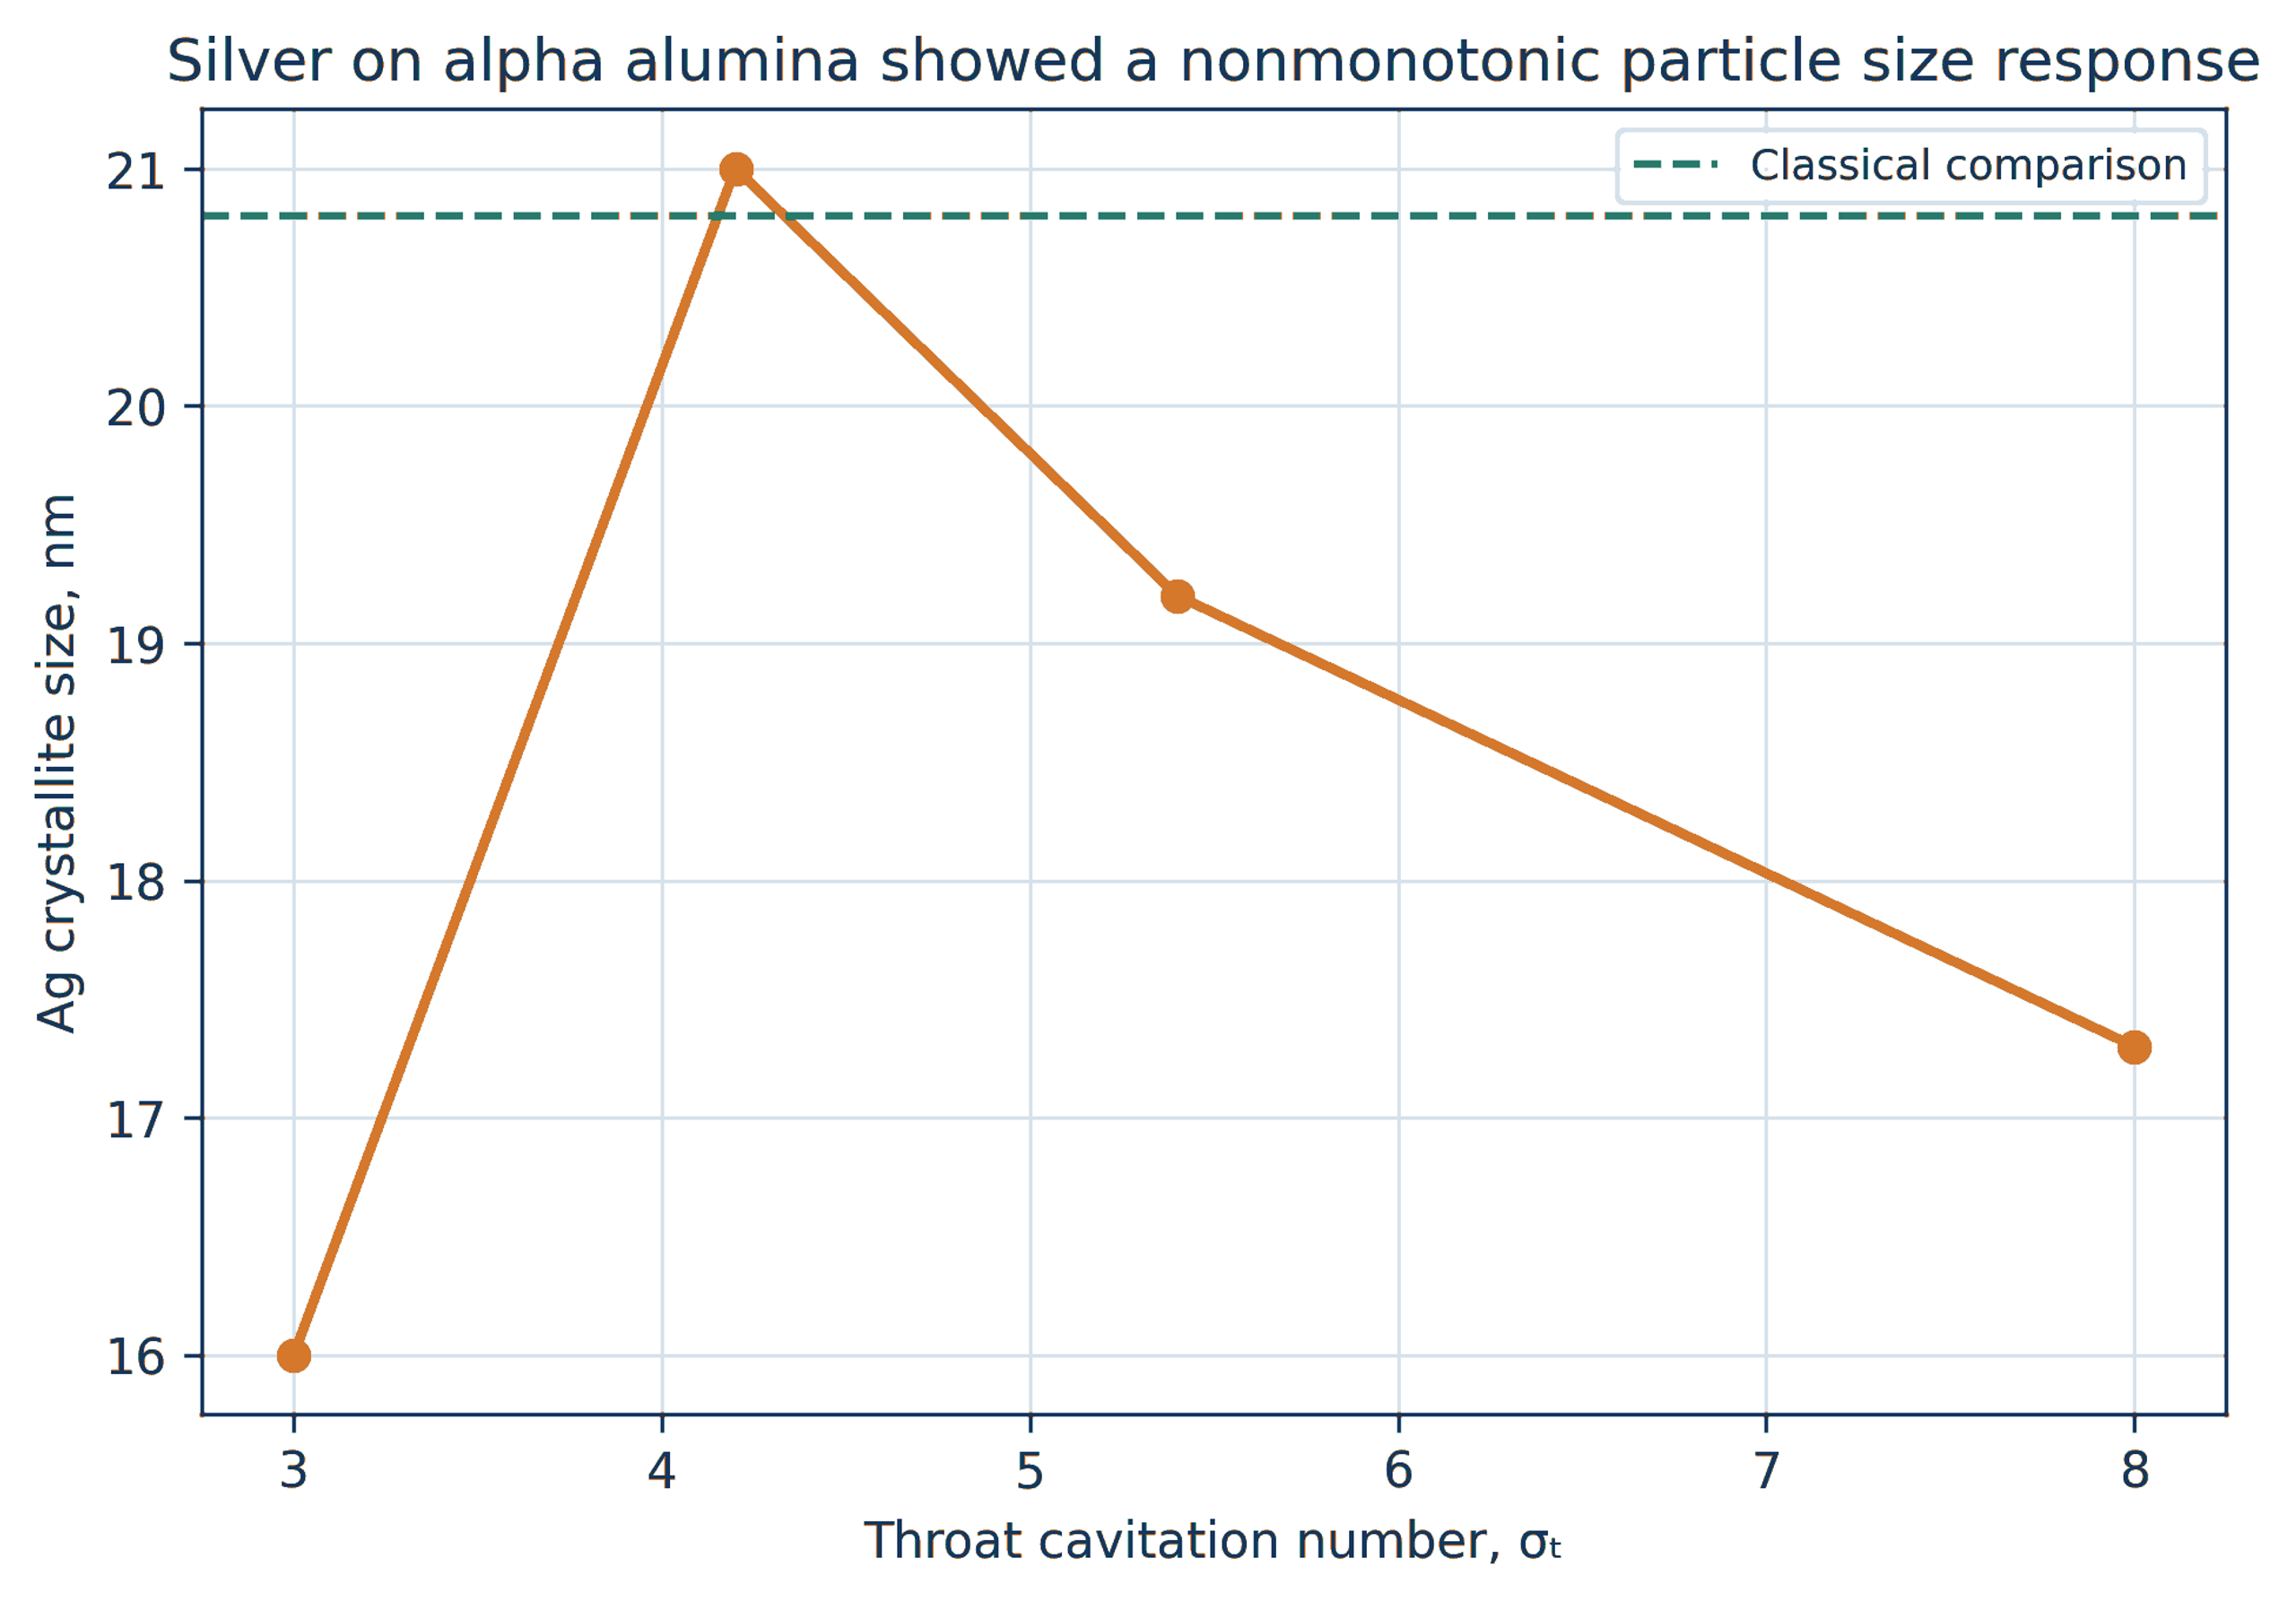
Figure 6.9. Silver crystallite size on alpha alumina as a function of throat cavitation number. The response is nonmonotonic. [1-3].
6.6 Bismuth Molybdate, Titania, and Defect Probes
Beta bismuth molybdate was reported as phase pure for several CaviMax restrictions, while crystallite size varied from approximately 11-28 nm. The smallest value occurred at the largest restriction in that series, again demonstrating that restriction diameter is a proxy for a coupled pressure and residence state rather than a universal monotonic control.
Titania and lead zirconate titanate are useful mechanistic probes because crystallite size and strain can be quantified over several reflections. Patent data for titania showed microstrain increasing from approximately 0.23% to 0.43% across the tested CaviMax restriction range. Lead zirconate titanate showed adjustable strain with a comparatively stable crystallite size near 20 nm. These observations support the possibility that CFC modifies defect retention independently of mean size [1-7].
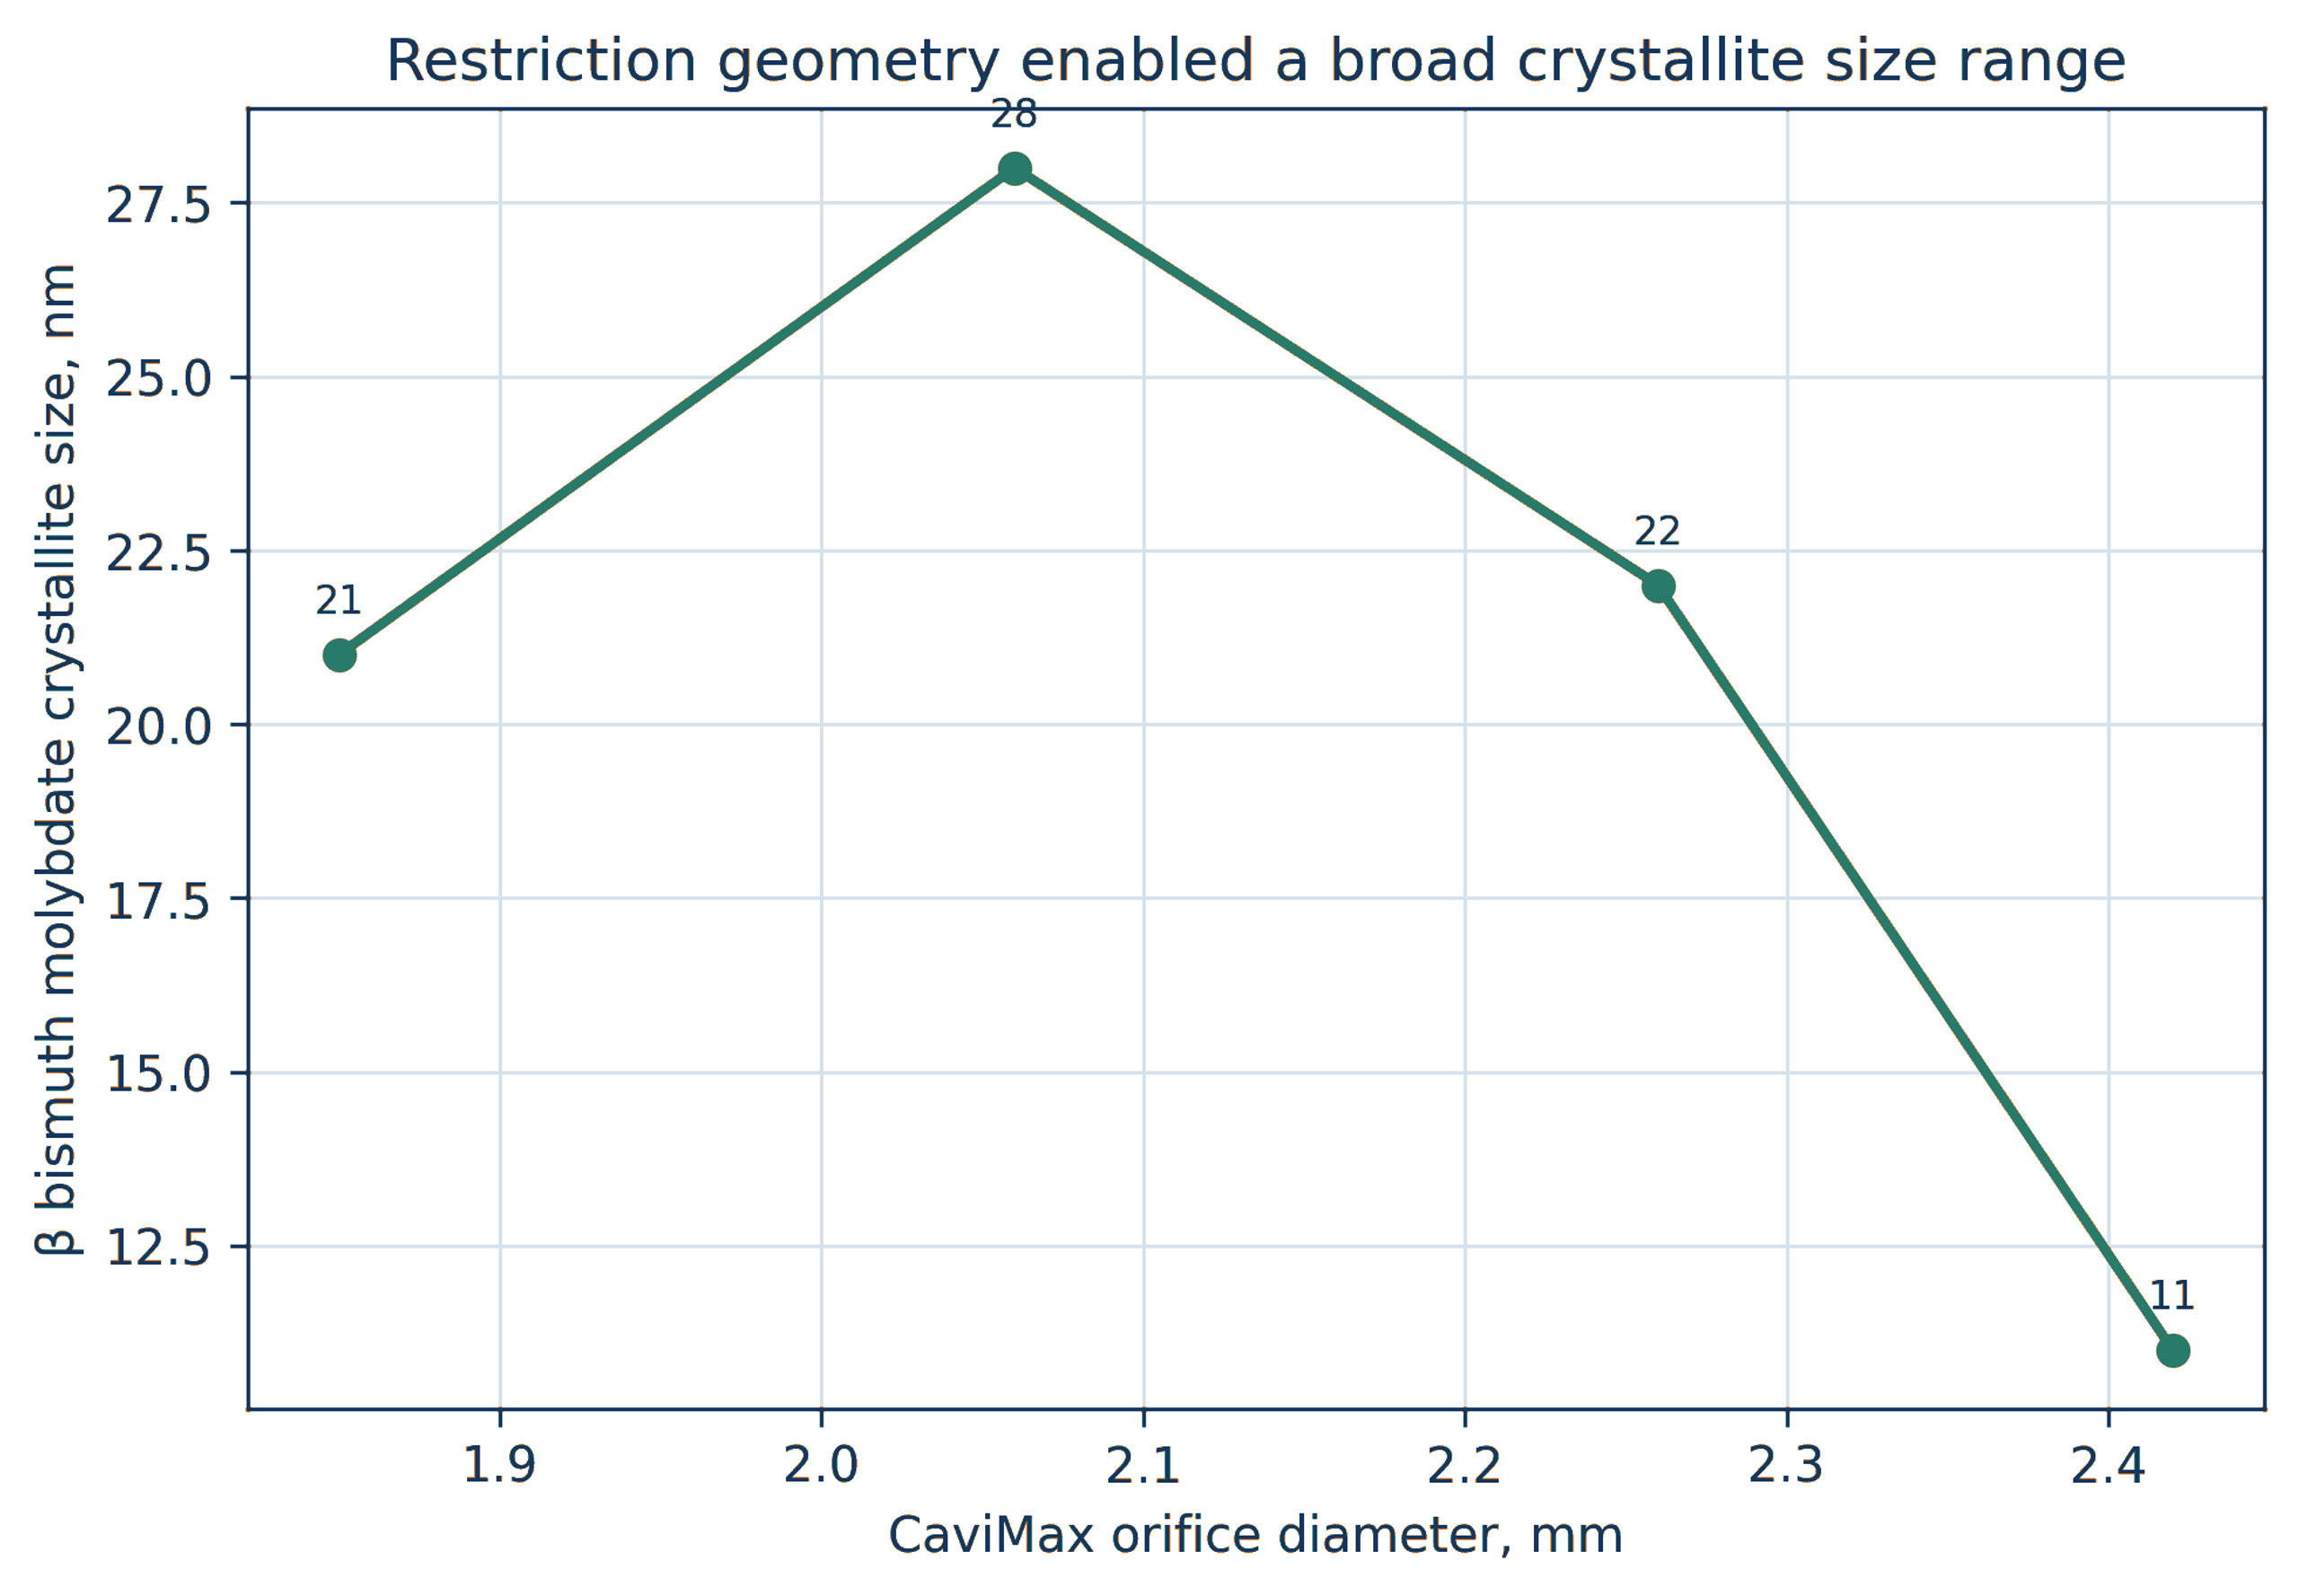
Figure 6.10. Beta bismuth molybdate crystallite size as a function of CaviMax restriction diameter. [1-3].
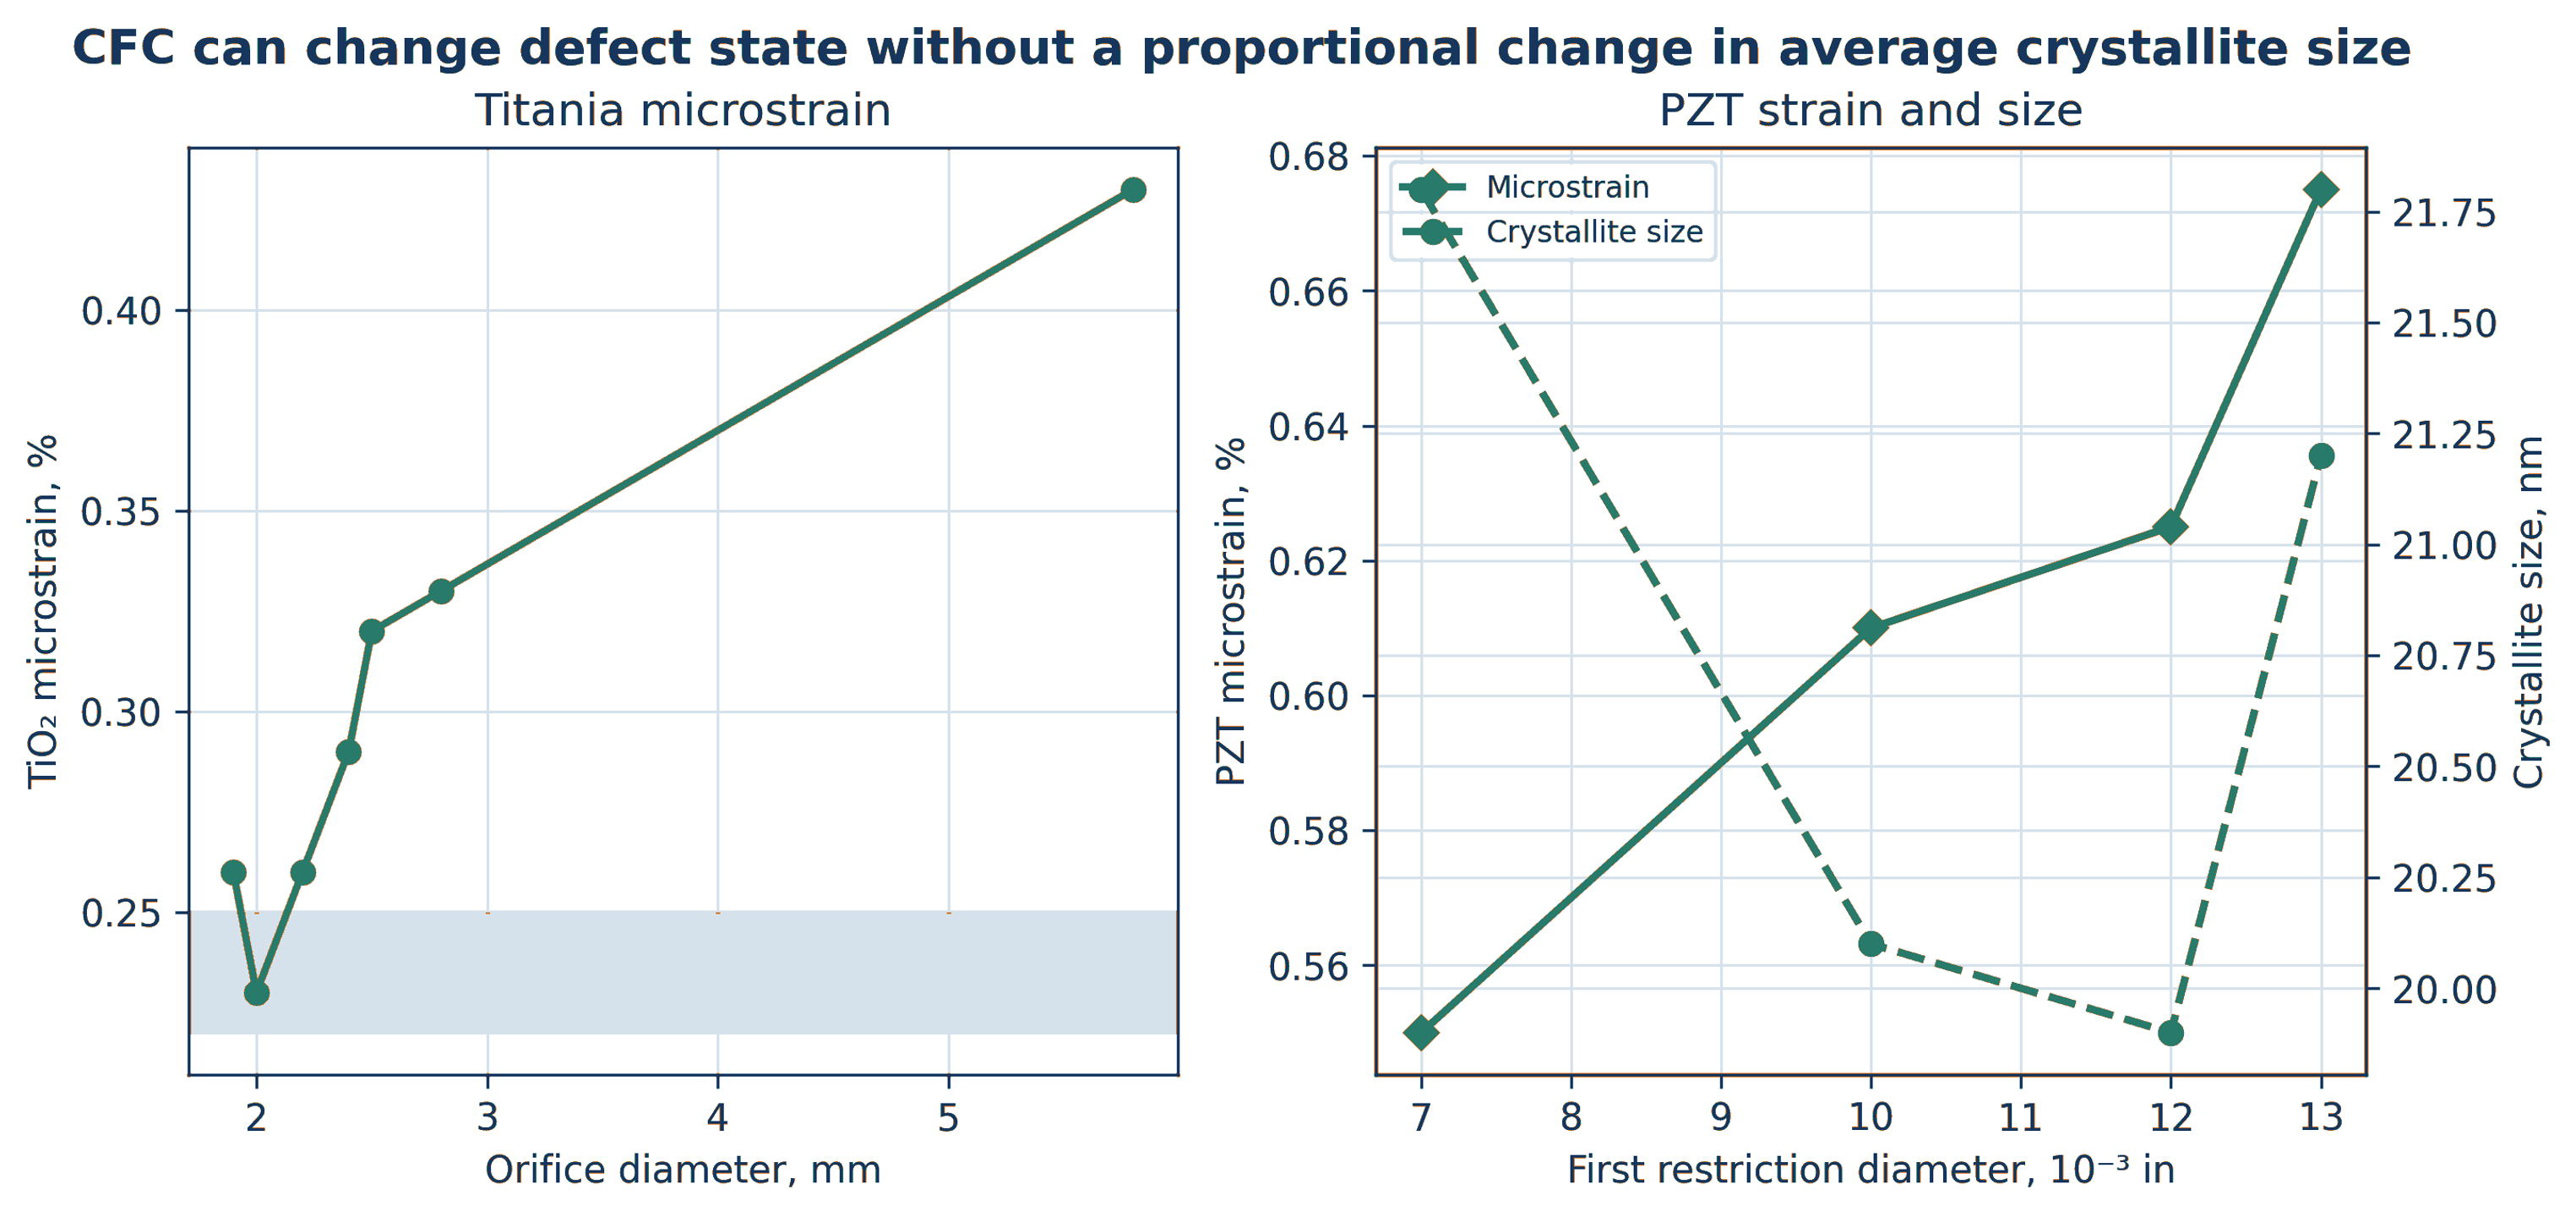
Figure 6.11. Microstrain and crystallite size responses for titania and lead zirconate titanate used as defect sensitive probes. [1-7].
Table 6.1. Representative cavitation catalyst and precursor outcomes
| Material system | Reported structural response | Likely controlling factors | Required catalytic follow up |
|---|---|---|---|
| LaSrFe perovskite | Higher phase purity and about 16–18 nm crystallites | Coprecipitation uniformity and calcination history | Oxygen transport, redox cycling, activity, and durability |
| CuZnAl oxide | CuO size and strain adjustable over processor settings | Chemistry, restriction pair, pressure, and lattice interaction | Reduced copper area, interface, methanol productivity, and deactivation |
| CoMoO₄ on alumina or silica | More CoMoO₄, less separate MoO₃, smaller crystallites | Cation mixing, support interaction, and recovery pressure | Sulfided active phase, HDS activity, and stability |
| Gold on titania | Single digit crystallites in selected high pressure chemistry | Precursor concentration, reduction, sodium chemistry, pressure | CO oxidation normalized to gold dispersion and sodium content |
| Silver and platinum on oxides | Smaller crystallites and improved thermal resistance in selected runs | Reduction, support chemistry, drying, calcination | Oxidation activity, selectivity, and regeneration stability |
| Titania and PZT probes | Adjustable microstrain with limited size change | Pressure, restriction, bubble population, defect retention | Defect specific surface reactivity and thermal relaxation |
7 Later Hydrodynamic Cavitation Demonstrations
Later studies broaden the evidence base beyond the original CFC equipment. These systems should not be treated as identical reactor platforms, but they demonstrate that restriction geometry, gas-liquid contact, solids loading, and multivariable optimization can control particle formation in larger and lower pressure loops [8-14].
7.1 Hydrodynamic Cavitation Assisted Nanocalcite
A closed loop orifice reactor was used to carbonate calcium hydroxide slurry with carbon dioxide. Without an orifice, the reported induction period was longer, reaction completion was slower, and average crystallite size was approximately 101 nm. A plate containing five 1 mm holes eliminated the observed induction period under the tested condition and produced an average crystallite size of approximately 37 nm. Single holes of 2 and 3 mm produced approximately 39 and 49 nm, respectively [9].
The study supports three engineering conclusions. First, total open area alone is insufficient to describe performance because a multihole plate changes the number of jets, interfacial renewal, and cloud distribution. Second, a shorter induction period can reflect enhanced gas dissolution, surface renewal, or primary nucleation. Third, pure calcite phase was retained while particle size and distribution changed, demonstrating that hydrodynamics can modify morphology without changing phase identity.
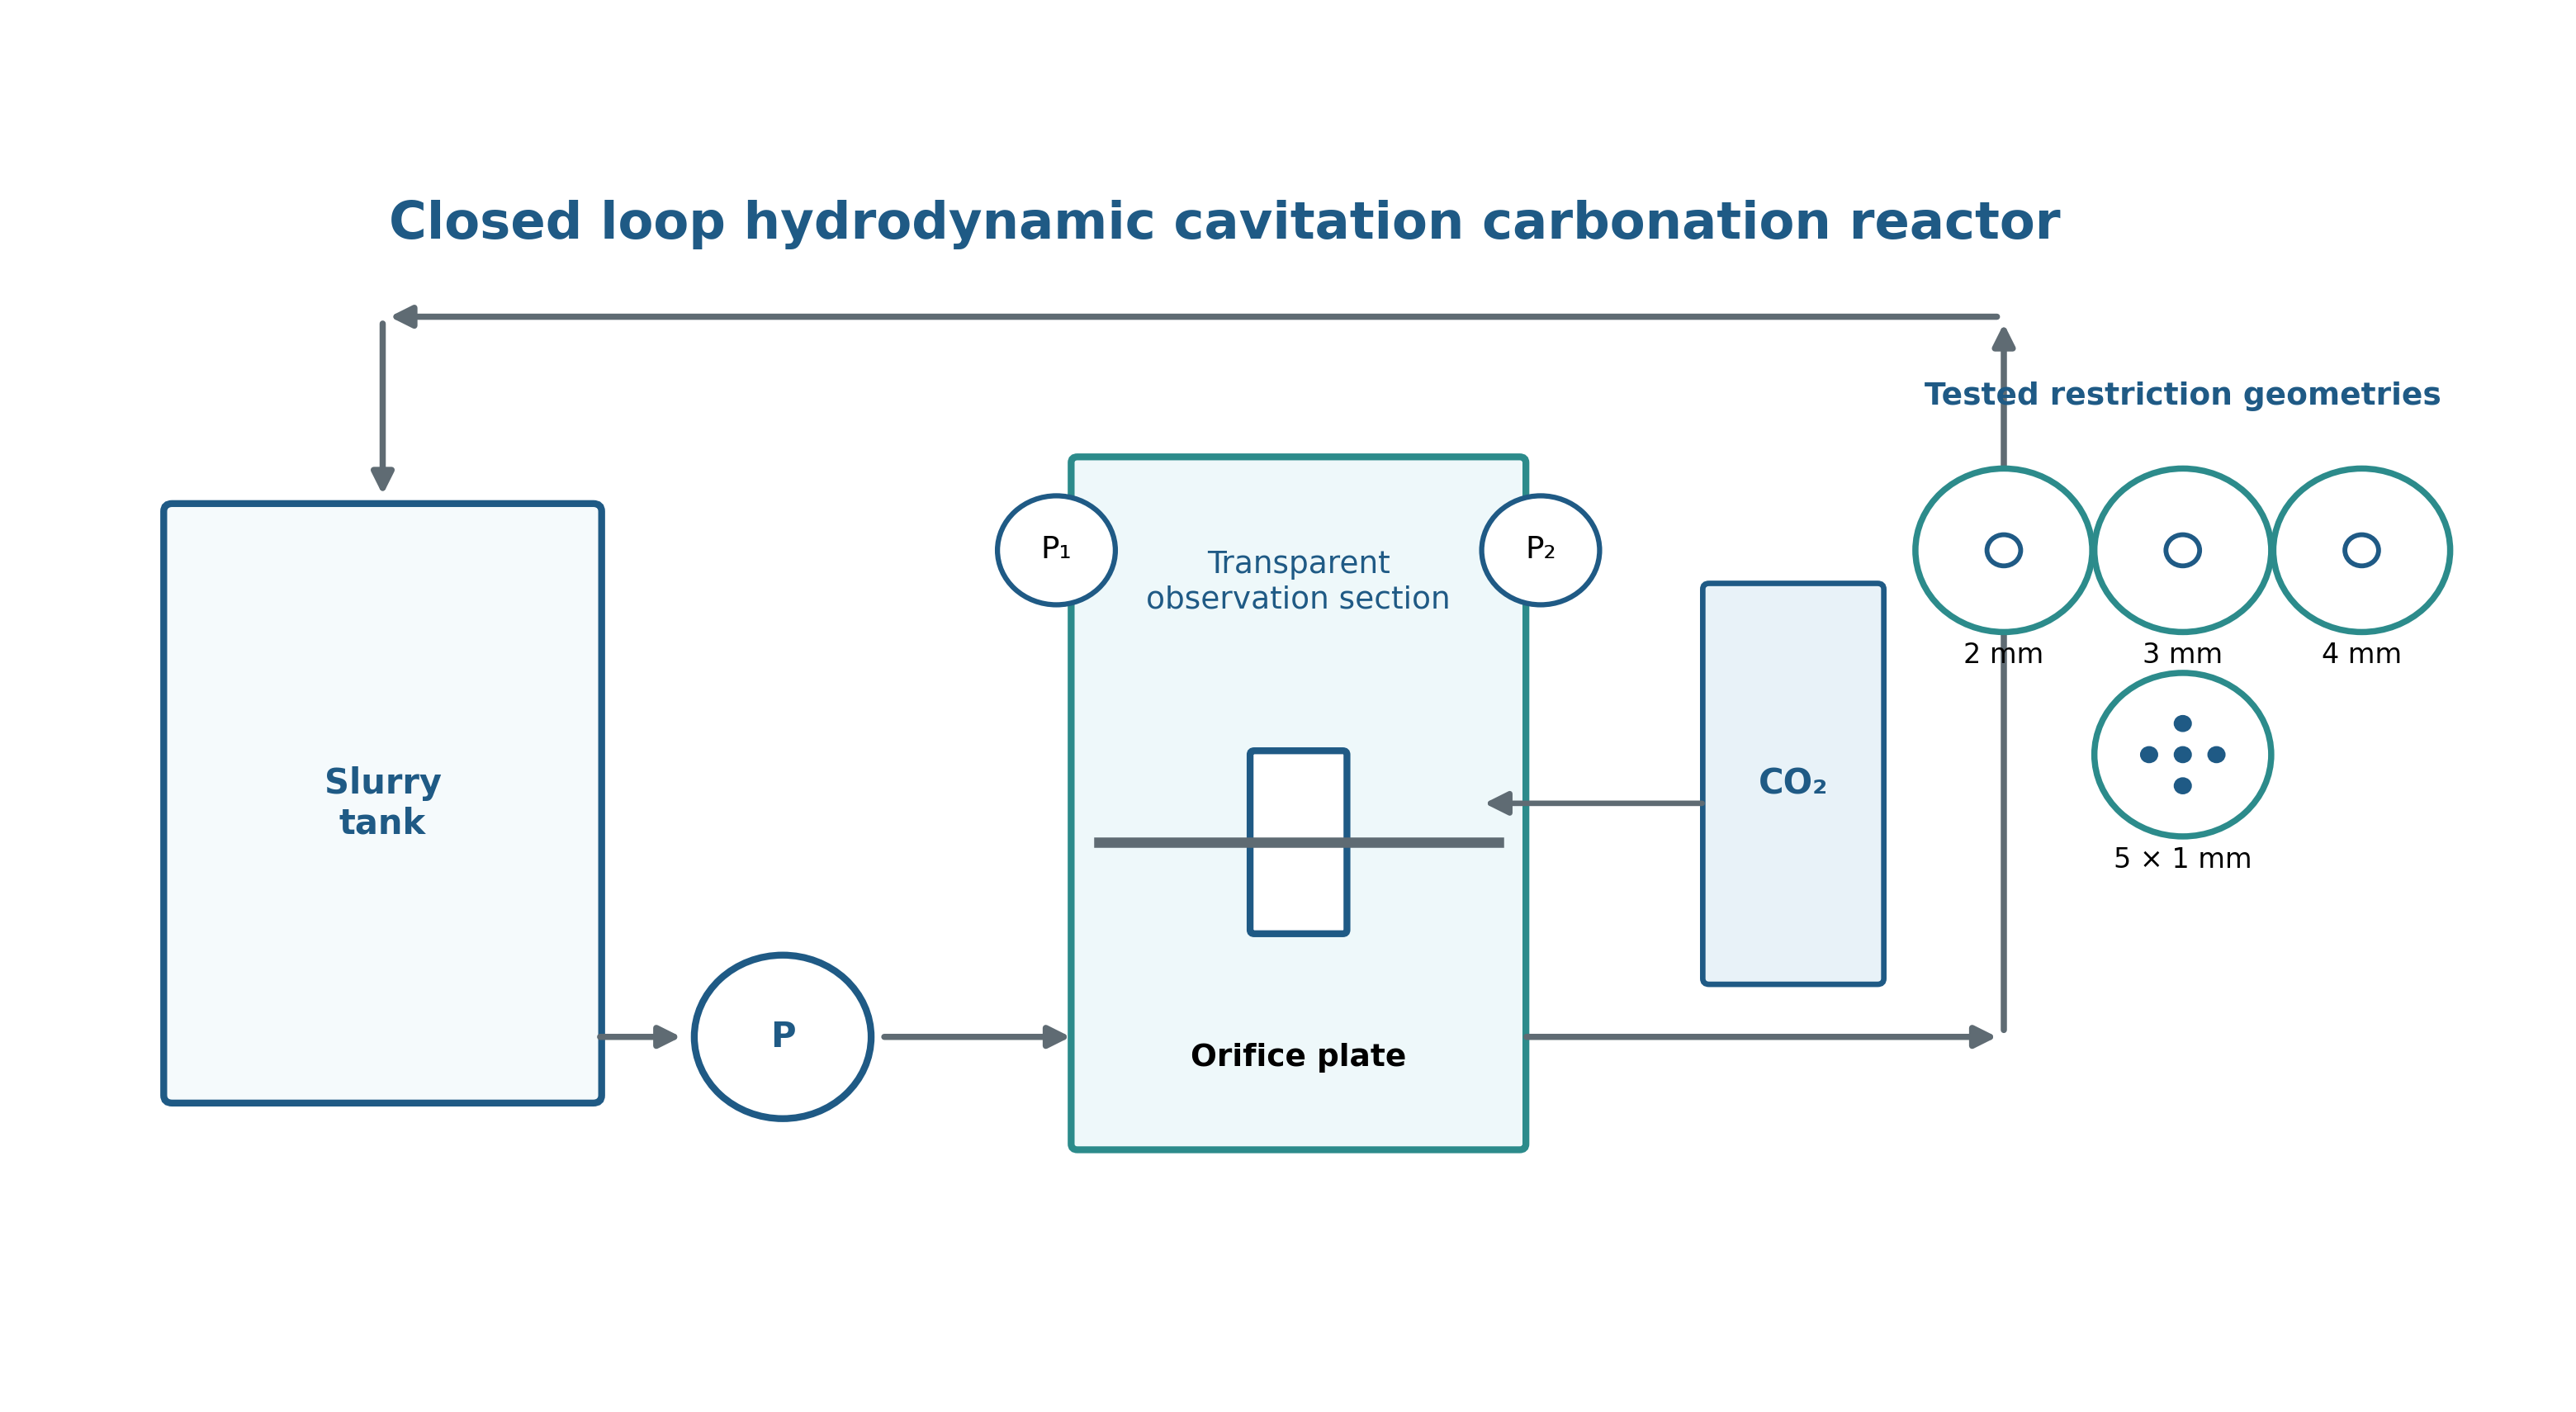
Figure 7.1. Closed loop hydrodynamic cavitation carbonation reactor and tested restriction geometries. [9].
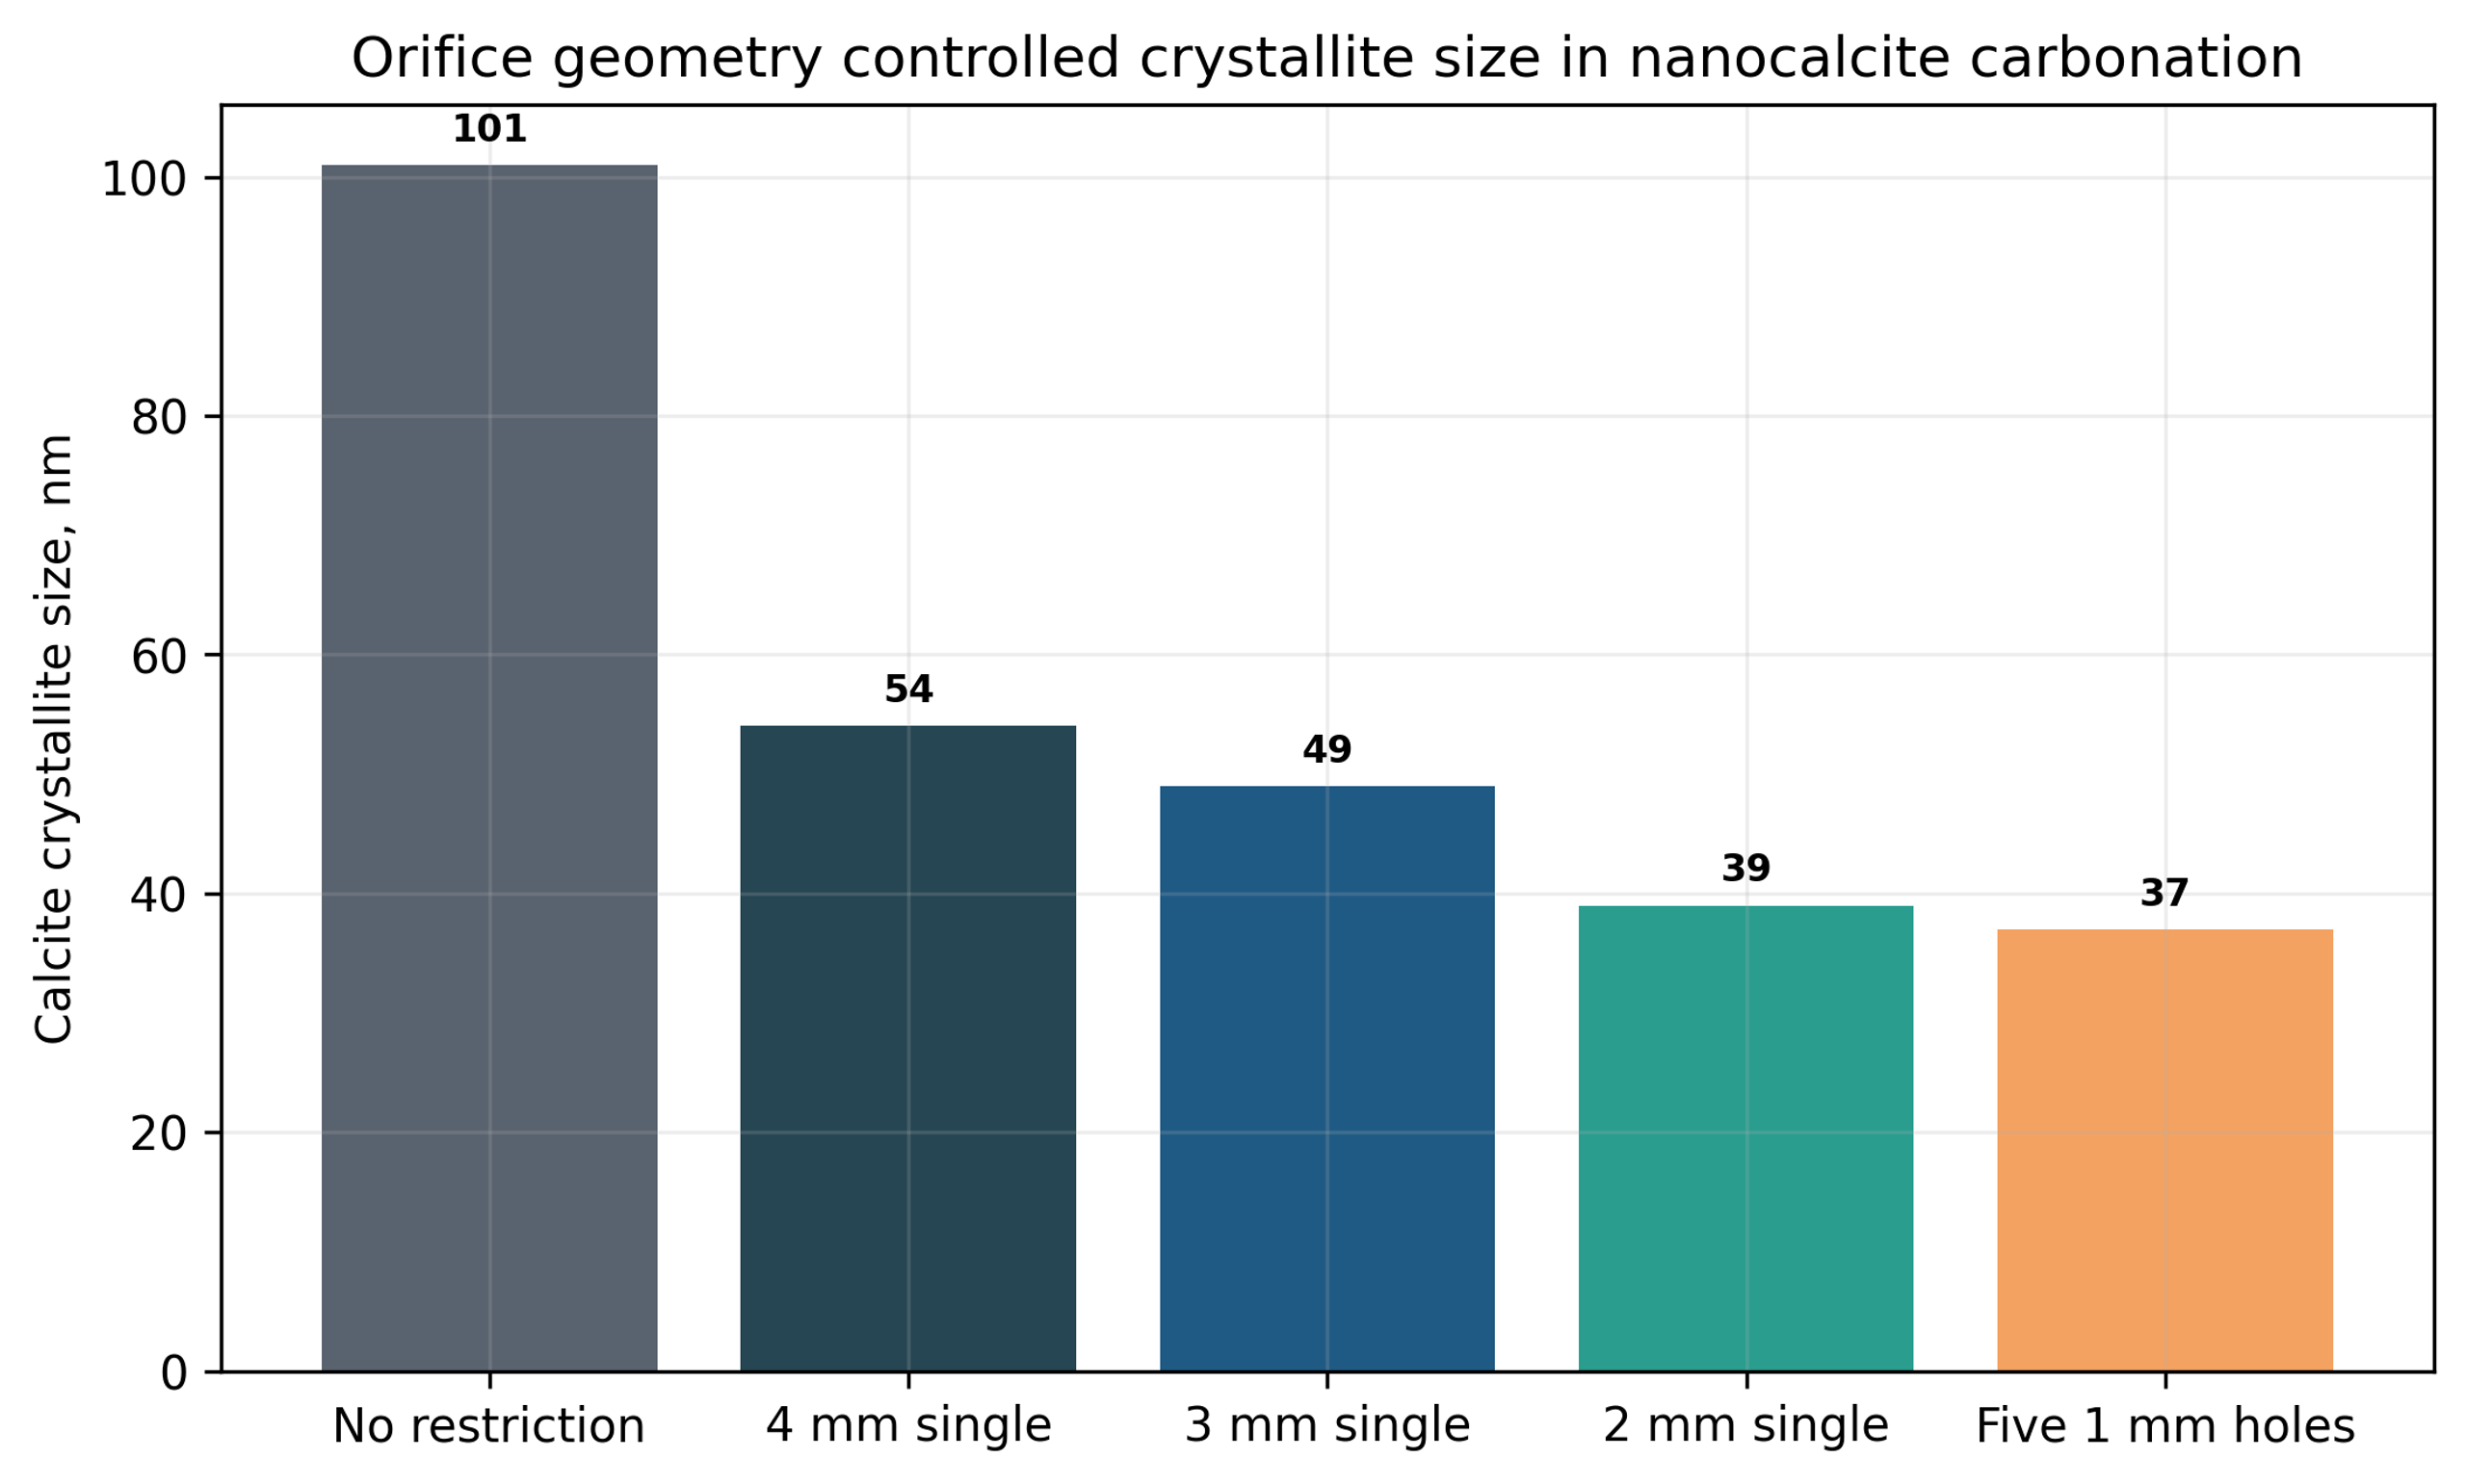
Figure 7.2. Nanocalcite crystallite size without a restriction and with the five hole 1 mm plate. [9].
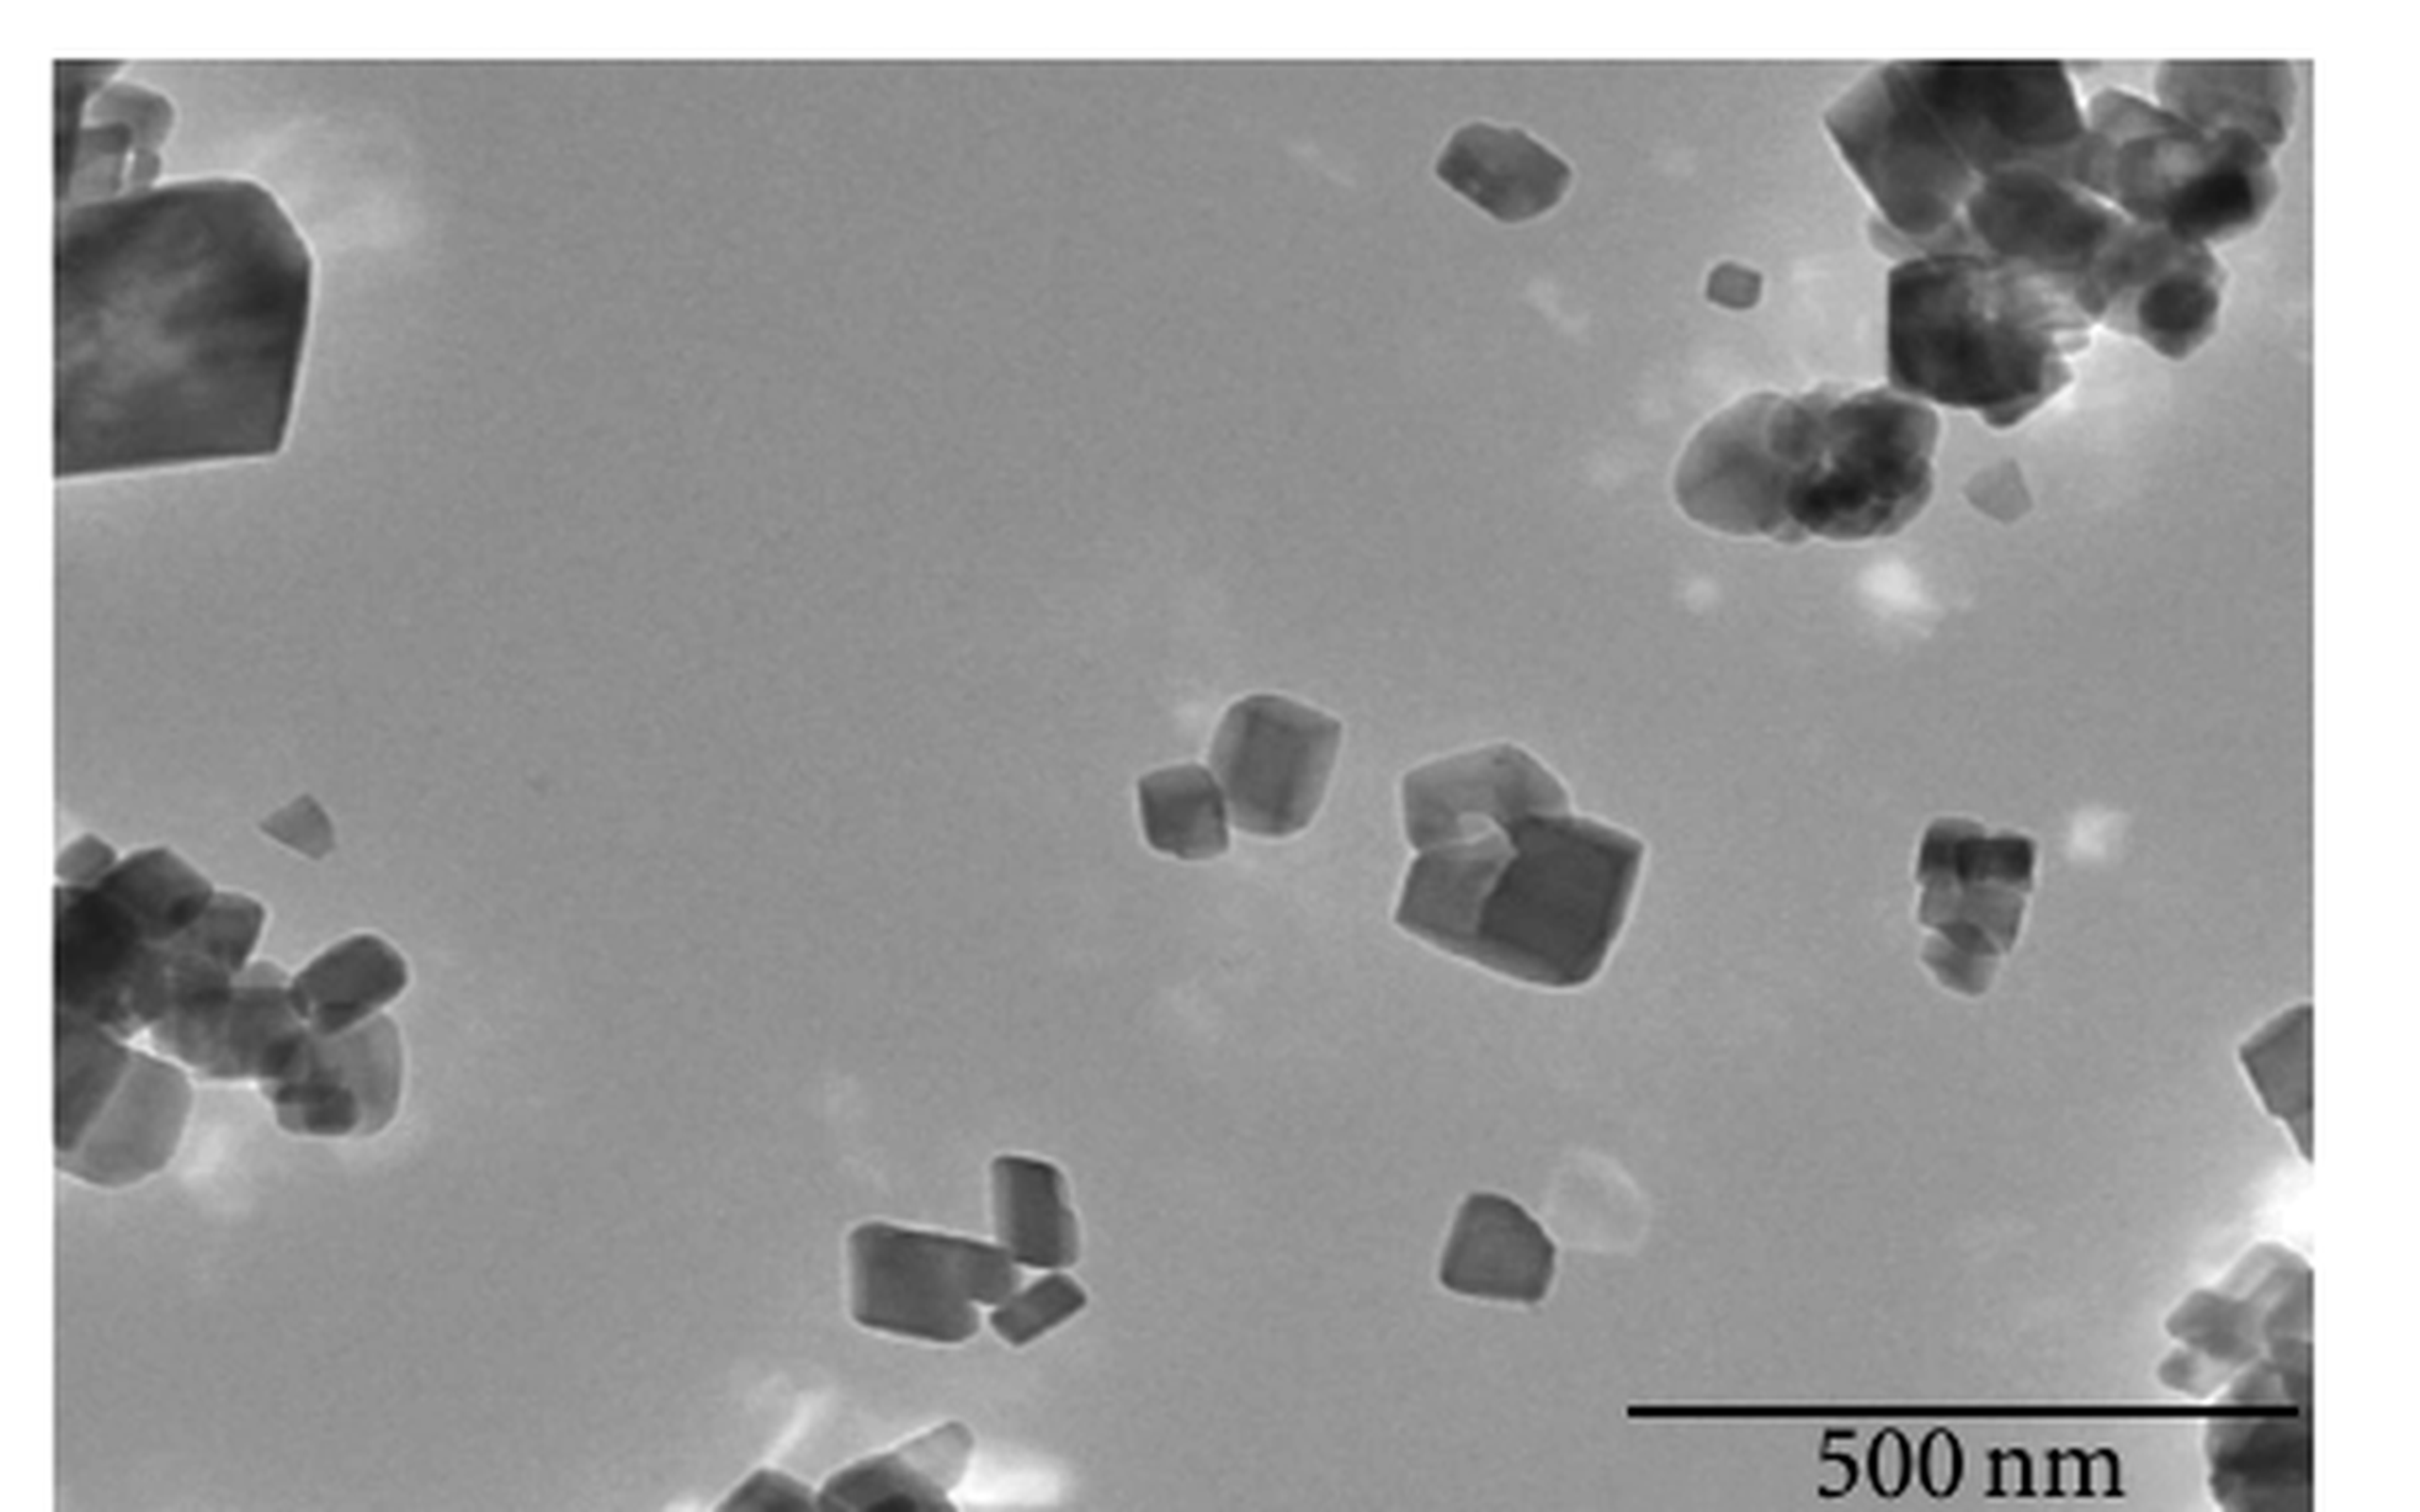
Figure 7.3. Transmission electron micrograph of nanocalcite prepared with hydrodynamic cavitation. [9].
7.2 Hydrodynamic Cavitation Enhanced Nano ZnO Carbonization
Guo et al. used a 40 L jacketed carbonation system with a hydraulic jet reactor to convert ZnO through a basic zinc carbonate intermediate. Optimized conditions included 80 °C, 120 min, a solid-liquid ratio near 5.011:100, calcination at 500 °C for 1 h, a 60° incident angle, a cavitation number near 0.366, and a jet position near 301 mm [10].
The regression model predicted a BET area of 63.190 m² g⁻¹ and a carbonization rate of 94.623%. Seven verification runs gave average values of 62.377 m² g⁻¹ and 93.937%, respectively. Relative to mechanical stirring and bubbling, the study reported approximately 1.5 times the specific surface area, a 10% increase in carbonization rate, and about half the particle size. Scanning electron microscopy showed dispersed sheetlike particles with a characteristic lateral dimension near 500 nm and thickness of approximately 25-35 nm [10].
The study also demonstrates a rigorous process development strategy. Reaction time, temperature, solids loading, calcination temperature, incident angle, cavitation number, and jet position were first screened. Response surface methodology was then used to quantify interactions among the most influential variables. The interaction between solid-liquid ratio and jet position was especially important. This approach is more informative than changing one restriction while holding an incompletely defined process nominally constant.
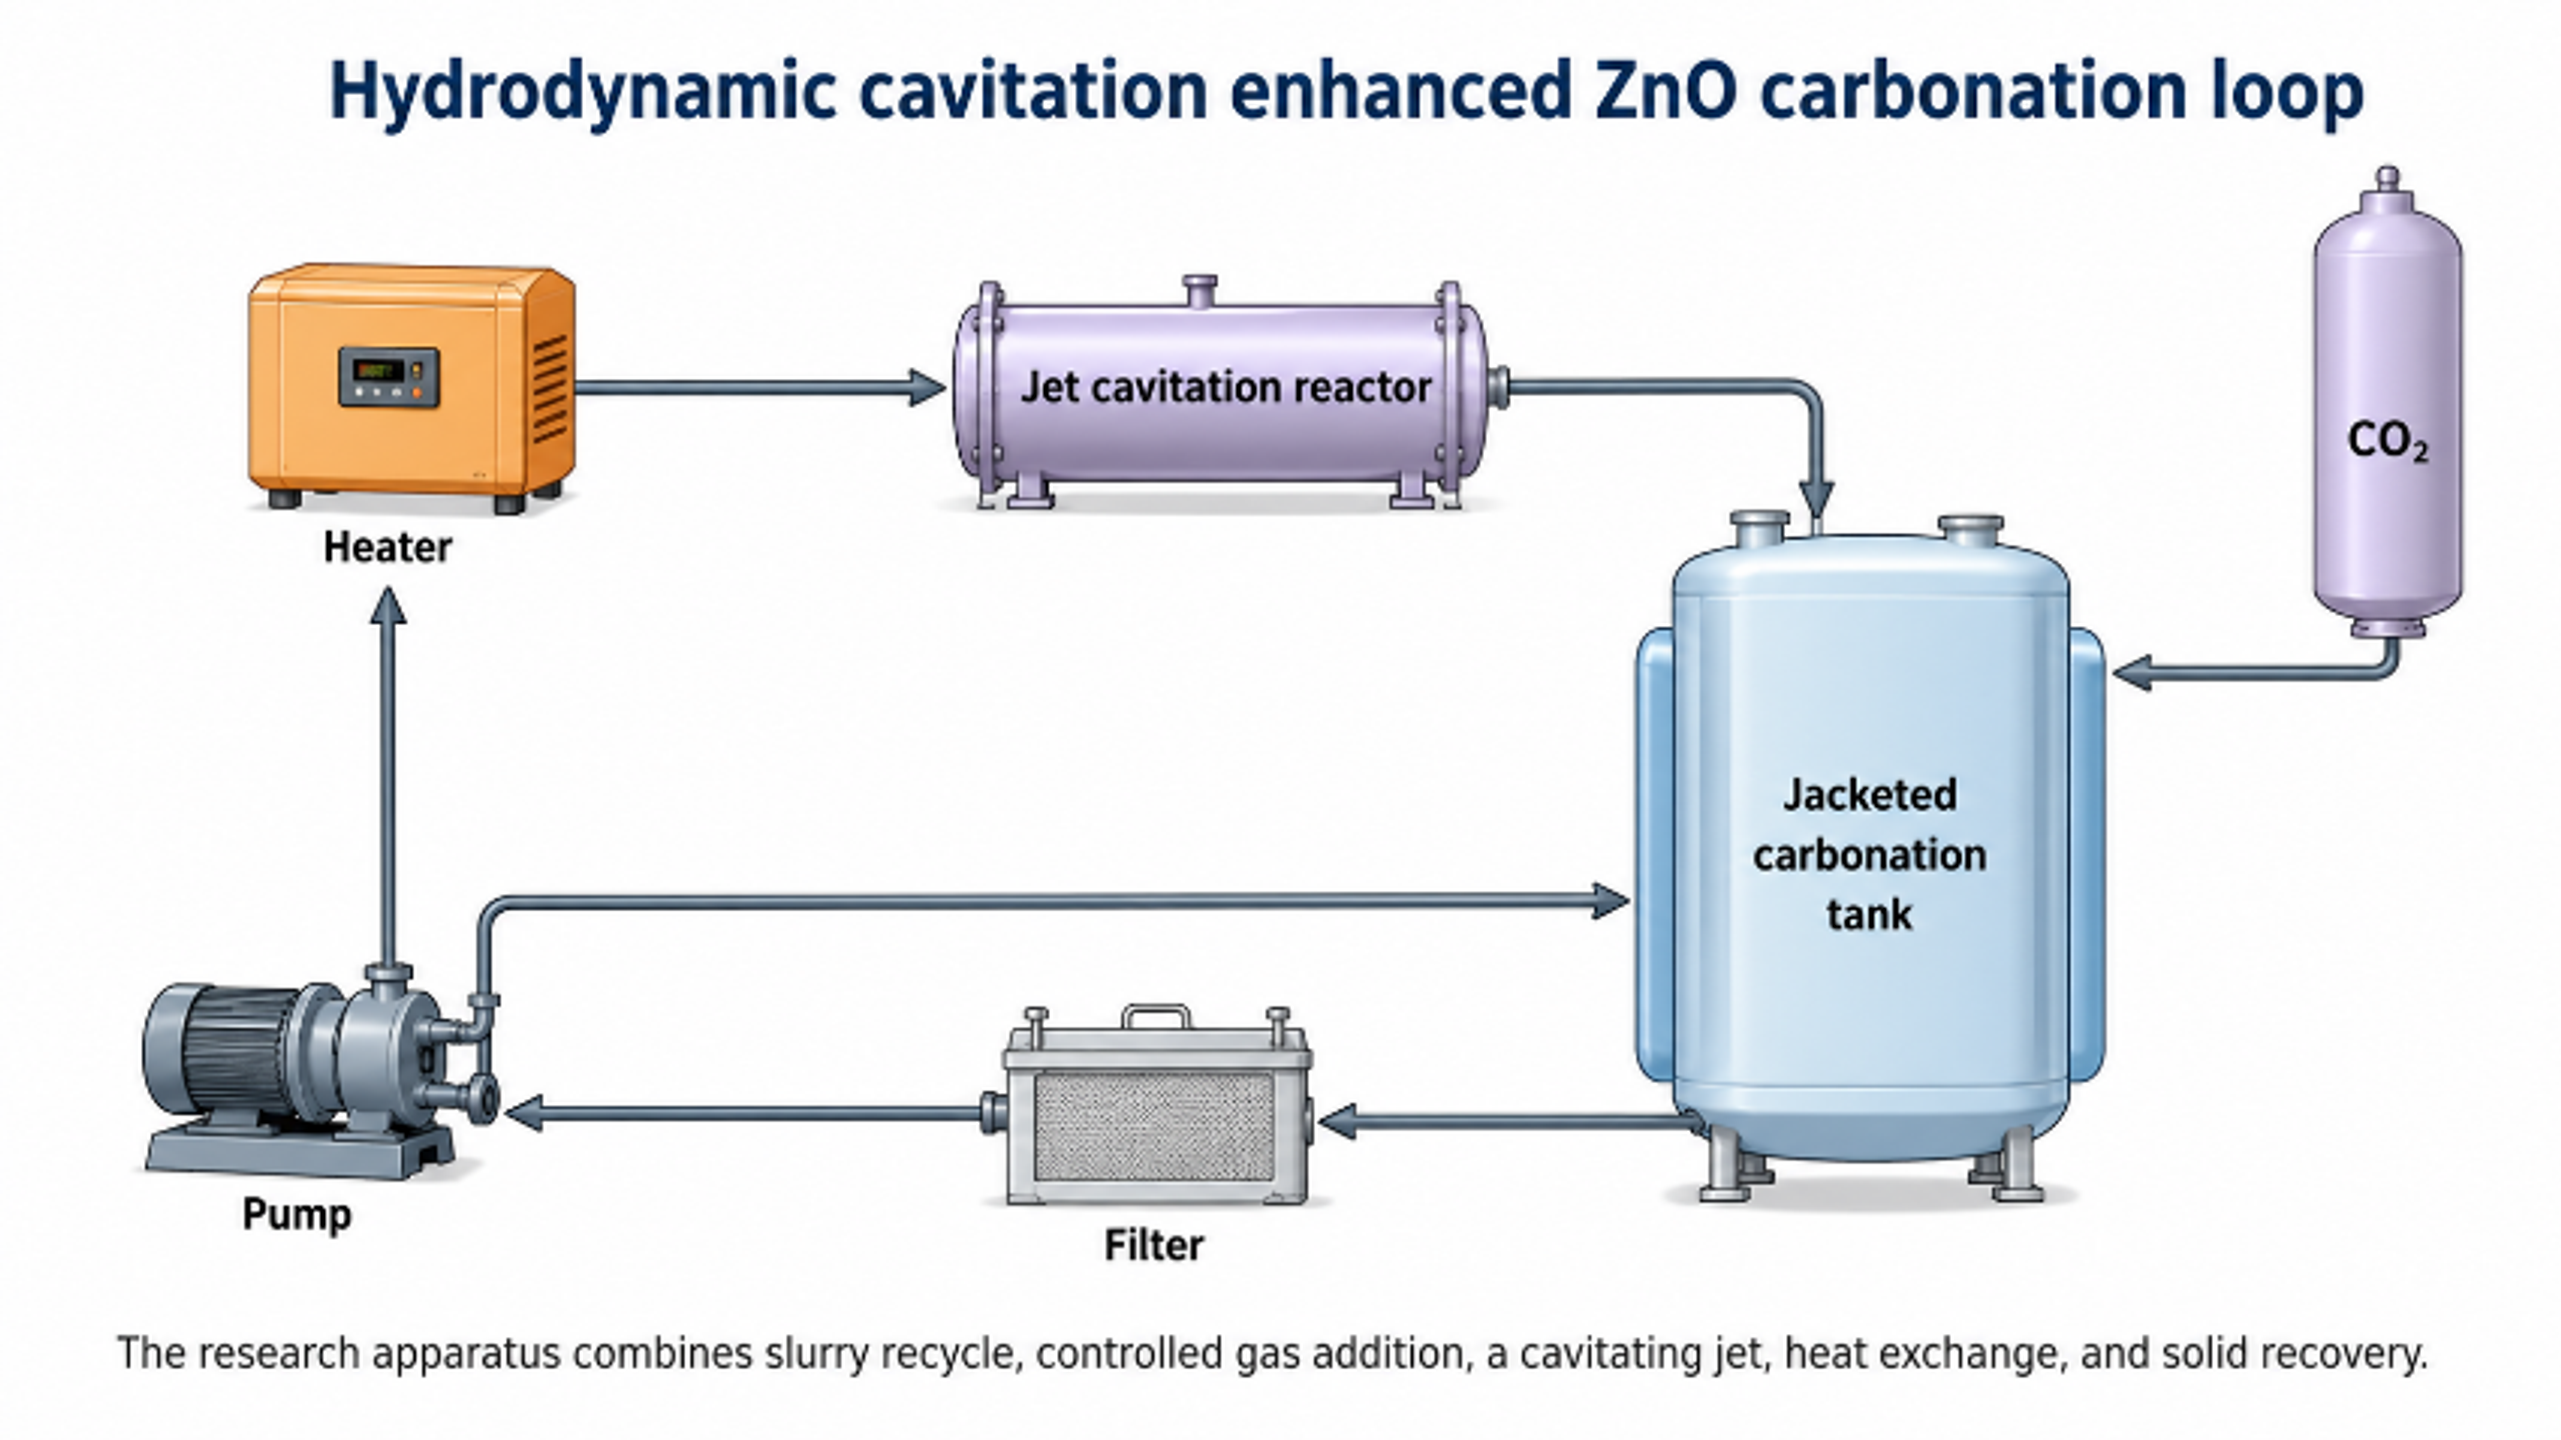
Figure 7.4. Hydrodynamic cavitation enhanced ZnO carbonation apparatus and gas injection reactor. [10].
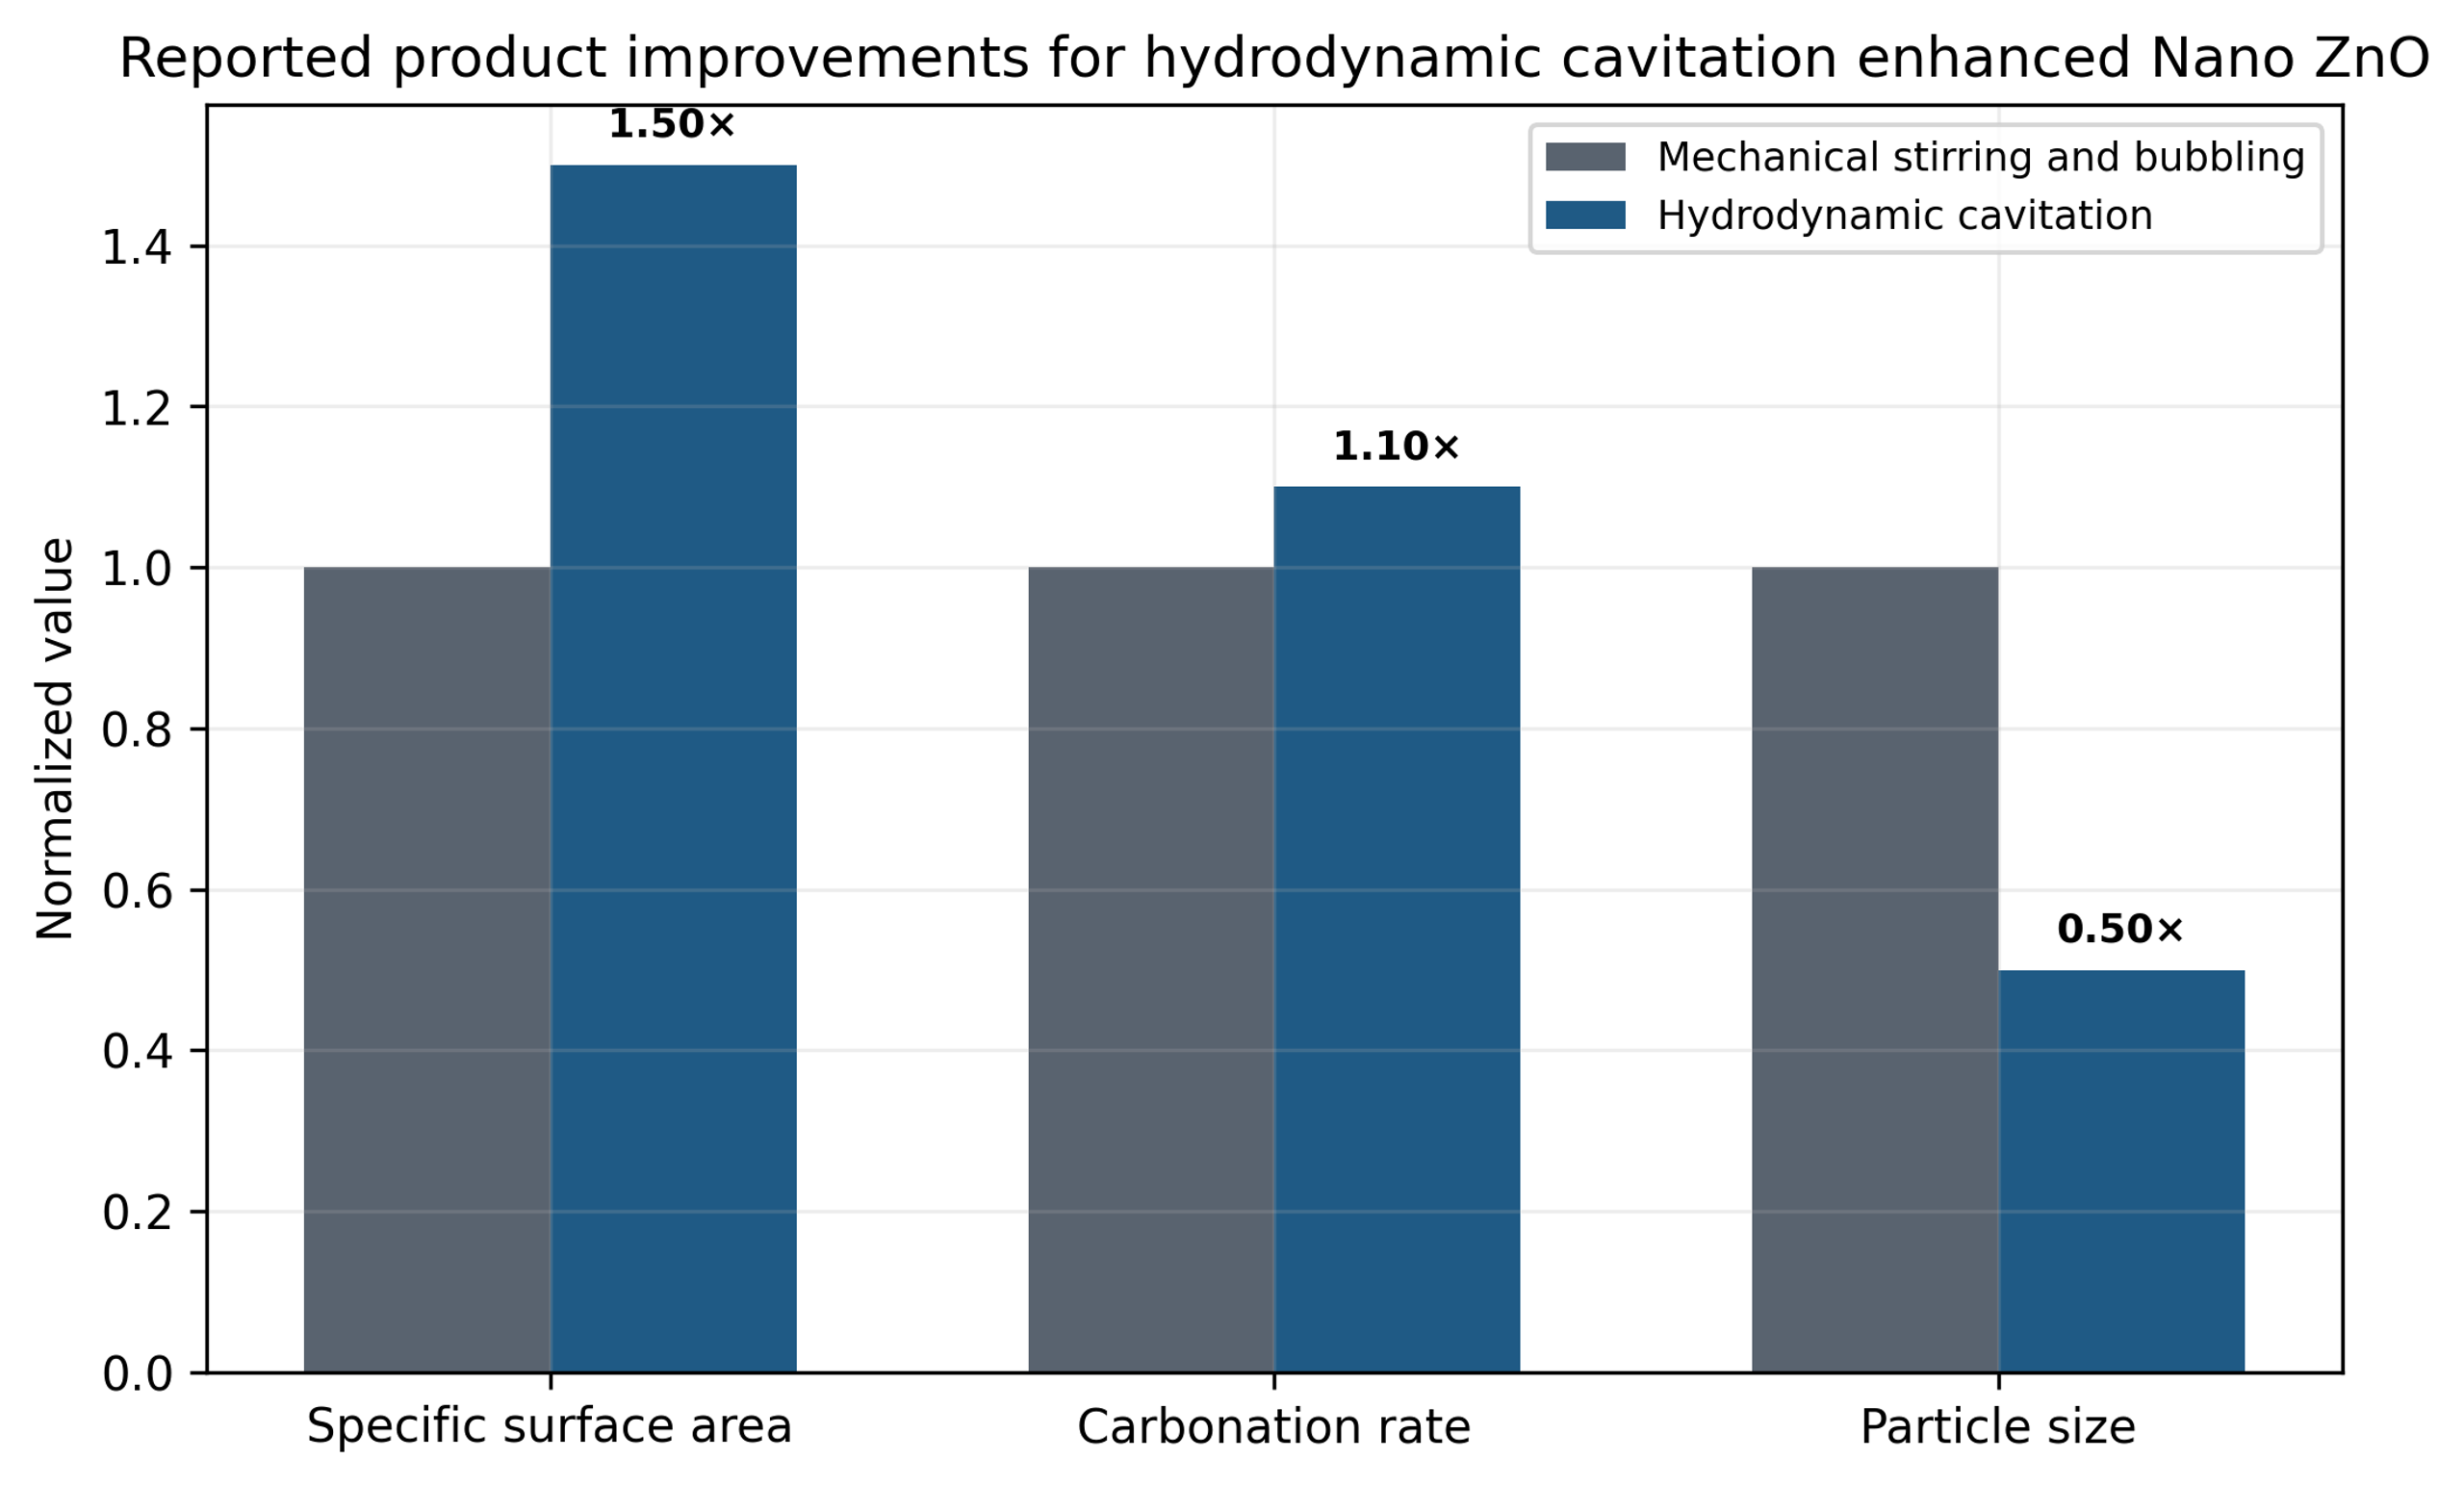
Figure 7.5. Normalized comparison of hydrodynamic cavitation with mechanical stirring and bubbling for nano ZnO preparation. [10].
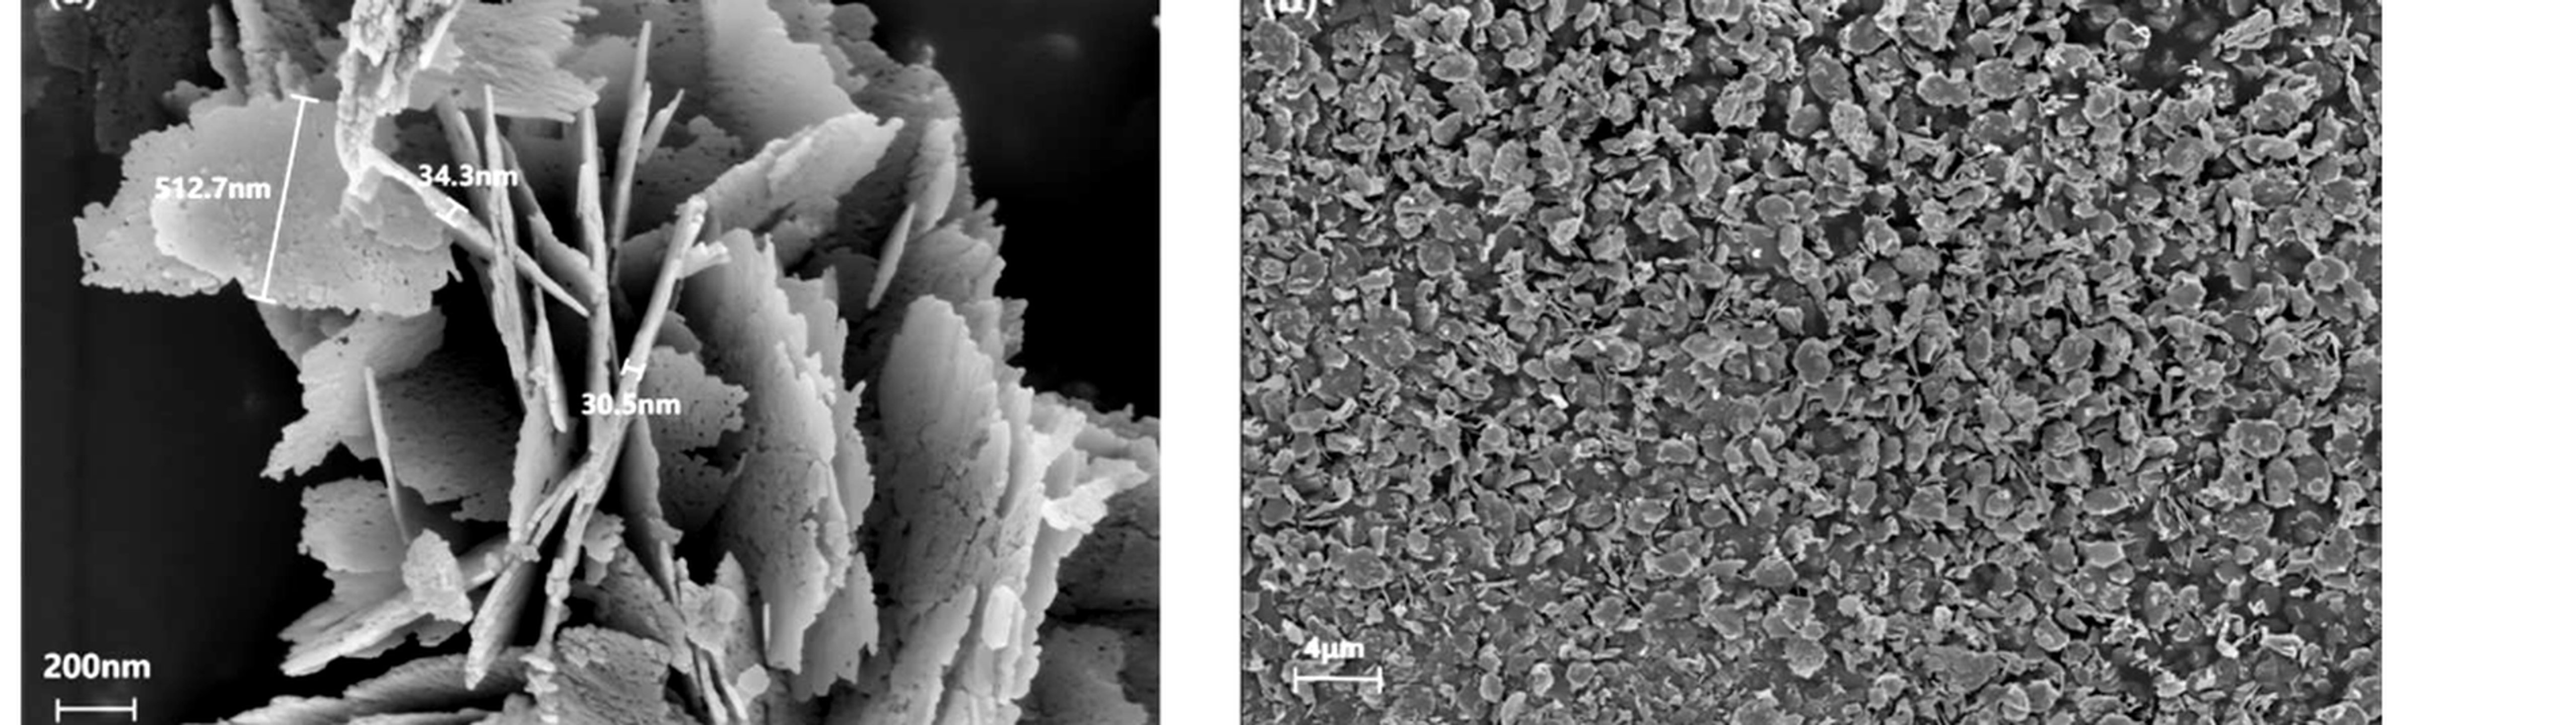
Figure 7.6. High and low magnification SEM images of sheetlike nano ZnO produced by hydrodynamic cavitation enhanced carbonization. [10].
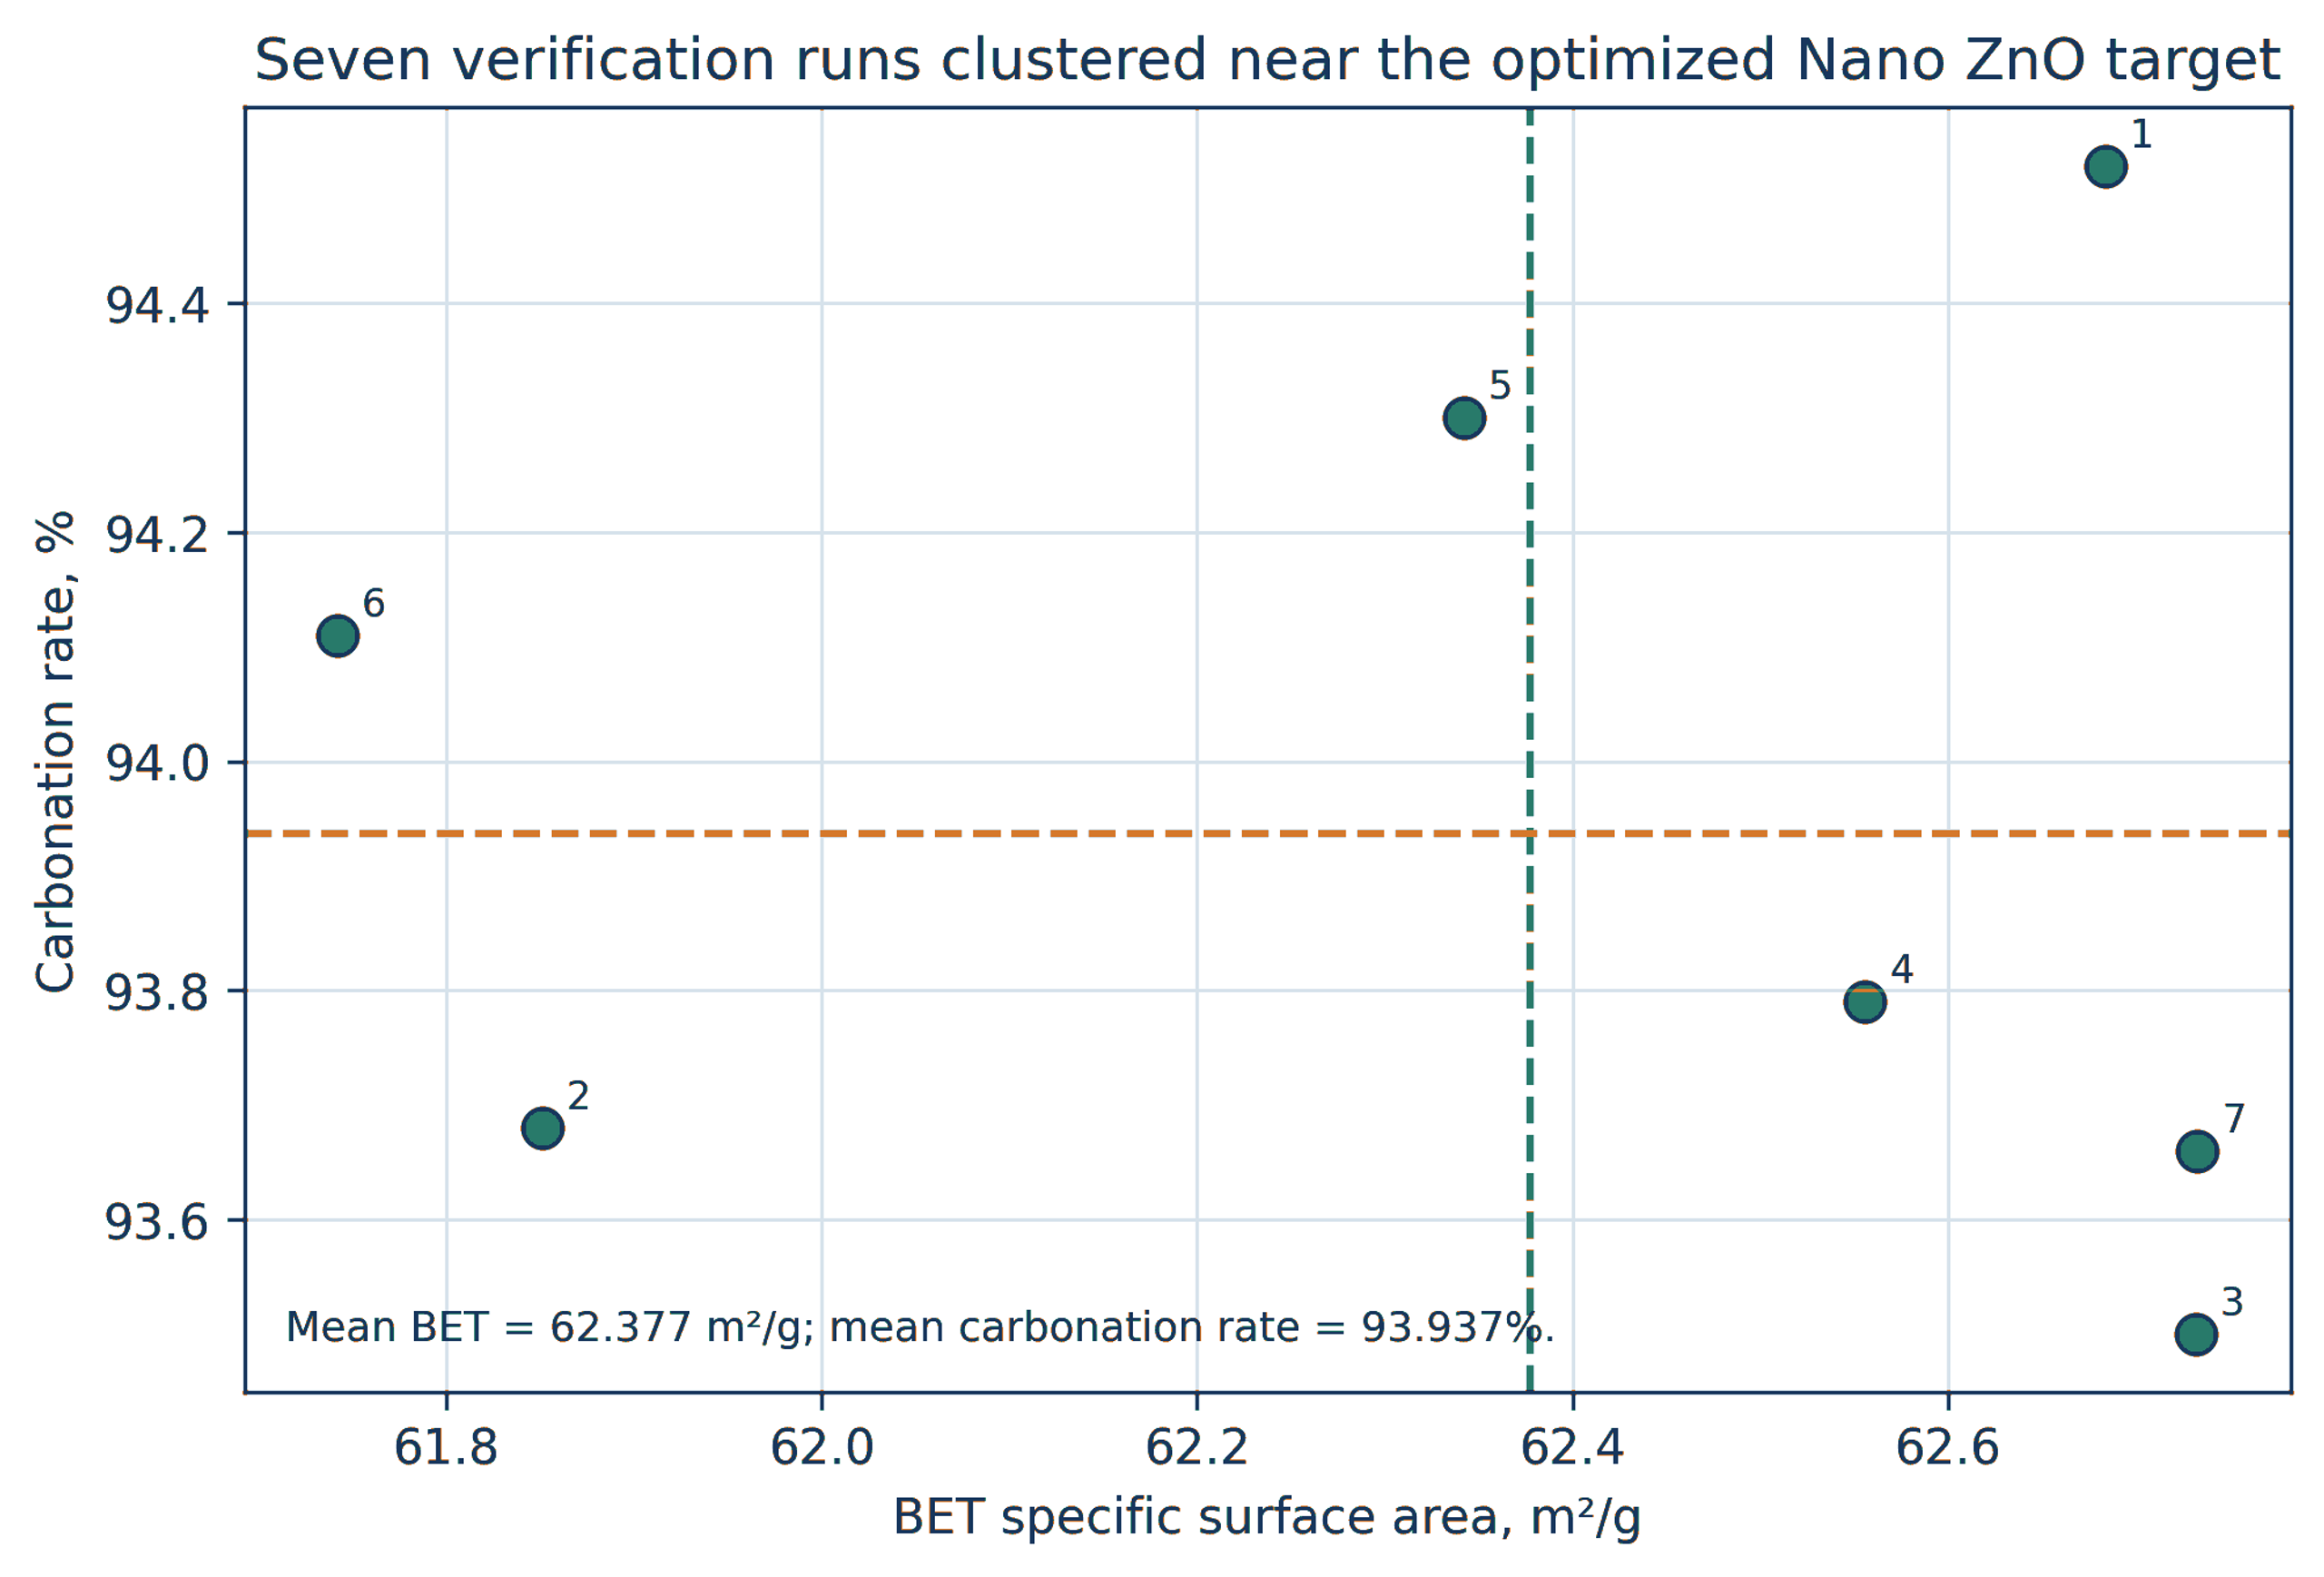
Figure 7.7. Predicted and measured BET area and carbonization rate for the optimized nano ZnO process. [10].
7.3 Ultrasonic Jet Coupling as a New Benchmark
Guo et al. coupled a 20 kHz ultrasonic unit with a hydraulic jet reactor and applied response surface experiments, machine learning, and genetic optimization [11]. The optimized ultrasonic jet route achieved a reaction yield of 94.923%, a BET area of 62.122 m² g⁻¹, and a crystallite size of 18.886 nm in 90 min.
The authors compared these values with the 2024 hydrodynamic route, which required 120 min and produced 93.937% carbonization, 62.377 m² g⁻¹ BET area, and an X-ray size metric of 28.679 nm. The coupled route reduced treatment time and crystallite size while maintaining comparable BET area, but it also added equipment complexity and a measured net ultrasonic calorimetric power of approximately 194.90 W, equivalent to about 1052 kJ over the optimized treatment. The comparison shows that an additional energy field should be evaluated by product benefit per total energy input, not by structural improvement alone.
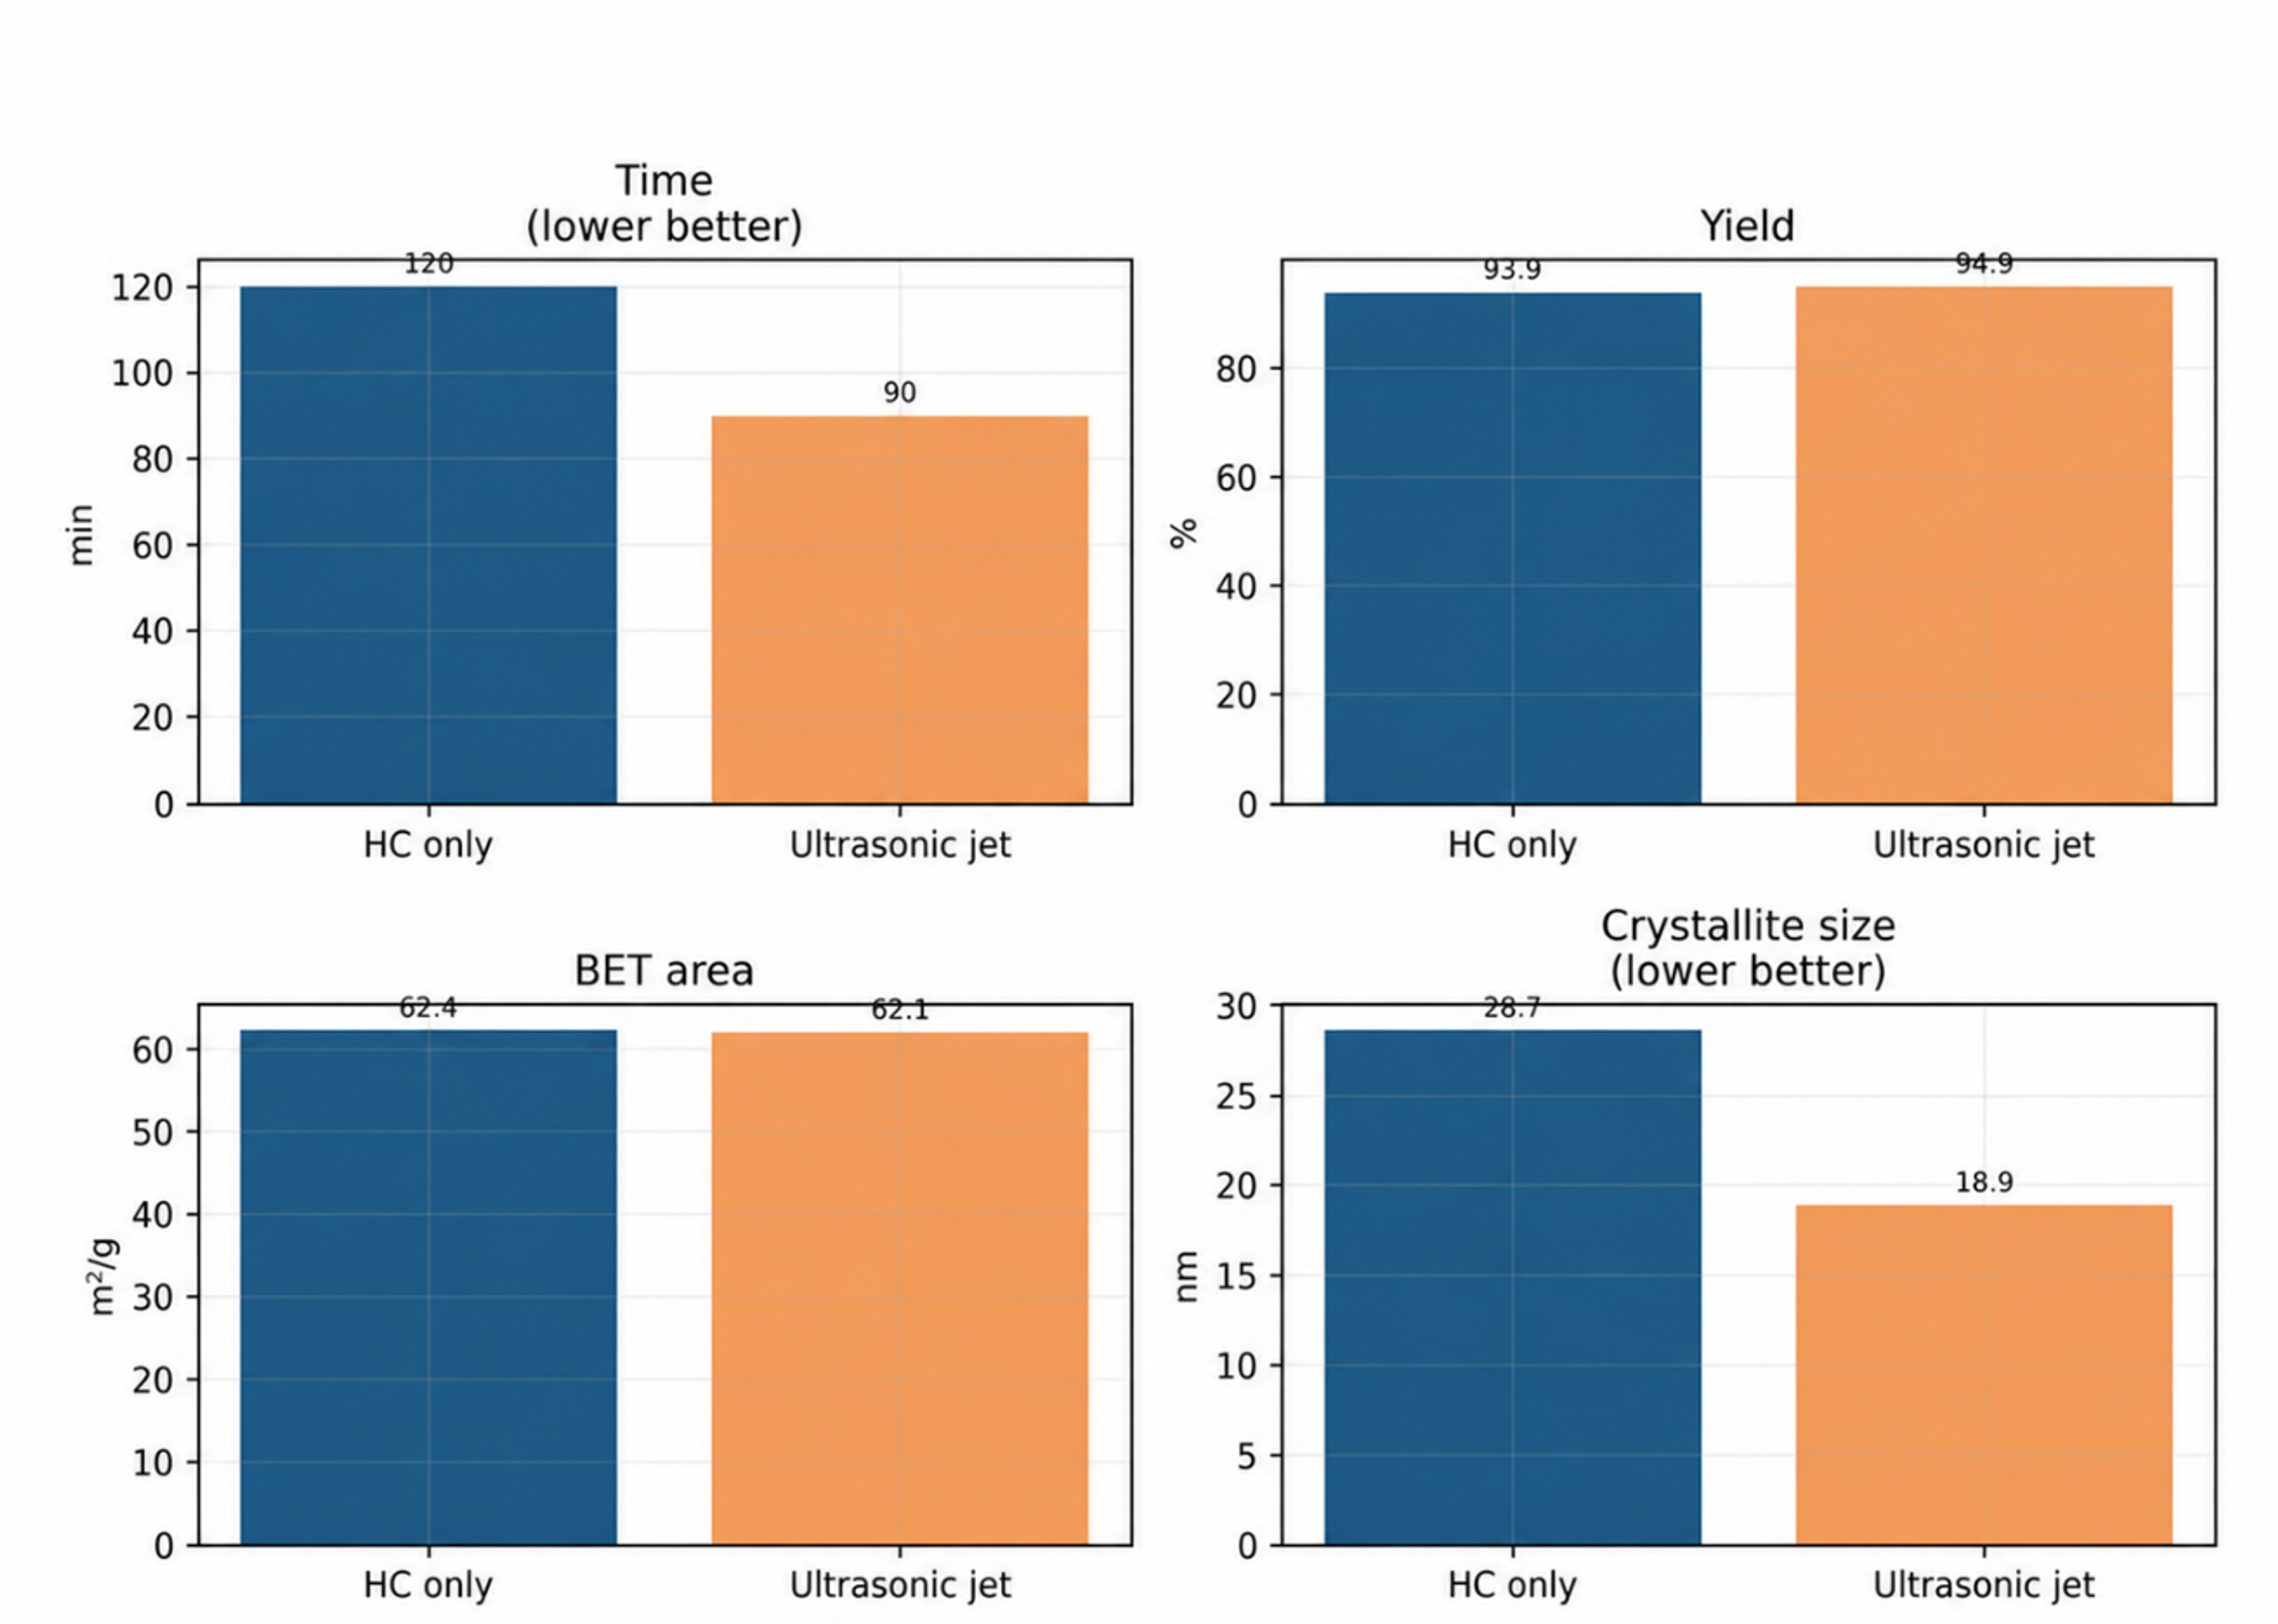
Figure 7.8. Comparison of the ultrasonic jet route with the published hydrodynamic cavitation route for nano ZnO. [11].
7.4 Iron Oxide and Catalyst Slurry Dispersion
Shaik et al. compared acoustic and hydrodynamic preparation of iron oxide nanoparticles. Reported average dimensions were approximately 81 by 17 nm for acoustic cavitation and 49 by 13 nm for hydrodynamic cavitation. The authors attributed the smaller hydrodynamic product to a shorter induction period and rapid supersaturation. The particles were subsequently used as nanocontainer cores for corrosion inhibitor release [13]. The study also demonstrates the importance of reporting both length and width for anisotropic particles.
Hydrodynamic cavitation has also been used to prepare catalyst ink or slurry for polymer electrolyte fuel cells. In this application, the principal objective is not precipitation but uniform dispersion of catalyst and ionomer while limiting damaging agglomerates [14]. This extends the role of cavitation from catalyst synthesis to catalyst formulation. Relevant quality attributes include rheology, aggregate distribution, ionomer coverage, electrode microstructure, and cell performance.
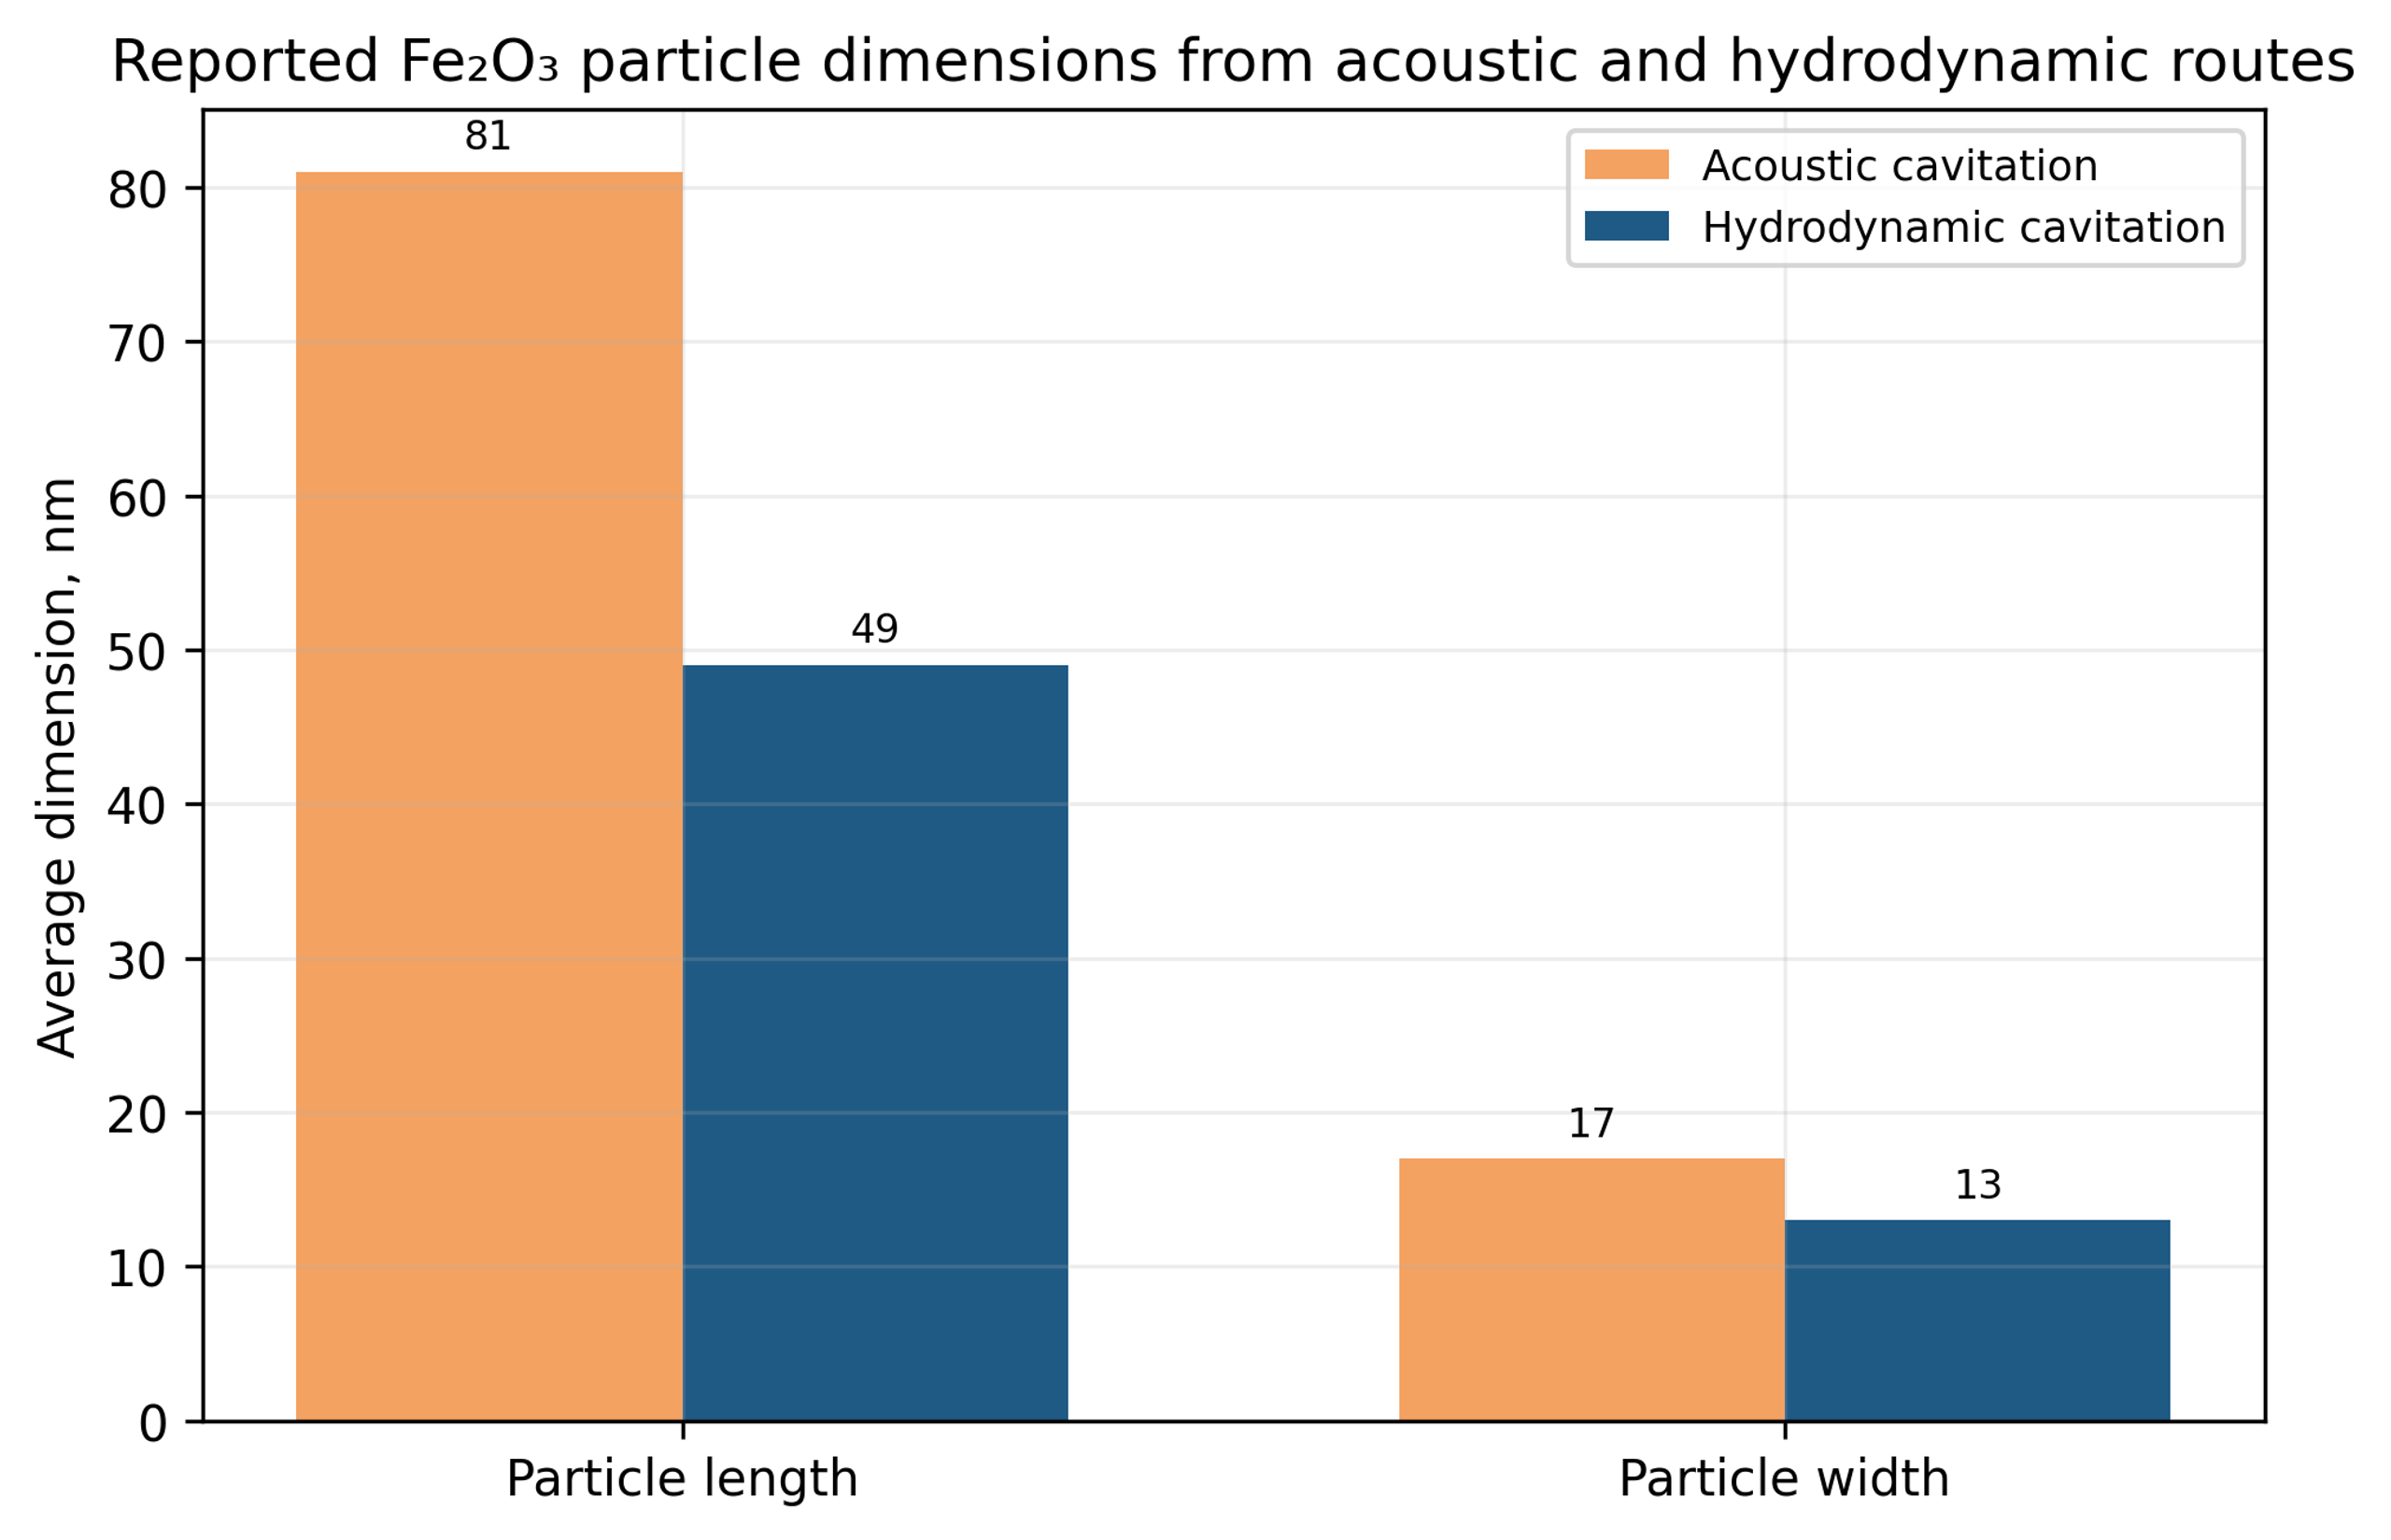
Figure 7.9. Reported Fe₂O₃ particle dimensions from acoustic and hydrodynamic preparation routes. [13].
Table 7.1. Later hydrodynamic cavitation particle formation studies
| System | Reactor and chemistry | Reported outcome | Development lesson |
|---|---|---|---|
| Nanocalcite | Closed loop orifice reactor with CO₂ carbonation | 101 nm without restriction and 37 nm with five 1 mm holes | Geometry affects induction, gas transfer, and size independently of phase |
| Nano ZnO, 2024 | 40 L hydraulic jet carbonation and response surface optimization | 62.377 square meters per gram and 93.937 percent verification averages | Optimize interactions among solid loading, cavitation number, and jet position |
| Nano ZnO, 2026 | Ultrasonic jet coupled carbonation with machine learning optimization | 90 minute route, 94.923 percent yield, 18.886 nm crystallite size | Compare added field complexity and energy with incremental product benefit |
| Fe₂O₃ | Orifice flow with air assisted oxidation | 49 by 13 nm hydrodynamic particles versus 81 by 17 nm acoustic particles | Report anisotropy and downstream functional performance |
| Fuel cell slurry | Hydrodynamic cavitation dispersion of catalyst and ionomer | Improved slurry preparation reported for electrode manufacture | Cavitation can formulate a catalyst after synthesis as well as create it |
8 Validation of the Catalyst in Its Active State
Structural characterization after drying is necessary but insufficient because a catalyst can reconstruct during calcination, reduction, sulfidation, reaction, and regeneration. The active state must therefore be defined for the intended chemistry. For a supported metal, this includes particle size, oxidation state, dispersion, and the support interface. For a hydrotreating catalyst, it includes sulfide slab structure and promoter location. For a mixed oxide, it includes surface termination, oxygen vacancies, redox cycling, and phase stability.
Turnover frequency is useful when the number of accessible active sites can be estimated or measured:
Space time yield describes productivity per reactor volume or catalyst mass, depending on the stated basis:
A simple first order deactivation model can be used to compare initial stability, although many catalysts require more complex kinetics:
Catalytic comparisons must minimize or quantify external and internal transport limitations. Conversion should be low enough for intrinsic rate measurements or corrected using a validated reactor model. Particle size, bed dilution, gas velocity, and temperature gradients must be matched. Activity should be reported per catalyst mass and, where possible, per accessible active site. Selectivity, elemental or carbon balance, time on stream, and regeneration behavior are as important as initial conversion.
The high pressure gold study provides a useful example. CFC produced small gold crystallites and higher gold incorporation, yet most basic hydrazine catalysts showed low CO oxidation activity. A synthesis method should not be judged superior until active phase structure, contaminants, and intrinsic performance are linked. In this case, sodium titanate formation provided a plausible explanation for the mismatch between crystallite size and catalytic rate [7].
Table 8.1. Minimum catalytic validation for a cavitation prepared material
| Question | Recommended evidence | Reason |
|---|---|---|
| Was the same composition prepared? | Bulk metal analysis, impurity analysis, and mass balance | Loading and retained counterions can dominate rate |
| Was the same active state created? | Defined activation, chemisorption, XPS, XAS, or operando diffraction | Dried precursor structure may not survive activation |
| Is the rate intrinsic? | Transport tests, low conversion data, temperature checks | Mixing and heat transfer can mimic catalytic improvement |
| Is selectivity improved? | Complete product analysis and carbon or element balance | Higher conversion can increase undesired products |
| Is the benefit stable? | Time on stream, cycling, regeneration, and post reaction structure | Small particles can sinter or restructure rapidly |
| Is the comparison fair? | Matched support, loading, activation, reactor, and analytical method | Only one variable should define the synthesis comparison |
| Is performance related to structure? | Correlation with active area, interface, defect, or phase population | Prevents unsupported attribution to cavitation |
9 Experimental Design, Scale Up, and Process Analytical Technology
9.1 Designed Experiments and Product Quality Models
Cavitation variables are strongly coupled. One factor experiments can identify gross trends but cannot separate interactions among pressure, restriction geometry, back pressure, feed rate, pH, temperature, solids concentration, and recycle. Factorial screening should identify influential variables and interactions, after which response surface methods can map a practical operating window. Replicated center points are essential because slurry preparation and drying can introduce substantial variability.
A generic dimensionless material quality response can be written as Equation 9.1. The form is illustrative. Exponents must be fitted for a defined material, reactor, chemistry, and quality attribute:
The response may represent normalized phase purity, inverse crystallite size, microstrain, active surface area, or another quality attribute. The precipitation age ratio is included because mechanical similarity is insufficient when the chemical intermediate enters the processor at a different stage of formation.
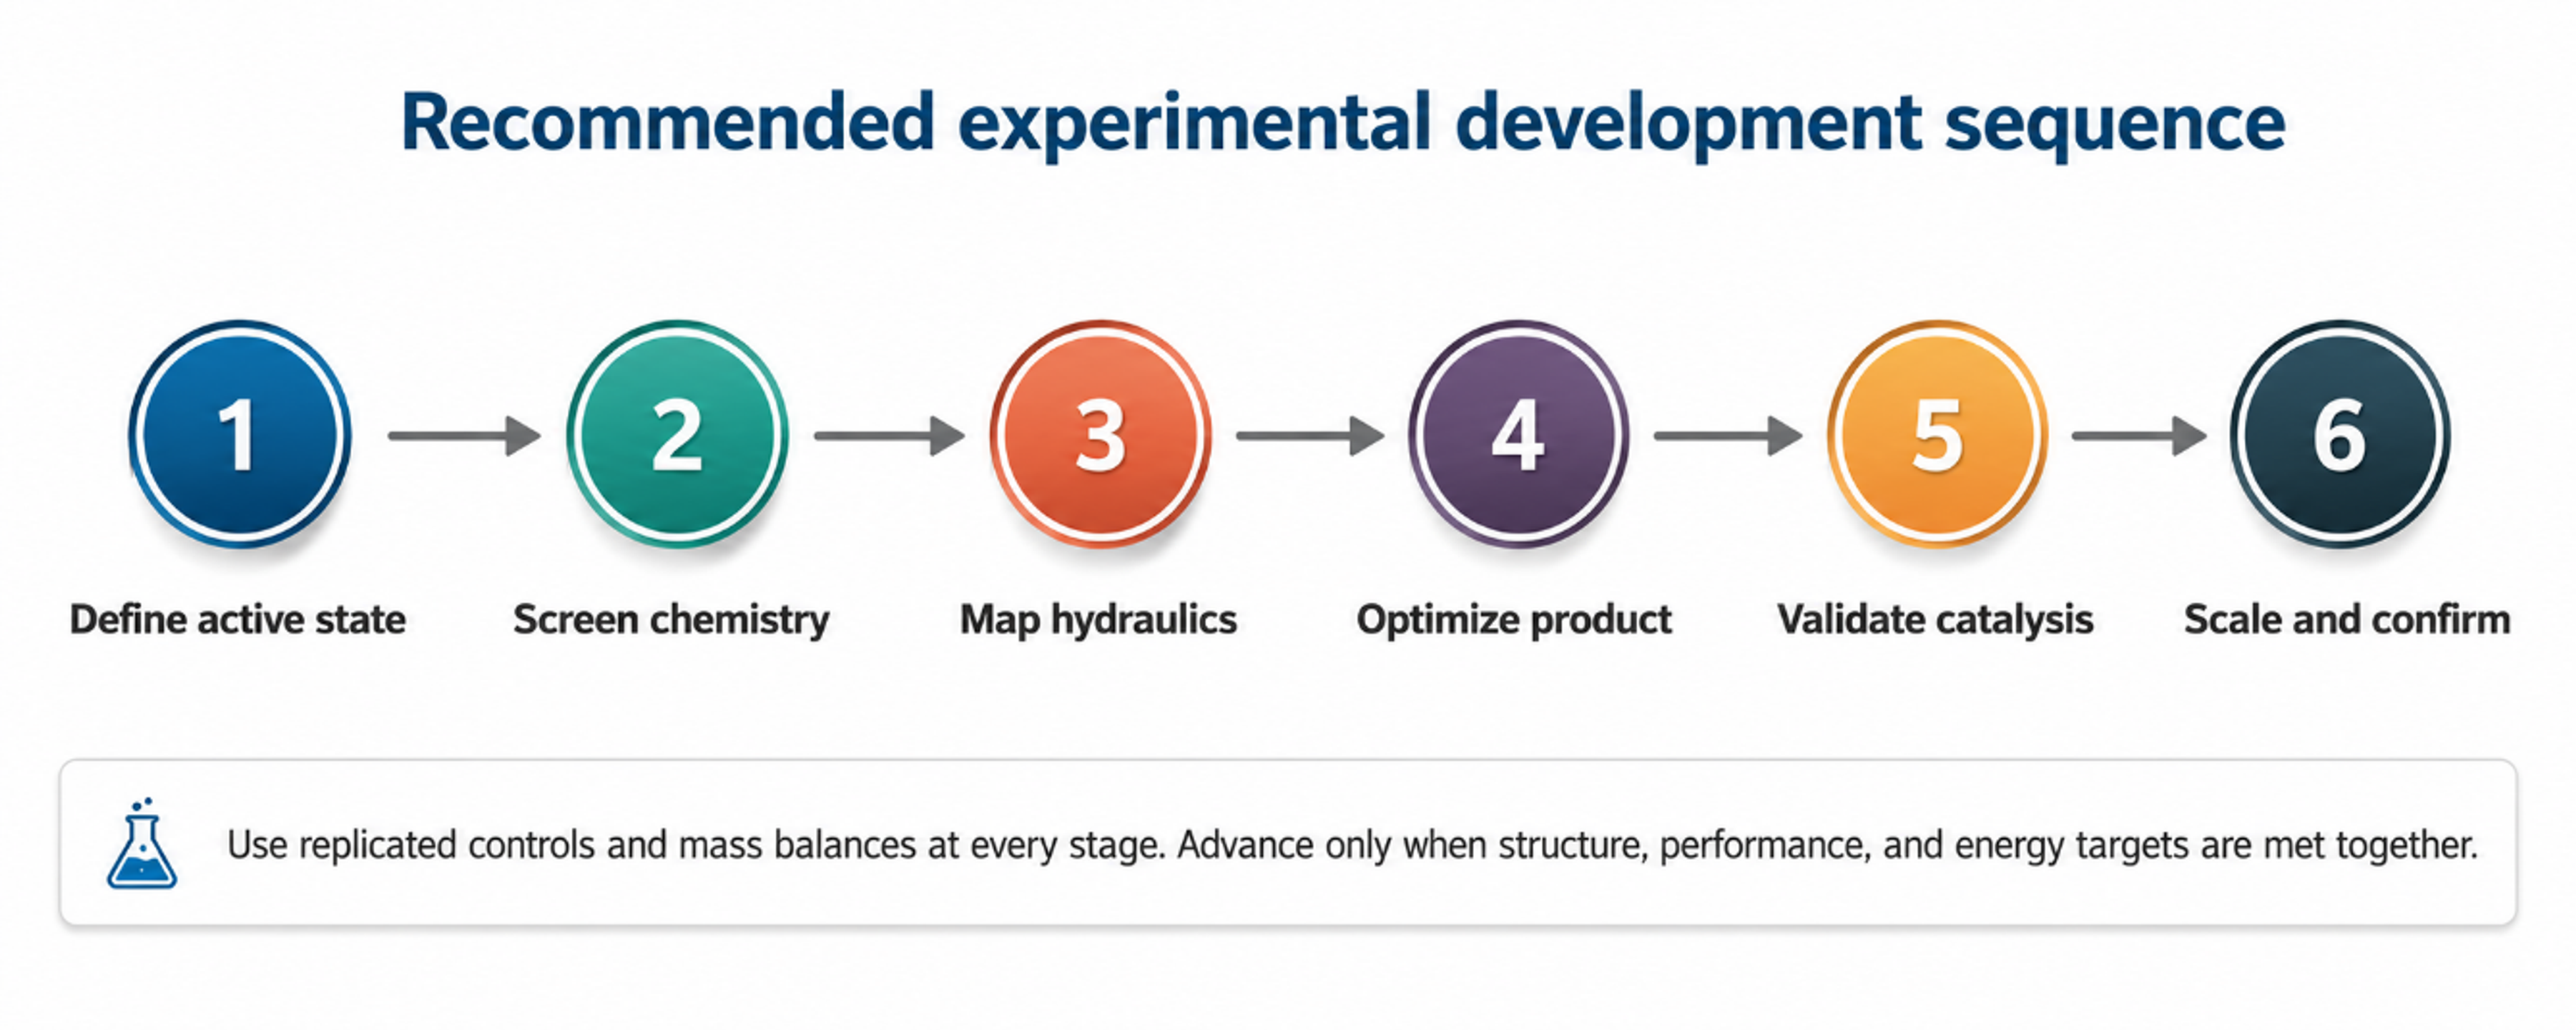
Figure 9.1. Recommended experimental development sequence for a cavitation catalyst. [29].
Table 9.1. Suggested designed experiment sequence
| Phase | Factors | Responses | Decision |
|---|---|---|---|
| Chemistry screening | Precipitant, pH, solvent, metal concentration, feed order | Yield, phase, composition, induction time | Select a reproducible reactive intermediate |
| Hydraulic screening | Pressure, first restriction, second restriction, back pressure, flow | Pressure stability, temperature, agglomerate size, phase, strain | Identify safe and responsive hydraulic window |
| Interaction study | Chemistry and hydraulic factors together | Critical quality attributes and energy | Quantify interactions and curvature |
| Robustness study | Raw material lot, ambient temperature, pump wear, solids concentration | Mean, variance, failure rate | Define control limits and alarms |
| Scale confirmation | Geometry, parallel channels, flow distribution, heat removal | Product equivalence, throughput, energy, contamination | Approve scale only after active state and performance equivalence |
9.2 Scale Up by Preserving Material Forming History
Scale up should preserve the material forming history rather than nominal pressure. Relevant variables include the interval from feed contact to the first restriction, local supersaturation, pressure trajectory, bubble population, solids concentration, pass distribution, bulk temperature rise, quench rate, separation delay, and drying history. A larger pump operating at the same pressure can still produce a different velocity, active volume fraction, and pressure recovery profile.
Numbering up with parallel calibrated channels can preserve local geometry more effectively than enlarging a single restriction. However, flow maldistribution and unequal plugging can create separate product populations. Manifolds should be designed for equal pressure loss, and each branch should provide a verifiable flow or differential pressure signal. Production qualification should demonstrate statistical equivalence in composition, phase, active area, catalytic performance, and stability.
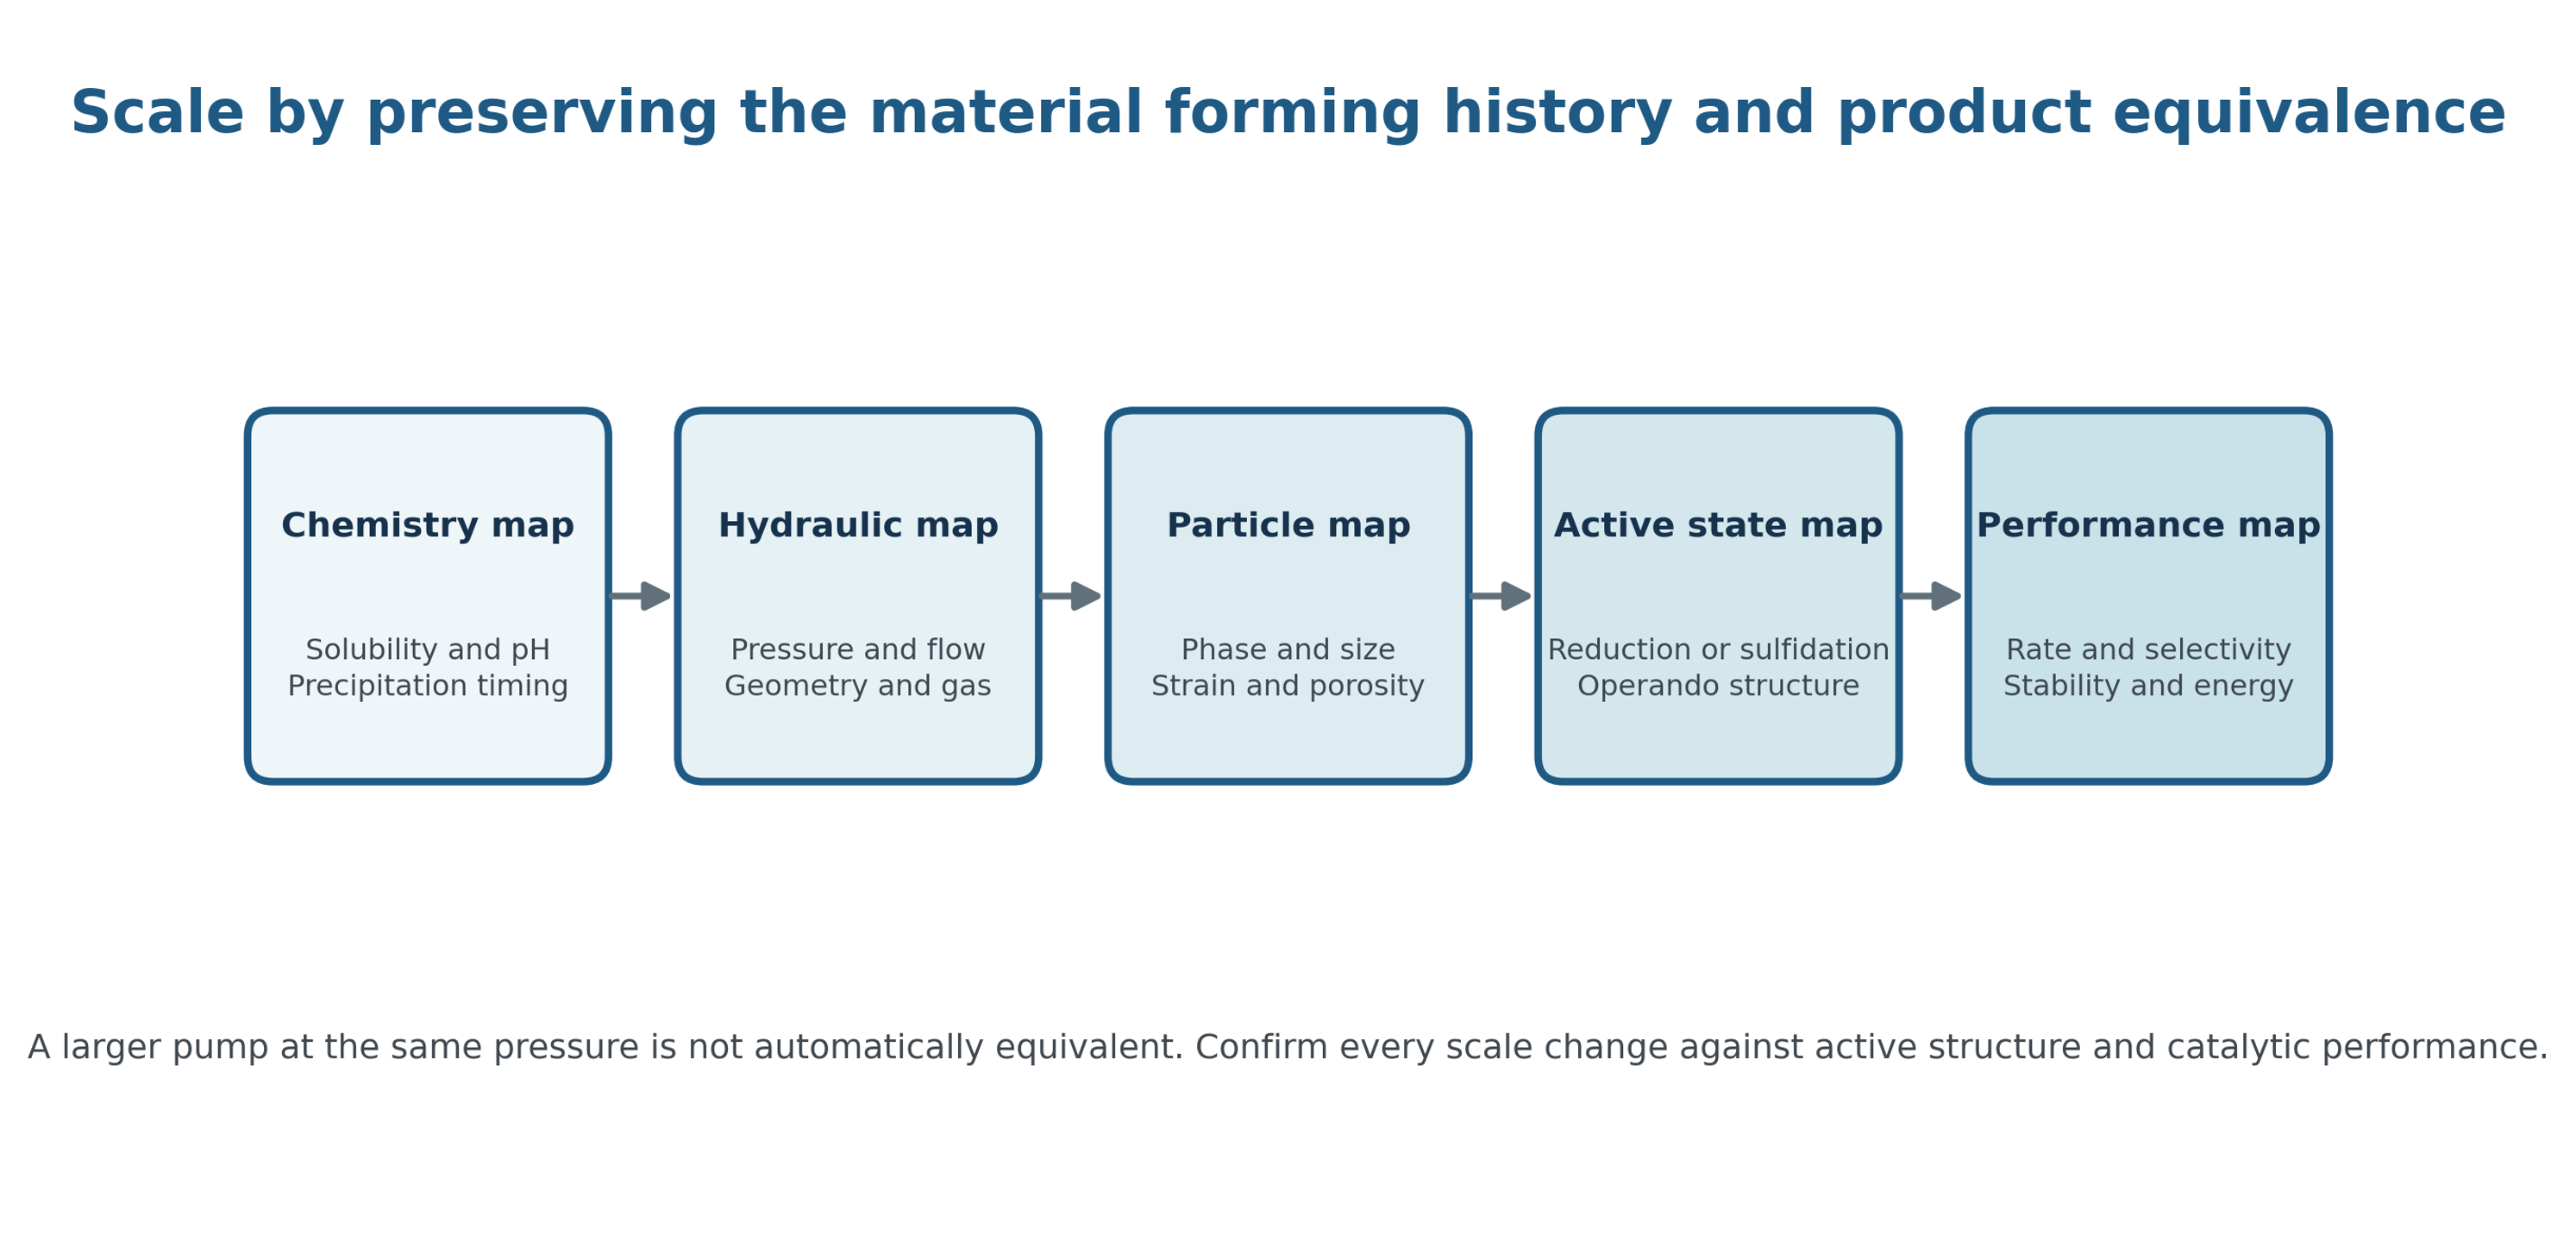
Figure 9.2. Scale up hierarchy from chemistry mapping to active state performance. [29].
Table 9.2. Minimum evidence before scale up
| Area | Critical question | Minimum evidence |
|---|---|---|
| Chemistry | Are precipitation kinetics, gas evolution, and incompatibilities known? | Solubility map, pH window, calorimetry, and validated feed sequence |
| Hydraulics | Are pressure references, flow, geometry, and recovery defined? | Documented pressure and flow data, cavitation map, and repeatable window |
| Materials of construction | Will erosion contaminate product or weaken equipment? | Wear test, alloy compatibility, product metal analysis, and inspection plan |
| Solids handling | Can the finest fraction be recovered without hard agglomeration? | Yield and wash balance, filtration study, and drying comparison |
| Energy | Does any avoided calcination exceed pump and recycle energy? | Total specific energy and carbon accounting at equivalent quality |
| Catalytic equivalence | Does the scaled product retain active structure and performance? | Replicated equivalence for structure, rate, selectivity, and stability |
9.3 Process Analytical Technology and Control
A production cavitation process should integrate feed control, hydraulic monitoring, inline signals, and periodic product analytics. Pressure before and after each restriction, flow, temperature, pump power, and valve position constitute the minimum data set. Acoustic emission, vibration, turbidity, focused beam reflectance, inline spectroscopy, or electrical conductivity can provide additional signatures, but each signal must be calibrated against product quality.
A multivariate control model can identify drift caused by restriction wear, feed concentration changes, gas entrainment, solids accumulation, or pump degradation, but it should not replace hard safety limits. High pressure interlocks, maximum temperature, minimum flow, differential pressure, and vibration limits must remain independent protection layers.
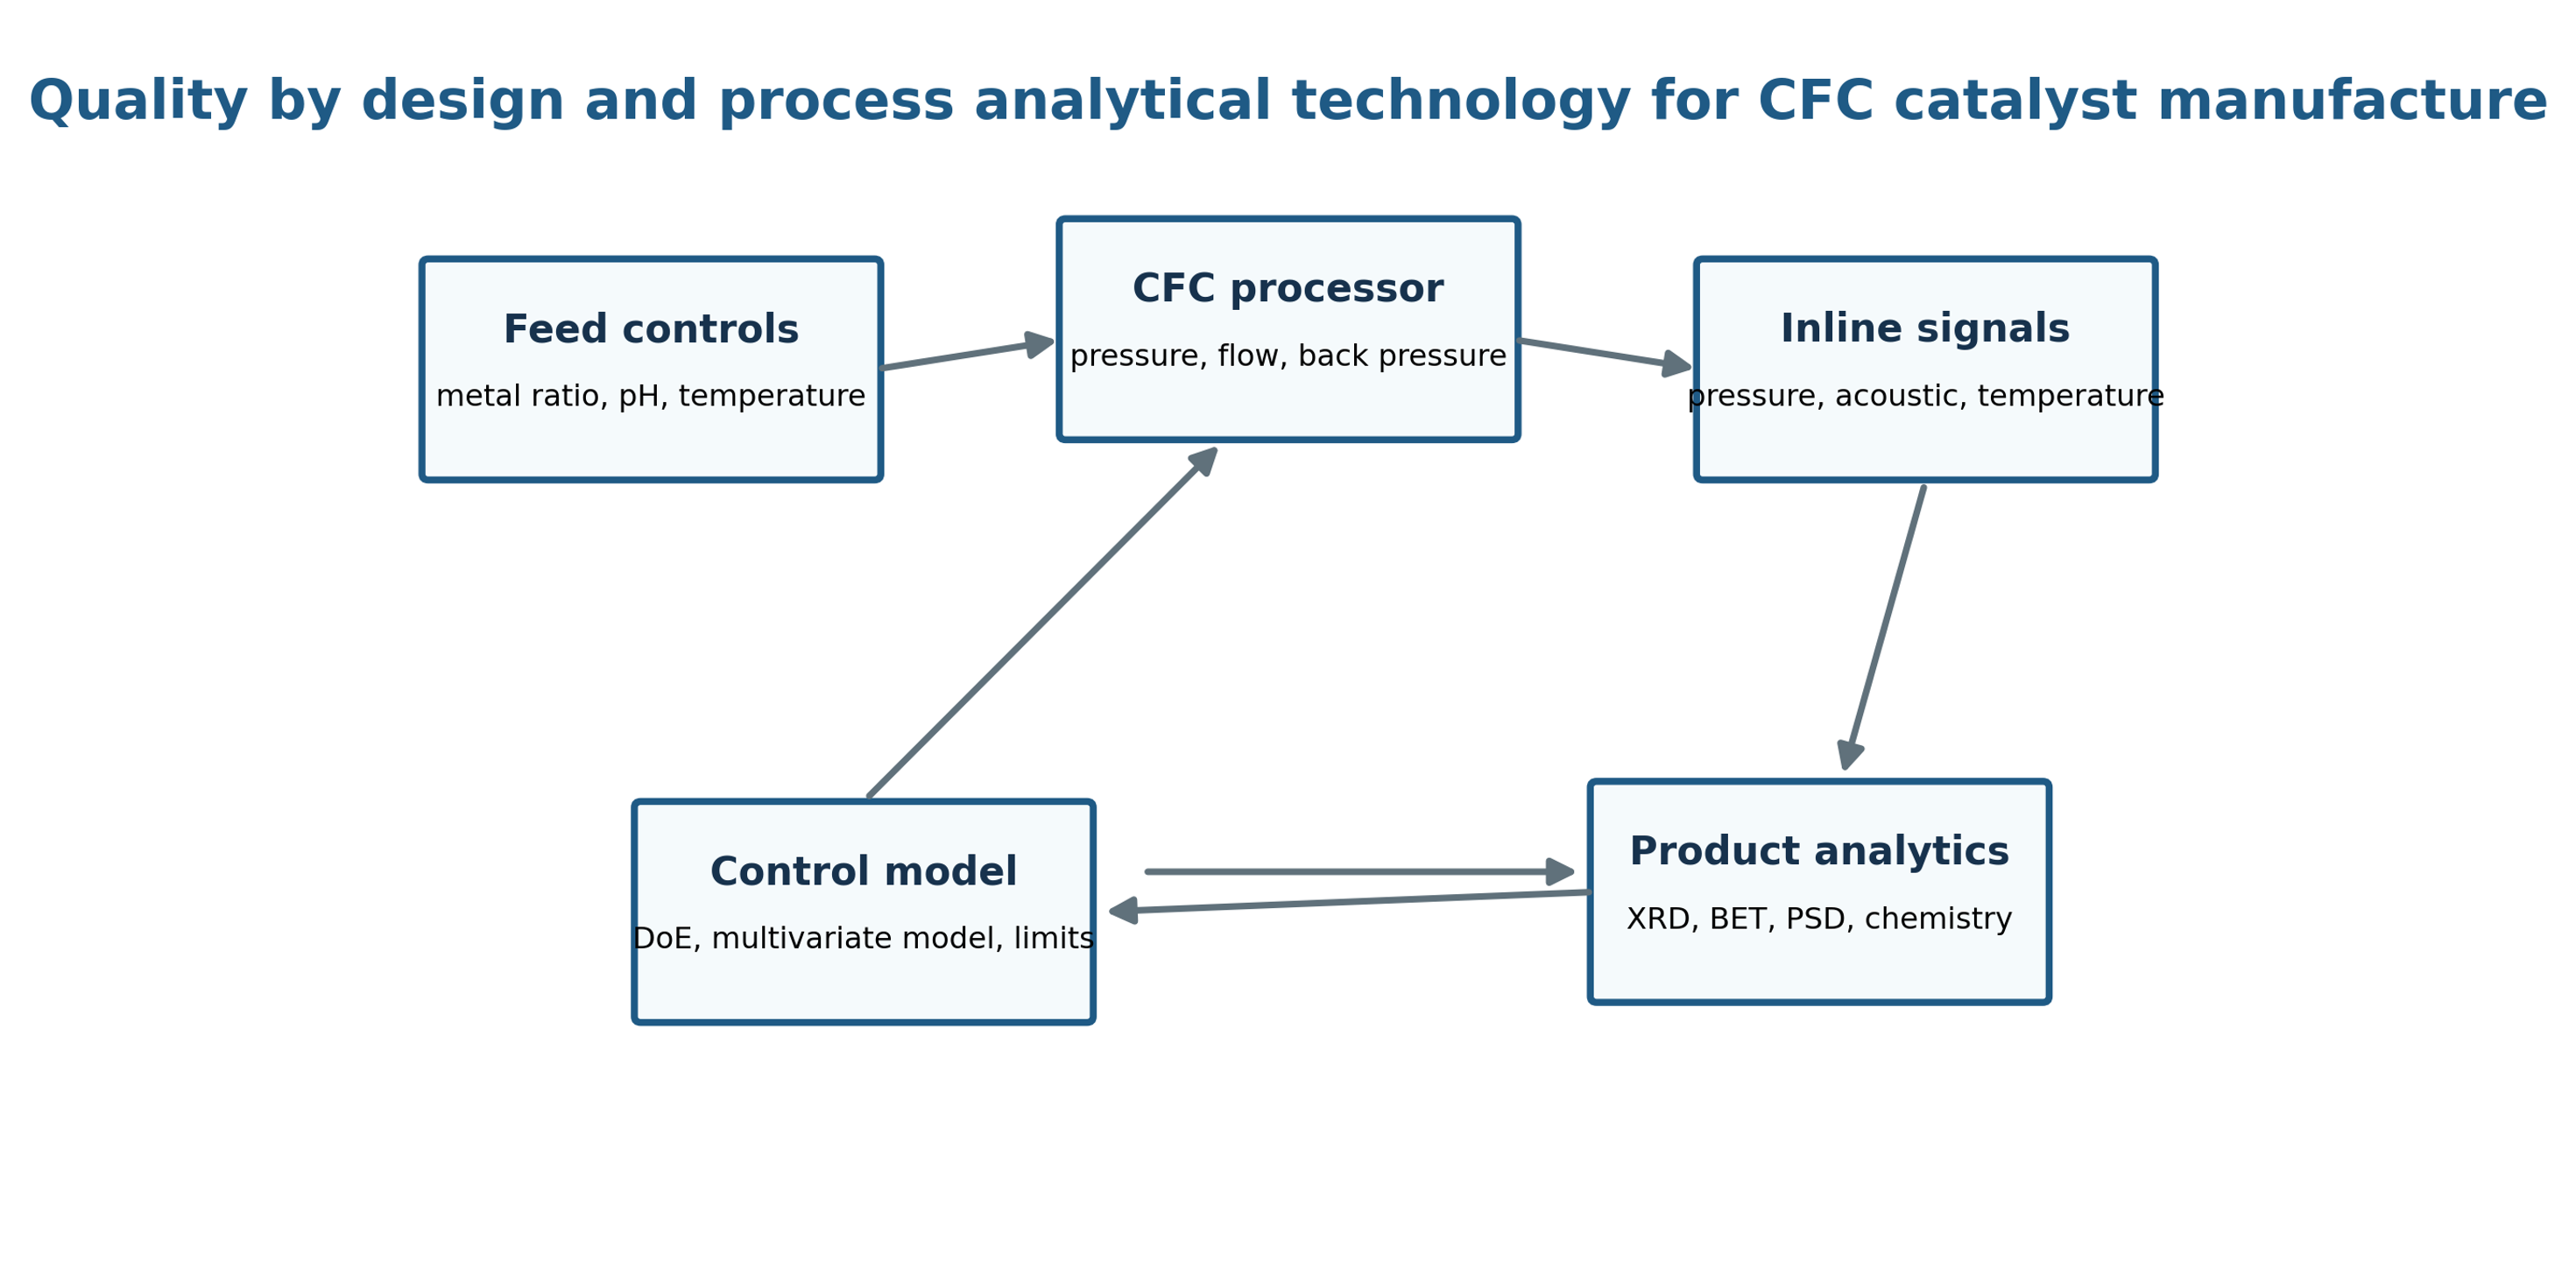
Figure 9.3. Quality by design and process analytical technology control loop for catalyst manufacture. [29].
10 Safety, Materials, Environmental, and Economic Assessment
CFC combines high pressure equipment with reactive salts, corrosive precipitants, reducing agents, fine particles, and potentially flammable or toxic solvents. Process hazard analysis must address stored hydraulic energy, line rupture, seal failure, restriction ejection, overpressure from gas evolution, pump cavitation outside the intended zone, thermal runaway during neutralization, and exposure to dry nanopowder.
Erosion has both mechanical and catalytic consequences. Trace iron, chromium, nickel, cobalt, or other alloy constituents can change catalyst activity or poison downstream processes. Wear coupons, inspection intervals, differential pressure trend analysis, and routine product metal analysis should therefore be included in qualification. Ceramic inserts or hard alloys can reduce wear but may introduce brittleness, cost, or alternative contamination risks.
Environmental assessment must use a complete process boundary. High pressure pumping consumes electricity, whereas improved yield, shorter reaction time, reduced wash water, lower drying load, or reduced calcination duty can save energy. Any claimed energy advantage is valid only when product quality and yield are equivalent. The 2026 ultrasonic jet study illustrates the need to account explicitly for the energy of additional fields [11].
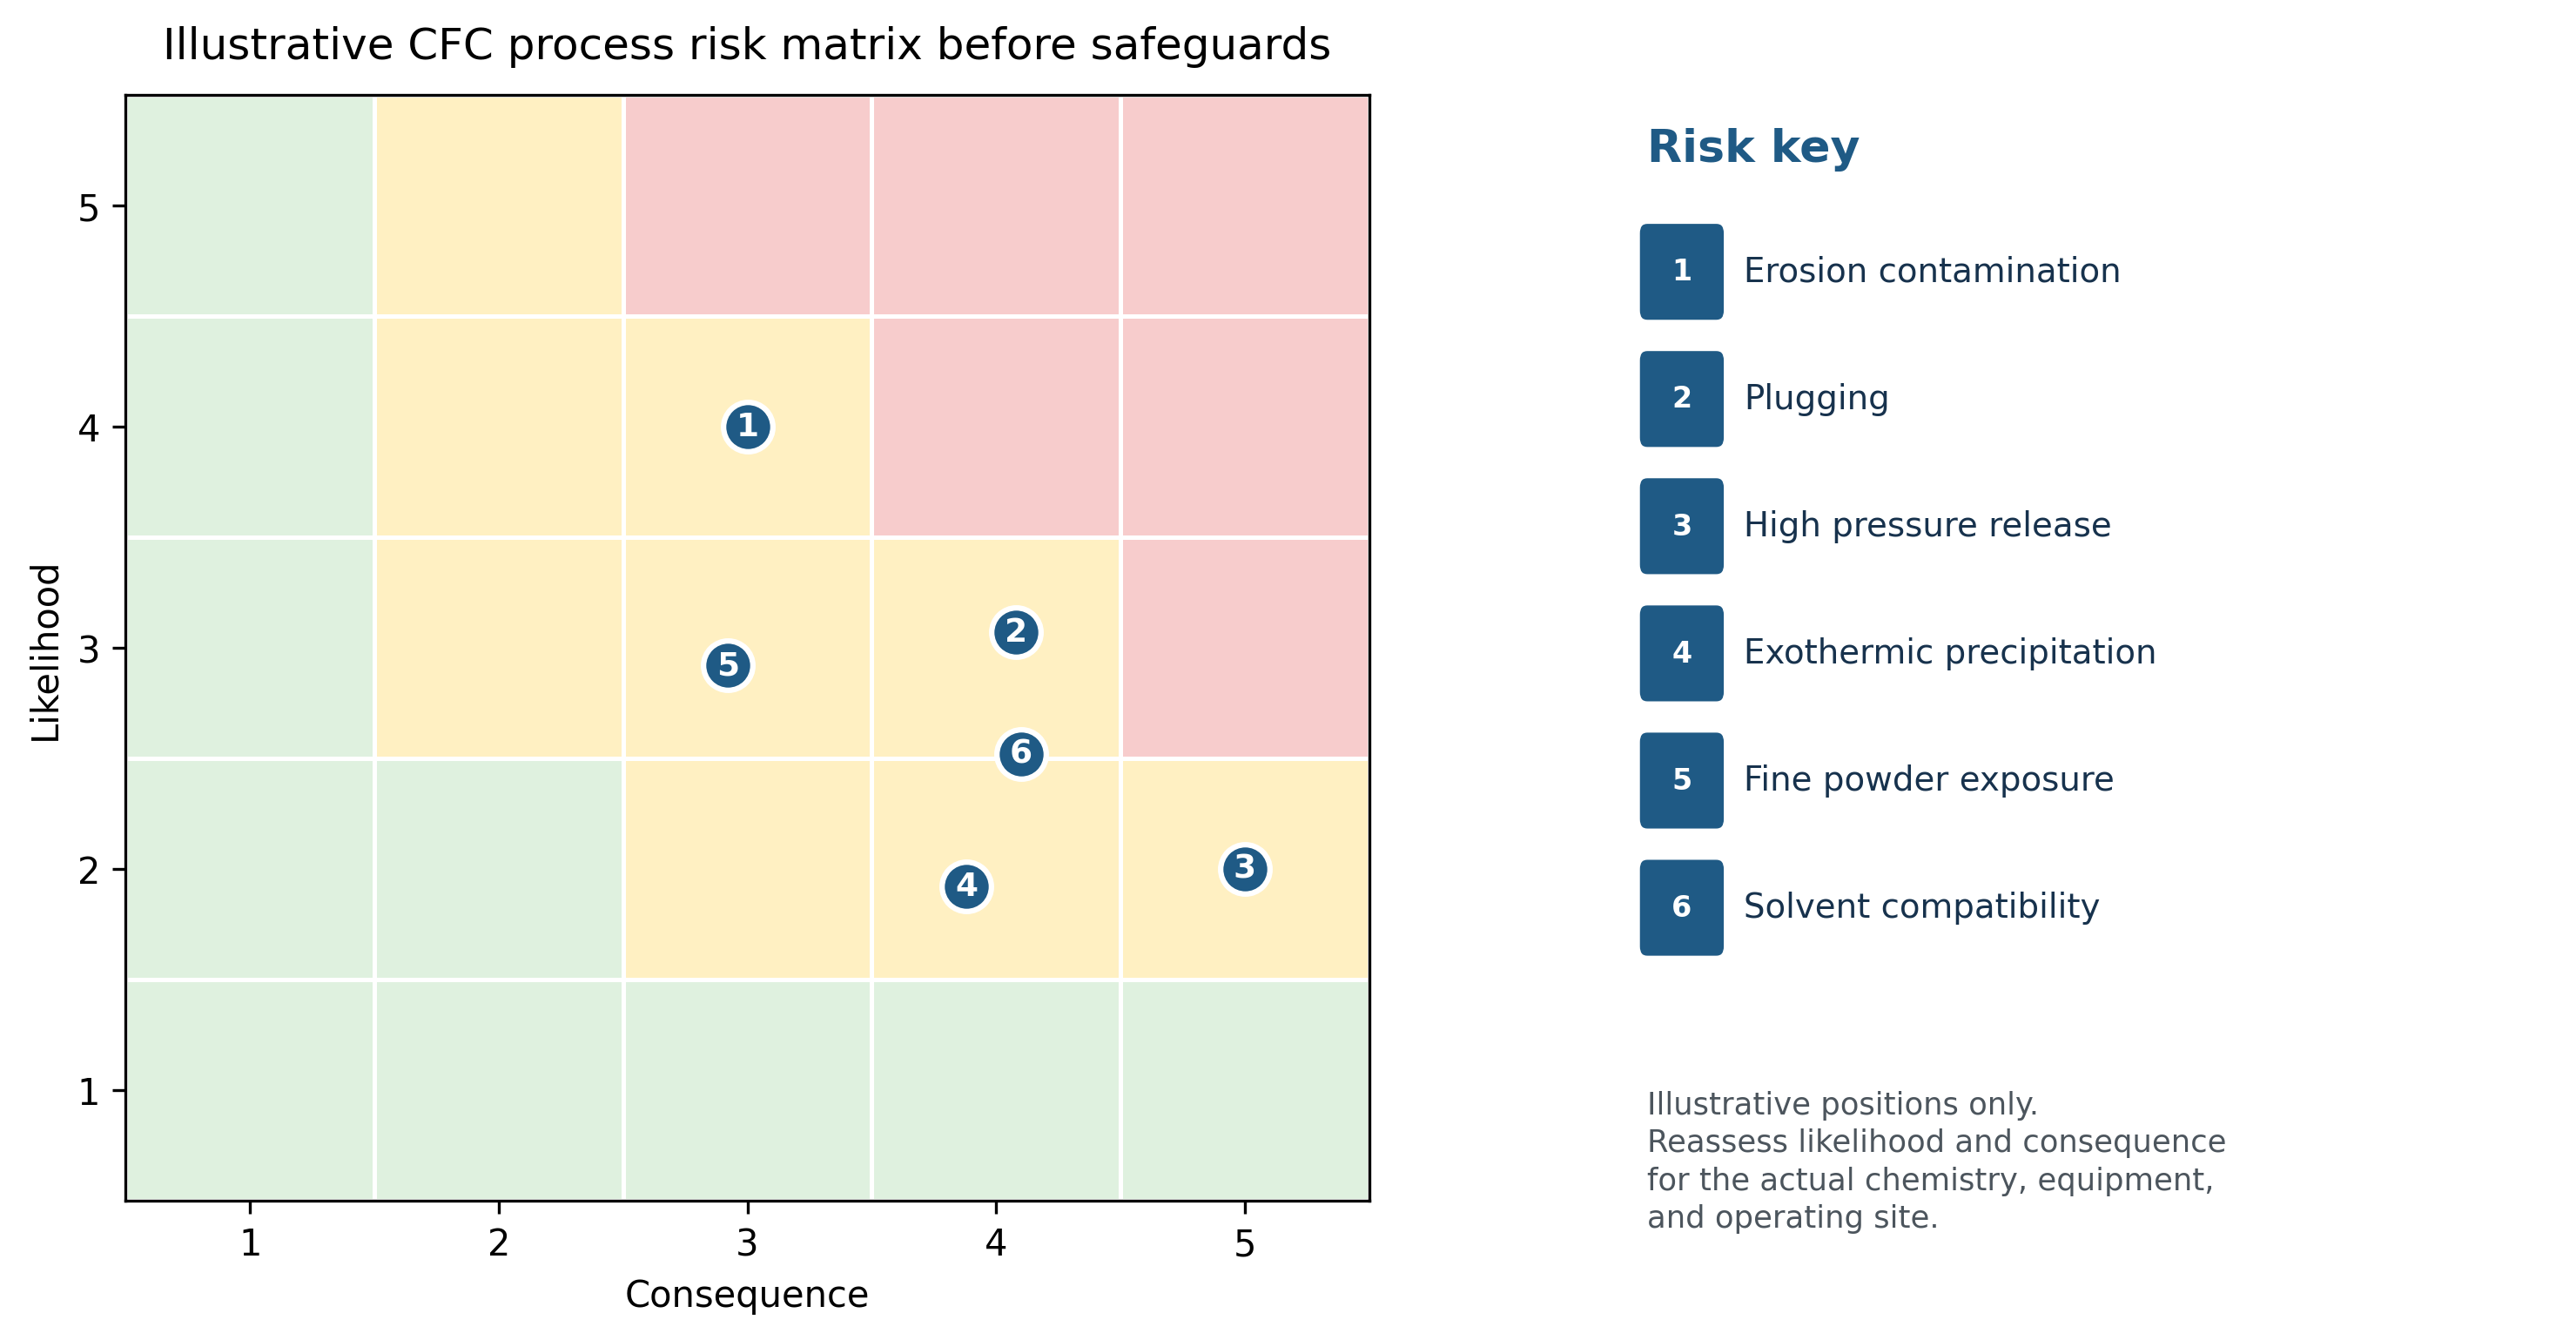
Figure 10.1. Illustrative cavitation process risk matrix before safeguards. The position of each item must be reassessed for the actual chemistry, equipment, and operating site. [29].
Table 10.1. Principal hazards and safeguards for cavitation catalyst fabrication
| Hazard | Potential consequence | Engineering safeguards | Verification |
|---|---|---|---|
| High pressure release | Injection injury, chemical exposure, equipment damage | Rated components, shielding, relief, isolation, remote operation | Pressure test, relief certification, inspection |
| Restriction plugging | Rapid pressure rise, unstable flow, batch loss | Feed filtration, differential pressure alarm, bypass or controlled shutdown | Challenge test and cleaning validation |
| Erosion and contamination | Wall thinning and altered catalyst chemistry | Wear resistant materials, velocity limits, replaceable inserts | Thickness inspection and ICP wear metal trend |
| Reactive precipitation | Heat release, gas evolution, local high pH or low pH | Metered feed, calorimetry, temperature interlock, venting | Reaction hazard assessment |
| Reducing agent or solvent | Fire, toxicity, decomposition, incompatible materials | Closed handling, ventilation, compatible seals, inerting where required | Compatibility and exposure monitoring |
| Fine powder | Inhalation, dust explosion, product loss | Wet handling, contained drying, dust collection, grounding | Industrial hygiene and dust hazard test |
| Pump heating and loss of flow | Decomposition, vapor lock, seal damage | Minimum flow interlock, heat exchanger, temperature trip | Functional trip test |
| Cleaning and changeover | Cross contamination and incompatible residues | Validated sequence, drainability, material segregation | Swab, rinse, and analytical verification |
11 Conclusions
Controlled flow cavitation is a technically distinctive route for producing catalyst precursors, selected finished oxide phases, supported metals, and catalyst slurries. The most consistently supported advantages are continuous operation, rapid mixing of multicomponent feeds, fragmentation of soft precipitates, adjustable crystallite size in selected chemical regimes, higher phase purity in several difficult oxide systems, and the ability to introduce or preserve measurable microstrain [1-14,23-27].
The technology should not be reduced to a rule that higher pressure or lower cavitation number necessarily produces a better catalyst. Material responses are frequently nonmonotonic because precipitation kinetics, bubble population, pressure recovery, particle exposure, dissolved gas, temperature, recycle, drying, and activation interact. The WPI gold studies demonstrate both the opportunity and the limitation: high pressure cavitation produced small gold crystallites and improved incorporation, but contaminants and support chemistry limited activity. Chemistry and hydrodynamics must therefore be designed together.
Evidence for local heating and partial precursor decomposition is scientifically suggestive but remains indirect. Modern validation should combine pressure and flow measurements, calorimetry, rapid sampling, direct structural characterization, active state analysis, intrinsic catalytic testing, and complete process energy accounting. Claims that calcination has been eliminated must be demonstrated for the specific precursor and final active phase.
A target driven development strategy is most defensible. The required active structure should first be defined, followed by a reproducible precipitation pathway and a mapped hydraulic operating window. All relevant structural scales should then be characterized, performance should be validated after realistic activation, and energy, yield, wear, and uncertainty should be quantified. Scale up should proceed only after product equivalence is demonstrated. Under these conditions, CFC functions as a process intensification platform that synchronizes reaction, nucleation, fragmentation, interphase contact, and rapid stabilization of catalyst nanostructure.
Nomenclature
The following symbols and abbreviations are used in this article. Unless otherwise stated, quantities are expressed in SI units.
| Symbol | Definition | SI unit or status |
|---|---|---|
| Geometric mass specific surface area | m2 kg−1 | |
| Concentration or empirical constant as defined | mol m−3 or dimensionless | |
| Equilibrium solubility at the same temperature | mol m−3 | |
| Restriction discharge coefficient | dimensionless | |
| Crystallite size from diffraction | m or nm | |
| Hydraulic diameter | m | |
| Characteristic crystallite diameter | m | |
| Restriction diameter | m | |
| Specific hydraulic energy referred to isolated solids | J kg−1 | |
| Gravitational acceleration | m s−2 | |
| Nucleation rate | m−3 s−1 | |
| Nucleation preexponential factor | m−3 s−1 | |
| Scherrer shape factor | dimensionless | |
| Apparent deactivation constant | s−1 | |
| Mass of isolated solids | kg | |
| Nominal number of loop passes | dimensionless | |
| Upstream static pressure | Pa | |
| Back pressure | Pa | |
| Recovered pressure used in cavitation number | Pa | |
| Static pressure at the throat | Pa | |
| Liquid vapor pressure | Pa | |
| Pressure inside a bubble | Pa | |
| Far field liquid pressure | Pa | |
| Volumetric flow rate | m3 s−1 | |
| Instantaneous bubble radius | m | |
| Universal gas constant | J mol−1 K−1 | |
| Maximum bubble radius before collapse | m | |
| Critical nucleus radius | m | |
| Supersaturation ratio | dimensionless | |
| Relative supersaturation | dimensionless | |
| Processing time | s | |
| Idealized bubble collapse time | s | |
| Absolute temperature | K | |
| Characteristic liquid velocity | m s−1 | |
| Throat velocity | m s−1 | |
| Liquid inventory in recycle loop | m3 | |
| Reactor volume used for productivity basis | m3 | |
| Molar volume of solid phase | m3 mol−1 | |
| Idealized mechanical collapse work | J | |
| Elevation | m |
Greek Letters
| Symbol | Letter name | Meaning | SI unit or status |
|---|---|---|---|
| Beta | Corrected diffraction peak breadth | radian | |
| Gamma | Liquid surface tension | N m−1 | |
| Gamma | Solid liquid interfacial energy | J m−2 | |
| Delta G | Critical nucleation free energy barrier | J mol−1 or J per nucleus | |
| Delta P | Pressure difference across processor | Pa | |
| Delta P sub L | Lumped irreversible pressure loss | Pa | |
| Epsilon | Microstrain or turbulent energy dissipation as defined | dimensionless or W kg−1 | |
| Epsilon | Mass specific turbulent energy dissipation rate | W kg−1 | |
| Eta | Kolmogorov length scale | m | |
| Eta | Pump efficiency | dimensionless | |
| Lambda | X ray wavelength | m or nm | |
| Mu | Dynamic viscosity | Pa s | |
| Nu | Kinematic viscosity | m2 s−1 | |
| Pi | Dimensionless material quality response | dimensionless | |
| Rho | Liquid density | kg m−3 | |
| Rho | Solid density | kg m−3 | |
| Sigma | Cavitation number | dimensionless | |
| Tau | Kolmogorov time scale | s | |
| Tau | Mean loop residence time | s | |
| Theta | Bragg angle | radian or degree |
Abbreviations
| Abbreviation | Definition |
|---|---|
| BET | Brunauer Emmett Teller gas adsorption surface area |
| CFC | Controlled flow cavitation |
| CFD | Computational fluid dynamics |
| DoE | Design of experiments |
| DLS | Dynamic light scattering |
| HDS | Hydrodesulfurization |
| HC | Hydrodynamic cavitation |
| ICP MS | Inductively coupled plasma mass spectrometry |
| ICP OES | Inductively coupled plasma optical emission spectrometry |
| PAT | Process analytical technology |
| PZT | Lead zirconate titanate |
| RSM | Response surface methodology |
| SAED | Selected area electron diffraction |
| SEM | Scanning electron microscopy |
| STEM | Scanning transmission electron microscopy |
| STY | Space time yield |
| TEM | Transmission electron microscopy |
| TOF | Turnover frequency |
| TPR | Temperature programmed reduction |
| TPO | Temperature programmed oxidation |
| XAS | X ray absorption spectroscopy |
| XPS | X ray photoelectron spectroscopy |
| XRD | X ray diffraction |
Bibliography
[1] Moser WR, Kozyuk OV, Find J, Emerson SC, Krausz IM. Method of preparing metal containing compounds using hydrodynamic cavitation. US Patent 6,365,555 B1. 2002.
[2] Moser WR, Kozyuk OV, Find J, Emerson SC, Krausz IM. Method of preparing metal containing compounds using hydrodynamic cavitation. US Patent 6,589,501 B2. 2003.
[3] Moser WR, Kozyuk OV, Find J, Emerson SC, Krausz IM. Method of preparing metal containing compounds using hydrodynamic cavitation. US Patent 6,869,586 B1. 2005.
[4] Kozyuk OV. Hydrodynamic cavitation device. US Patent 5,810,052. 1998.
[5] Kozyuk OV. Hydrodynamic cavitation crystallization device and process. US Patent 7,314,516 B2. 2008.
[6] Five Star Technologies and Moser WR. The Fabrication of High Performance Catalysts by Controlled Flow Cavitation. Technical presentation. Cleveland, Ohio; 2000.
[7] Emerson SC. Synthesis of Nanometer Size Inorganic Materials for the Examination of Particle Size Effects on Heterogeneous Catalysis. PhD dissertation. Worcester Polytechnic Institute; 2000.
[8] Sun X, Chen S, Liu J, Zhao S, Yoon JY. Hydrodynamic Cavitation: A Promising Technology for Industrial Scale Synthesis of Nanomaterials. Frontiers in Chemistry. 2020;8:259. doi: 10.3389/fchem.2020.00259. Open access, CC BY.
[9] Sonawane SH, Gumfekar SP, Kate KH, Meshram SP, Kunte KJ, Ramjee L, Mahajan CM, Parande MG, Ashokkumar M. Hydrodynamic Cavitation Assisted Synthesis of Nanocalcite. International Journal of Chemical Engineering. 2010;2010:242963. doi: 10.1155/2010/242963. Open access.
[10] Guo J, Yu H, Wang D, Chen G, Fan L, Yang H. Experimental Study on Preparation of Nano ZnO by Hydrodynamic Cavitation Enhanced Carbonization Method and Response Surface Optimization. Processes. 2024;12:2601. doi: 10.3390/pr12112601. Open access, CC BY 4.0.
[11] Guo J, Yu H, Wang D, Fan L. Cavitation Enhanced Carbonation for Nano ZnO Synthesis via an Ultrasonic Jet Coupled Reactor: Machine Learning Prediction and Multi Objective Optimization Using a Genetic Algorithm. Ultrasonics Sonochemistry. 2026;129:107859. doi: 10.1016/j.ultsonch.2026.107859. Open access, CC BY 4.0.
[12] Panagiotou T, Mesite SV, Fisher RJ. Production of Norfloxacin Nanosuspensions Using Microfluidics Reaction Technology through Solvent Antisolvent Crystallization. Industrial and Engineering Chemistry Research. 2009;48:1761-1771. doi: 10.1021/ie800955t.
[13] Shaik S, Bagale U, Ashokkumar M, Sonawane S. Preparation of Fe₂O₃ Nanoparticles by Acoustic and Hydrodynamic Cavitation Techniques and Corrosion Inhibition Release Studies Using Its Nanocontainers. Protection of Metals and Physical Chemistry of Surfaces. 2017;53:850-858. doi: 10.1134/S2070205117050203.
[14] Kuroki H, Onishi K, Asami K, Yamaguchi T. Catalyst Slurry Preparation Using a Hydrodynamic Cavitation Dispersion Method for Polymer Electrolyte Fuel Cells. Industrial and Engineering Chemistry Research. 2019;58:19545-19550. doi: 10.1021/acs.iecr.9b02111.
[15] Rayleigh L. On the Pressure Developed in a Liquid during the Collapse of a Spherical Cavity. Philosophical Magazine. 1917;34:94-98. doi: 10.1080/14786440808635681.
[16] Plesset MS. The Dynamics of Cavitation Bubbles. Journal of Applied Mechanics. 1949;16:277-282.
[17] Benjamin TB, Ellis AT. The Collapse of Cavitation Bubbles and the Pressures Thereby Produced against Solid Boundaries. Philosophical Transactions of the Royal Society A. 1966;260:221-240. doi: 10.1098/rsta.1966.0046.
[18] Scherrer P. Bestimmung der Größe und der inneren Struktur von Kolloidteilchen mittels Röntgenstrahlen. Nachrichten von der Gesellschaft der Wissenschaften zu Göttingen, Mathematisch Physikalische Klasse. 1918:98-100.
[19] Williamson GK, Hall WH. X-ray Line Broadening from Filed Aluminium and Wolfram. Acta Metallurgica. 1953;1:22-31. doi: 10.1016/0001-6160(53)90006-6.
[20] Buckingham E. On Physically Similar Systems: Illustrations of the Use of Dimensional Equations. Physical Review. 1914;4:345-376. doi: 10.1103/PhysRev.4.345.
[21] Brennen CE. Cavitation and Bubble Dynamics. New York: Oxford University Press; 1995. doi: 10.1093/oso/9780195094091.001.0001.
[22] LaMer VK, Dinegar RH. Theory, Production and Mechanism of Formation of Monodispersed Hydrosols. Journal of the American Chemical Society. 1950;72:4847-4854. doi: 10.1021/ja01167a001.
[23] Moser WR, Giang T, Nguyen S, Kozyuk OV. A New Route to Cavitational Chemistry and Chemical Processing by Controlled Flow Cavitation. In: Process Intensification for the Chemical Industry. BHR Group; 1999. p. 173-187.
[24] Moser WR, Emerson SC, Krausz IM, Find J, Kozyuk OV. Synthesis, Characterization and Catalytic Properties of Nanostructured Catalysts by Controlled Flow Cavitational Synthesis. United Engineering Foundation Conference on Processing and Catalytic and Chemical Properties of Nanostructured Materials; Lahaina, Hawaii; January 2000. Conference presentation.
[25] Find J, Emerson SC, Krausz IM, Moser WR. Hydrodynamic Cavitation as a Tool to Control Macro, Micro, and Nano Properties of Inorganic Materials. Journal of Materials Research. 2001;16:3503-3513. doi: 10.1557/JMR.2001.0481.
[26] Moser WR, Marshik BJ, Kingsley J, Lemberger M, Willette R, Chan A, Sunstrom JE IV, Boye A. The Synthesis and Characterization of Solid State Materials Produced by High Shear Hydrodynamic Cavitation. Journal of Materials Research. 1995;10:2322-2335. doi: 10.1557/JMR.1995.2322.
[27] Sunstrom JE IV, Moser WR, Marshik Guerts B. General Route to Nanocrystalline Oxides by Hydrodynamic Cavitation. Chemistry of Materials. 1996;8:2061-2067. doi: 10.1021/cm950609c.
[28] Suslick KS, Mdleleni MM, Ries JT. Chemistry Induced by Hydrodynamic Cavitation. Journal of the American Chemical Society. 1997;119:9303-9304. doi: 10.1021/ja972171i.
[29] Kozyuk O. Hydrodynamic Cavitation. [Unpublished technical manuscript and supporting data] 2026.