
Technical publication
Back to publications
Other
Engineering Calculations for Rotor-Stator Mixers
okozyuk.com
Published
Updated
Read complete publication for whole-document Find and printing. Browser Find and native printing on this reader include only loaded content.
7 Hydrodynamic operating parameters
7.1 Throughput and opening area
An engineering velocity scale can be defined using the opening area multiplied by its discharge coefficient:
Equation (7.1) defines a discharge equivalent velocity. The actual mean velocity through a geometric section is the volumetric flow divided by that section area; the discharge coefficient additionally incorporates contraction and velocity losses. Consequently, the equation alone does not determine the physical velocity in the contracted jet. At fixed flow, a smaller simultaneous opening generally increases local velocity, pressure loss, and the likelihood of a pressure minimum. A preliminary screen should evaluate both minimum and mean overlap, while a transient model should use the instantaneous flow and opening together. Unequal flow distribution can produce individual jets substantially different from the area based estimate.
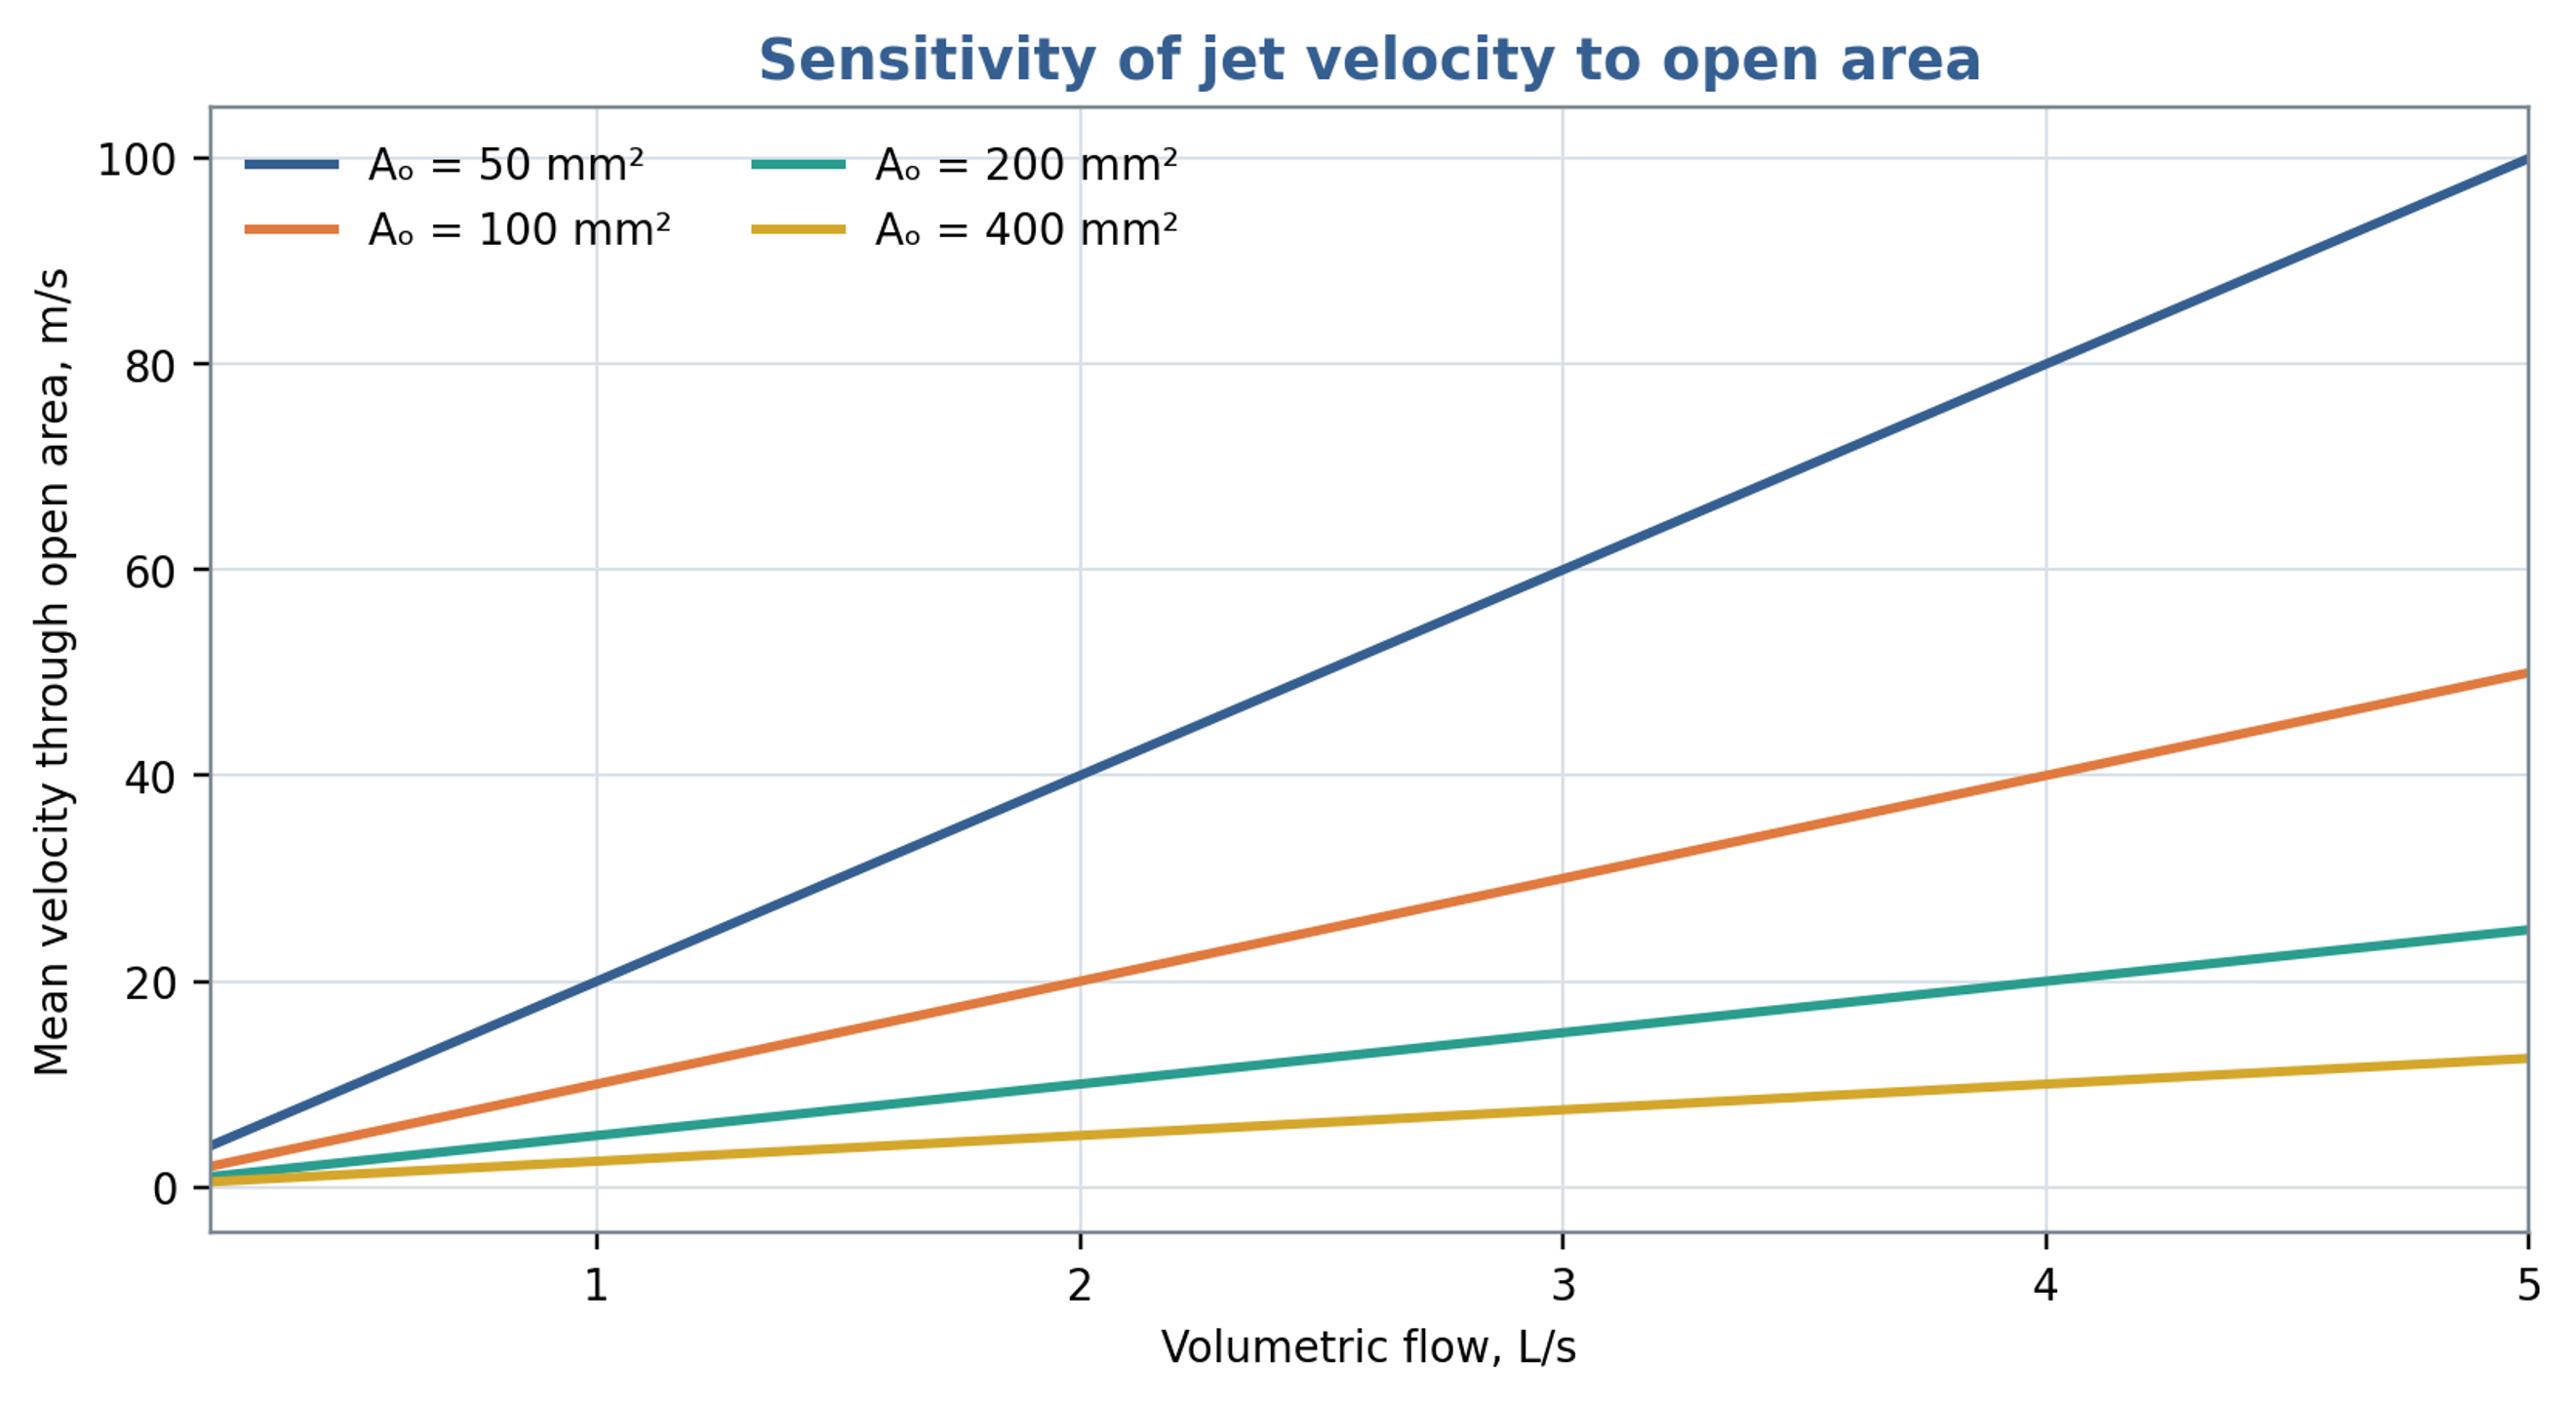
Figure 7.1. Area based mean passage velocity versus throughput for selected opening areas. The calculation uses in Equation (7.1), so the curves represent geometric section velocities.
7.2 Dimensionless pressure, flow and power
A pressure based Euler number is defined here without a factor of one half in the denominator:
For comparison using turbomachinery similarity, the dimensionless flow coefficient is
The corresponding pressure coefficient is
The power number based on shaft power is
Seminskyi and Vasylenko proposed Euler and Reynolds representations based on flow rate for a rotor pulse apparatus with internal recirculation [9]. Such definitions are useful when measured discharge through a specified region provides the most reproducible velocity scale. Comparisons nevertheless require identical conventions for velocity, length, pressure difference, and power. Geometry, flow coefficient, fluid rheology, and mechanical loss treatment should accompany any reported power number. A coefficient obtained with one set of definitions cannot be transferred quantitatively after those definitions have changed.
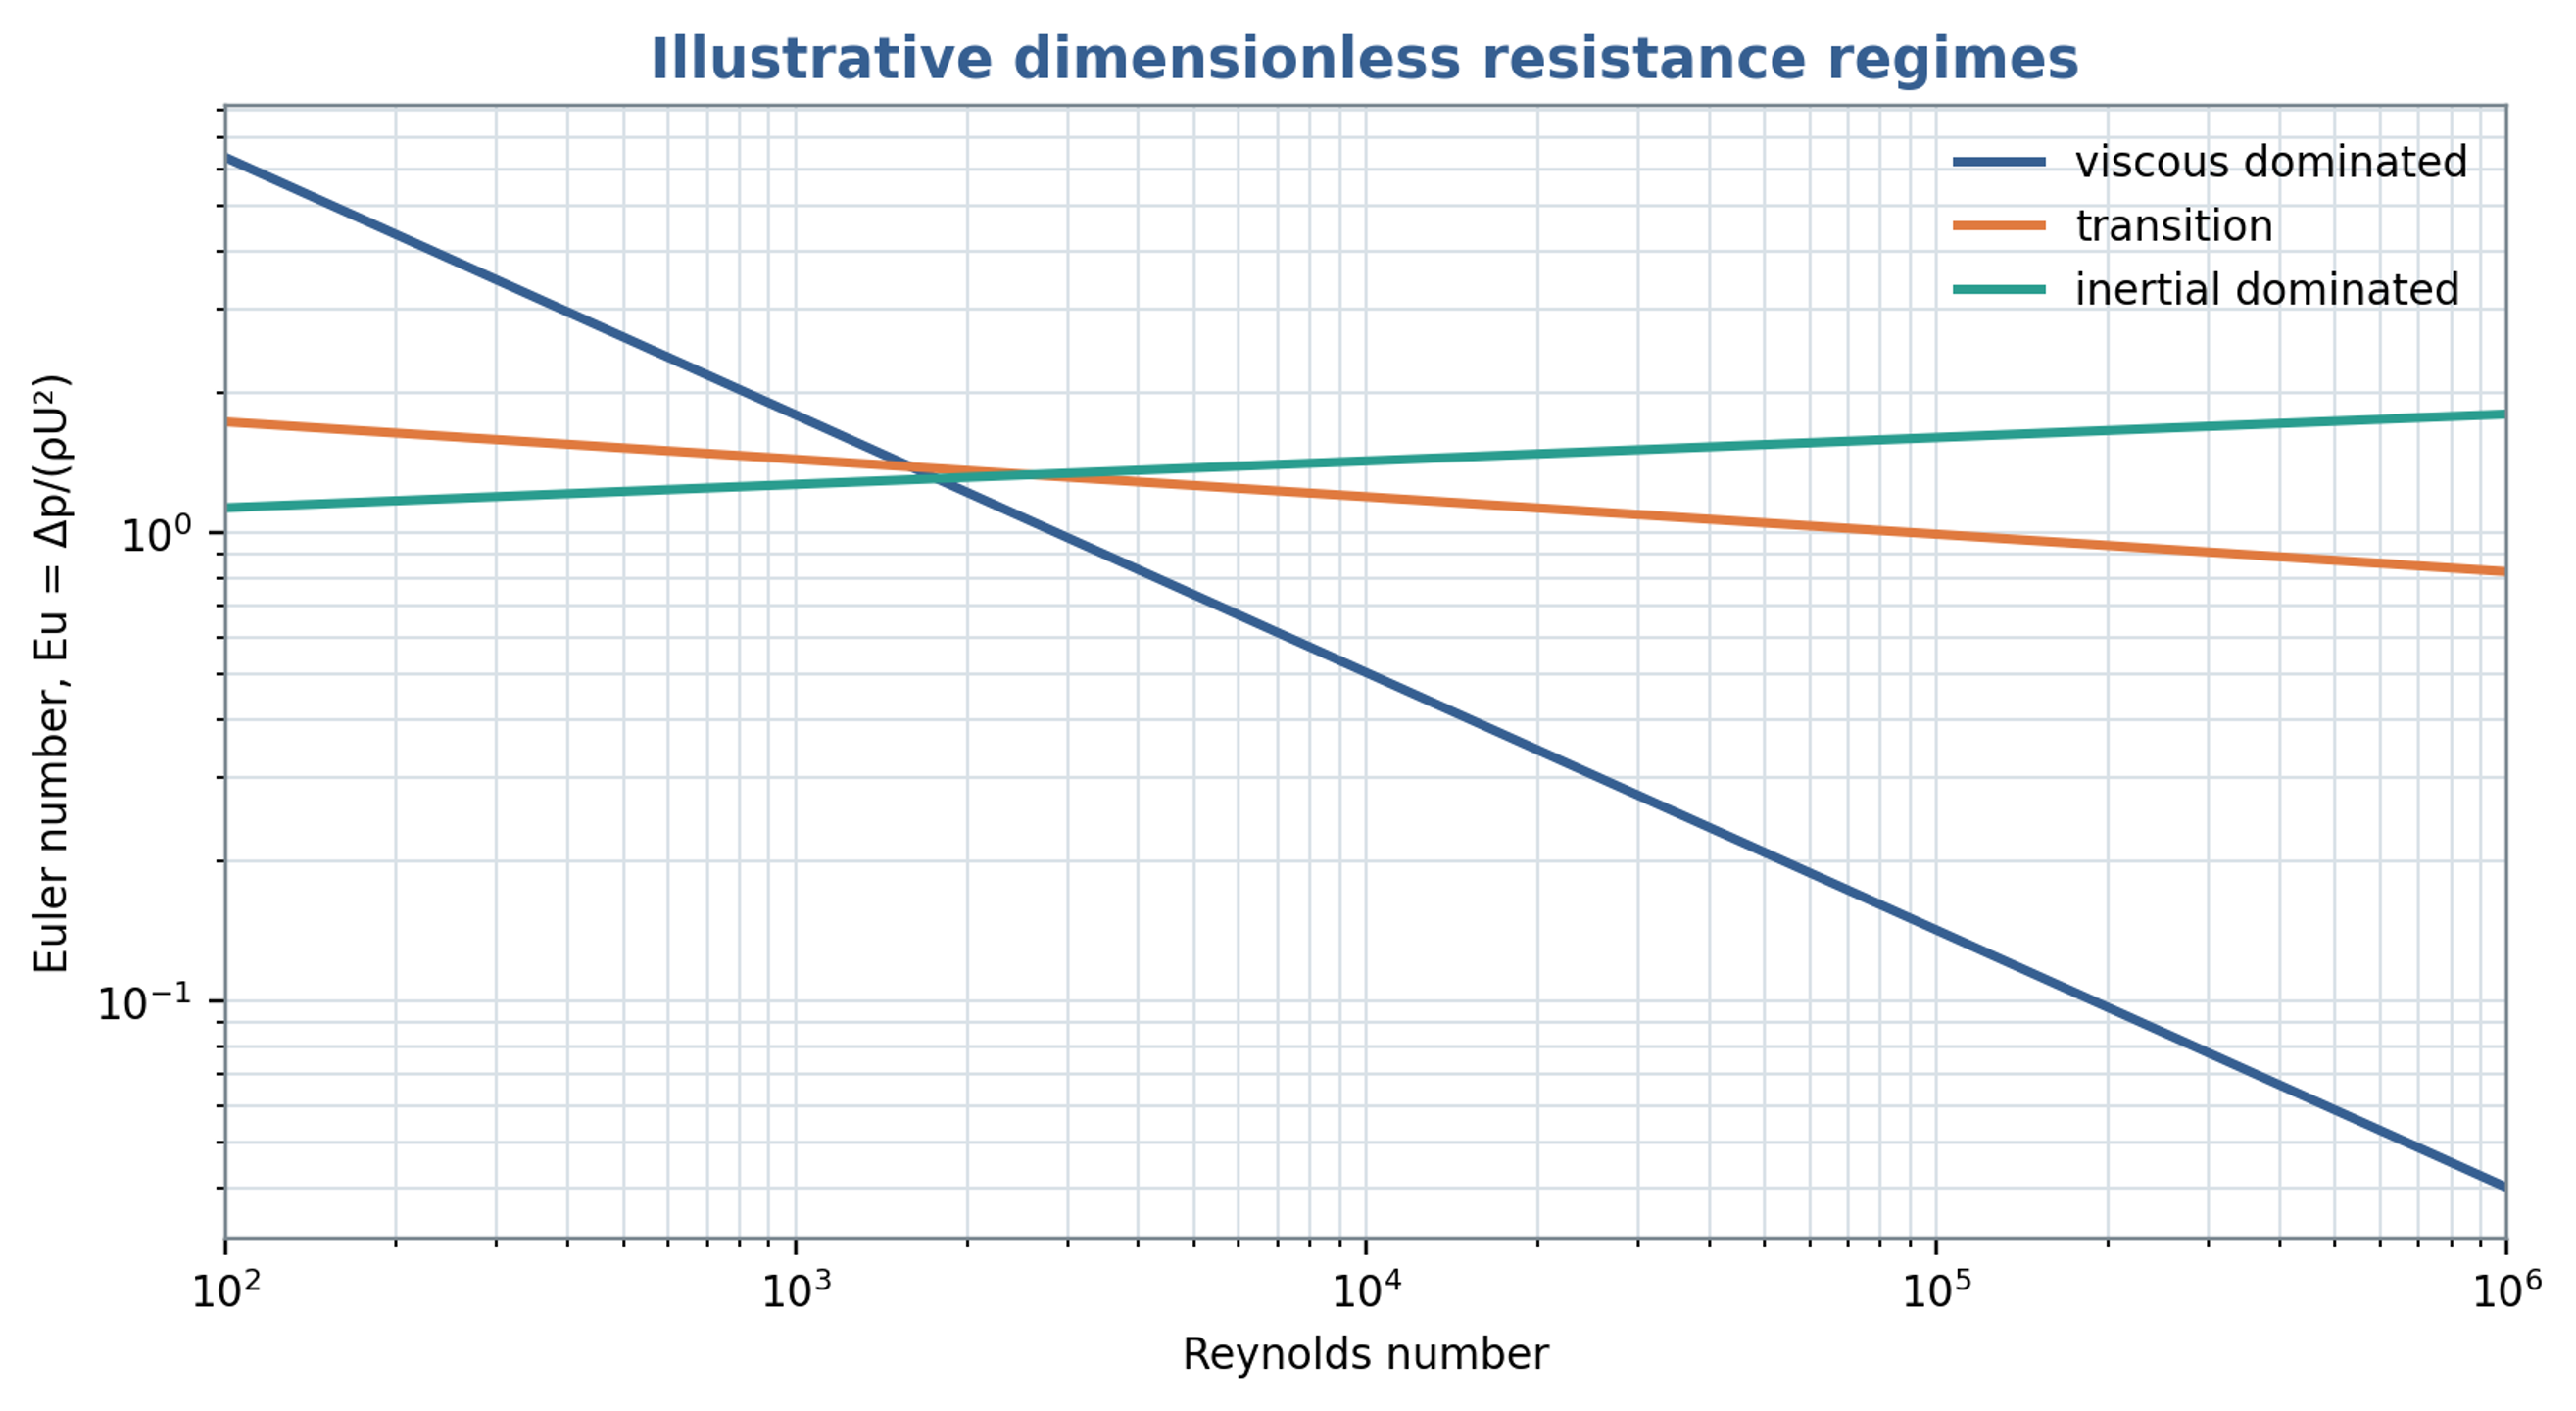
Figure 7.2. Illustrative viscous, transitional and inertial resistance trends. The curves are schematic comparisons and do not constitute fitted universal rotor stator correlations.
7.3 Residence time and nominal event count
For an active internal liquid volume and a representative mean discharge, the nominal residence time is
If denotes the representative local pulse frequency, a nominal event count during one traversal is
The event count is a screening estimate based on nominal residence and a selected frequency. Recirculation, bypassing, gas occupancy, and three dimensional trajectories produce a distribution of exposure histories. A frequency measured by a stationary sensor also need not coincide with the frequency experienced along every moving fluid trajectory. The estimate remains useful for comparing stage volume, discharge, and periodic forcing, provided it is not interpreted as an identical event count for every element of liquid.
7.4 Experimental trends in a single stage apparatus
Seminskyi and Kolobashkin investigated a single stage rotor pulse apparatus with a rotor diameter of 130 mm, 45 rotor slots, a radial clearance of 0.1 mm, a nominal rotational frequency of 50 , and a drive rated at 2.2 kW [10]. Within the tested water system, the reported dependencies were consistent with , , and . These trends resemble centrifugal machine similarity under comparable operating conditions. The reported hydraulic power contribution was no greater than approximately 4 percent for that apparatus. This value pertains to its particular geometry, test circuit, and definition of power. It indicates substantial internal fluid dissipation and mechanical losses while sufficient pressure head remained available to circulate the liquid.
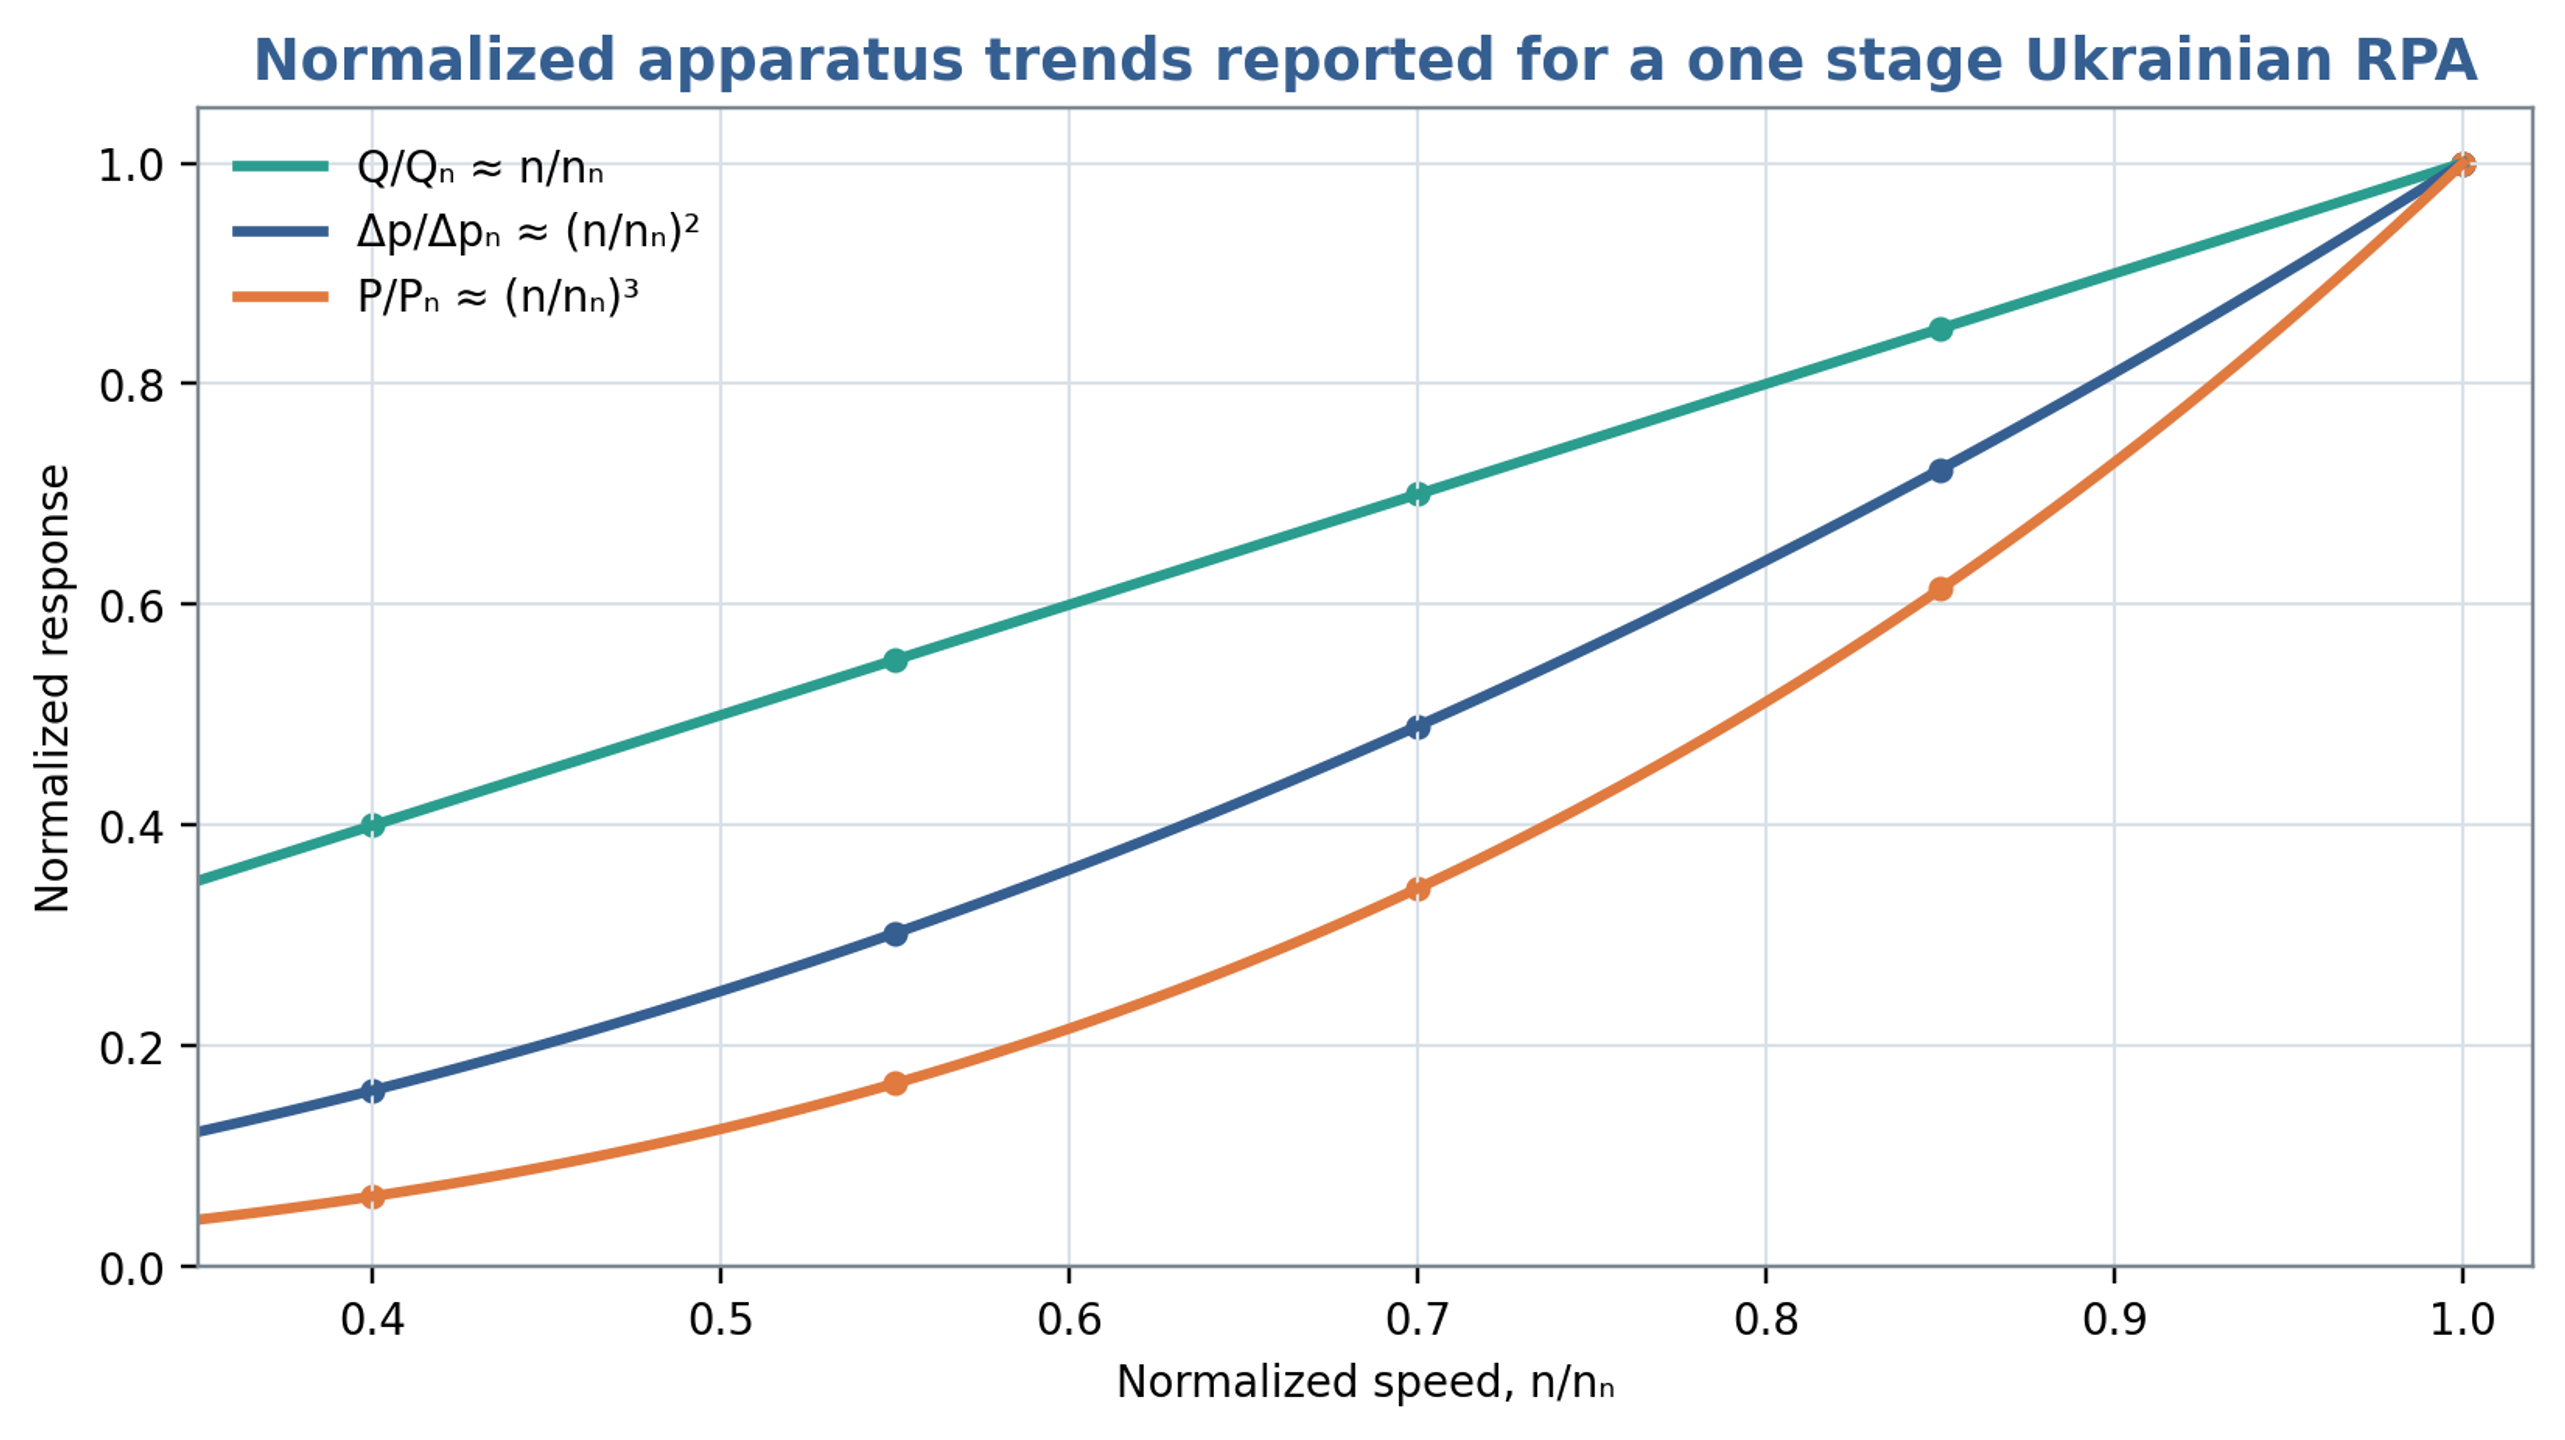
Figure 7.3. Normalized flow, pressure and power trends reconstructed from the proportional dependencies reported for the investigated single stage apparatus. The curves illustrate linear, quadratic and cubic speed scaling, respectively, rather than digitized experimental points [10].
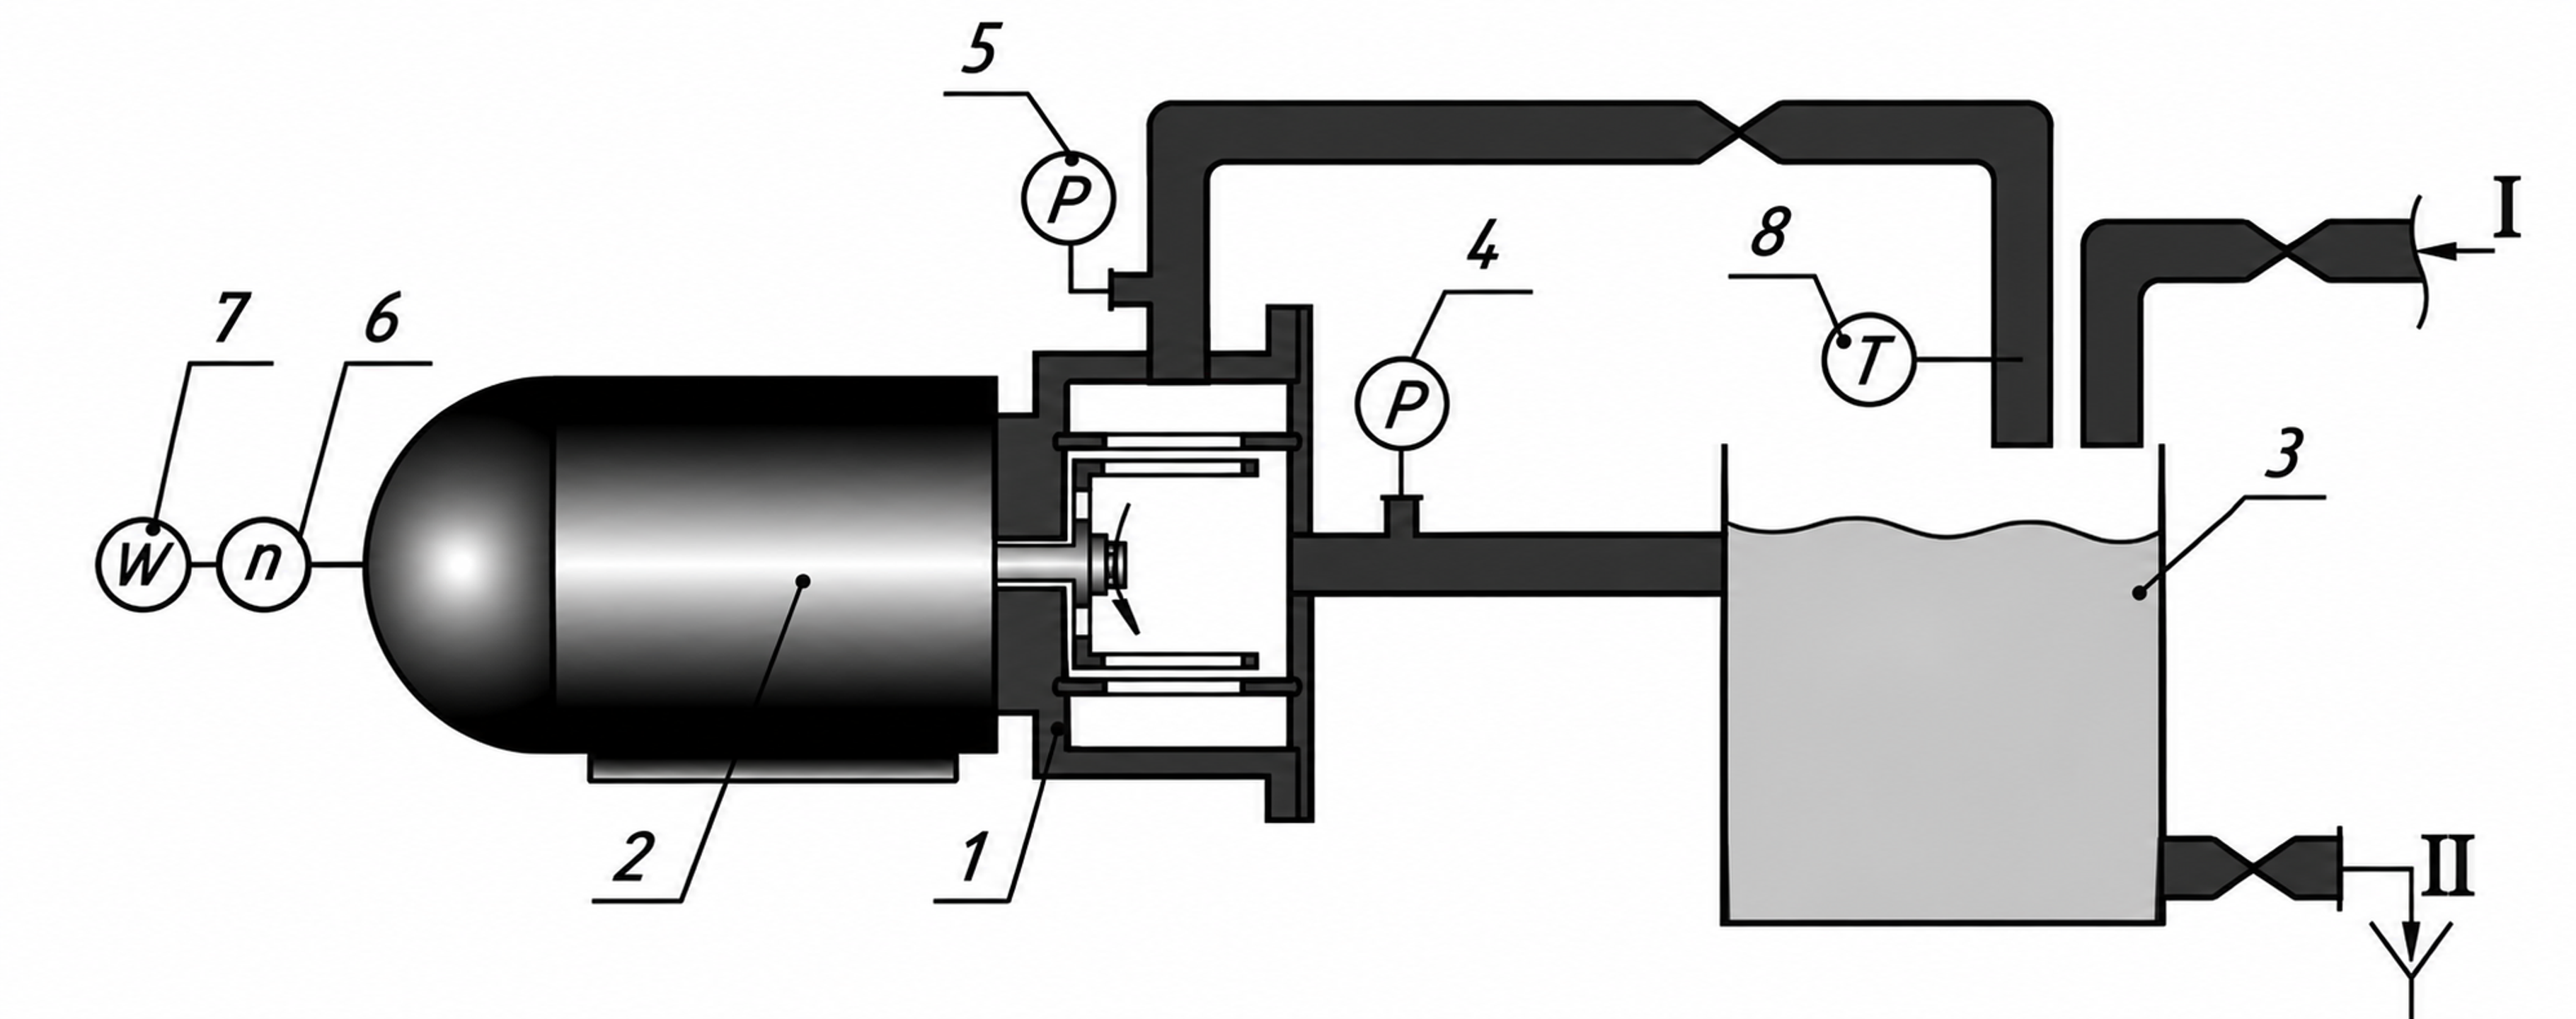
Figure 7.4. Experimental recirculation circuit used by Seminskyi and Kolobashkin [10]. Components: 1, pulsation module; 2, motor; 3, tank; 4, vacuum gauge; 5, pressure gauge; 6, tachometer; 7, wattmeter; 8, thermometer. Connections I and II indicate feed and drainage.
Table 7.1. Reported parameters of the one stage Ukrainian test apparatus [10]
| Parameter | Reported value |
|---|---|
| Rotor diameter | 130 mm |
| Rotor slots | 45 |
| Area of one slot | 124.5 mm² |
| Axial perforation area | 150.3 mm² |
| Radial gap | 0.1 mm |
| Maximum volumetric flow | m³/s |
| Nominal rotational frequency | 50 |
| Nominal drive power | 2.2 kW |
7.5 Batch circulation and imposed inline flow
External throughput and internal exchange through the stator represent different flow quantities. John et al. combined computational predictions with torque measurements to compare batch and inline operation of a common workhead. Their power and flow characterization accounted for recirculation through the stator openings as well as imposed pipeline flow. This distinction matters when a small net throughput coexists with repeated exchange inside the head. A common characterization was obtained under a restriction on the batch inlet geometry that prevented outward discharge through the base. Therefore, matching external throughput or specific shaft energy alone does not establish equivalent local exposure, droplet histories or pressure pulsations between the two operating modes [15].