
Technical publication
Back to publications
Other
Emulsification and Homogenization in Rotor-Stator Mixers
okozyuk.com
Published
Read complete publication for whole-document Find and printing. Browser Find and native printing on this reader include only loaded content.
6 Droplet deformation and breakup
Droplet deformation results from competition between external stresses and the restoring effects of interfacial tension and internal viscous motion. The same mixer can contain regions governed by different stress mechanisms, and individual droplets can move between them during processing. Dimensionless stress criteria, turbulent length scales, and response times are therefore considered together. The resulting equations are regime dependent approximations intended to support interpretation and calibration, rather than a universal prediction of every droplet trajectory.
6.1 Dimensionless stress criteria
Dimensionless stress groups compare the forces that promote deformation with the forces that restore the droplet shape. Breakup requires both a sufficient stress magnitude and an exposure long enough for substantial deformation to develop. Inertia, continuous phase viscosity, dispersed phase viscosity, density ratio, and interfacial tension enter these comparisons in different ways. The Weber number compares an inertial stress scale with the capillary resistance:
where is a relative velocity scale appropriate to the droplet and surrounding flow. Rotor tip speed and droplet scale velocity fluctuations represent different choices and should be distinguished when comparing correlations.
The capillary number expresses the ratio of a viscous stress scale to capillary resistance:
The Ohnesorge number measures the contribution of dispersed phase viscosity relative to inertial and capillary effects:
The viscosity ratio separately characterizes the contrast between internal and external viscous resistance:
The corresponding density ratio is
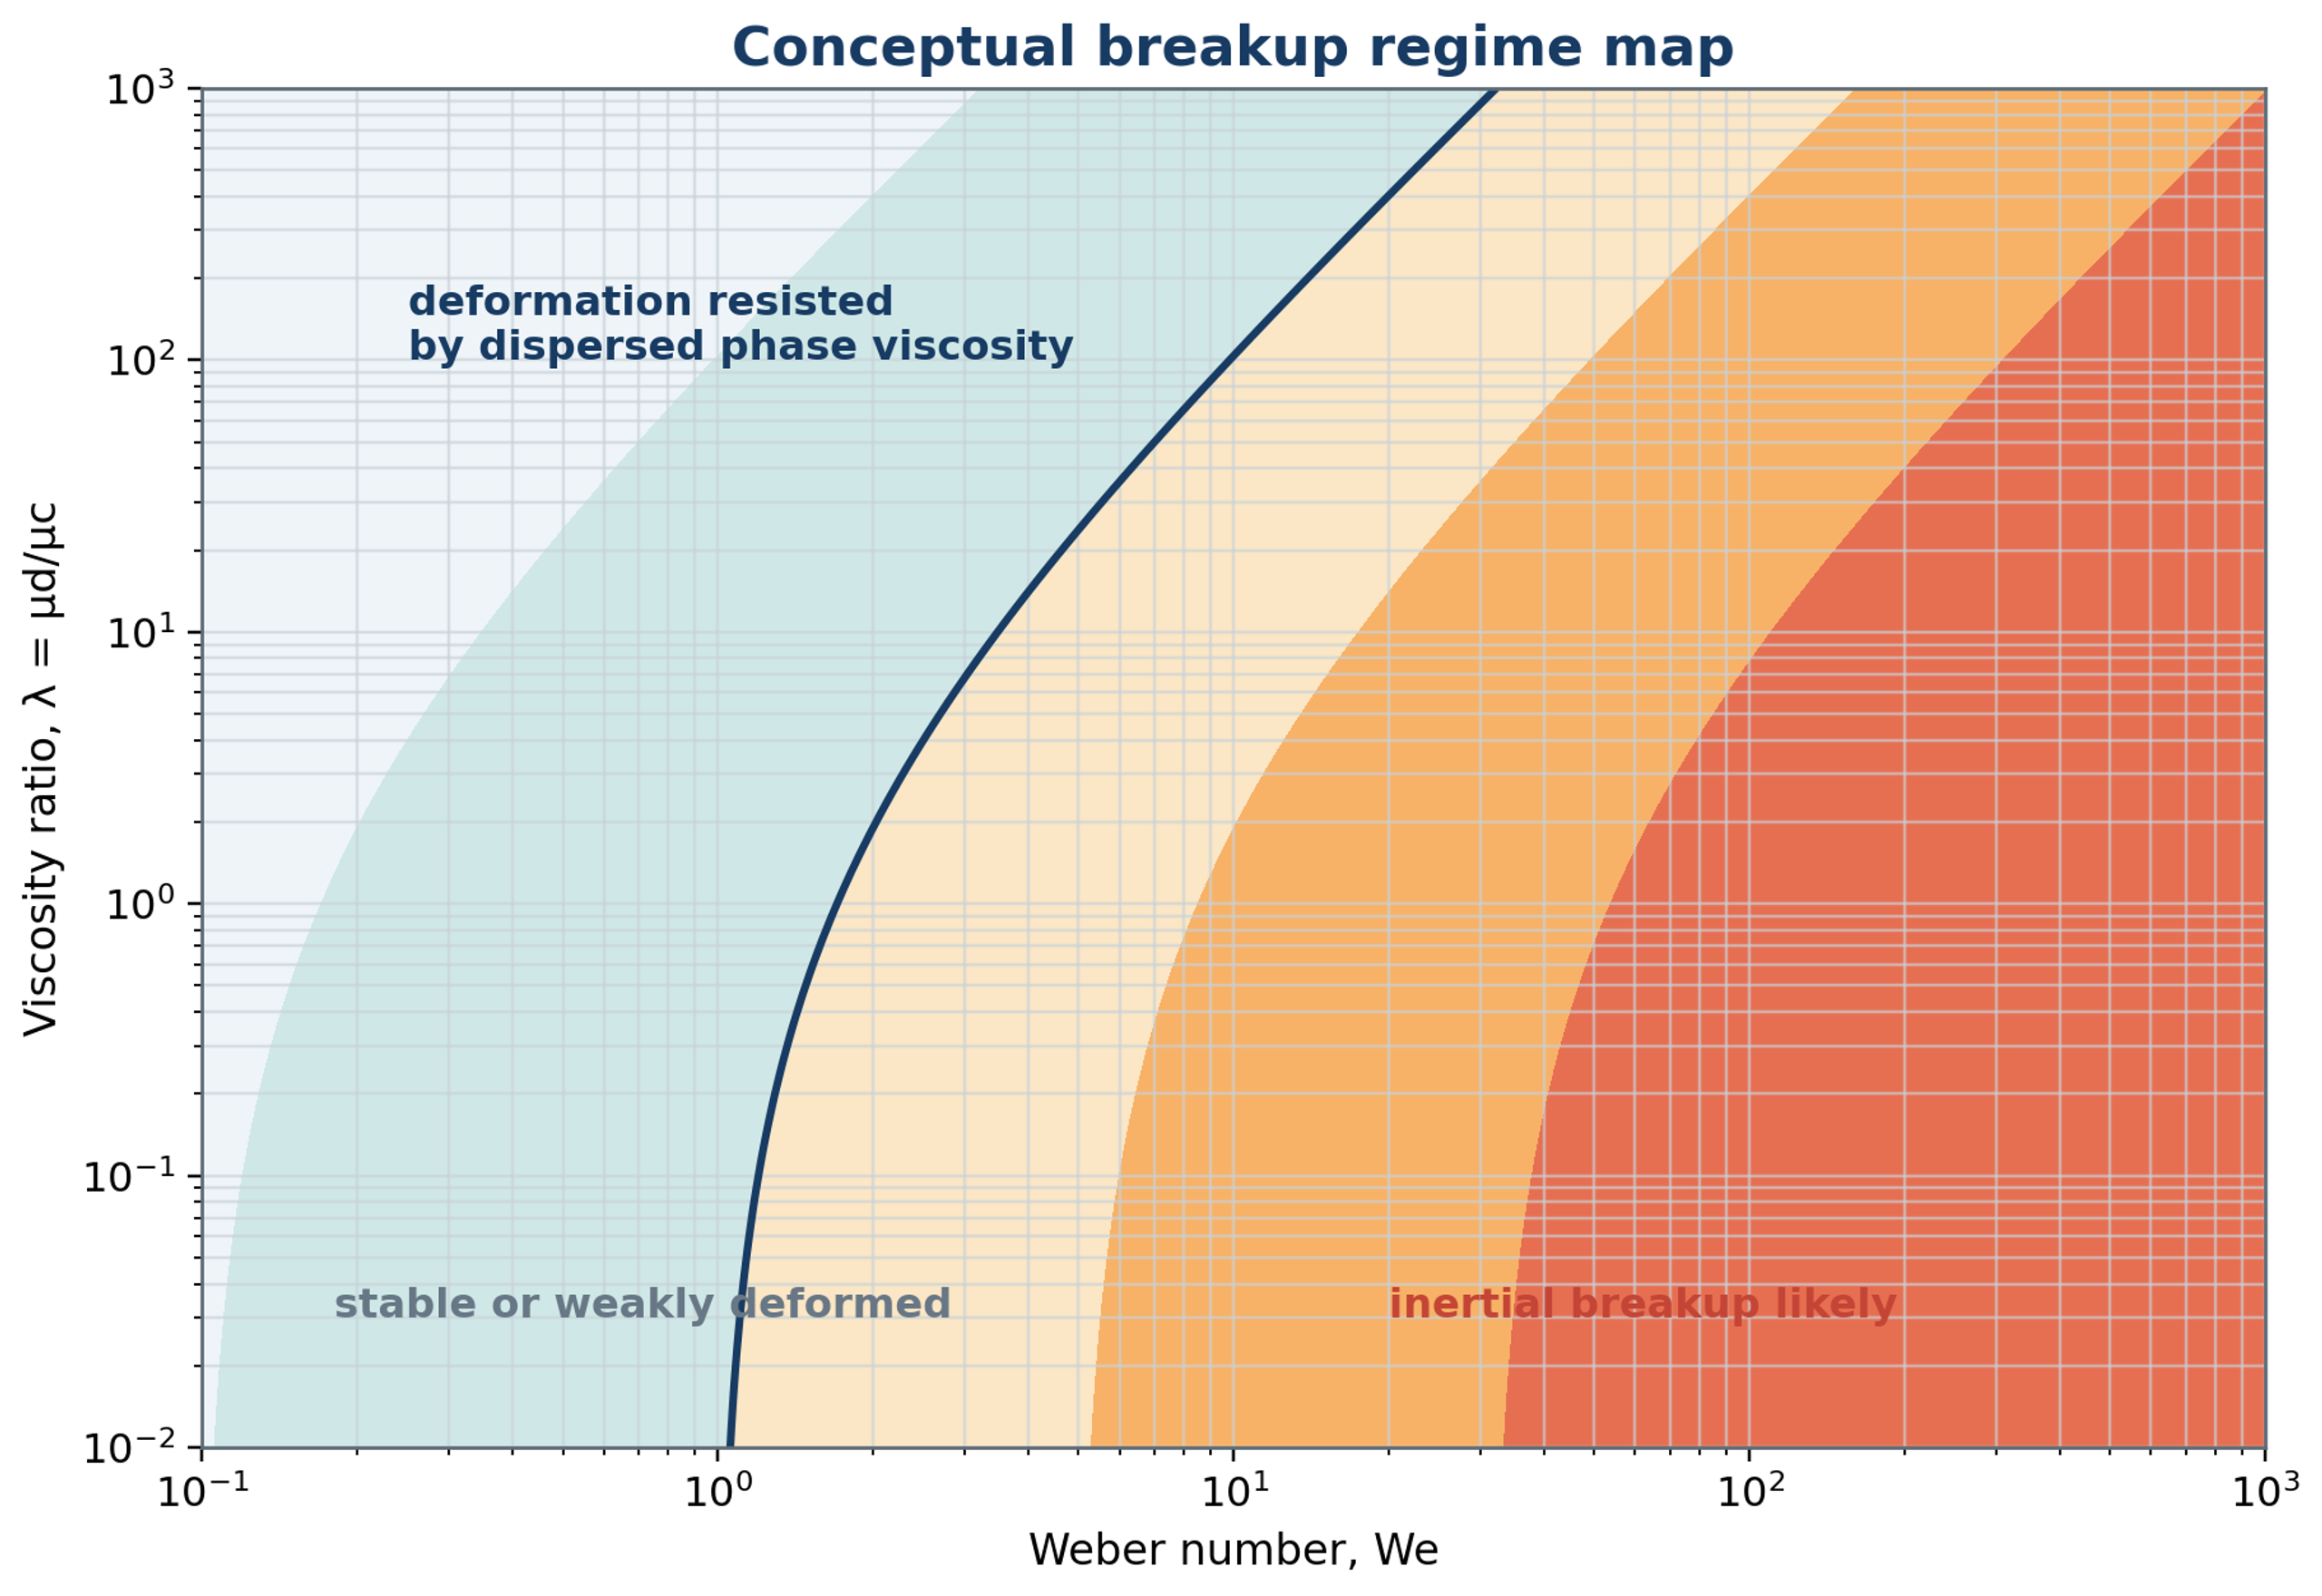
Figure 6.1. Conceptual map of droplet response in terms of Weber number and viscosity ratio. The boundaries and shaded regions are schematic and are not calibrated transition criteria. Actual breakup probability depends on stress fluctuations, exposure, and interfacial properties.
Critical values of these groups depend on flow type, deformation history, stress duration, interfacial mobility, confinement, and viscosity ratio. In turbulent flow, individual droplets experience different fluctuations even at the same mean operating condition. A droplet may survive repeated weak events and fragment during a less frequent intense event [24, 25]. The groups therefore support regime identification and probabilistic breakup models rather than a universal deterministic threshold. A fitted critical value should be reported with the velocity definition, observation interval, and formulation used to obtain it.
6.2 Turbulent length and time scales
Turbulent length and time scales help identify whether a droplet experiences inertial fluctuations or a locally smooth velocity gradient. This distinction is needed before applying a breakup correlation. The relevant scales depend on continuous phase viscosity and the local rate of kinetic energy dissipation, which can differ substantially from an average over the vessel. The continuous phase kinematic viscosity is
For a local energy dissipation rate per unit mass , the Kolmogorov length is
The associated Kolmogorov time is
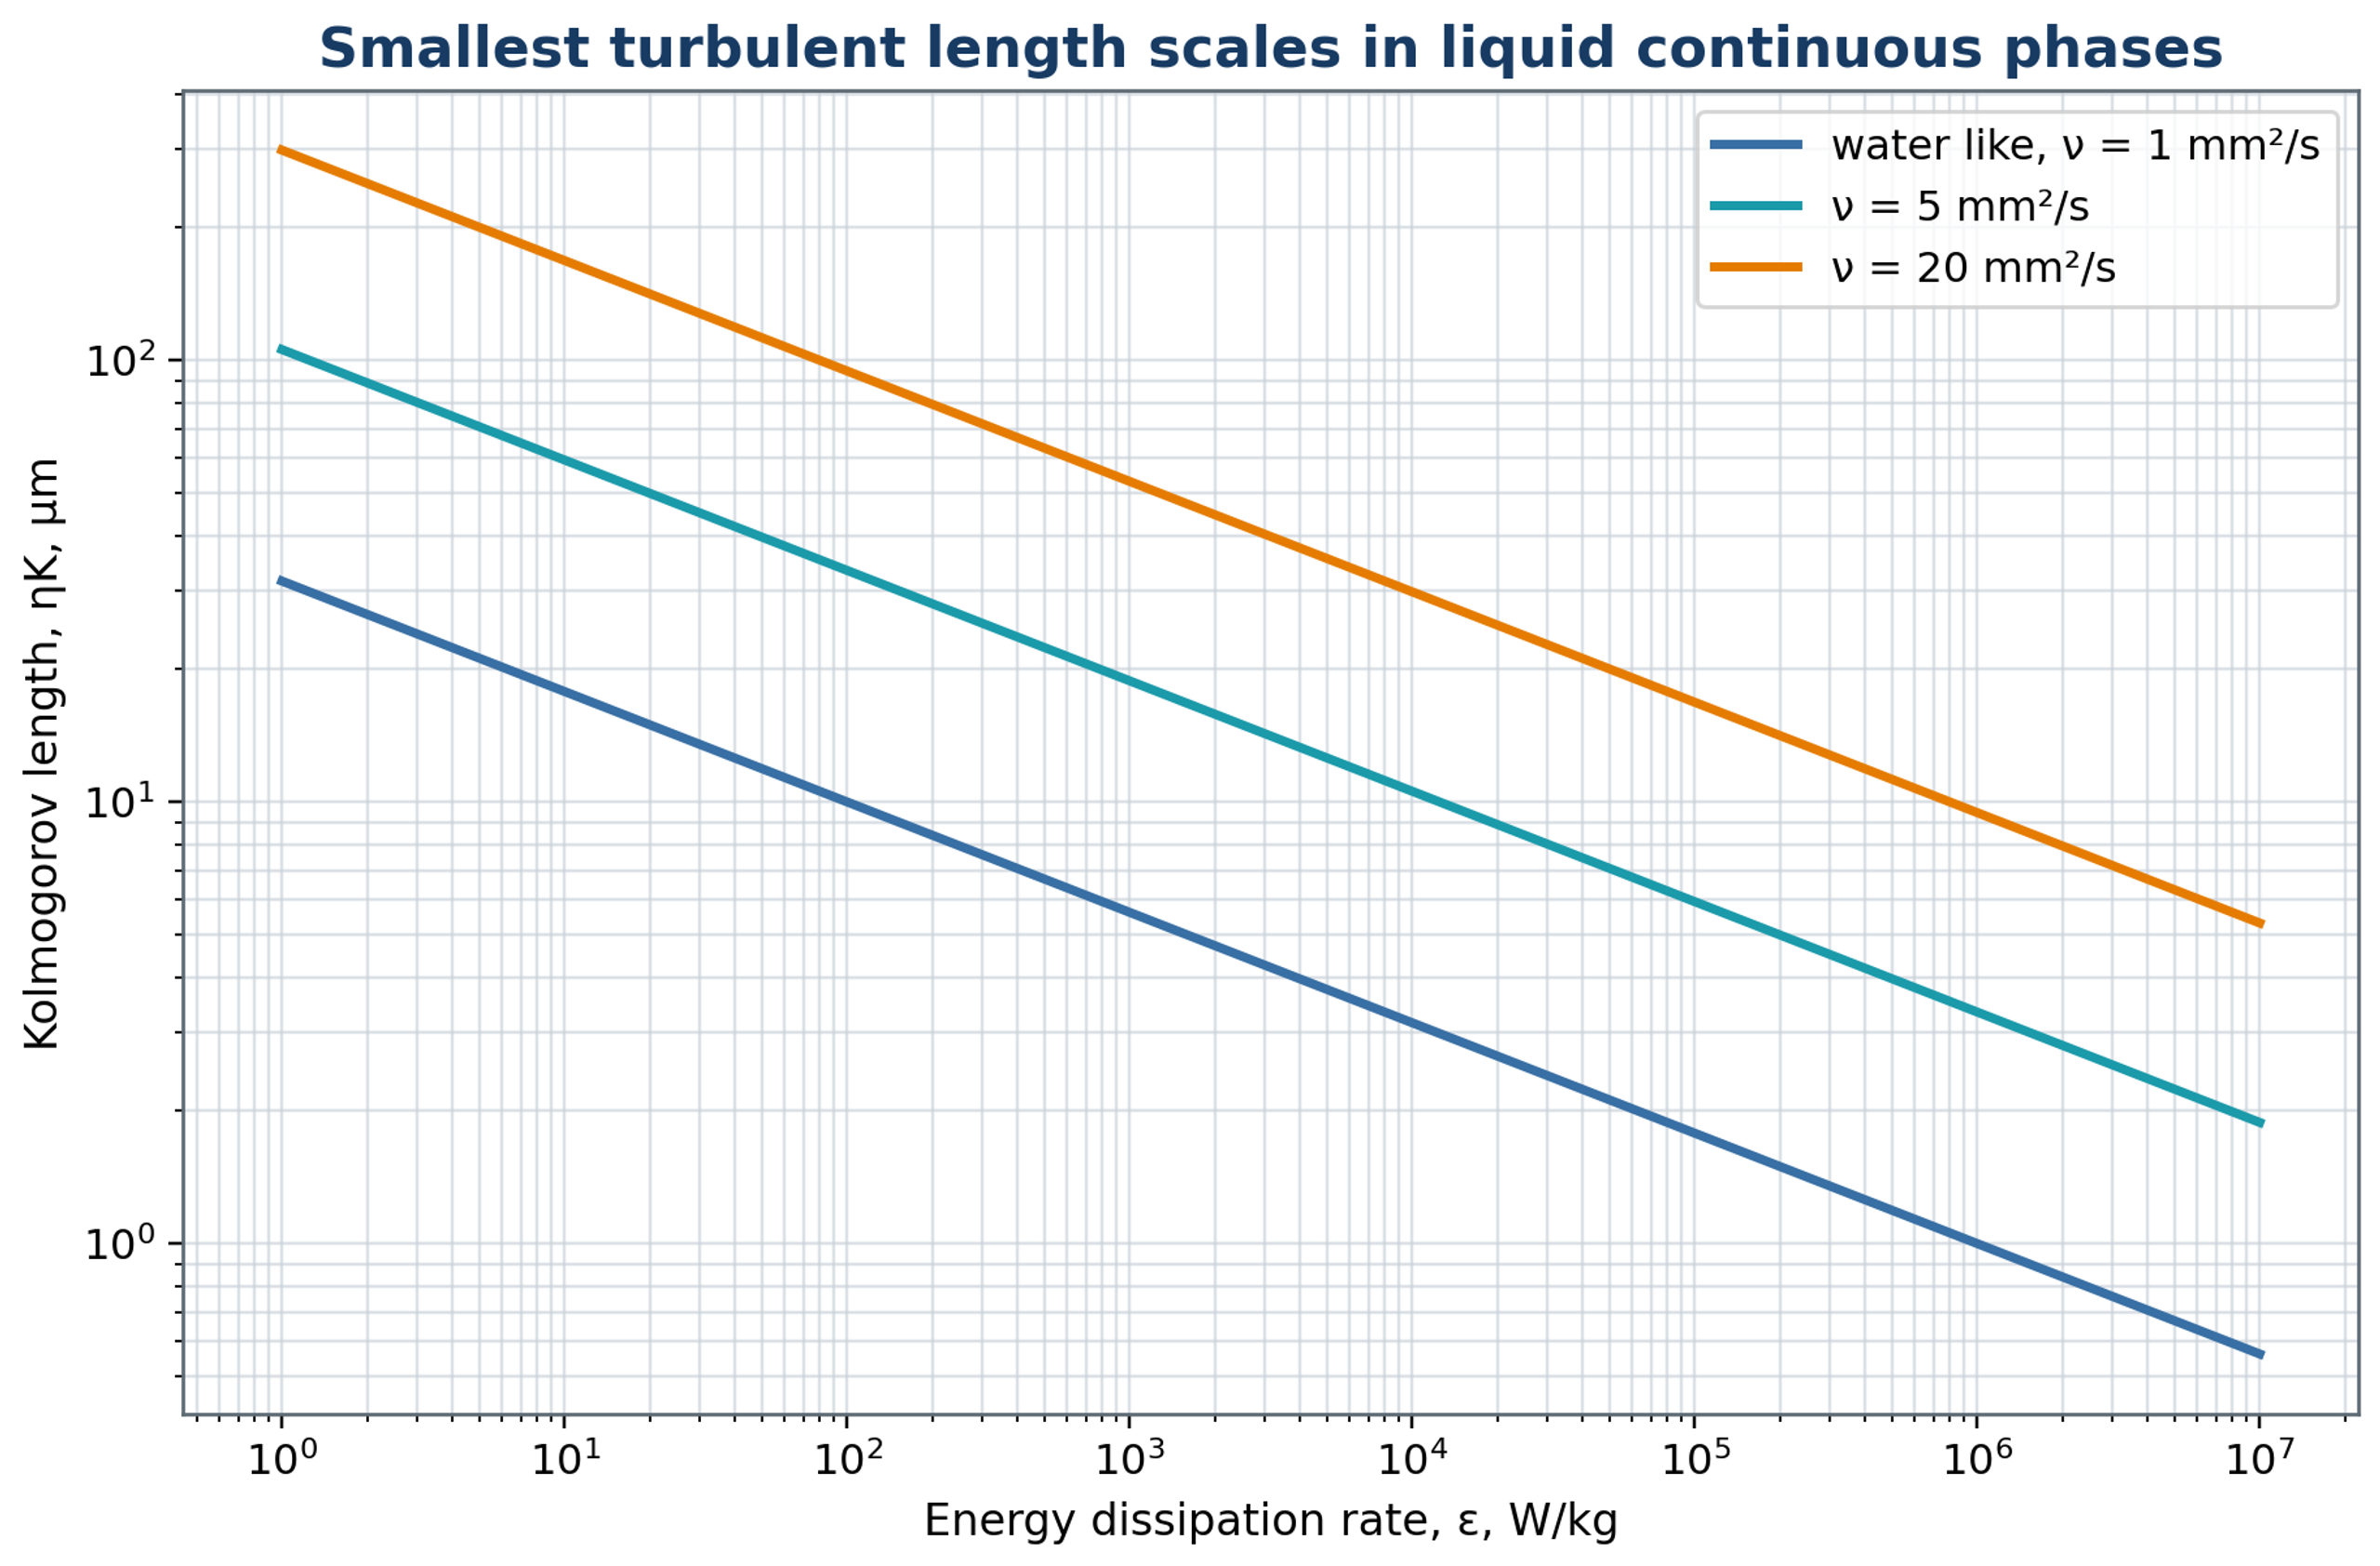
Figure 6.2. Calculated dependence of the Kolmogorov length scale on energy dissipation for the representative continuous phase kinematic viscosities indicated in the plot, following equation (6.7).
For droplets within the inertial subrange, larger than the dissipative scale but smaller than the energy containing eddies, the velocity difference across a droplet scales as
The corresponding turbulent inertial stress scale is
The capillary restoring stress is of the order
Equating the turbulent inertial and capillary stress scales gives an estimate of the maximum stable diameter:
where is a coefficient whose fitted value depends on the definitions and the experimental regime. Its transferability must be established for the relevant geometry and formulation.
Equation (6.12) is a Kolmogorov Hinze type relation. It predicts a decrease in the characteristic limiting size as dissipation increases or interfacial tension decreases, within the assumptions of turbulent inertial breakup. It does not explicitly account for finite residence time, adsorption, coalescence, confinement, or cavitation. Moreover, maximum stable diameter is not automatically identical to a measured Sauter mean. Using average shaft power to estimate local dissipation without specifying the active volume can absorb unresolved geometry effects into the fitted coefficient [3, 4, 8].
Formulation effects remain relevant even within an experimentally identified turbulent inertial regime. Campardelli and coauthors studied emulsions prepared with paraffin, soybean oil, and isopropyl myristate over several rotational speeds and oil fractions. Their regression framework included dispersed phase concentration and physical properties in addition to the flow related variables [4]. This provides experimental support for testing correlations across more than one liquid pair and composition. A successful fit for a single formulation should not be treated as evidence that viscosity, phase fraction, or interfacial properties can be omitted during transfer to another product.
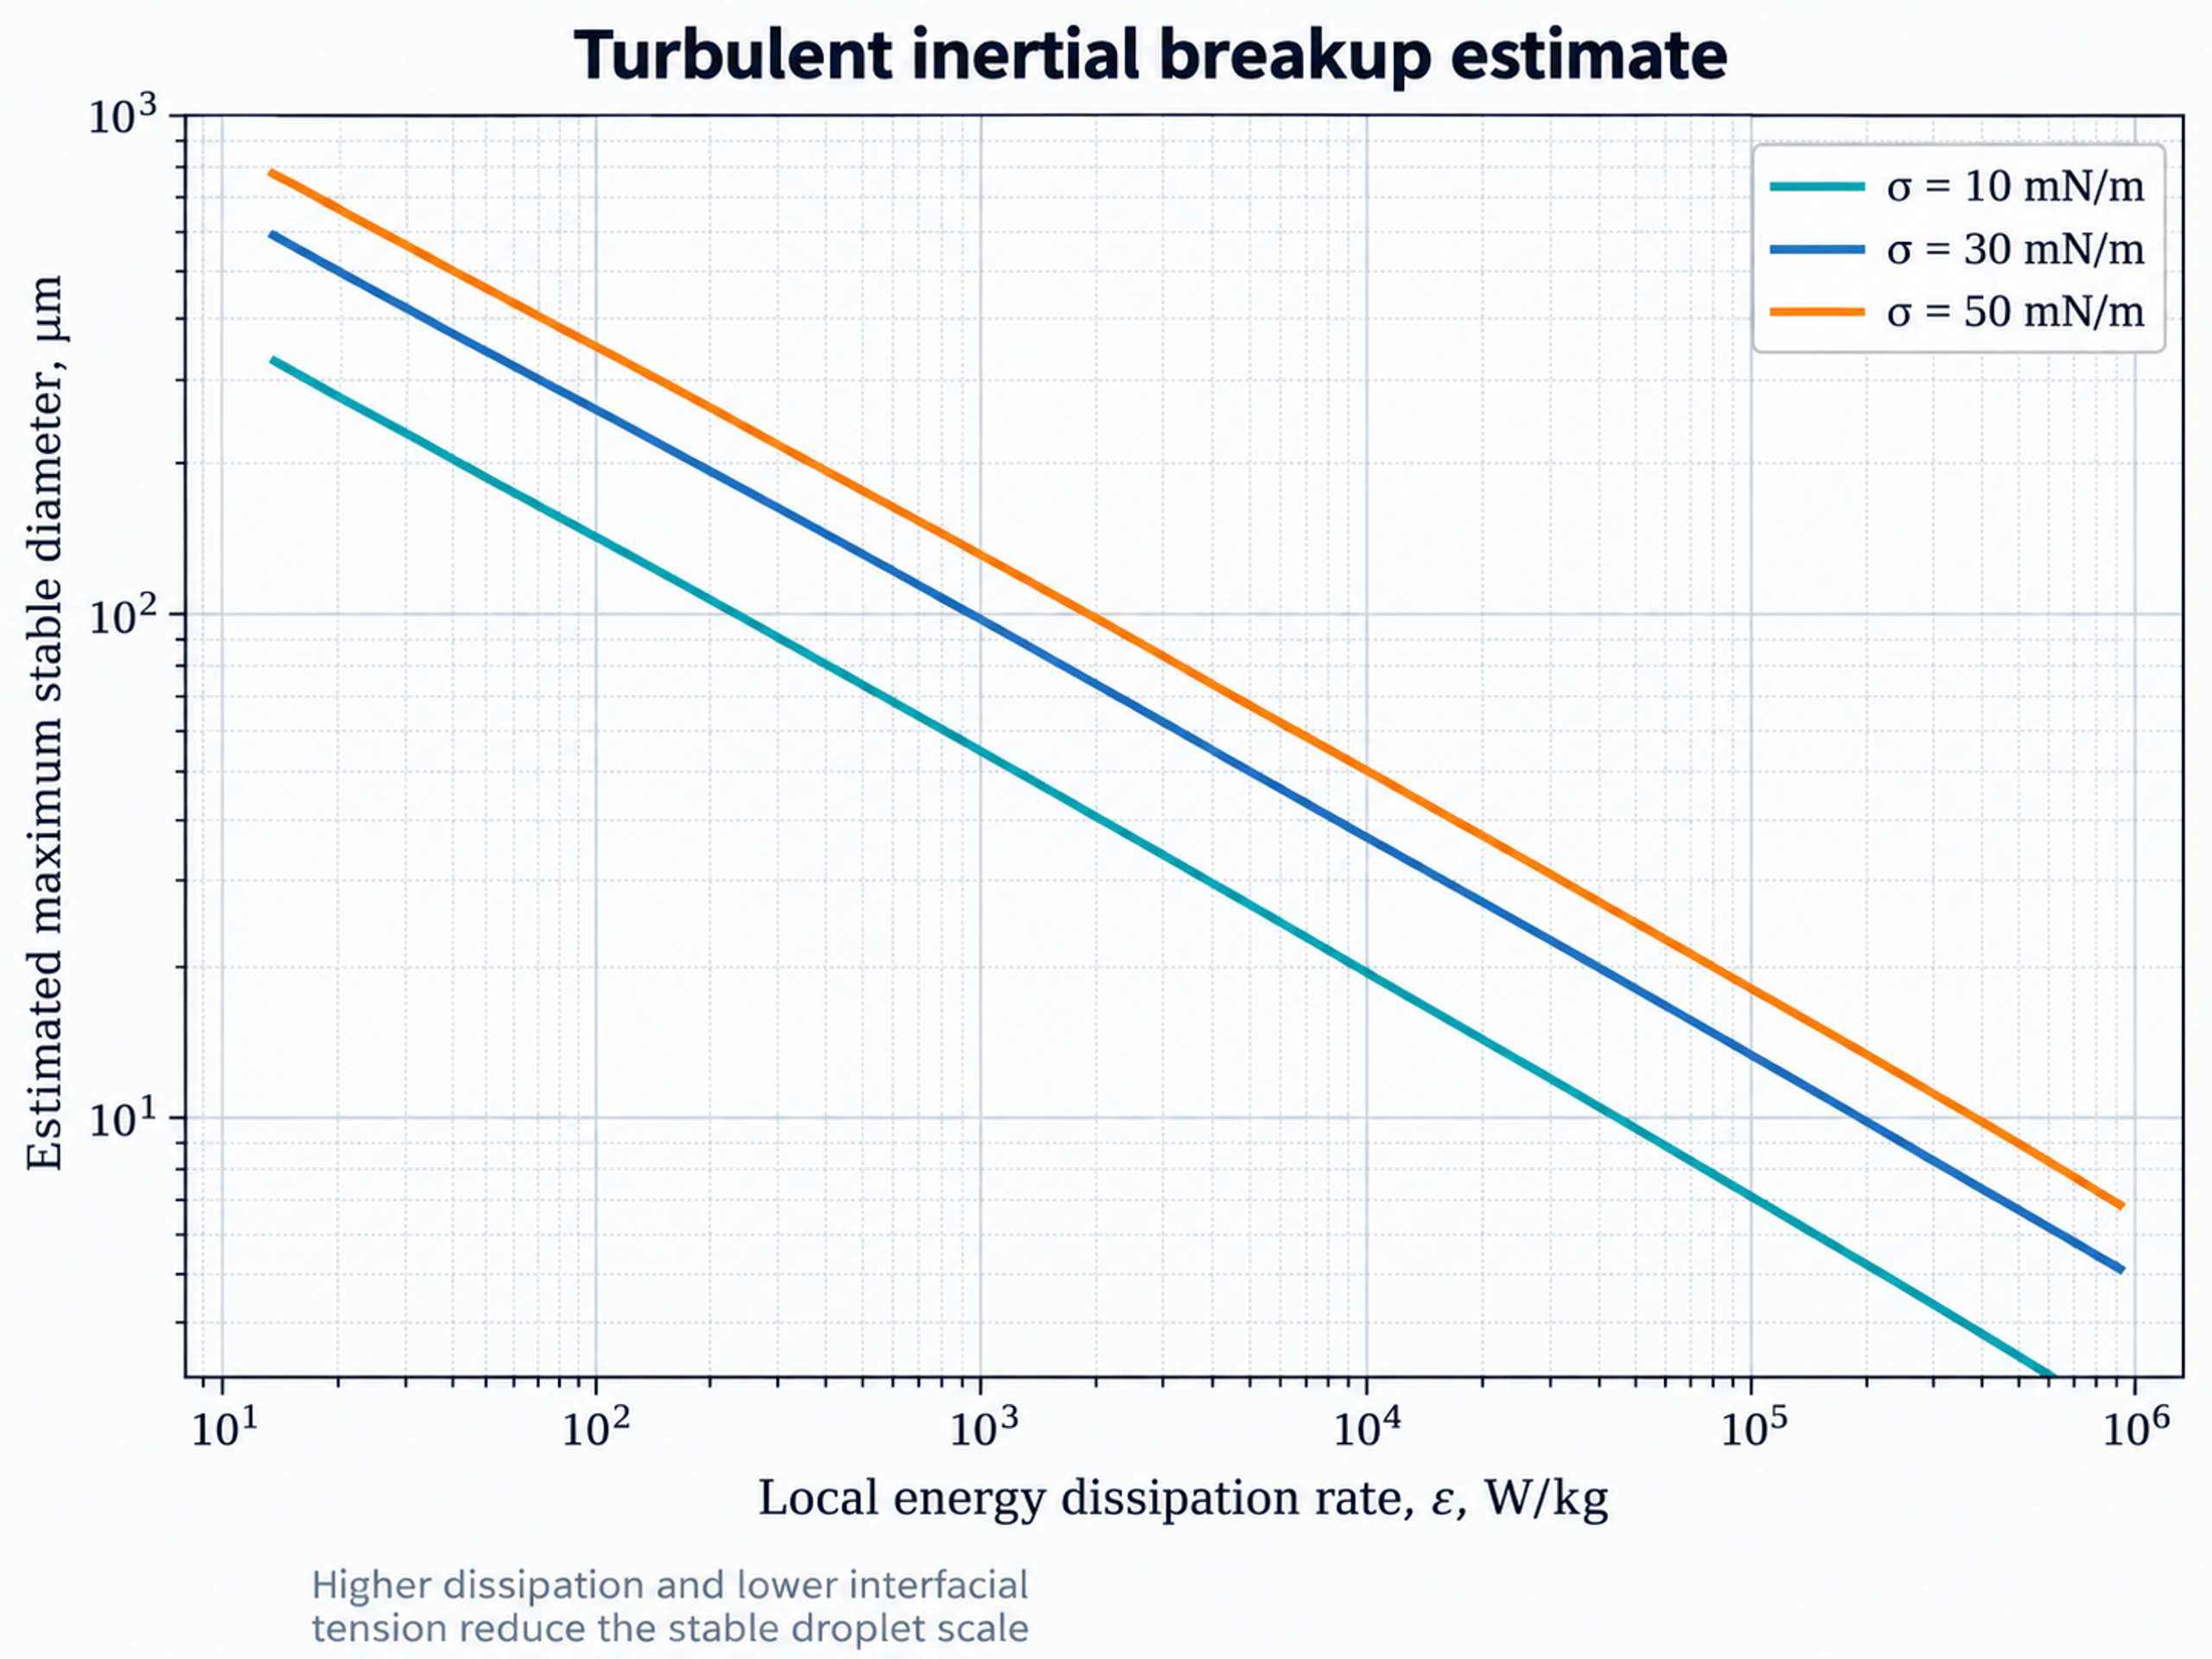
Figure 6.3. Illustrative turbulent inertial dependence of a maximum stable droplet scale on local energy dissipation and interfacial tension, consistent with equation (6.12). The curves use representative properties and do not directly predict a measured Sauter mean diameter.
A capillary response timescale can be estimated from the balance of continuous phase inertia and interfacial tension:
The inertial eddy timescale associated with the droplet diameter is
Substantial deformation requires adequate disruptive stress and sufficient time for the droplet to respond. A short pulse and a longer exposure with the same peak stress need not produce the same outcome. The ratio of stress duration to capillary response time is
which provides a timescale comparison rather than an independent universal breakup threshold. In these expressions denotes a capillary response time; in the preceding stress balance the same source symbol denotes a capillary stress. The physical quantity and units must therefore be identified from the equation context.
6.3 Viscous breakup regime
When the droplet is smaller than the smallest turbulent eddies, the surrounding velocity field is approximately smooth over its dimensions. Deformation can then be described in terms of a local strain rate and viscous stress rather than an inertial velocity difference across the droplet. The attainable size still depends on viscosity ratio, flow type, and interfacial response. A simplified estimate of a limiting diameter in this regime is
The effective strain rate must represent the deformation actually experienced by the droplets and need not equal the nominal ratio of tip speed to clearance. It may be estimated from validated simulations, local velocity measurements, or an experimentally calibrated relation. In studies by Gazolu Rusanova and coauthors, rapidly adsorbing modified starch supported stable droplets in the approximate range of 100 to 500 nm, whereas gum Arabic produced larger droplets when coalescence remained substantial [6]. The reported results illustrate the need to combine a viscous breakup description with adsorption, temperature, and droplet interaction effects.
6.4 Breakup morphology and fragment distribution
Breakup morphology describes the sequence by which a deformed parent droplet produces its daughter population. Small oscillations may relax without fragmentation. Larger deformations can produce membranes, rims, sheets, or ligaments, while binary breakup creates two principal daughters and more extensive fragmentation creates several. These modes need not occur at the same frequency in all rotor stator flows. Numerical and experimental studies show that stress magnitude, viscosity ratio, and exposure history influence the observed form of breakup and the resulting distribution of daughter sizes [25, 27].
If b(v | ) denotes the expected number of daughter droplets per unit daughter volume produced by a parent of volume , conservation of dispersed volume requires
where v is daughter volume and is parent volume. The integral weights daughter number by daughter volume; b is therefore not a probability density normalized to unity unless it is rescaled explicitly.
The daughter distribution affects the coarse fraction and distribution width independently of the mean diameter. Two devices can yield similar values of while producing different high percentiles, spans, and subsequent stability. A comparison of mixer performance should therefore include the full measured distribution and any evidence of distinct droplet populations.
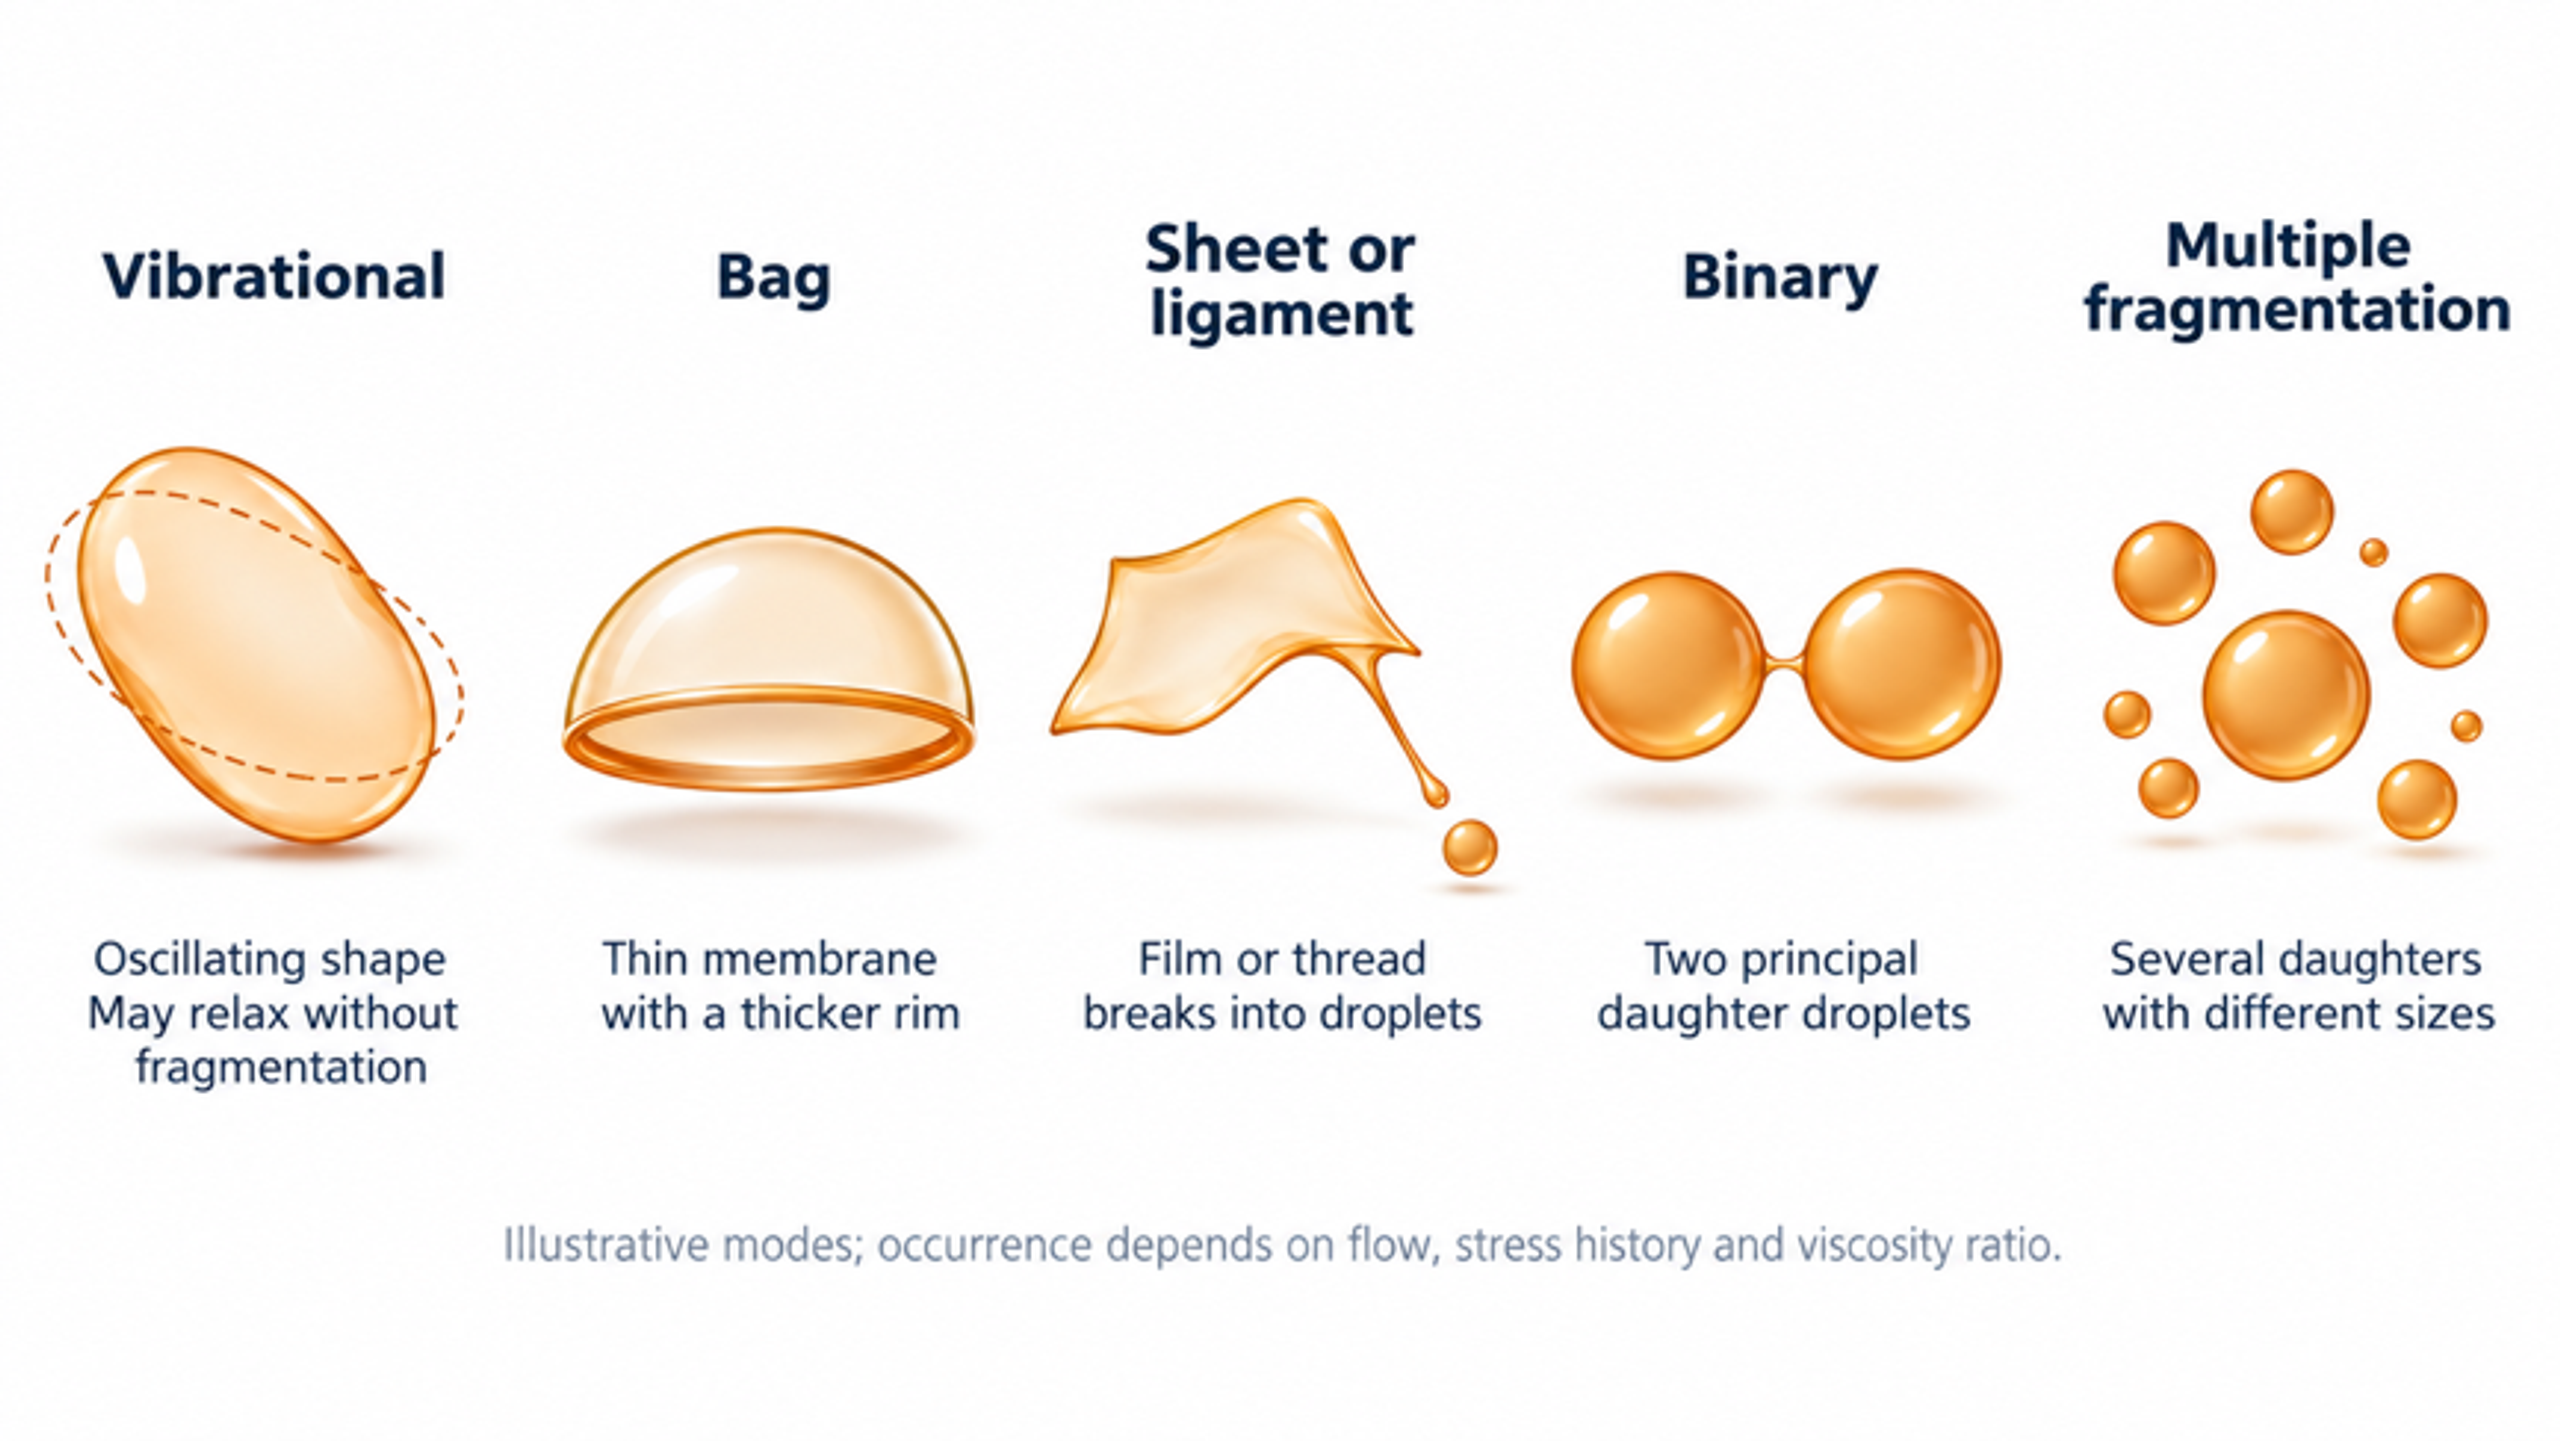
Figure 6.4. Illustrative droplet deformation and fragmentation morphologies. Vibrational deformation, bag formation, sheet or ligament extension, binary fragmentation, and extensive fragmentation represent possible responses to different stress histories. Their occurrence is regime dependent, and the drawings do not define a universal sequence.