
Technical publication
Back to publications
Other
Emulsification and Homogenization in Rotor-Stator Mixers
okozyuk.com
Published
Read complete publication for whole-document Find and printing. Browser Find and native printing on this reader include only loaded content.
Emulsification and Homogenization in Rotor-Stator Mixers
O. Kozyuk, Ph.D.
Abstract
Emulsification in rotor-stator mixers involves the formation of new interfaces between immiscible liquids and the stabilization of those interfaces against coalescence. Fluid passing through the mixing head experiences acceleration, deformation within rotor passages and clearances, discharge through stator openings, and subsequent redistribution in the surrounding liquid. Depending on geometry and operating conditions, the stress history includes viscous shear, extension, turbulent fluctuations, periodic pressure variations, and, in some devices, hydrodynamic cavitation. The resulting droplet population therefore reflects the combined effects of hydrodynamic stress, exposure time, phase properties, and interfacial transport. A description based solely on rotational speed or nominal clearance is insufficient to establish the final distribution or its stability.
This article presents a scientific and engineering framework for emulsification and homogenization in immersed batch mixers and enclosed flow through devices. Droplet size statistics, interfacial area, adsorption, deformation criteria, population balances, power consumption, thermal effects, physical stability, and scale up are considered within a common formulation. Particular attention is given to the distinction between the capacity to disrupt droplets and the capacity to stabilize the newly formed interface. Published research, accessible theses, technical documentation, and rotary pulsation studies are used to identify the assumptions and limitations of the governing relationships. A worked example illustrates the calculation of interfacial area, emulsifier demand, equivalent pass number, specific energy, and temperature rise. The analysis indicates that reliable process design requires simultaneous control of local stress, exposure distribution, adsorption kinetics, and heat generation. The example and conceptual figures provide engineering illustrations; they do not constitute validation of a specific formulation or commercial mixer.
Keywords: rotor-stator mixer; emulsification; homogenization; droplet breakup; interfacial stabilization; population balance; specific energy; scale up.
1 Introduction
Emulsification and homogenization are related operations through which the internal structure of a liquid product is established and controlled. An emulsion consists of droplets of one liquid dispersed within another liquid that is immiscible or only partly miscible with it. Homogenization has a broader meaning and includes the reduction and redistribution of droplets, solid particles, aggregates, and other inhomogeneities. In processing systems containing two liquid phases, the same rotor stator device may form a coarse dispersion, reduce droplet size, modify the distribution, and improve bulk uniformity. These functions are relevant to foods, dairy products, beverages, cosmetics, pharmaceutical and veterinary formulations, coatings, polymer dispersions, agrochemical concentrates, fuel emulsions, lubricants, extraction processes, and chemical reactions [1, 2, 3, 4, 5, 6, 7].
The process objective is a droplet population that satisfies the required product function at an acceptable throughput and energy input. Relevant attributes include phase topology, mean diameter, distribution width, the coarse fraction, and stability during subsequent handling and storage. Reducing droplet size increases interfacial area and can improve resistance to creaming, optical properties, texture, reaction rates, or mass transfer. The same reduction may increase emulsifier demand, alter apparent viscosity, intensify interfacial chemical contact, and make later phase separation more difficult. Thermal exposure, air incorporation, oxidation, erosion, mechanical loading, contamination control, and cleaning must therefore be considered together with droplet size. Product requirements provide the basis for mixer selection and process development [1, 2, 3, 4, 5, 6, 7, 8].
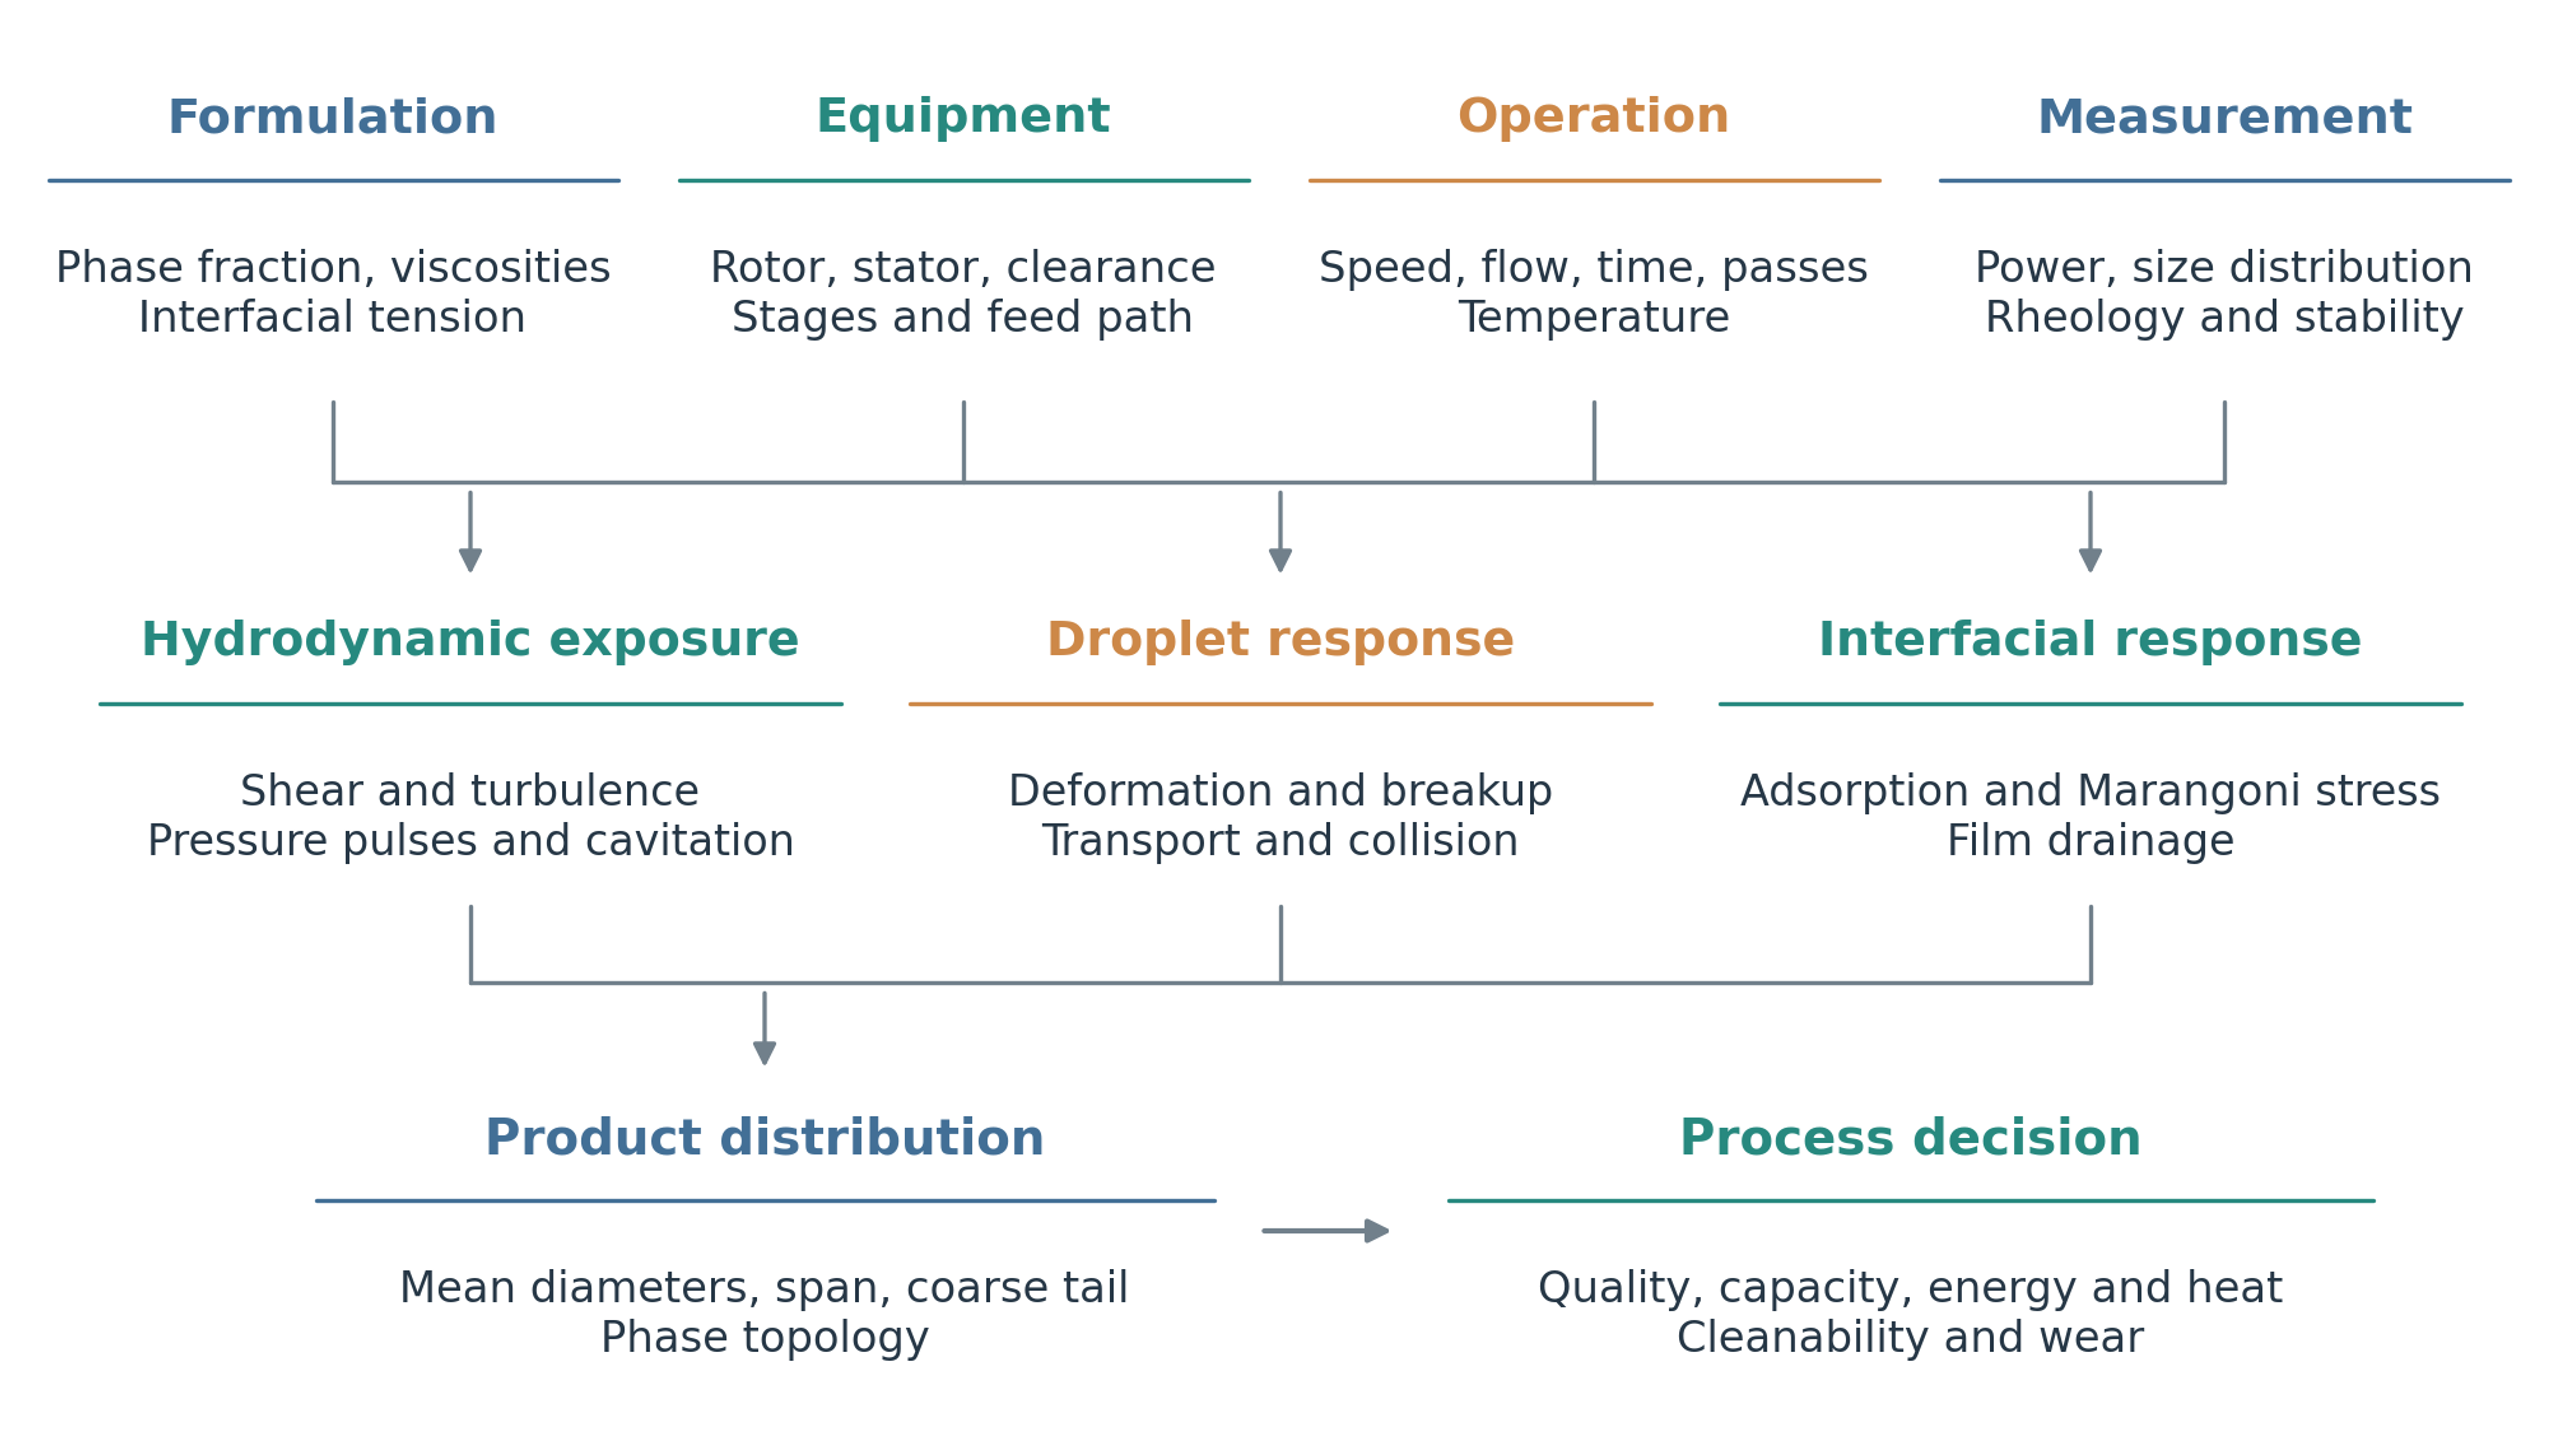
Figure 1.1. Conceptual framework for rotor stator emulsification. Formulation, equipment, operation, and measurement determine hydrodynamic exposure, droplet response, interfacial stabilization, and the resulting product distribution.
Rotor-stator equipment is operated either as an immersed head in a batch vessel or as an enclosed unit through which a liquid stream passes. In an immersed arrangement, liquid is generally drawn toward the head, accelerated through the rotor and stator, and returned to the vessel through radial discharge. Further processing depends on circulation back to the active region. In an inline arrangement, the feed passes through a defined series of internal passages, although bypass, back mixing, and unequal flow between passages can still produce a distribution of exposures. A recirculation loop combines an inline mixing head with a vessel and external piping, allowing repeated treatment while feed addition, temperature, and inventory are controlled separately [1, 3, 10, 11, 12].
Related devices are described in Russian and Ukrainian literature as rotary pulsation apparatus, rotary impulse apparatus, rotor pulsation homogenizers, and equipment for discrete impulse energy input. In these machines, periodic overlap of rotor and stator openings creates variations in velocity and pressure in addition to the shear and turbulence associated with rotation. Differences in terminology and construction should be recognized when comparing published results. The common engineering question is how the geometry establishes the local stress history and how the entire product receives sufficient exposure without excessive energy dissipation or mechanical loading [13, 14, 15, 16, 17, 18].
A central distinction is required between droplet breakup and interfacial stabilization. Breakup occurs when hydrodynamic stresses deform a droplet sufficiently to overcome capillary and viscous resistance. Stabilization requires surfactants, proteins, polymers, or particles to reach the newly formed interface and reduce the probability of coalescence. A mixer may provide adequate disruptive stress while producing a coarse or unstable product if adsorption is slow, the supply of stabilizer is insufficient, or droplets collide before protective layers develop. The analysis developed below therefore couples the mechanical processes responsible for fragmentation with the transport and interfacial processes responsible for retaining the resulting droplets [2, 4, 5, 6].
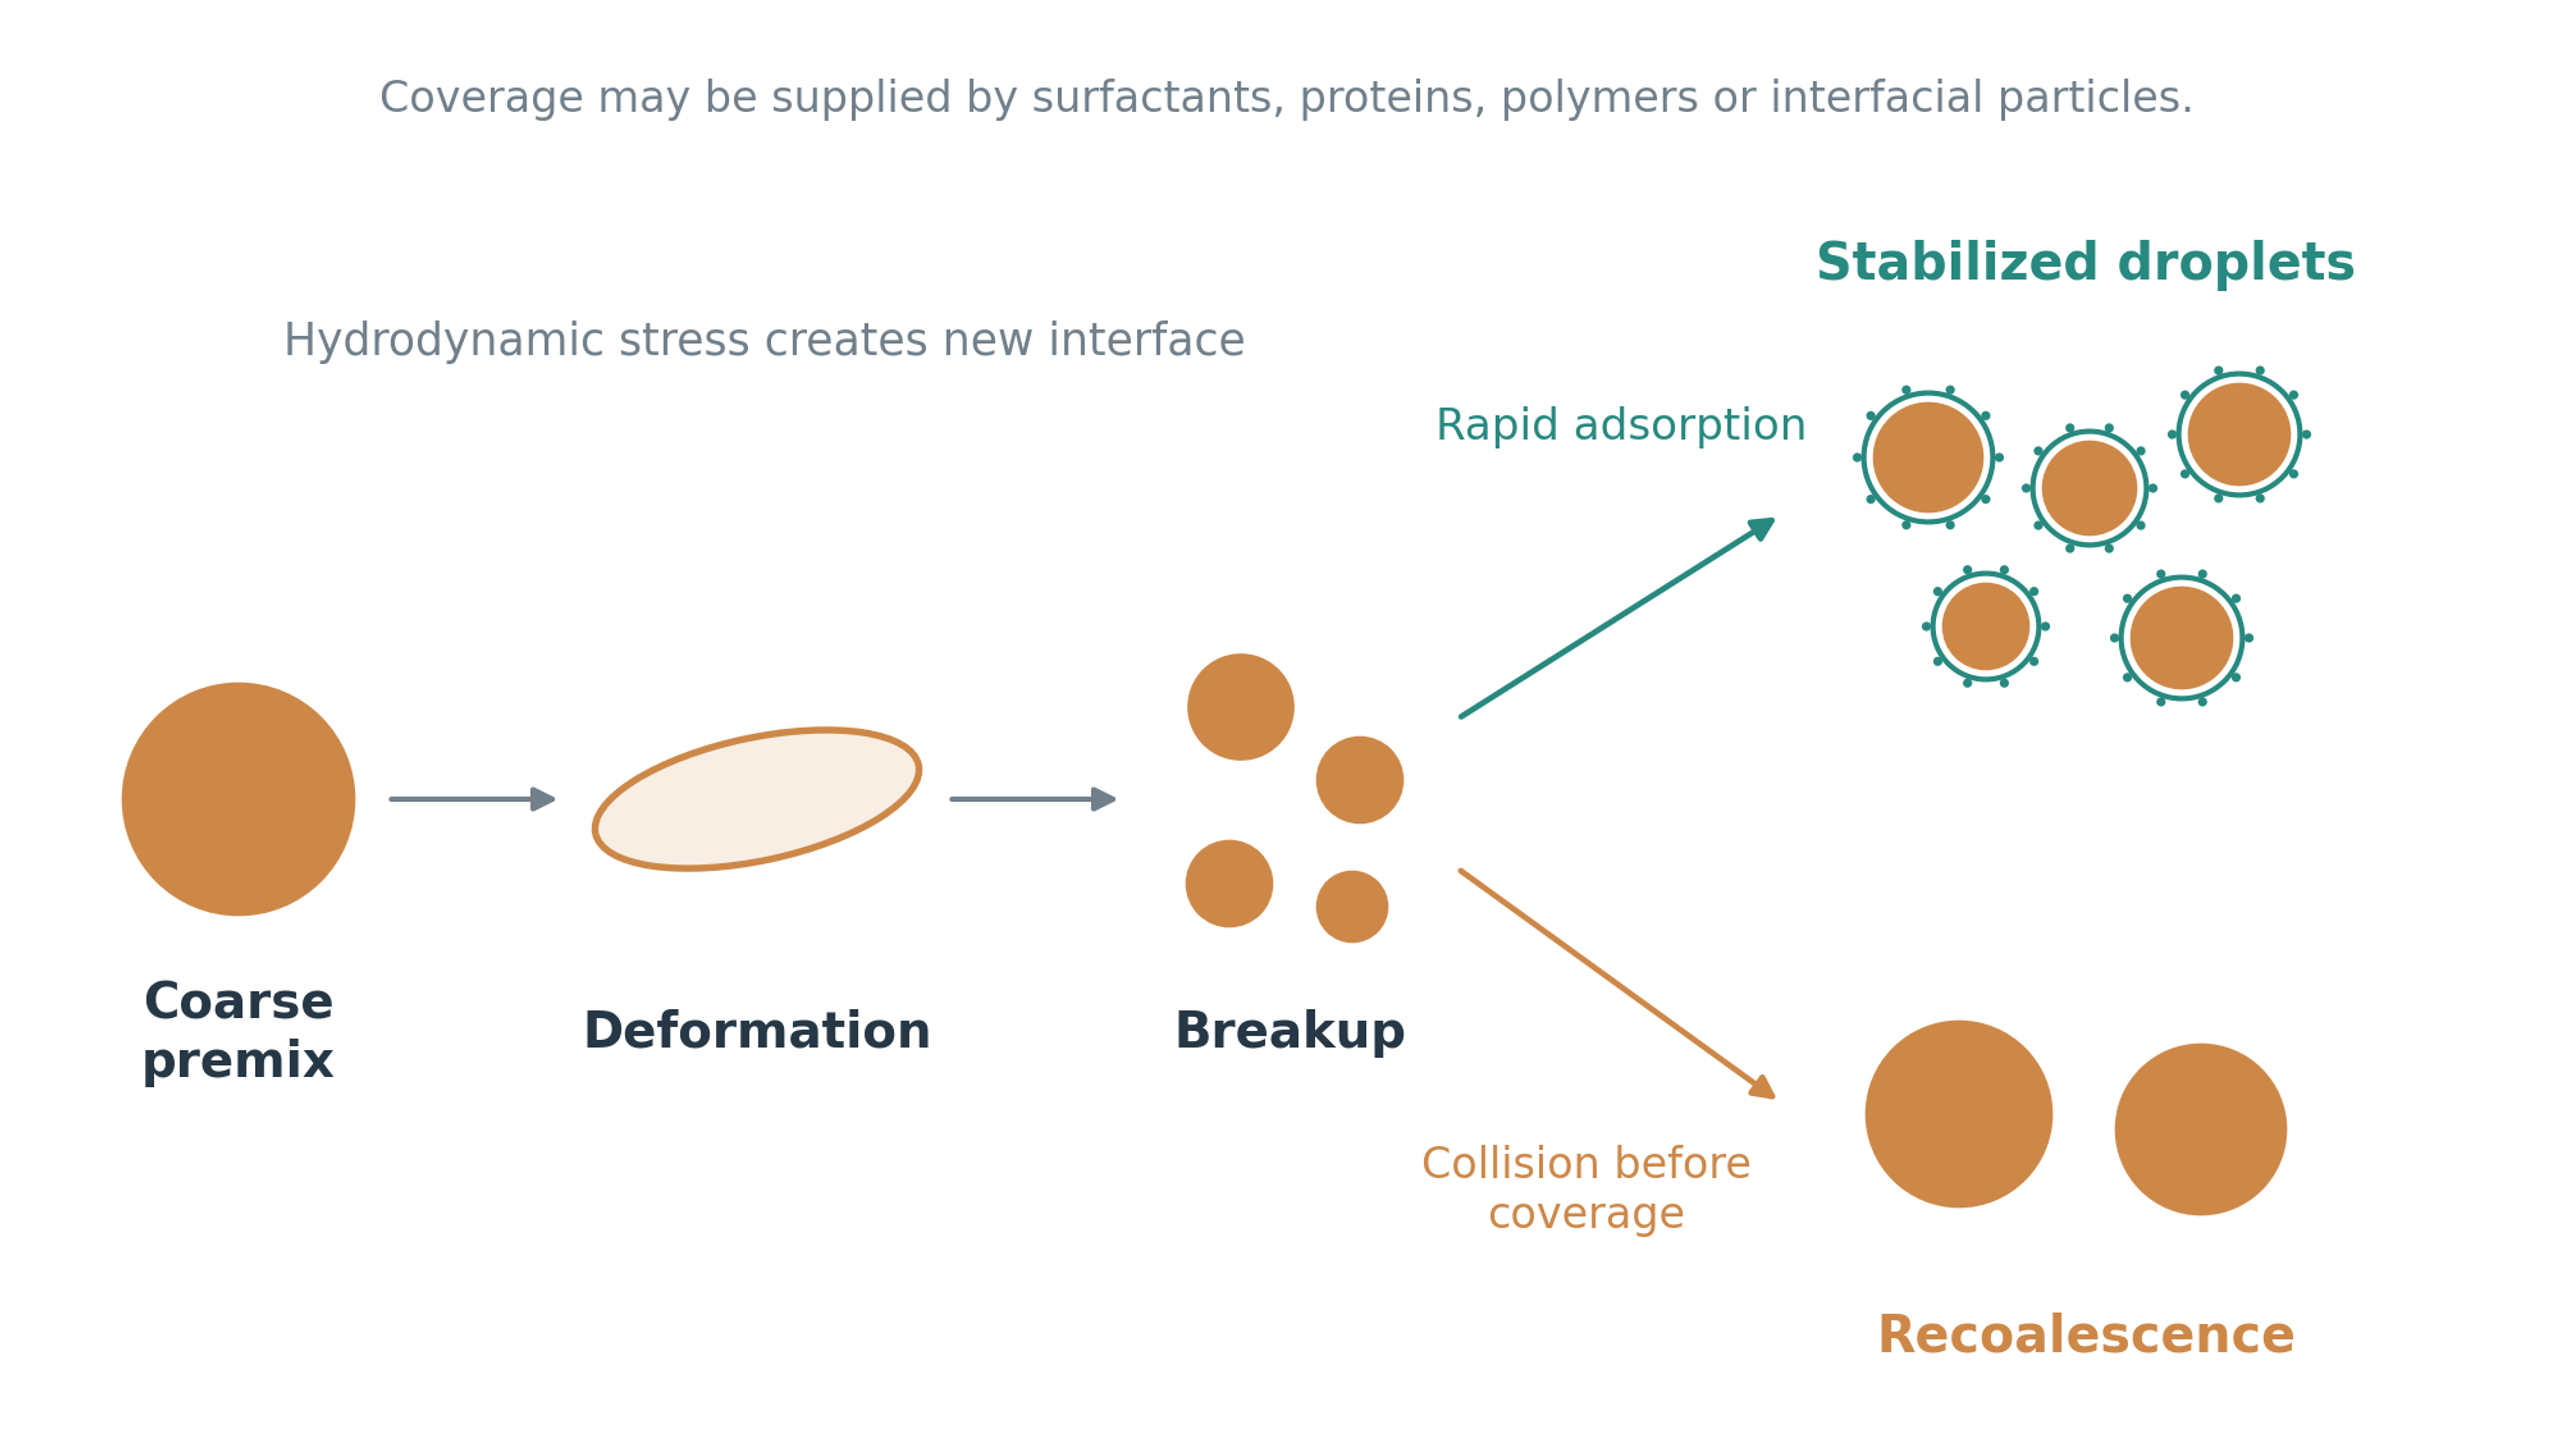
Figure 1.2. Droplet deformation, fragmentation, and interfacial stabilization. Rapid coverage preserves the newly created interface, whereas insufficient coverage permits recoalescence. The two outcomes depend on both formulation and collision history.
2 Emulsion fundamentals and product specifications
A quantitative description of the emulsion must precede the selection of equipment or operating conditions. Phase continuity determines which liquid carries momentum and transports emulsifier, while the size distribution determines interfacial area and the fraction of droplets most susceptible to separation. The following definitions establish a consistent basis for comparing formulations and for connecting measured droplet populations to the calculations used later in the article.
2.1 Emulsion classes and topology
Emulsion classification establishes which phase carries the flow, which phase forms droplets, and what structural features the process must preserve. In an oil in water emulsion, oil droplets are surrounded by an aqueous continuous phase; in water in oil emulsion, aqueous droplets are surrounded by oil. Multiple emulsions contain droplets within larger carrier droplets, as in water in oil in water systems. At high internal phase fractions, close packing can cause droplet deformation and a marked increase in viscosity. Pickering emulsions are distinguished by the adsorption of solid particles at the interface. These categories describe different structural and stabilization requirements and cannot be selected solely from the operating range of a mixer [6, 7, 19, 20].
The terms macroemulsion, submicron emulsion, nanoemulsion, and microemulsion denote different physical situations. Conventional emulsions and nanoemulsions are thermodynamically unstable, although appropriate formulations may remain kinetically stable for the required storage period. Microemulsions are thermodynamically stable, self-assembled structures within particular composition and temperature regions, often requiring substantial surfactant and sometimes a cosurfactant. Mechanical mixing facilitates compositional uniformity but does not make an unsuitable formulation thermodynamically stable. Accordingly, a reproducible product specification should state measured droplet statistics, the measurement method, phase fraction, temperature, and storage conditions in addition to any descriptive size category [6, 7].
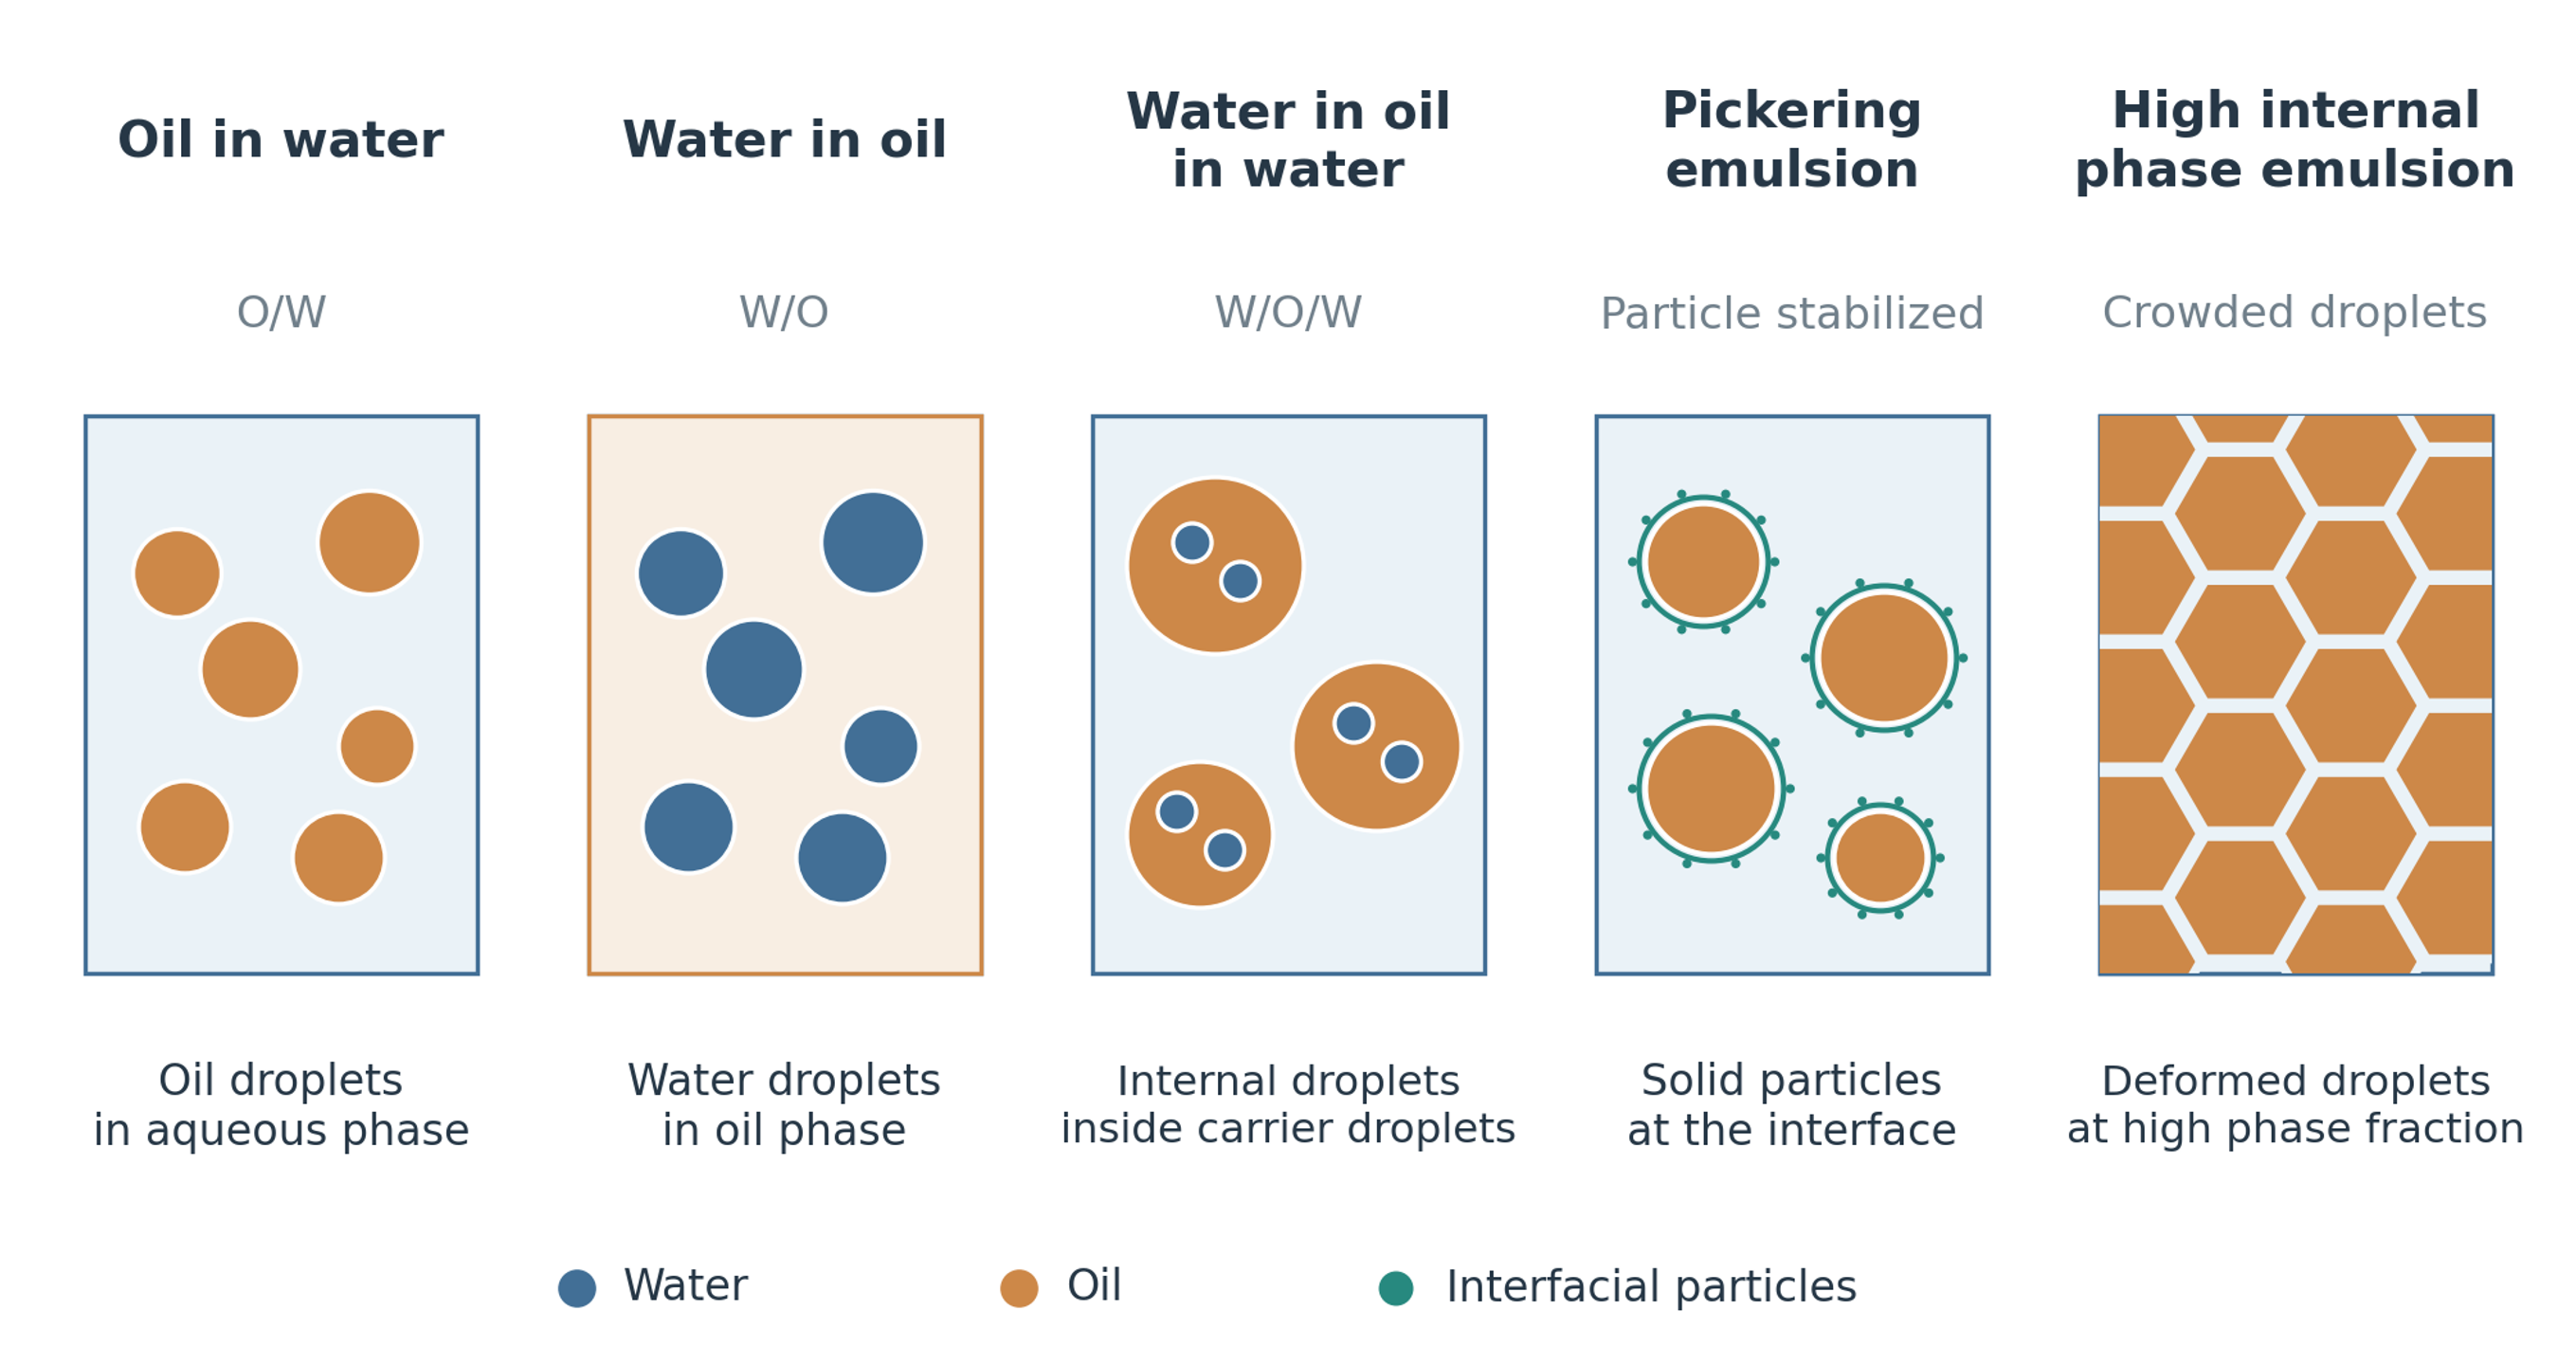
Figure 2.1. Representative liquid dispersion structures. The continuous phase, dispersed phase, internal topology, and stabilizing mechanism must be identified before process conditions are selected. The drawings are schematic and do not define droplet sizes.
Table 2.1. Practical classification of liquid dispersion systems. Size ranges are approximate and overlap among industries.
| System | Typical scale | Stability basis | Rotor stator design implication |
|---|---|---|---|
| Coarse emulsion | 1 to 100 µm or larger | Kinetic | Moderate stress may be sufficient, but coarse tail controls separation |
| Submicron emulsion | 0.1 to 1 µm | Kinetic | High local stress and rapid adsorption are both required |
| Nanoemulsion | About 20 to 500 nm | Kinetic | Small stator features, high tip speed, multiple exposure, and strong stabilization may be needed |
| Microemulsion | Commonly 10 to 100 nm structures | Thermodynamic over a composition region | Formulation is controlling; mechanical energy is secondary |
| Multiple emulsion | Internal and external drops from submicron to tens of micrometres | Kinetic and hierarchical | Second stage stress must not destroy internal droplets |
| Pickering emulsion | Broad | Particle adsorption | Particle wettability and adsorption energy control stability |
| High internal phase emulsion | Frequently 0.74 dispersed volume fraction or greater | Crowding and interfacial film | Very high viscosity and phase inversion risk influence pumping and head selection |
The amount of dispersed liquid affects interfacial area, droplet interactions, and the rheological state of the emulsion. Assuming additive phase volumes, the dispersed phase volume fraction is defined as
where and denote the dispersed and continuous phase volumes, respectively. The definition applies to the phase volumes at the temperature used for the calculation.
Phase topology can change during addition, heating, or continued processing when the formulation approaches inversion. Such a change can alter conductivity, apparent viscosity, circulation, power demand, and coalescence behavior abruptly. The sequence and rate of phase addition therefore form part of the process specification. Samples taken before and after a change in processing conditions should be checked for phase continuity when inversion is plausible.
2.2 Droplet size distribution and mean diameters
Droplet size distributions connect the microscopic structure of an emulsion to its interfacial area and macroscopic behavior. A single mean diameter cannot describe these features completely. A distribution weighted by number emphasizes the large population of small droplets, whereas a distribution weighted by volume emphasizes the larger droplets that contain most of the dispersed material. Comparisons between studies must therefore identify both the weighting basis and the particular statistical measure. For discrete size classes, the generalized moment mean diameter is
where is the number of droplets assigned to size class i, is the representative diameter of that class, and p and q are distinct moment orders.
The arithmetic mean on a number basis is obtained by taking the first and zeroth moments:
The Sauter mean diameter expresses the ratio of dispersed volume to interfacial area and is consequently useful for calculations involving adsorption and interfacial transport:
The volume weighted mean diameter gives greater weight to coarse droplets and is defined as
Percentile diameters describe positions within a cumulative distribution rather than ratios of moments. For a cumulative distribution weighted by dispersed phase volume, the span is commonly expressed as
where the percentile symbols , , and refer to the diameters below which 10%, 50%, and 90% of the dispersed volume occur. These percentile labels must be distinguished from the moment mean defined above. Reporting them explicitly as , , and , and reporting moment means as , , and , avoids this notational ambiguity when tabulating measurements.
The coarse fraction can determine stability even when the mean diameter changes little. A small number of large droplets may dominate visible separation, gravitational migration, filtration behavior, and optical microscopy while making only a limited contribution to the number mean. A useful specification therefore combines an area related measure such as with a coarse sensitive measure such as or the 90th volume percentile, together with distribution width and the measurement basis. Direct comparison of values obtained by different instruments also requires attention to dilution, optical assumptions, and the lower and upper limits of detection [2, 3, 5, 8].
Recent experiments also demonstrate why the mechanism underlying a distribution should be established rather than assumed. L’Estimé and coauthors observed approximately lognormal droplet distributions in their surfactant stabilized model emulsions and found that mean size followed a capillary scaling based on continuous phase viscosity more closely than a Reynolds number scaling [5]. These findings support a viscous deformation interpretation for the investigated system. They do not imply that all rotor stator emulsions obey the same distribution or that turbulent inertial breakup is absent under other conditions.
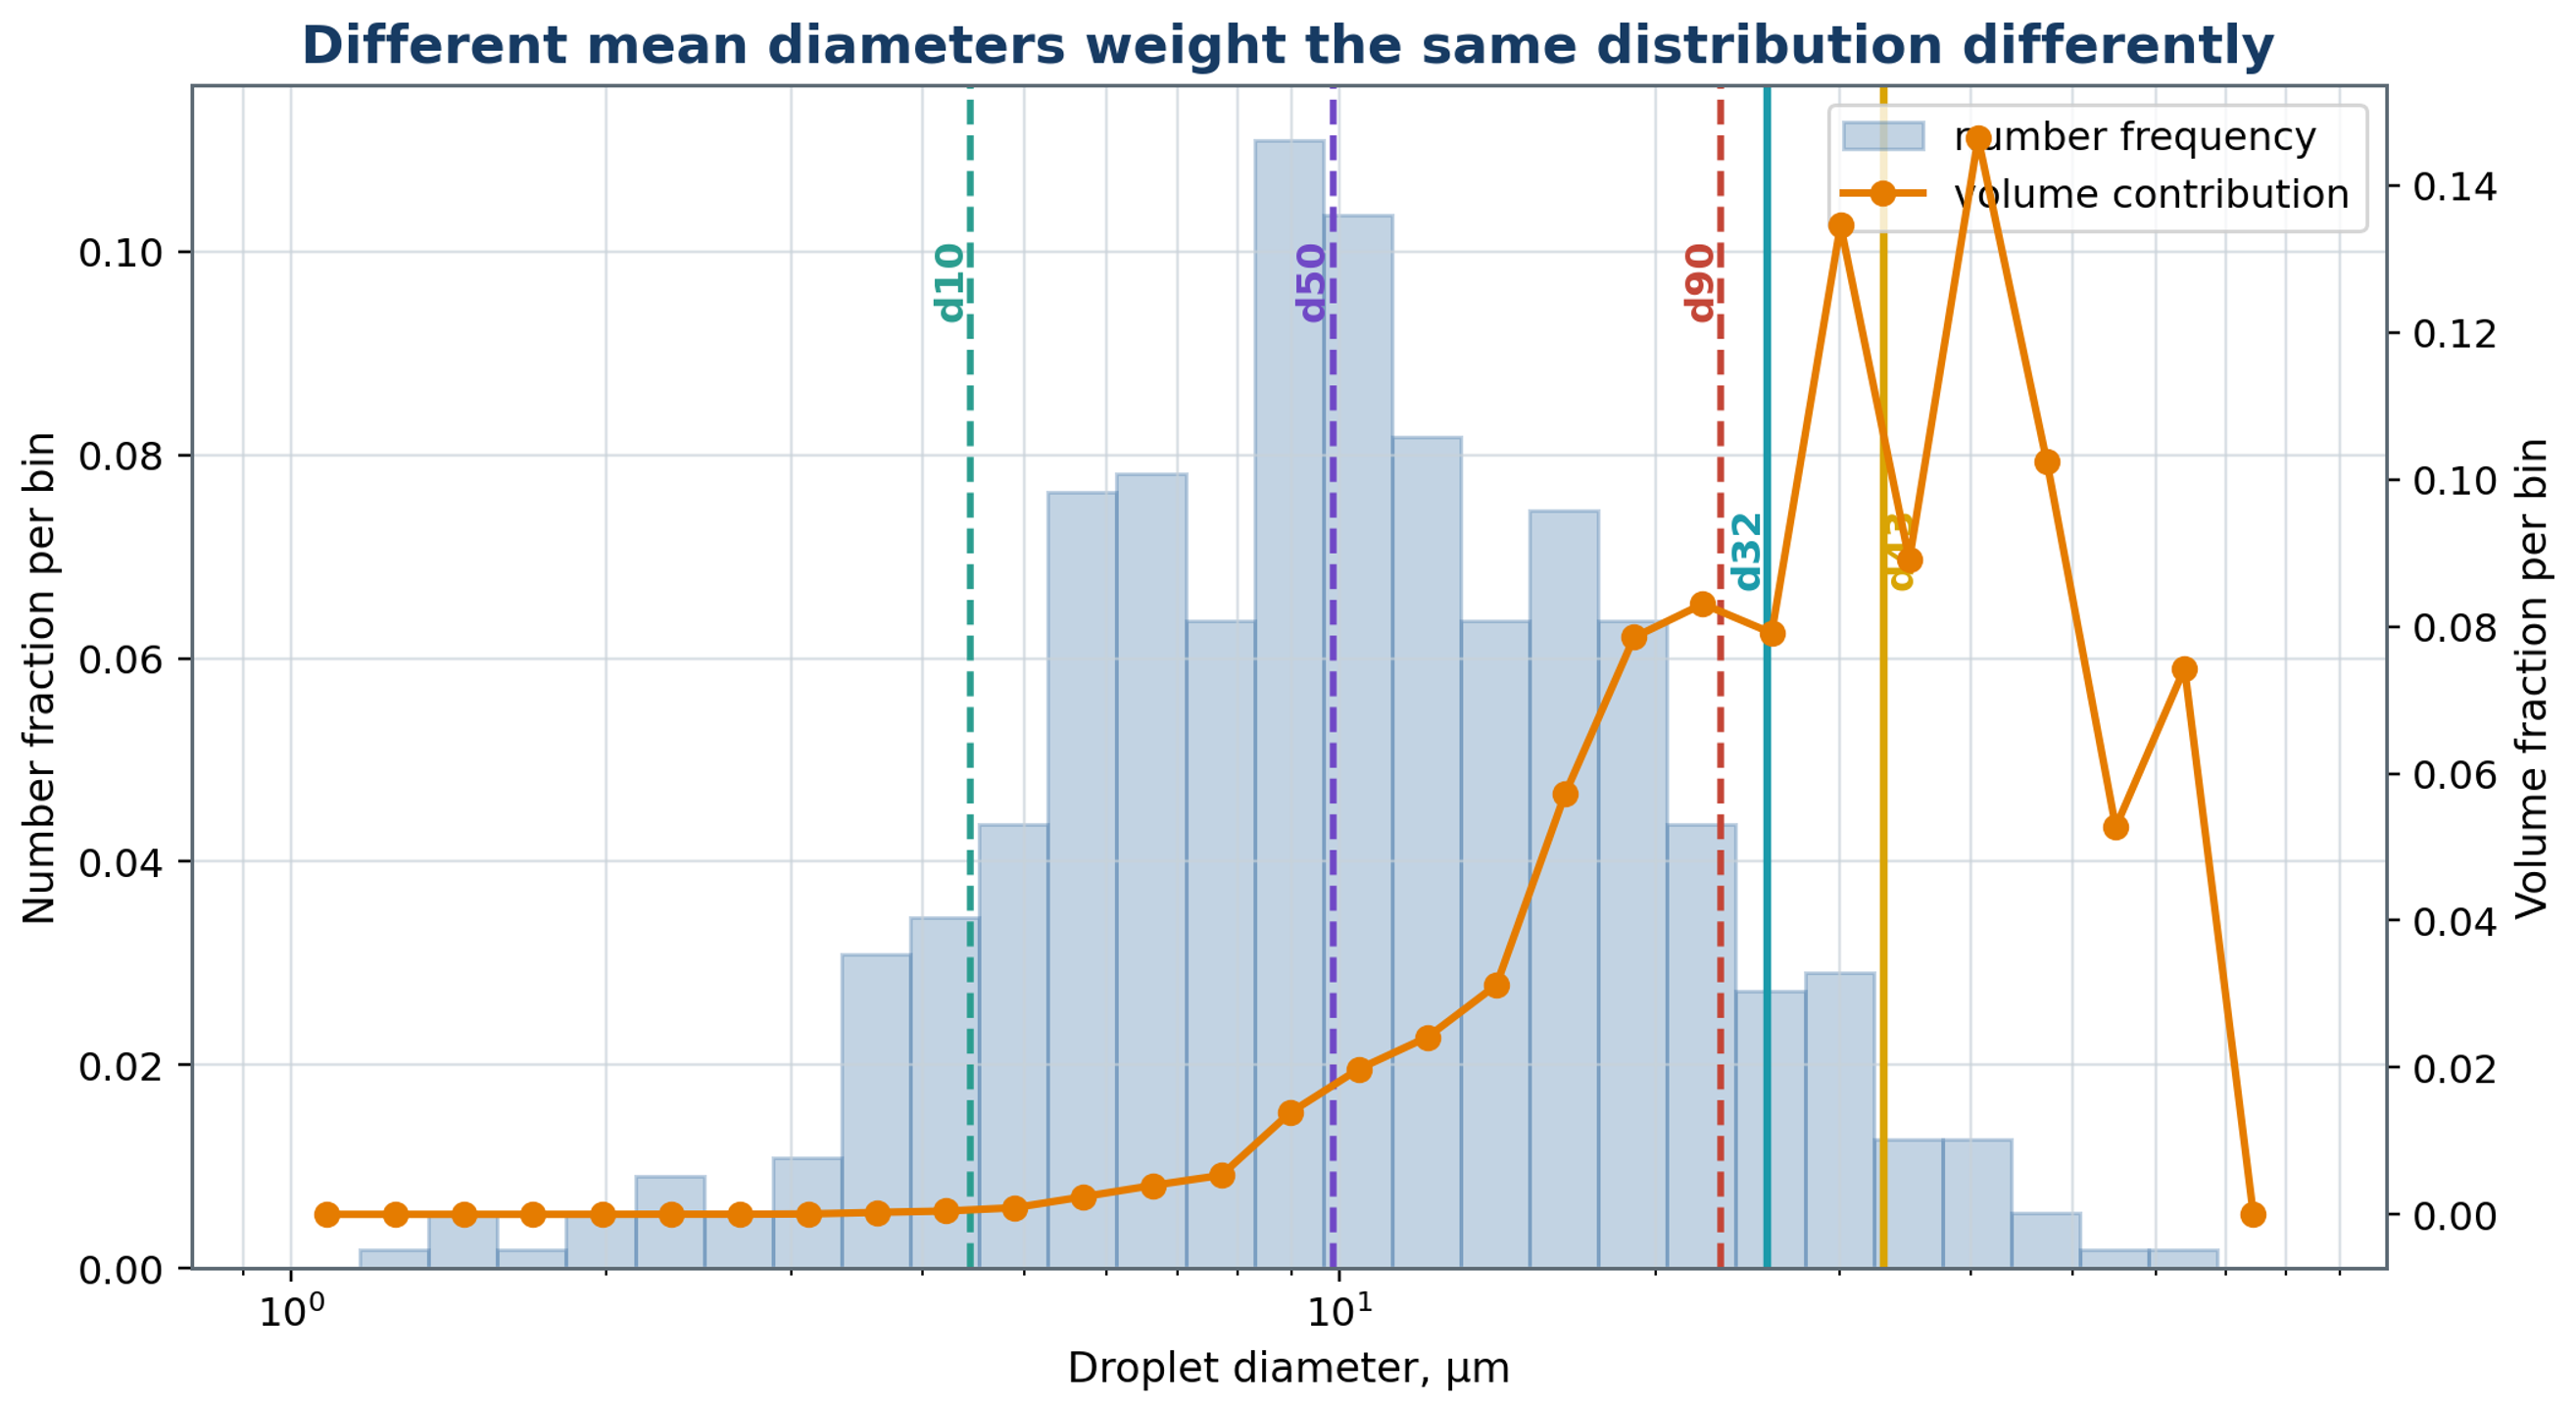
Figure 2.2. Illustrative number and volume weighting of a droplet distribution. The percentile markers in this retained example refer to the number distribution; they should not be confused with the volume percentiles used in equation (2.6). The surface and volume moment means weight the same population differently.
2.3 Interfacial area and emulsifier demand
Interfacial area provides the link between the desired droplet size and the amount of stabilizer required. As droplets are fragmented, a fixed dispersed volume is distributed over a larger surface, which must be supplied with emulsifier. For spherical droplets, the use of the Sauter mean diameter makes the area relation valid for a polydisperse population as well as for a monodisperse one. The interfacial area per unit emulsion volume is
where a has units of m² m⁻³. The relation assumes that the dispersed phase is represented adequately by discrete spherical droplets.
For an emulsion of total volume V, the corresponding total interfacial area is
At constant phase fraction, a tenfold reduction in produces a tenfold increase in interfacial area. The ideal amount of adsorbed emulsifier required at a specified surface coverage increases by the same factor. A plateau in droplet size can therefore arise from insufficient available emulsifier or slow adsorption even when the mixer can generate additional disruptive stress. This area balance also explains why the final stages of size reduction can require a substantial change in formulation relative to the incremental reduction in diameter.
Interfacial tension produces a pressure difference between the interior and exterior of a spherical droplet. For a uniform interface and negligible gravitational deformation, the Young Laplace relation gives
where is interfacial tension and d is droplet diameter. The expression uses diameter rather than radius.
Capillary pressure increases as droplet diameter decreases. Continued fragmentation therefore requires progressively larger local stresses or a reduction in the interfacial tension relevant to the deformation time. Simultaneously, additional interface must be stabilized. An apparent limiting size during prolonged processing can reflect capillary resistance, finite exposure, or a balance between breakup and coalescence. It should not be interpreted directly as a size imposed by the stator openings.
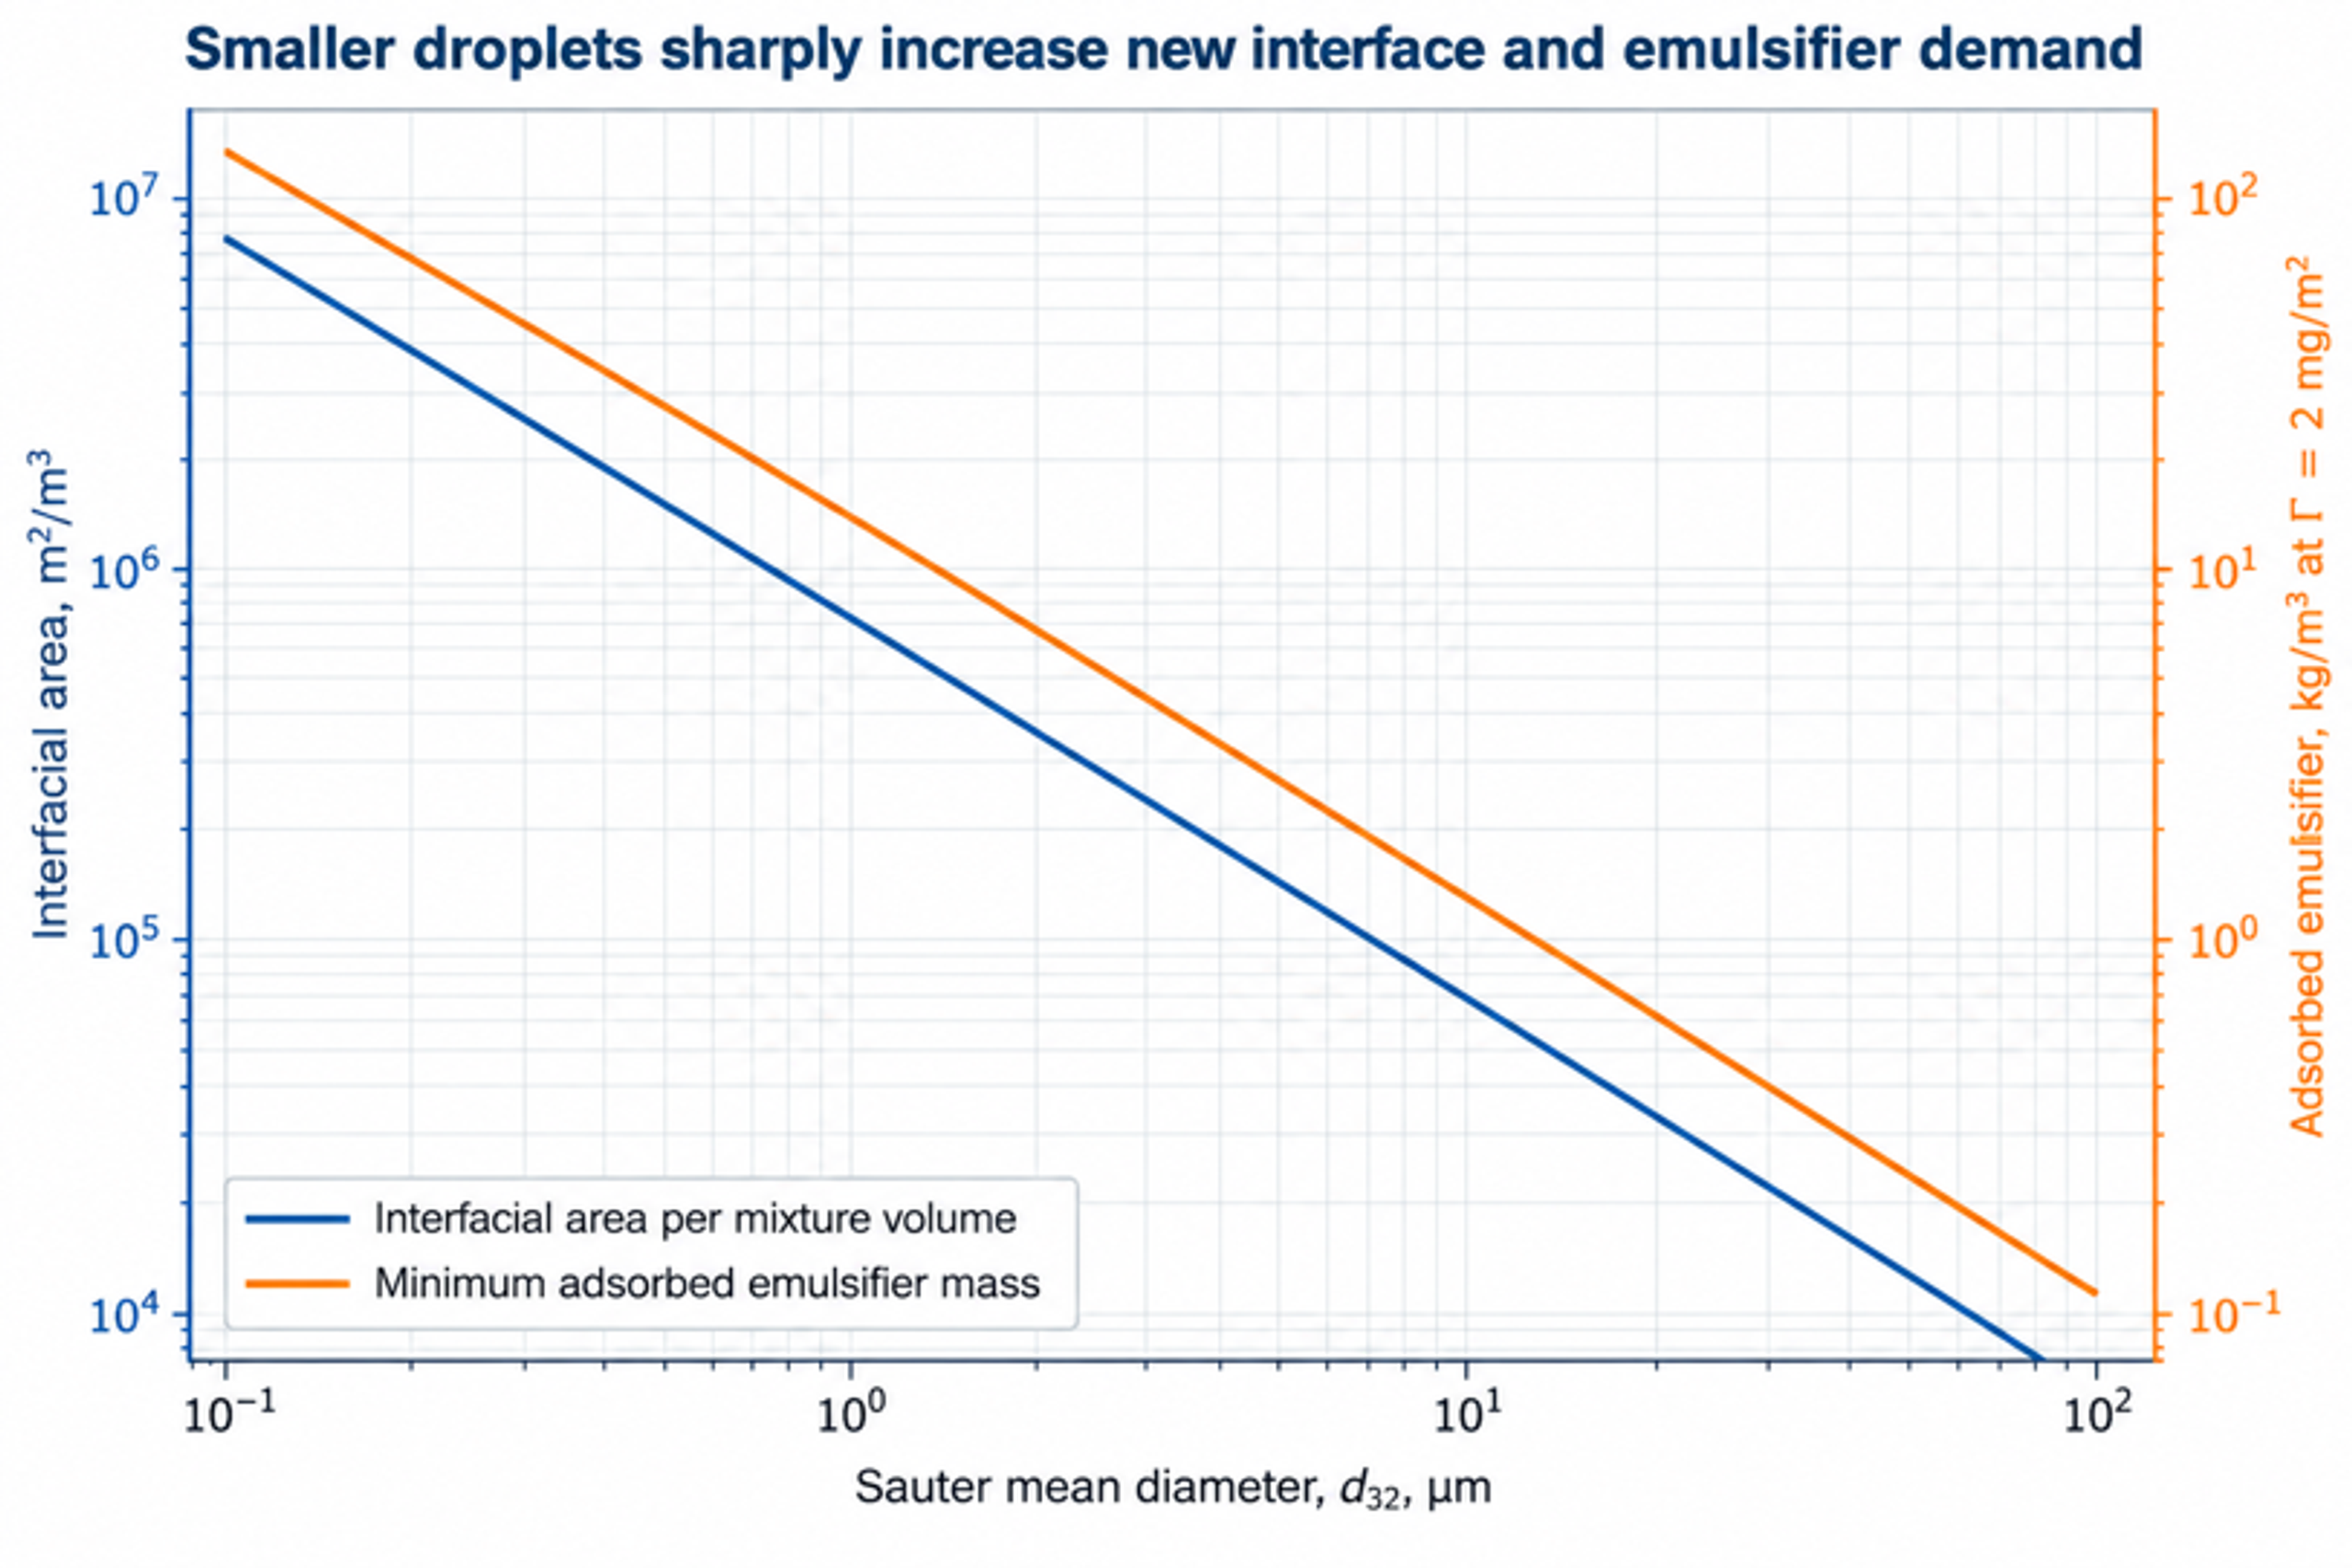
Figure 2.3. Illustrative interfacial area and adsorbed emulsifier demand as functions of Sauter mean diameter at fixed phase fraction. Both scale inversely with diameter according to equations (2.7), (2.8), and (5.4).
3 Rotor-stator process architectures
Process architecture governs how liquid reaches the high intensity region, how often it returns, and how heat and composition are controlled between encounters. An immersed batch head, a single pass inline unit, and a recirculating system can use related rotor and stator features while producing different distributions of exposure. Architecture must therefore be considered together with formulation and local stress when selecting a process or interpreting scale up results.
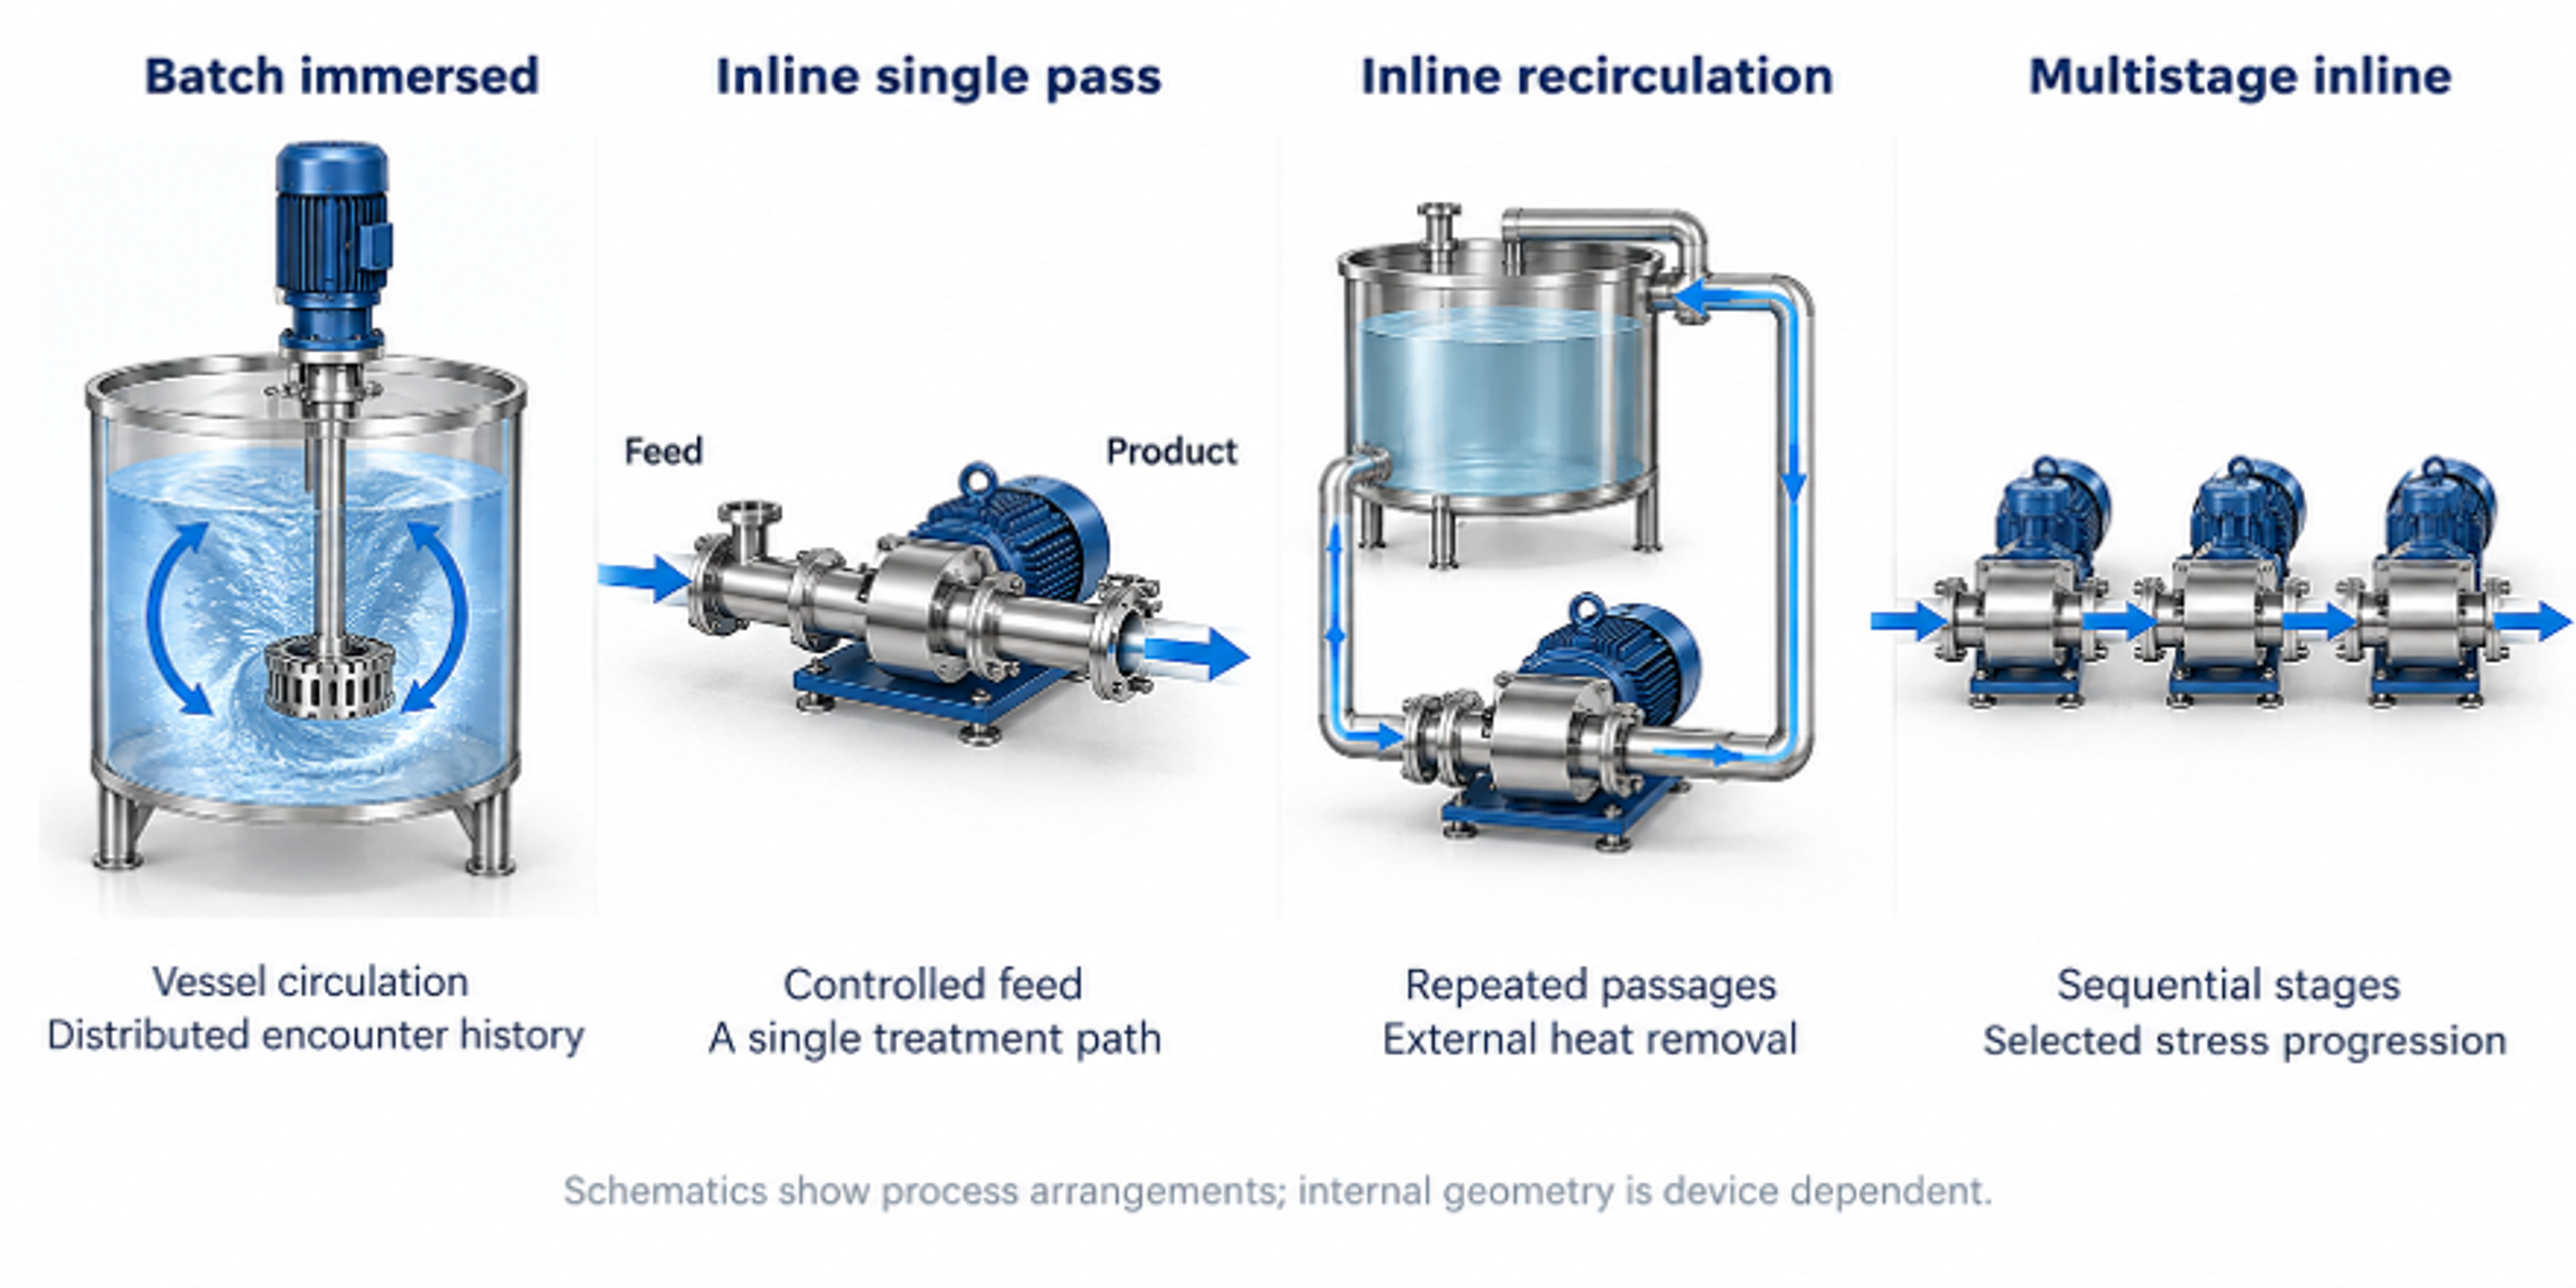
Figure 3.1. Principal process configurations: immersed batch mixing, inline single pass treatment, inline recirculation, and multistage inline processing. The drawings distinguish the flow paths and do not imply equal residence distributions.
3.1 Batch immersed mixers
An immersed batch mixer combines a compact region of intense deformation with circulation through a substantially larger vessel. Liquid is commonly drawn toward the center of the head, accelerated by the rotor, and discharged through stator slots or holes. Residence within the active region may be of the order of milliseconds, whereas total batch treatment is often much longer. Performance therefore depends on the repeated exchange of liquid between the vessel and mixing head. High local stress does not ensure uniform treatment when part of the vessel inventory circulates poorly or rarely reaches the active region [1, 2].
The circulation pattern depends on head elevation, vessel diameter, liquid depth, baffles, viscosity, free surface behavior, and the location of liquid addition. Adequate submergence reduces air ingestion, while clearance from the vessel wall and bottom supports bulk circulation. As apparent viscosity increases, pumping by the rotor stator head can become insufficient even when deformation remains intense near the rotor. Auxiliary anchors, sweeps, or propellers may then supply bulk transport. In such arrangements, the functions of vessel circulation and local dispersive mixing are assigned to different agitators.
For a batch treated at an approximately constant head circulation rate , an idealized mean number of encounters with the head can be estimated from the batch volume :
where t is the elapsed processing time. The result represents a mean exposure count, not an identical number of passages for every fluid element.
Actual encounter histories have a distribution because some fluid elements return rapidly to the head while others remain in regions of weaker circulation. The calculation is consequently a preliminary estimate. Tracer measurements, validated flow simulations, and sampling at several vessel locations can be used to assess departures from ideal circulation. These checks are particularly relevant when the coarse fraction determines acceptance or when scale up changes the vessel proportions, head position, or product viscosity.
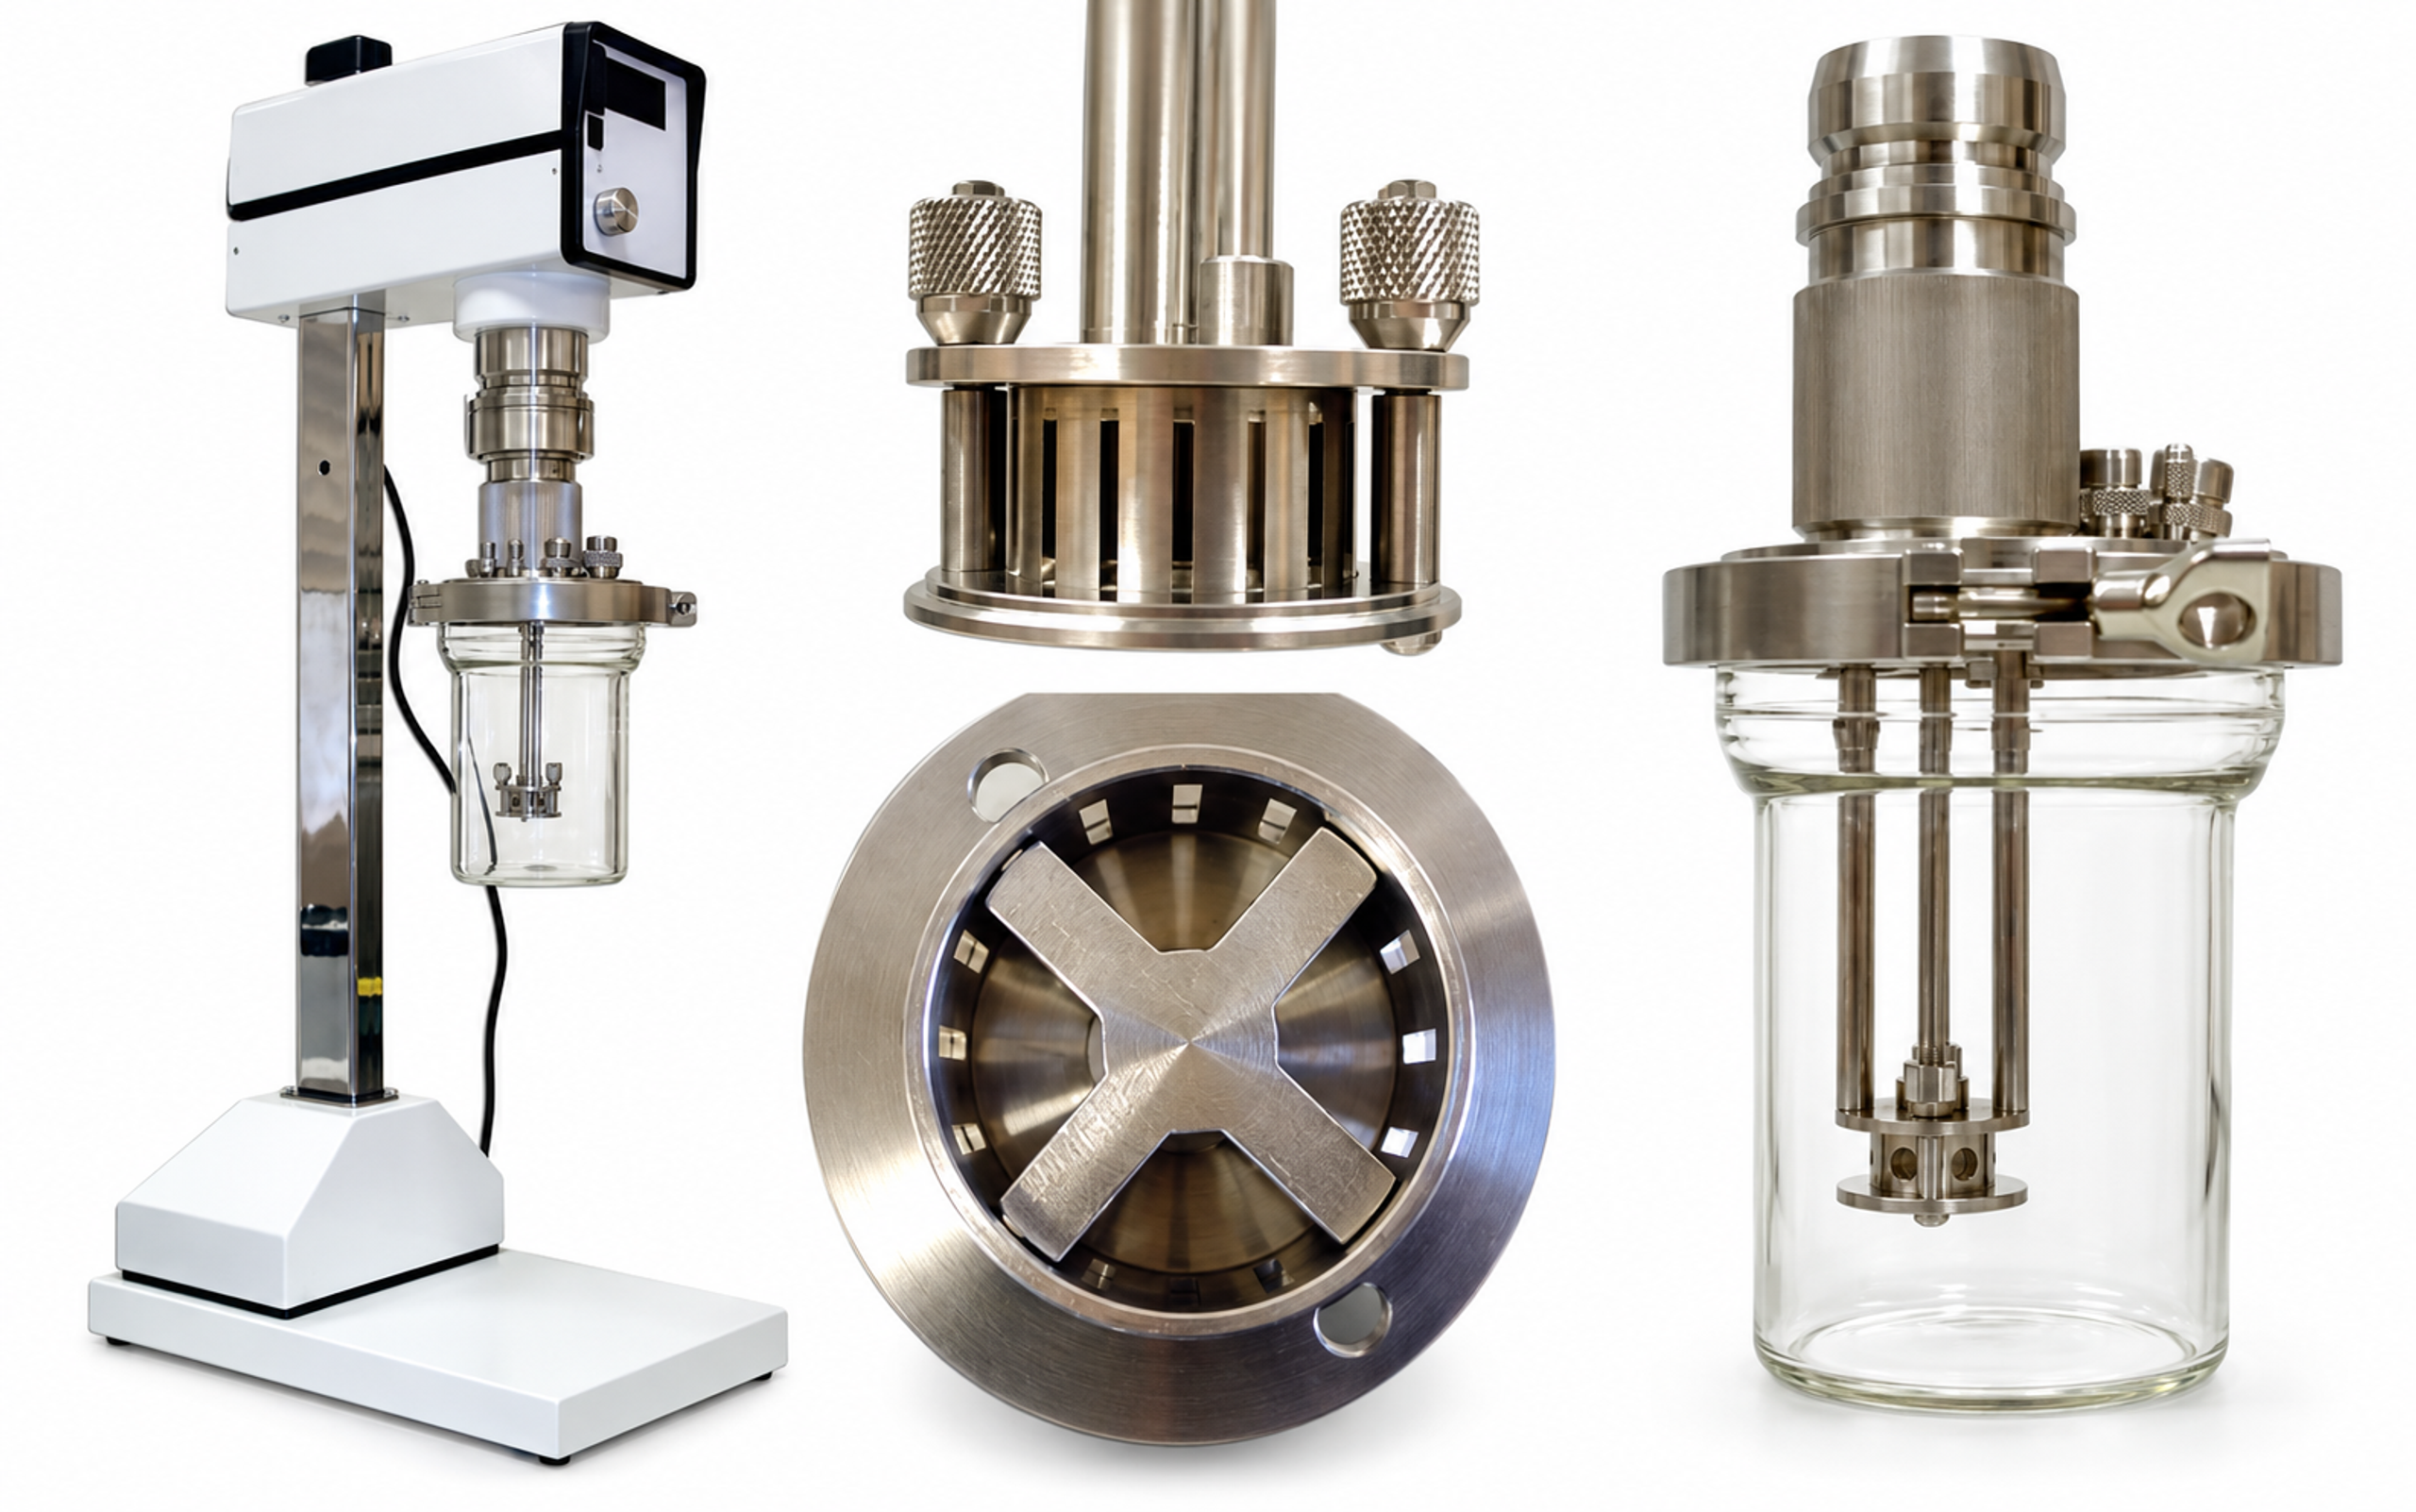
Figure 3.2. Laboratory batch mixer, workhead, underside of the rotor, and vessel arrangement. The views explain the apparatus configuration and are not dimensional engineering drawings.
3.2 Inline single pass and recirculating systems
Inline processing confines the active mixing stages within a housing and links the exposure history to a controlled feed stream. Compared with an immersed batch head, the liquid follows a more defined sequence of acceleration, deformation, and discharge, although the internal residence time remains distributed. Such arrangements permit continuous production, metered addition, and integration with heat exchangers, deaeration systems, reactors, and filling operations. The choice between a single pass and recirculation depends on the required distribution, available stabilization time, thermal limits, and the ability to maintain uniform flow through the head [1, 3, 11, 12].
For an active liquid volume and a steady volumetric flow rate , the nominal mean residence time is
In a recirculation system, total throughput divided by the liquid inventory gives the mean number of equivalent passages:
where is the recirculation flow rate and is the combined liquid inventory represented by the model.
For a perfectly mixed inventory, negligible bypass, and approximately constant circulation rate, the fraction that has not yet entered the device after equivalent passes is
After one equivalent pass, the ideal mixed model predicts that approximately 36.8% of the inventory remains untreated, while some material has already passed through the device more than once. Equivalent pass number therefore measures accumulated throughput rather than uniform treatment. A properly distributed single pass system can provide a narrower exposure history, but this advantage depends on the absence of substantial bypass and unequal flow among passages.
Table 3.1. Selection of process architecture.
| Requirement | Batch immersed | Inline single pass | Inline recirculation | Multistage inline |
|---|---|---|---|---|
| Flexible formulation changes | Excellent | Moderate | Good | Moderate |
| Defined residence history | Low | High | Moderate | High |
| High viscosity handling | Good with auxiliary sweep | Device dependent | Good with suitable pump | Device dependent |
| Heat removal | Vessel jacket or coil | External exchanger | Excellent with loop exchanger | Interstage cooling possible |
| Addition of powders or secondary liquid | Simple but air risk | Controlled injection | Controlled injection and repeated mixing | Stage specific injection possible |
| Exposure uniformity | Depends on tank circulation | Good when manifolding is uniform | Distributed pass count | Good when stages are hydraulically balanced |
| Cleaning and containment | Open or closed vessel | Closed sanitary line | Closed but larger holdup | Closed and compact |
3.3 Single stage and multistage heads
The number and sequence of rotor stator stages determine how deformation is distributed along the flow path. A single stage provides one principal interaction zone, whereas a multistage head places several zones in series. The stages may differ in opening size, tooth geometry, or clearance. A relatively coarse first stage can produce a more uniform and readily transported premix before subsequent stages impose additional deformation. This sequence can reduce intermittent loading of finer features and provide controlled changes in the droplet population as the liquid proceeds through the head [3, 21, 22].
Representative commercial architectures include the immersed POLYTRON batch generators and the enclosed MEGATRON inline chambers documented by Kinematica [23], the interchangeable workheads described by Silverson [11], and the three successive generators of the IKA DISPAX REACTOR DR 2000 [12]. These materials document differences in flow path, stage arrangement, and generator selection. They should be used to identify and describe equipment configurations; comparable droplet size, stability, or energy performance must be established experimentally on the same formulation and measurement basis.
Additional stages introduce power consumption, heat generation, pressure changes, and residence time. Their benefit depends on whether they produce further retained breakup under the formulation conditions. When stabilization is limiting, additional exposure may increase collision and recoalescence without improving the final distribution. Measurements of , the coarse percentile, temperature, and power after successive stages provide a basis for assessing this tradeoff. Interchangeable generators or suitable bypass arrangements facilitate comparison during process development.
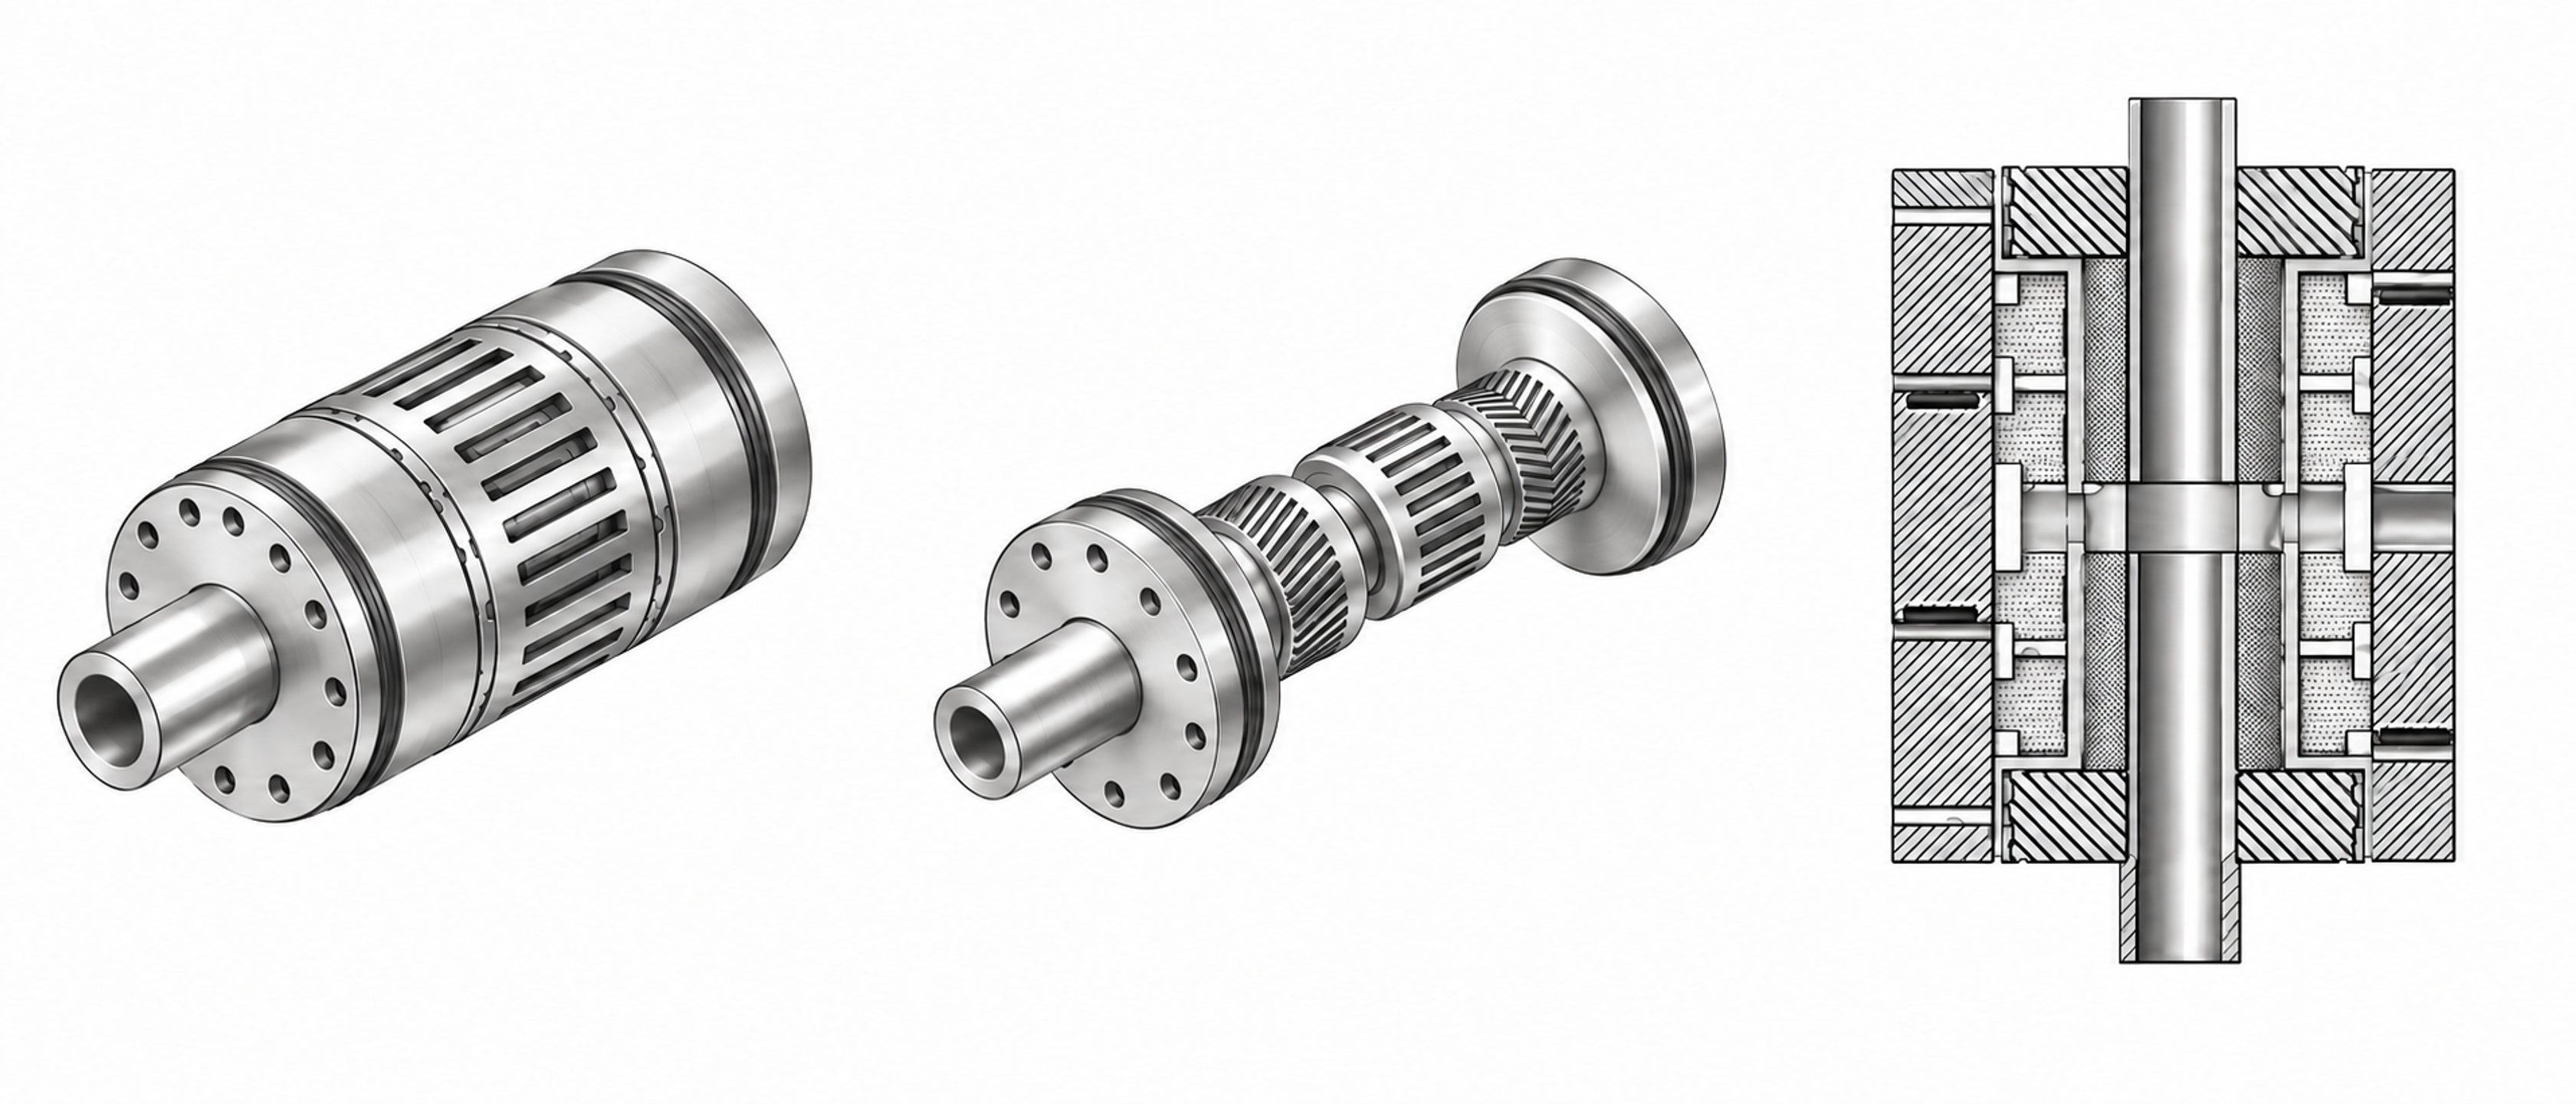
Figure 3.3. Assembled, exposed, and sectional rotor-stator homogenizer configurations. The views show sequential processing zones and clearances.
3.4 Feed order and premix quality
The state of the feed establishes the initial conditions for emulsification, including phase continuity, droplet size, and the location of the stabilizer. In many formulations, the intended continuous phase is established before the second liquid is introduced. Emulsifier placement should reflect solubility, adsorption kinetics, and the possibility of unwanted aggregation. Introducing the dispersed liquid near the head intake can shorten the interval before intense deformation, provided that the feed is diluted adequately and does not create a concentrated stream that bypasses mixing or causes local inversion.
Premixing should produce a feed that enters the mixing head consistently and remains stable long enough for further processing. A very coarse or segregating feed can cause fluctuating torque, irregular loading, and a broad distribution of treated droplets. Excessive premixing can add unnecessary thermal exposure and oxidation before the principal emulsification step. The required premix is therefore defined by flowability, phase topology, feed uniformity, and stability over the transfer interval.
4 Hydrodynamic exposure in rotor-stator mixers
The relationship between mixer settings and droplet breakup depends on the stresses experienced by individual droplets, rather than on shaft speed alone. A useful hydrodynamic description distinguishes velocity scales, deformation rates, flow regimes, periodic forcing, and local pressure conditions. The quantities introduced below provide a framework for comparing devices while making explicit the approximations involved in reducing a complex, unsteady flow to a small set of operating variables.
4.1 Active zones and stress history
The hydrodynamic exposure of a droplet comprises the complete sequence of stresses encountered along its trajectory. The nominal radial clearance is only one part of that sequence. Axial entry, centrifugal acceleration, rotor passages, gap flow, periodic stator opening, jet formation, impingement, pressure recovery, and recirculation can each contribute to deformation. The relative contribution depends on head geometry, flow rate, viscosity, and position within the device. Mean velocities and fluctuating components therefore need to be interpreted over several spatial and temporal scales when relating operating conditions to breakup [1, 3, 8, 10, 13, 14, 24, 25, 26, 27].
Direct observations provide evidence that the principal breakup region can extend beyond the nominal rotor clearance. Ashar and coauthors used a mixer with optical access and found that breakup occurred mainly downstream of the stator and within the emerging jets. Their measurements also showed that parent droplet size affected the duration and distribution of interactions with vortical structures [28]. These observations support the use of a trajectory based stress history and caution against assigning all fragmentation to the narrow gap. The reported locations apply to the investigated device and operating conditions.
Rotor tip speed provides a convenient measure of the velocity scale associated with rotation:
where is rotor diameter and is rotational frequency in s⁻¹. The speed specified in revolutions per minute must be divided by 60 before substitution.
A comparison based on tip speed and radial clearance gives the nominal shear rate
This ratio provides a geometric estimate, rather than a complete description of the local strain field. Blade shape, slip, leakage, turbulence, and changing rotor and stator overlap produce substantial spatial and temporal variation. The nominal value is therefore useful for comparing geometries but is insufficient as the sole basis for predicting breakup or transferring a process between scales.
The relative importance of inertia and viscosity at the overall rotor scale is expressed by the rotor Reynolds number:
where and denote continuous phase density and dynamic viscosity, respectively.
Transport within the smaller clearance can be characterized separately by a gap Reynolds number:
The rotor and gap Reynolds numbers refer to different characteristic lengths and velocities and should not be used interchangeably. The former describes the overall rotating scale; the latter concerns motion over the clearance. For non-Newtonian liquids, any apparent viscosity used in these definitions should correspond to a justified shear rate and process temperature. A reported Reynolds number should identify the selected viscosity model and characteristic scales.
The flow generated by a head can change when stator openings are modified, even if rotor speed is held constant. Particle image velocimetry measurements by Mortensen and coauthors related differences in slot width to flow number, velocity profile shape, and the fraction of fluid returning through a slot. Within the investigated geometries, the flow number decreased as slot width increased [29]. The result shows that an opening dimension cannot be interpreted independently of the resulting circulation and backflow. Its direction and magnitude should be verified for the actual rotor and stator combination.
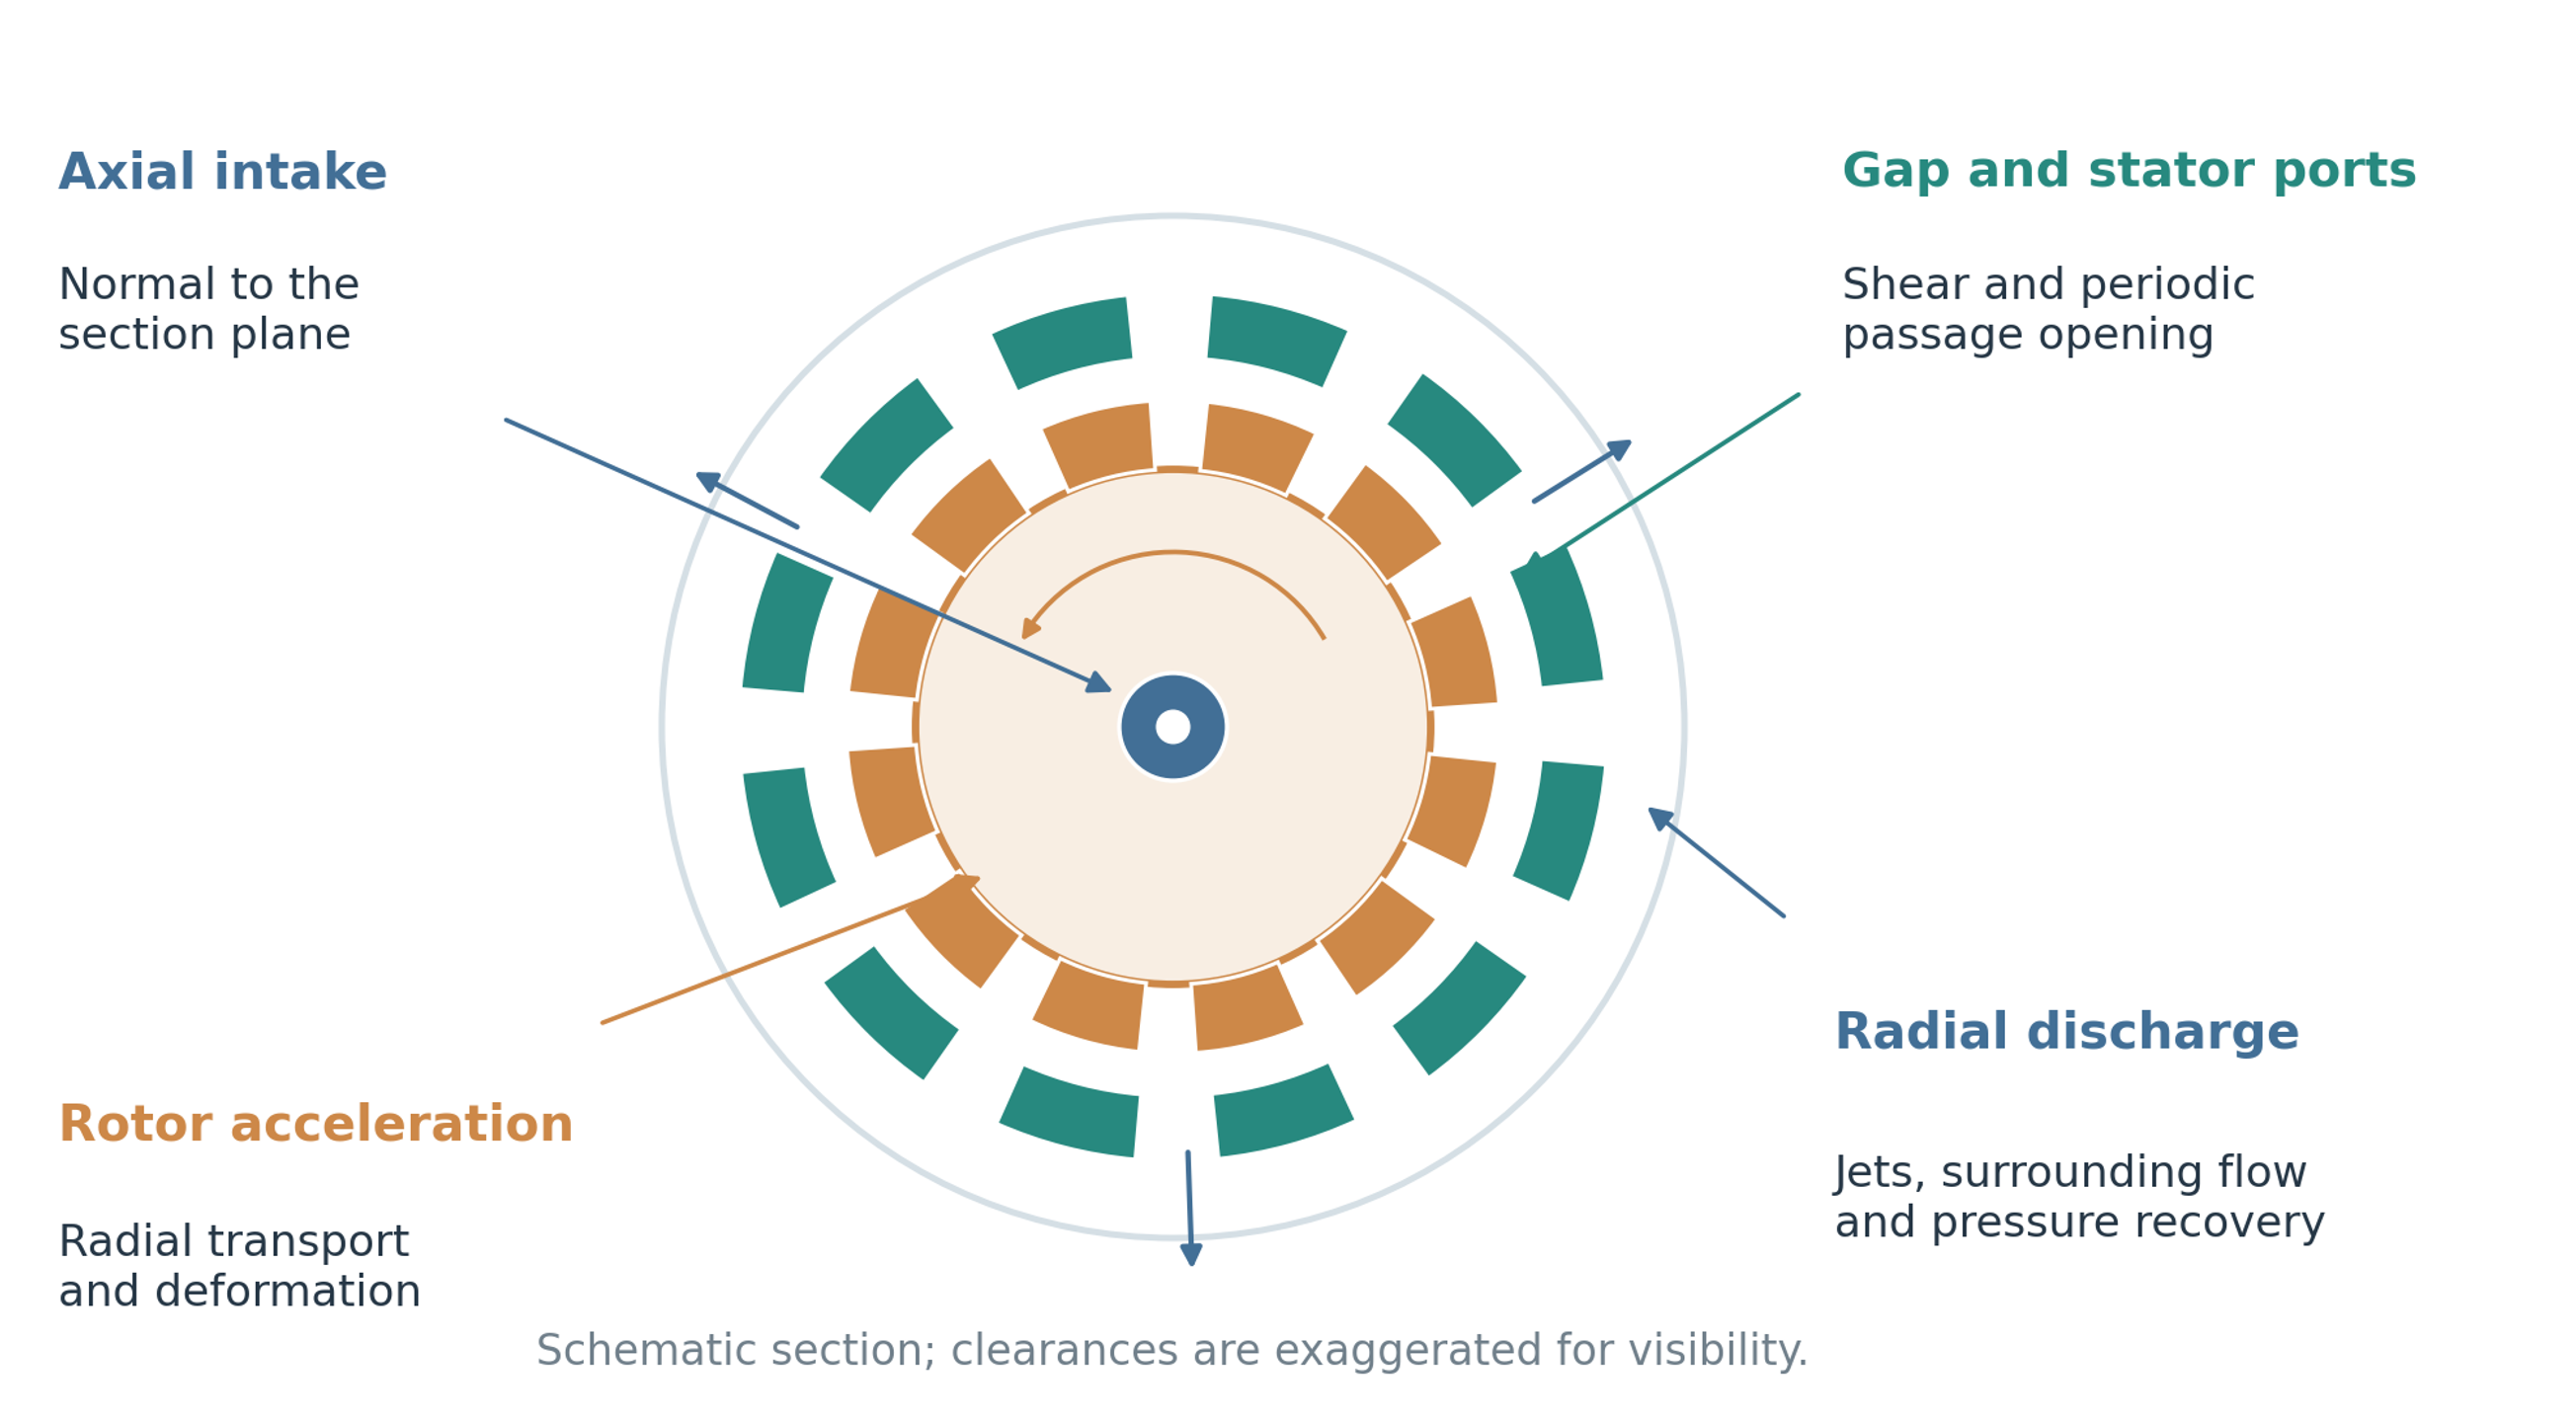
Figure 4.1. Principal hydrodynamic regions in a rotor-stator head. Axial intake, rotor acceleration, deformation in clearances and openings, radial discharge, and downstream pressure recovery contribute different portions of the stress history. The drawing is schematic.
4.2 Pulsation frequency and periodic exposure
Periodic passage of teeth or ports introduces characteristic frequencies into the local velocity and pressure fields. These frequencies help describe repeated deformation events and can guide the interpretation of pressure, vibration, and acoustic measurements. For equivalent rotor teeth or ports and rotational frequency , the blade or port passage frequency observed at a fixed location is approximated by
When a specified rotor and stator pattern produces an effective count of opening events per rotor revolution, the corresponding primary overlap frequency is
Rotary pulsation devices are designed to exploit this periodic change in passage area. Their pressure and velocity spectra may contain blade and opening frequencies, harmonics, beat frequencies, and responses associated with structural motion. Superimposed axial or piston motion introduces further frequencies [13, 14, 16, 17, 18]. A larger pressure amplitude does not by itself establish resonance of the droplets. Evidence of droplet resonance requires comparison of the forcing spectrum with the droplet response under the actual viscosity, interfacial tension, and confinement conditions. Mechanical resonance must be considered separately because it can increase vibration, fatigue, bearing loads, and demands on seals.
4.3 Turbulence, pressure pulsation, and cavitation
Turbulence, pressure pulsation, and cavitation introduce different forms of unsteadiness and should be distinguished when interpreting mixer performance. Turbulence generates velocity fluctuations over a range of scales. Periodic changes in passage area generate pressure and velocity oscillations that can influence deformation when they create relative motion or pressure gradients around droplets. Cavitation occurs when local pressure and the available nuclei permit rapid cavity growth. Subsequent collapse can generate localized jets, pressure waves, and large velocity gradients. Its contribution is conditional: extensive vapor regions or noncondensable gas can reduce collapse intensity, alter pumping, promote foaming, or accelerate erosion. Cavitation therefore cannot be assumed to improve emulsification in every operating regime [13, 14, 15, 18, 30].
A conventional measure of the pressure margin relative to a selected dynamic pressure scale is the cavitation number:
where is the specified reference pressure, is vapor pressure at the process temperature, and is the selected characteristic velocity.
A cavitation number is meaningful only with its pressure location, velocity definition, temperature, and liquid state specified. It is particularly useful for comparisons made with a consistent device and measurement arrangement. If cavitation is invoked as a breakup mechanism, the interpretation should also consider pressure measurements, visual or acoustic observations, erosion evidence, and product response. Gas release and vapor cavitation should be distinguished when the available measurements permit.
Table 4.1. Hydrodynamic mechanisms and their expected effects.
| Mechanism | Characteristic source | Useful action | Main limitation or risk |
|---|---|---|---|
| Mean viscous shear | Rotor stator clearance and wall layers | Deformation of small droplets and viscous systems | Local rate may be overestimated by simple gap calculation |
| Extensional flow | Intake, contractions, slot entry, jet formation | Efficient elongation and ligament formation | Strongly geometry dependent |
| Turbulent inertial stress | Large energetic eddies and jets | Breakup of droplets larger than the smallest eddies | Stochastic exposure produces broad outcomes |
| Turbulent viscous stress | Small dissipative eddies | Important when droplets are below the Kolmogorov scale | High viscosity and heating may dominate |
| Pressure pulsation | Periodic overlap of rotor and stator passages | Repeated acceleration and deformation | Vibration, fatigue, and resonance risk |
| Cavitation collapse | Local pressure depression followed by recovery | Local pressure waves and microjets | Gas cushioning, erosion, foaming, and chemical effects |
| Impingement and collision | Jet collision and groove interaction | Additional deformation and redistribution | May raise coalescence when interface is poorly stabilized |
5 Interfacial thermodynamics and emulsifier dynamics
Newly formed droplets must acquire an interface that resists merger during subsequent collisions. The relevant description includes the equilibrium relation between bulk concentration and surface coverage, the rate at which that coverage develops, and the response of the interfacial layer to deformation. These processes explain why a formulation with a low measured equilibrium tension may behave differently during a short mixing event and why total emulsifier concentration alone is an incomplete measure of stabilization capacity.
5.1 Equilibrium and dynamic interfacial tension
The interfacial tension relevant to breakup depends on how recently the interface was created and how rapidly surface active material reaches it. An equilibrium value describes an interface that has had sufficient time to approach a stable composition. Rotor stator deformation and collision may occur on much shorter timescales, so a newly formed interface can retain a higher tension and incomplete coverage. A low equilibrium tension consequently does not ensure effective emulsification when adsorption is slow. Measurements of dynamic interfacial tension at appropriate temperature and interface age provide a closer connection to the processing event [2, 6].
An empirical relaxation expression is useful for illustrating the distinction between newly formed and equilibrated interfaces:
where is the tension assigned to a newly formed interface, is its equilibrium value, is interface age, and is an effective adsorption timescale.
The exponential form is a convenient approximation and does not replace a diffusion or adsorption model when detailed kinetics are required. For much smaller than , the interface remains close to its initial state; for much larger than , the equilibrium value becomes more representative. A comparison between adsorption time and the time available before a significant droplet collision is expressed by
where is the characteristic interval before a newly formed droplet experiences a collision relevant to coalescence.
A value of much greater than unity indicates that considerable adsorption may occur before collision. A value much smaller than unity indicates that collision can precede the development of a protective layer. This timescale comparison is a screening criterion: adequate surface coverage, interfacial film properties, and the probability of film rupture must also be considered before drawing a conclusion about stability.
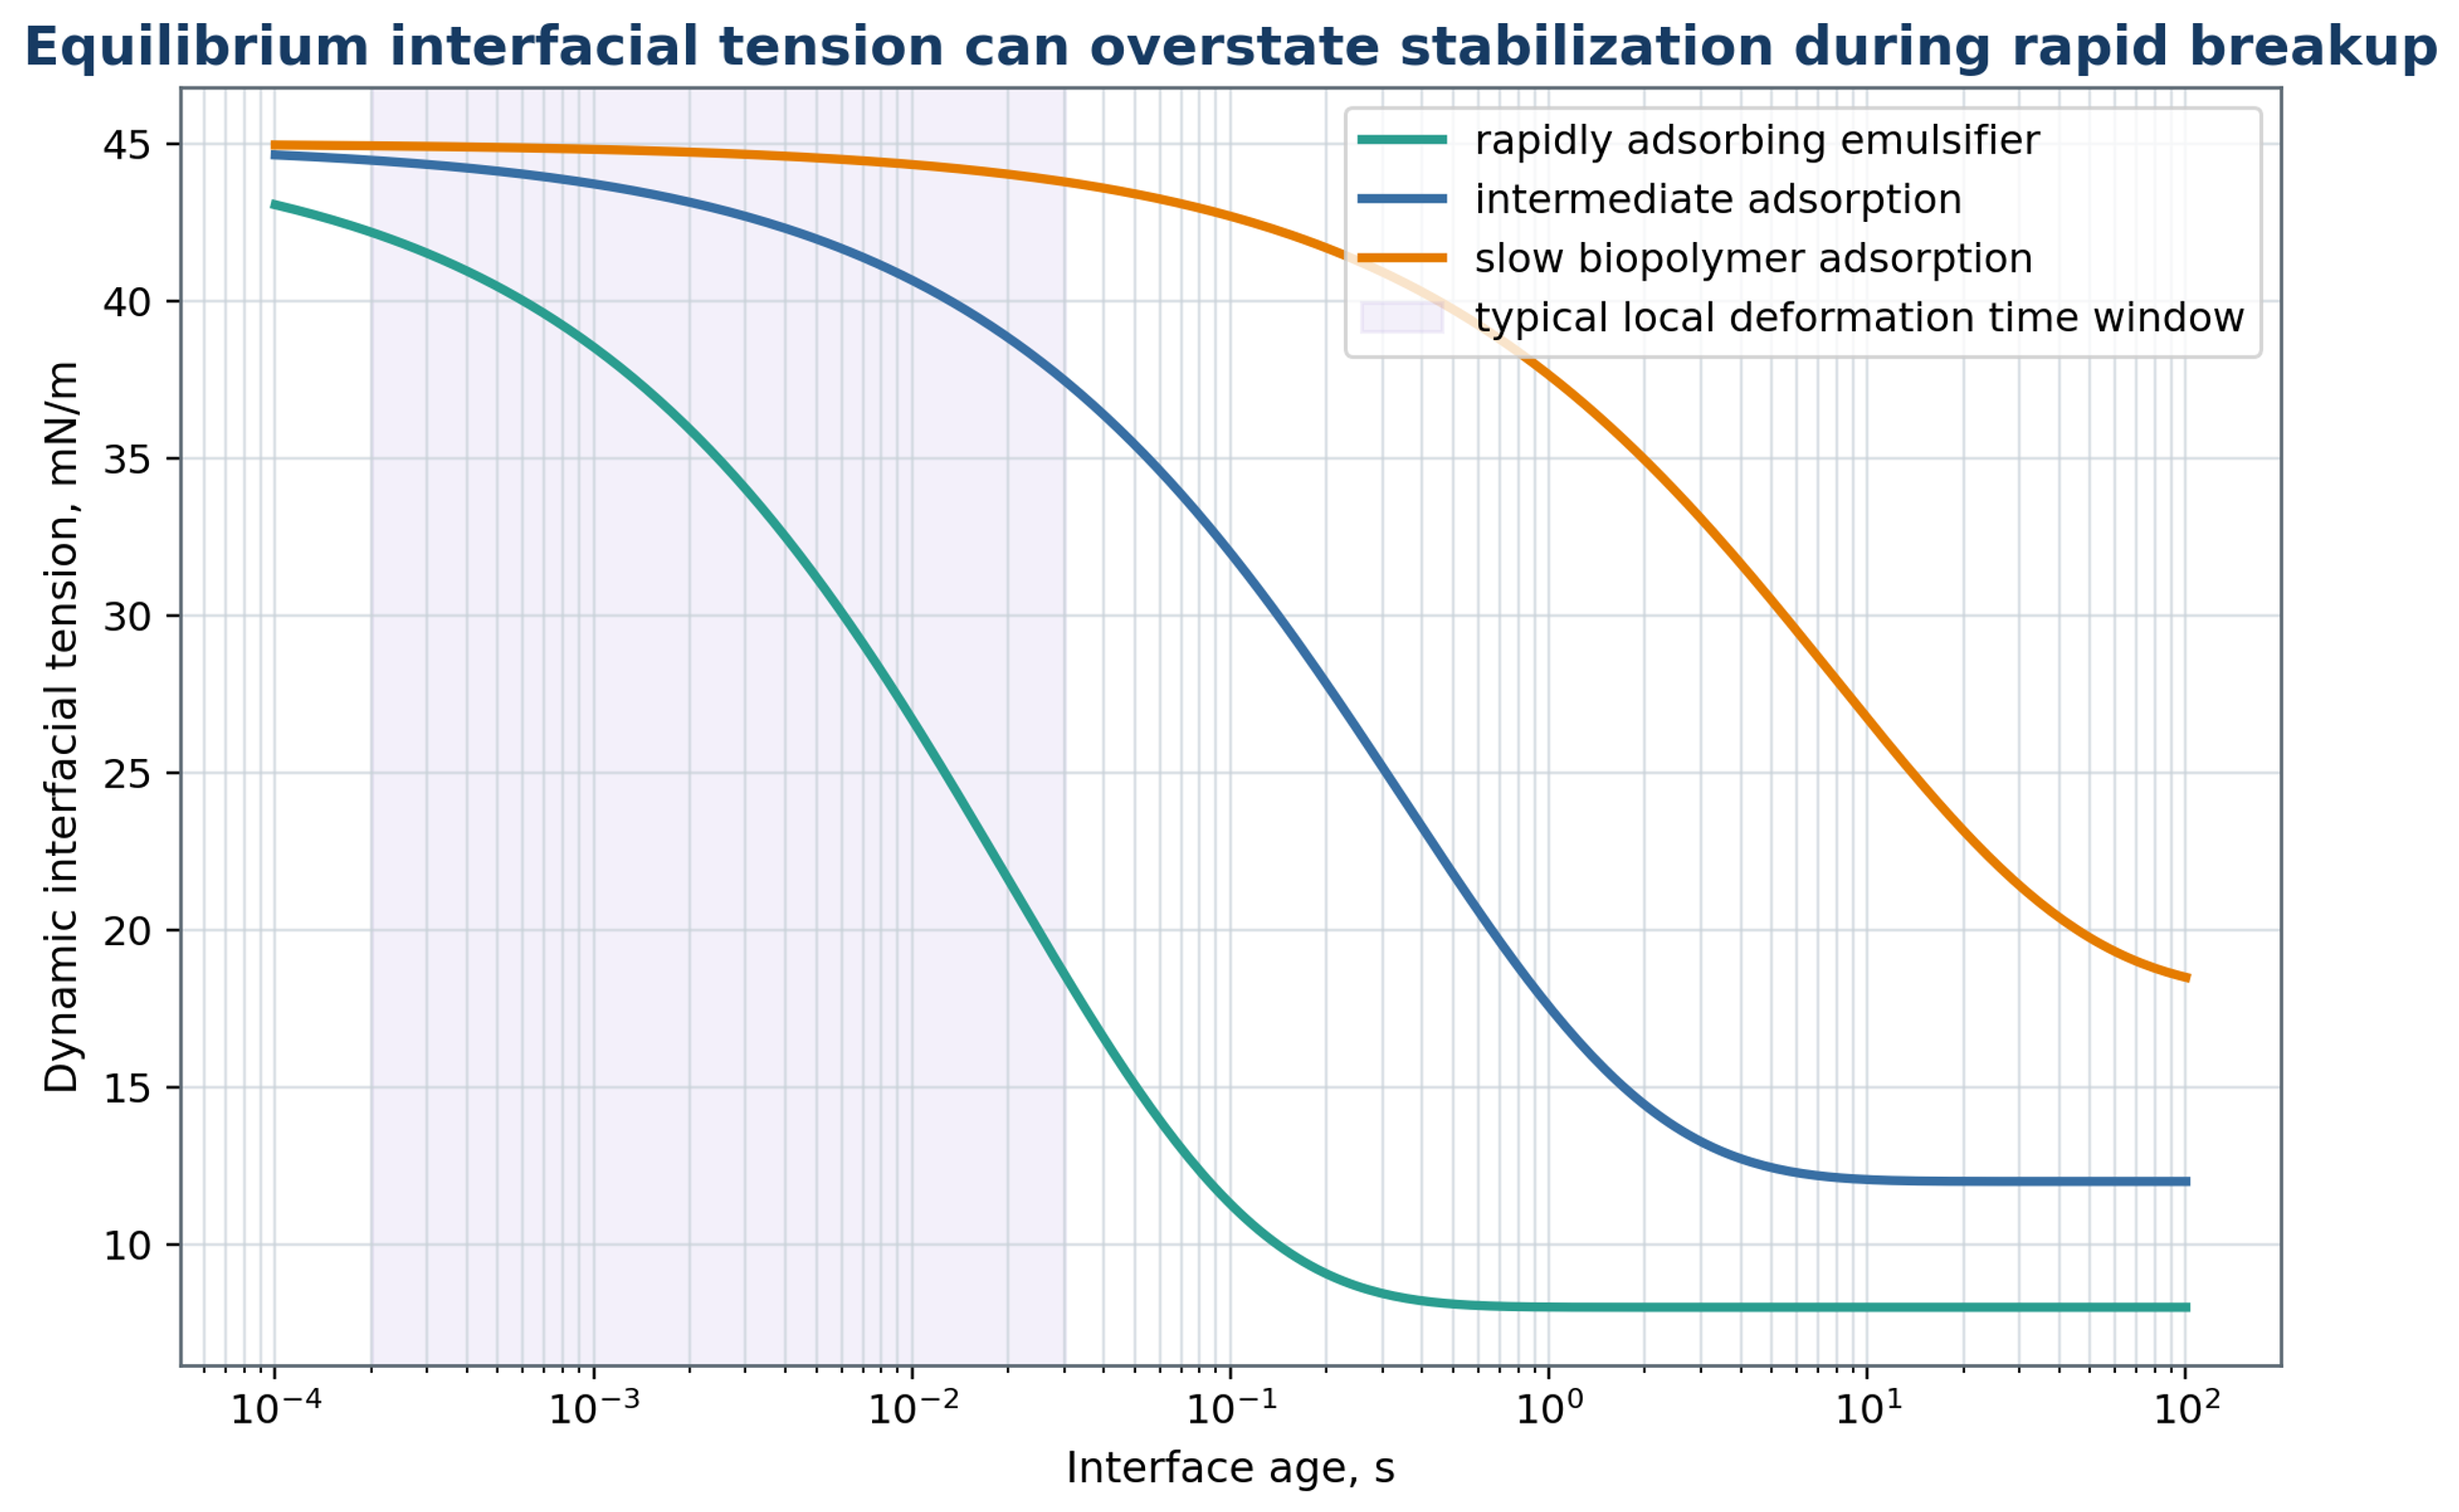
Figure 5.1. Schematic dynamic interfacial tension histories for relatively fast, intermediate, and slow adsorption. The curves illustrate a distribution of adsorption responses and are not numerical evaluations of the single exponential approximation in equation (5.1).
5.2 Adsorption, surface coverage, and interfacial rheology
Adsorption determines the amount and state of emulsifier present at the interface, while interfacial rheology describes the mechanical response of the resulting layer. These properties are related but not identical. A formulation can contain enough emulsifier in total and still fail to protect newly formed droplets if transport is slow or a substantial fraction is unavailable for adsorption. As an equilibrium approximation for a single class of adsorption sites, the Langmuir relation is
where is surface excess, is the limiting coverage, K is an adsorption equilibrium constant, and is bulk emulsifier concentration. The concentration convention and units used for K must be consistent with those of .
For a specified adsorbed mass per unit area, the minimum mass required to cover the total interface is estimated by
where is the required surface concentration expressed as mass per unit area. This is an interfacial inventory calculation rather than a complete formulation dosage.
The ratio of available emulsifier to the amount required for the calculated interface is
where denotes the mass that can contribute to adsorption under the process conditions.
A coverage ratio below unity identifies an inventory deficit for the assumed area and target coverage. A ratio above unity does not establish kinetic stability. Some emulsifier may remain in bulk aggregates, bind to other formulation components, partition into the second liquid, or reach the interface too slowly. The mass balance and the adsorption timescale must therefore be assessed separately.
Padron reported a nonmonotonic relation between surfactant concentration and mean droplet size in a batch rotor stator mixer, despite the accompanying reduction in equilibrium interfacial tension [2]. Adsorption dynamics and interfacial dilatational response affected both deformation and stabilization. The critical micelle concentration therefore does not, by itself, identify the formulation that gives the smallest retained droplets. Concentration screening should consider the measured droplet distribution and interfacial response as well as equilibrium tension.
Interfacial deformation can also be resisted by a dilatational response, which describes how interfacial tension changes with area. The signed coefficient used here is defined by
The conventional dilatational elasticity is = A dσ/dA, whereas the signed coefficient in equation (5.6) satisfies = −. Thus, a positive conventional elastic modulus corresponds to a negative under the definition above. The magnitude || is used when discussing the resistance of an interface to deformation [31].
A large magnitude of interfacial elasticity can oppose rapid changes in area and thereby influence breakup as well as stabilization after breakup. Gradients of interfacial tension generate Marangoni stresses that oppose interfacial motion and can retard film drainage. Protein and polymer layers may also display time dependent elastic and viscous responses. Consequently, equilibrium tension alone cannot describe the resistance of a coated droplet to deformation or the behavior of the film between colliding droplets.
Interfacial response also depends on exchange of emulsifier with both liquid phases. Oscillating drop measurements by Kovalchuk and coauthors showed that the frequency dependent modulus of a nonionic surfactant at a water and hexane interface could be described only after accounting for partitioning and transport on both sides of the interface [32]. For process interpretation, this means that a modulus measured at one frequency and phase composition should not be transferred directly to a different deformation timescale or solvent pair. The appropriate interfacial measurement should reproduce the relevant chemical environment.
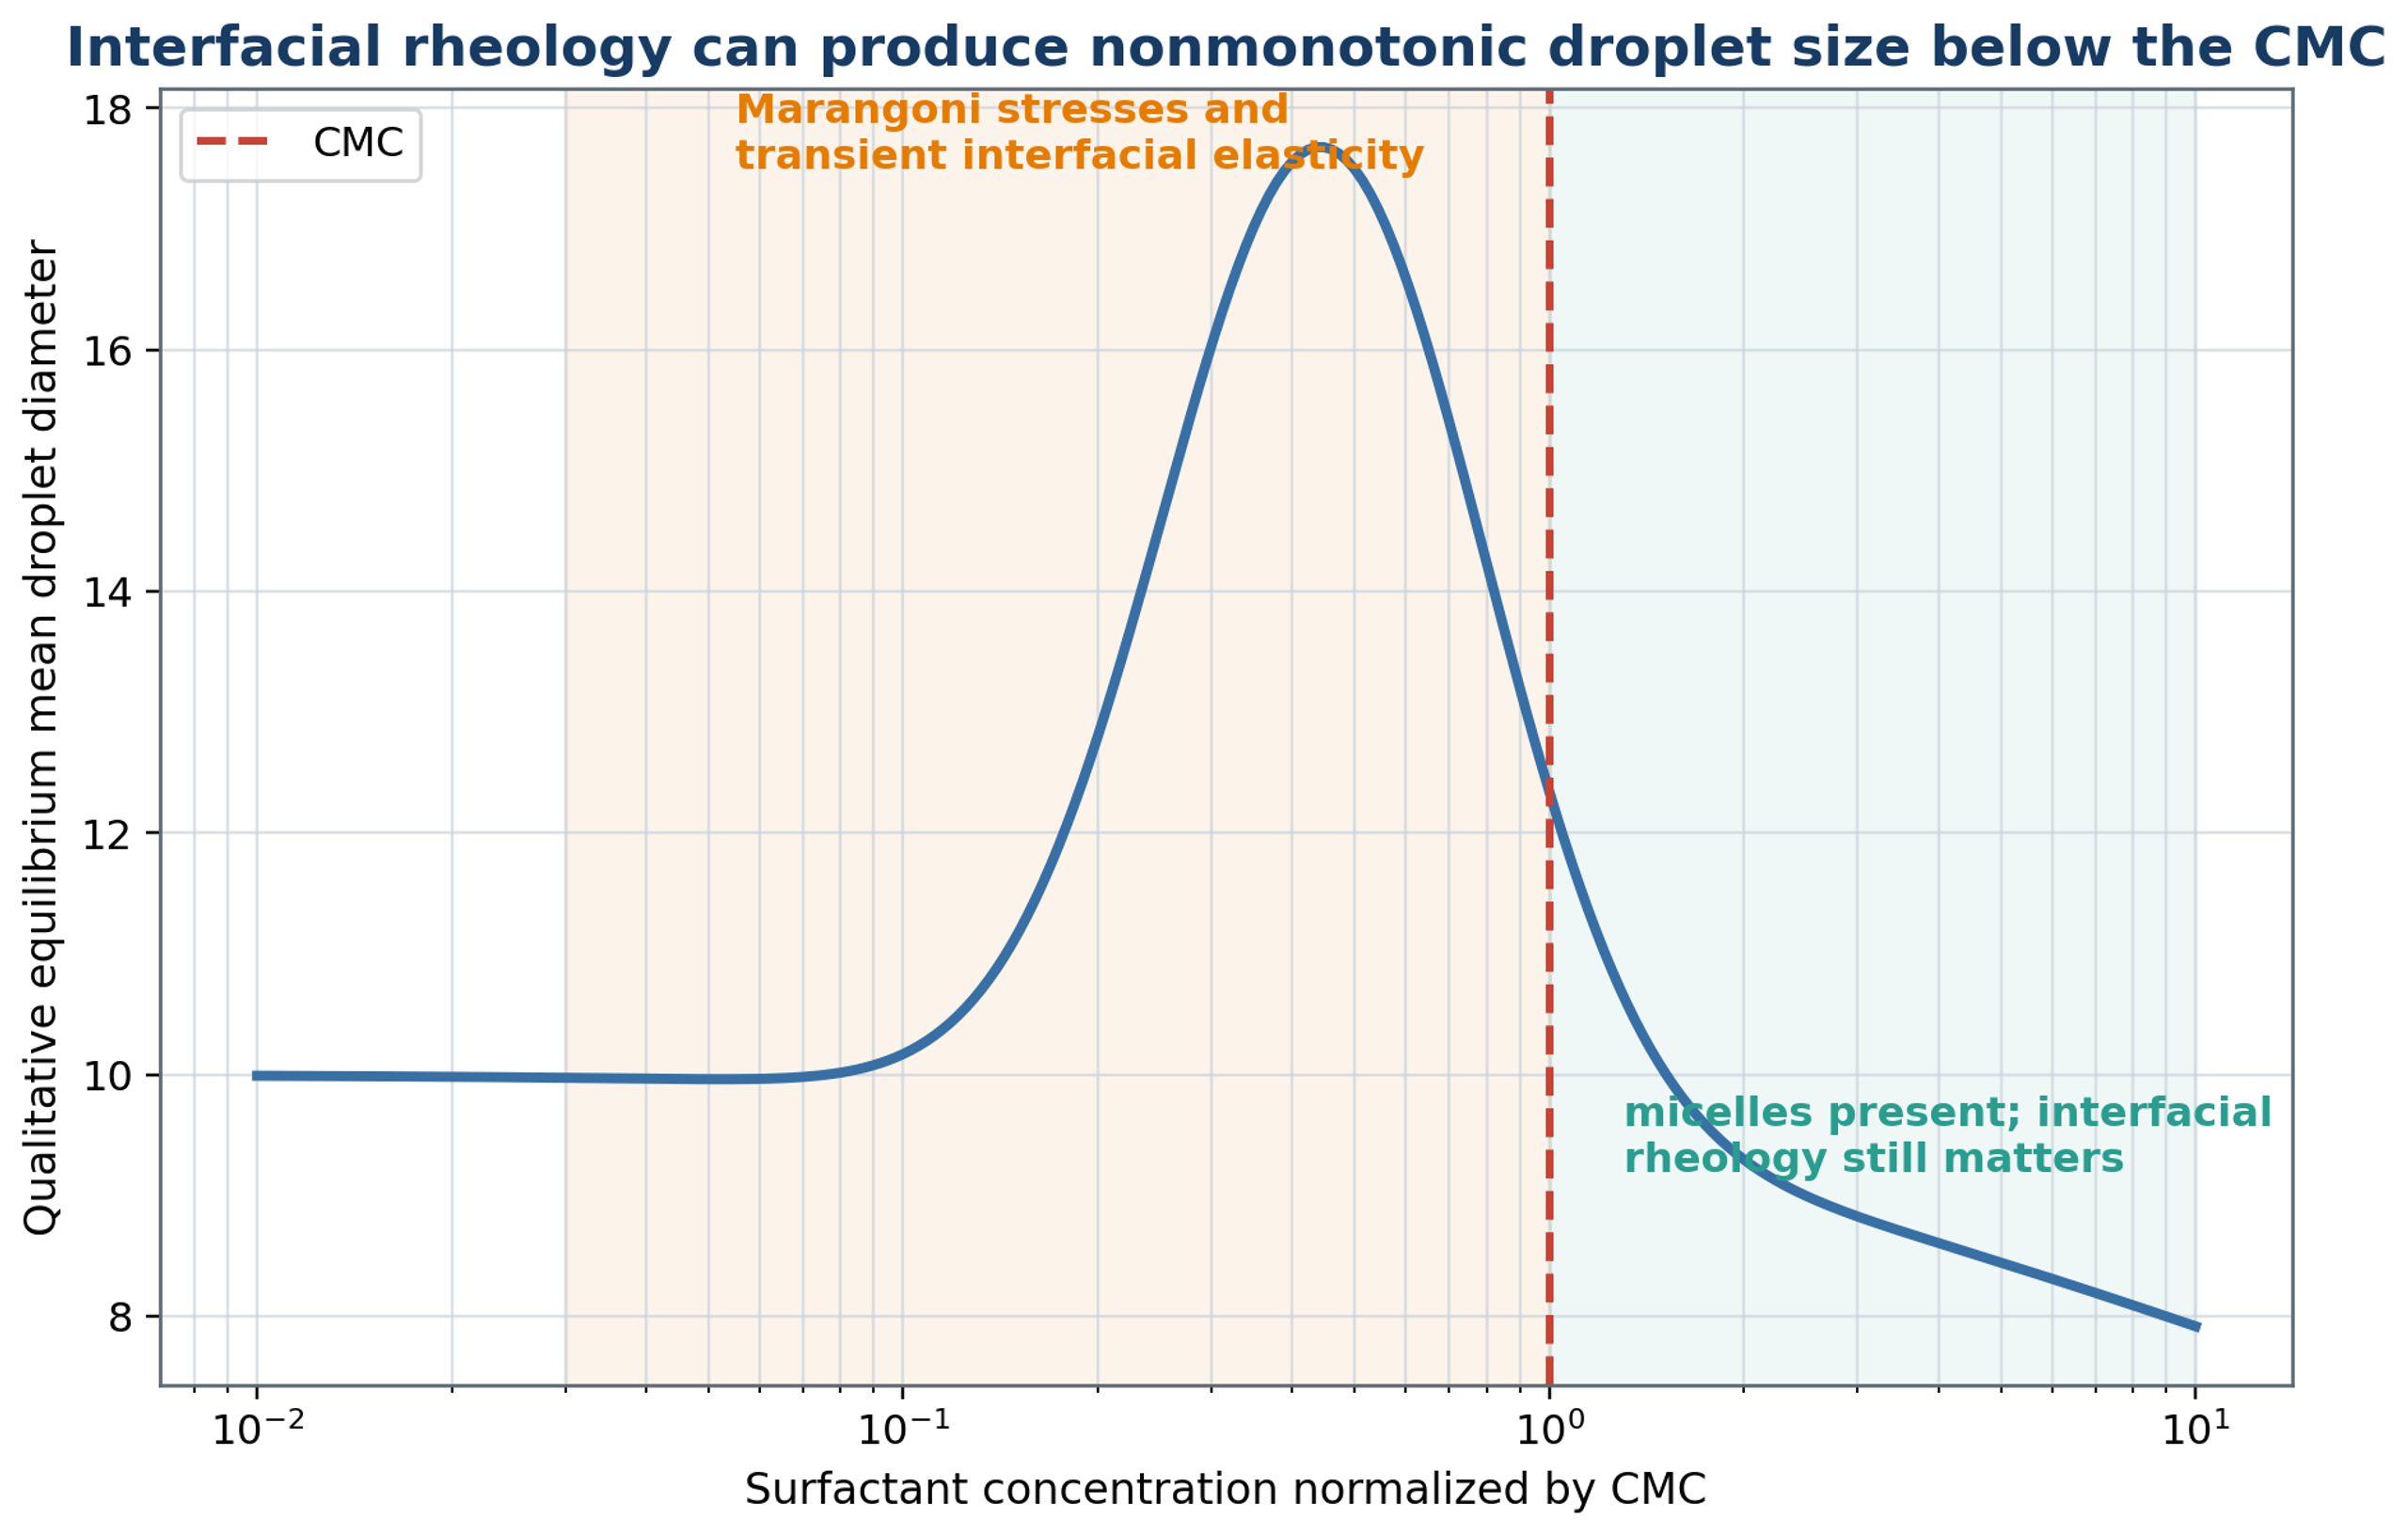
Figure 5.2. Conceptual nonmonotonic droplet response near the critical micelle concentration, motivated by the role of adsorption and interfacial rheology discussed by Padron [2]. The curve is schematic and is not a reproduced experimental dataset.
Table 5.1. Formulation variables that control rotor stator emulsification.
| Variable | Breakup effect | Stabilization effect | Required measurement |
|---|---|---|---|
| Interfacial tension | Lower tension reduces capillary resistance | May reflect adsorption only after sufficient time | Dynamic and equilibrium tension at process temperature |
| Emulsifier concentration | Can lower tension and alter interfacial mobility | Provides surface coverage | Free concentration, CMC region, adsorption time |
| Continuous phase viscosity | Raises viscous stress but damps turbulence | Slows creaming and film drainage | Flow curve at process temperature |
| Dispersed phase viscosity | Resists internal circulation and necking | Can slow film deformation | Viscosity at process temperature |
| Density difference | Minor direct breakup effect | Controls creaming or sedimentation | Density of both phases |
| Phase fraction | Raises collision rate and apparent viscosity | Increases surface demand and inversion risk | Composition, conductivity, rheology |
| Temperature | Usually lowers viscosity and tension | Changes adsorption, oxidation, and vapor pressure | Inlet, outlet, and cumulative temperature history |
| Dissolved gas | Changes cavitation inception | Can promote foam and cushion collapse | Dissolved oxygen or gas content |
6 Droplet deformation and breakup
Droplet deformation results from competition between external stresses and the restoring effects of interfacial tension and internal viscous motion. The same mixer can contain regions governed by different stress mechanisms, and individual droplets can move between them during processing. Dimensionless stress criteria, turbulent length scales, and response times are therefore considered together. The resulting equations are regime dependent approximations intended to support interpretation and calibration, rather than a universal prediction of every droplet trajectory.
6.1 Dimensionless stress criteria
Dimensionless stress groups compare the forces that promote deformation with the forces that restore the droplet shape. Breakup requires both a sufficient stress magnitude and an exposure long enough for substantial deformation to develop. Inertia, continuous phase viscosity, dispersed phase viscosity, density ratio, and interfacial tension enter these comparisons in different ways. The Weber number compares an inertial stress scale with the capillary resistance:
where is a relative velocity scale appropriate to the droplet and surrounding flow. Rotor tip speed and droplet scale velocity fluctuations represent different choices and should be distinguished when comparing correlations.
The capillary number expresses the ratio of a viscous stress scale to capillary resistance:
The Ohnesorge number measures the contribution of dispersed phase viscosity relative to inertial and capillary effects:
The viscosity ratio separately characterizes the contrast between internal and external viscous resistance:
The corresponding density ratio is
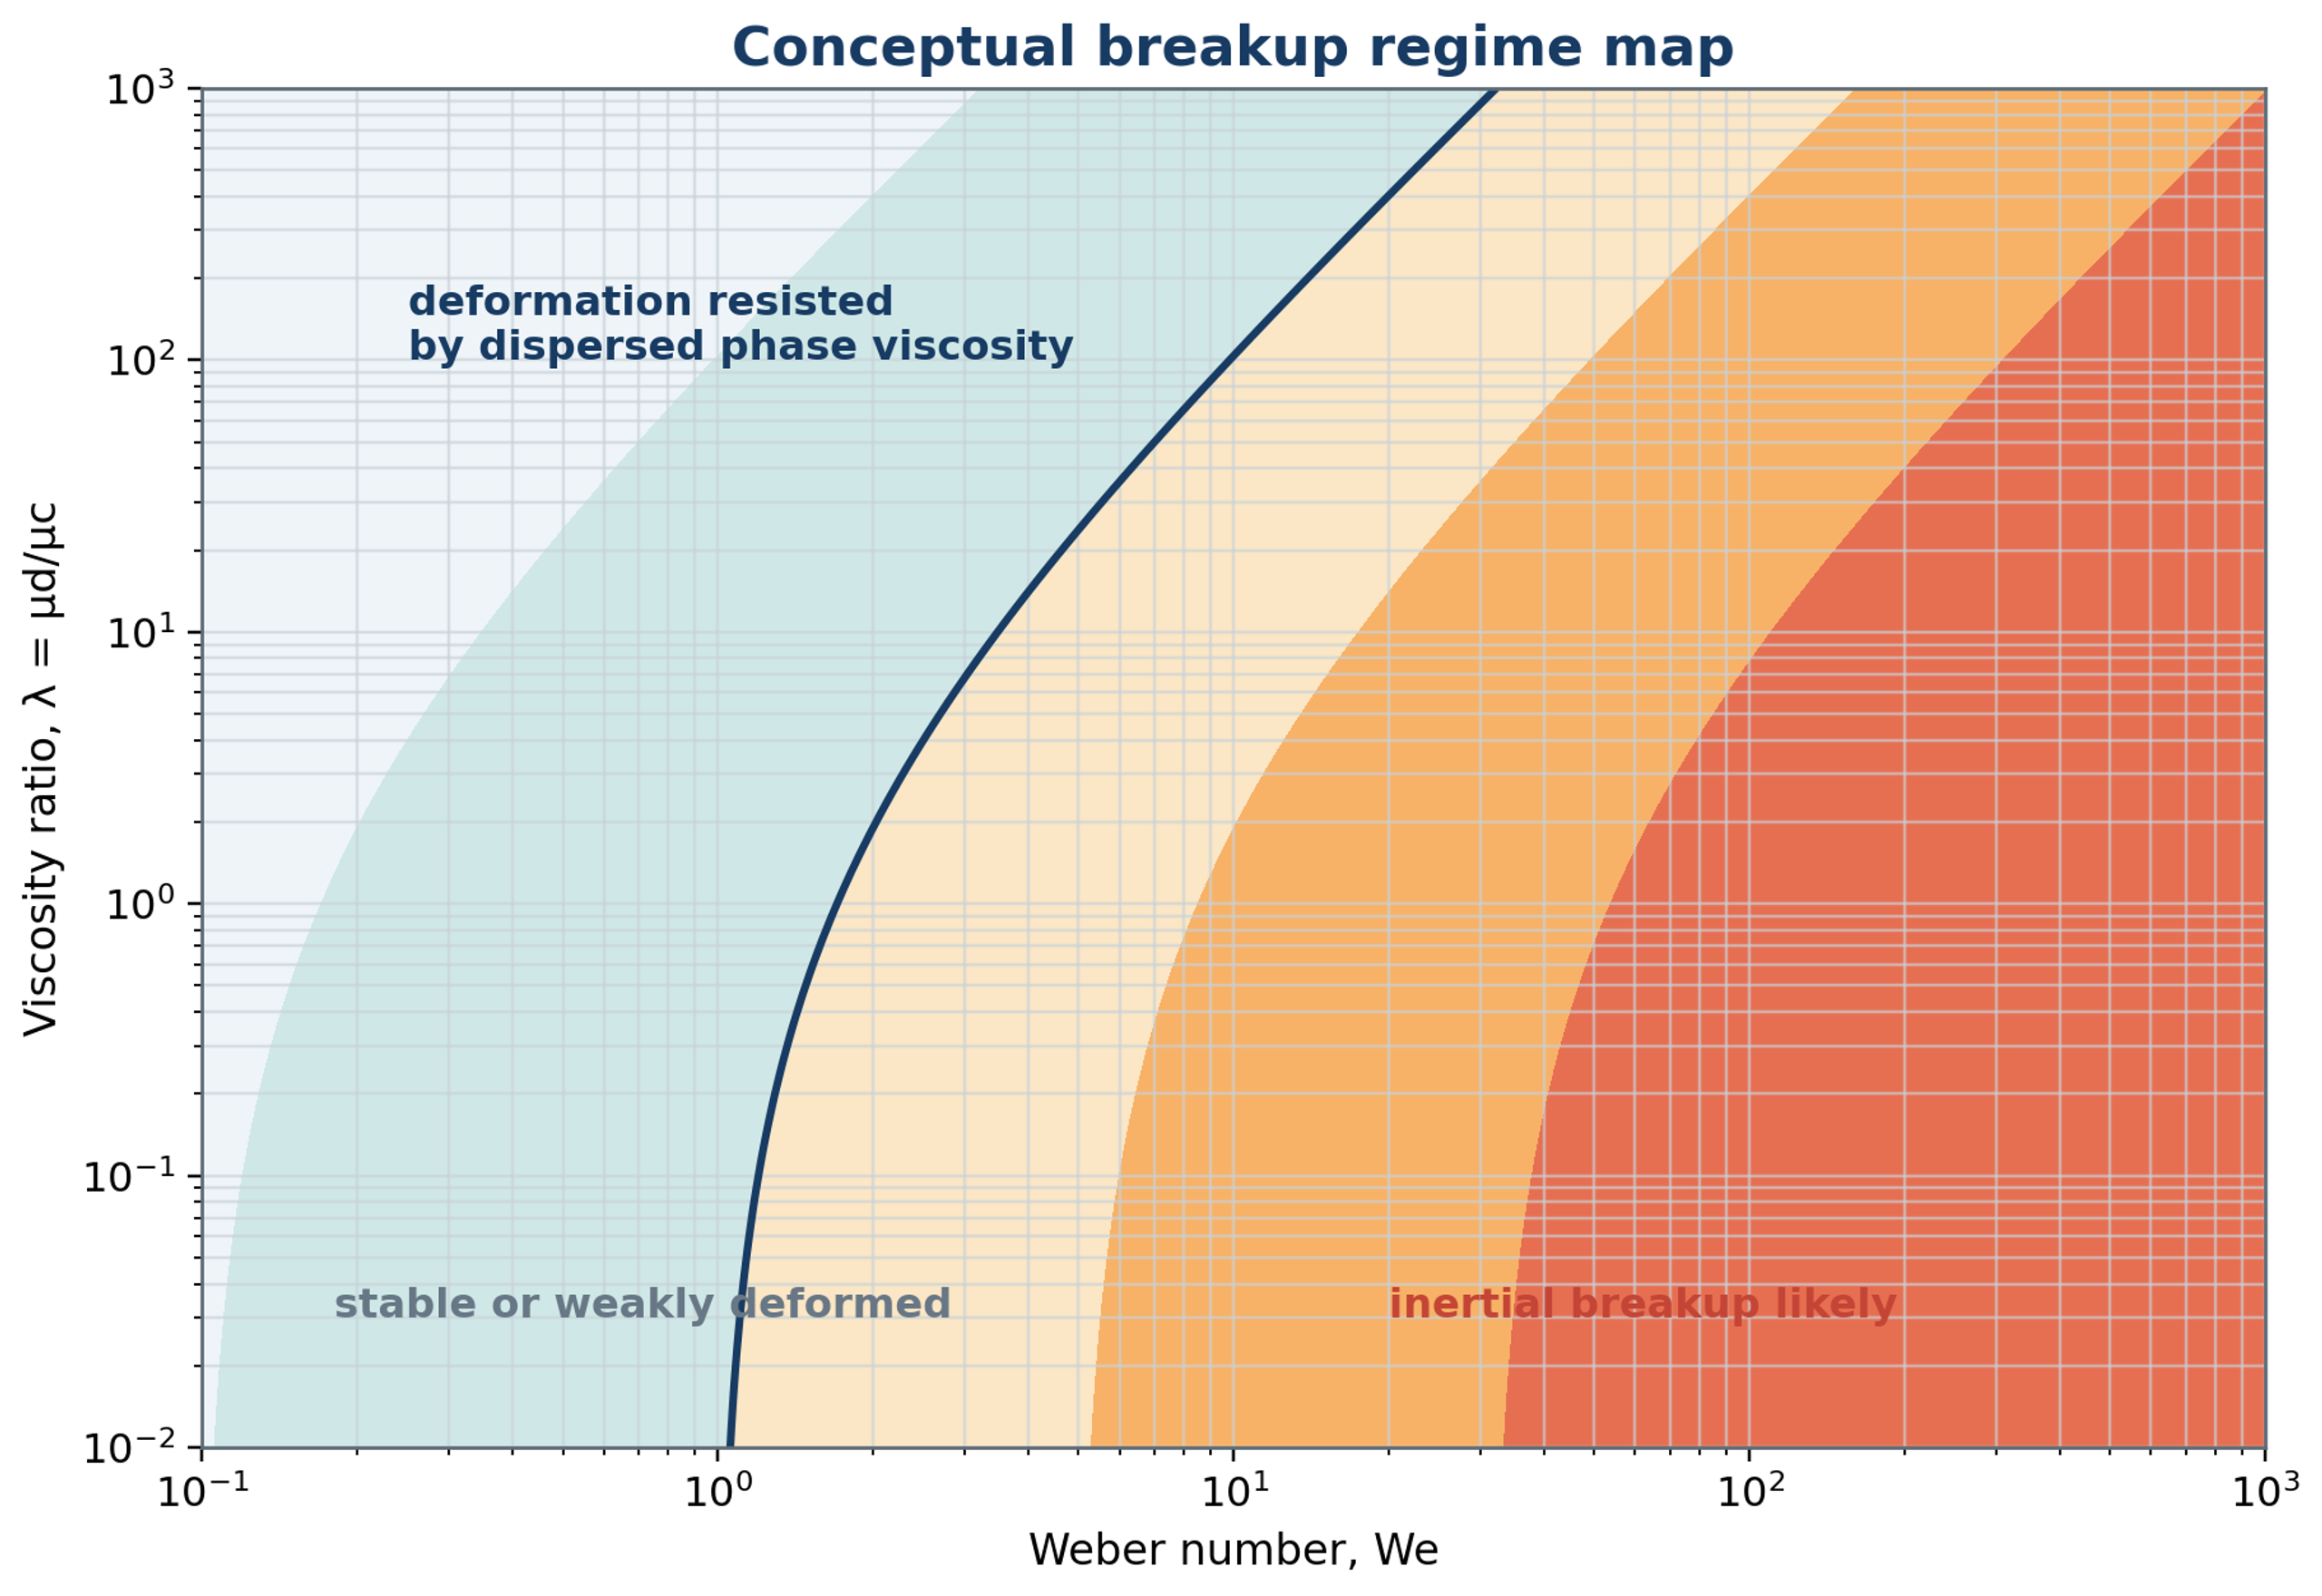
Figure 6.1. Conceptual map of droplet response in terms of Weber number and viscosity ratio. The boundaries and shaded regions are schematic and are not calibrated transition criteria. Actual breakup probability depends on stress fluctuations, exposure, and interfacial properties.
Critical values of these groups depend on flow type, deformation history, stress duration, interfacial mobility, confinement, and viscosity ratio. In turbulent flow, individual droplets experience different fluctuations even at the same mean operating condition. A droplet may survive repeated weak events and fragment during a less frequent intense event [24, 25]. The groups therefore support regime identification and probabilistic breakup models rather than a universal deterministic threshold. A fitted critical value should be reported with the velocity definition, observation interval, and formulation used to obtain it.
6.2 Turbulent length and time scales
Turbulent length and time scales help identify whether a droplet experiences inertial fluctuations or a locally smooth velocity gradient. This distinction is needed before applying a breakup correlation. The relevant scales depend on continuous phase viscosity and the local rate of kinetic energy dissipation, which can differ substantially from an average over the vessel. The continuous phase kinematic viscosity is
For a local energy dissipation rate per unit mass , the Kolmogorov length is
The associated Kolmogorov time is
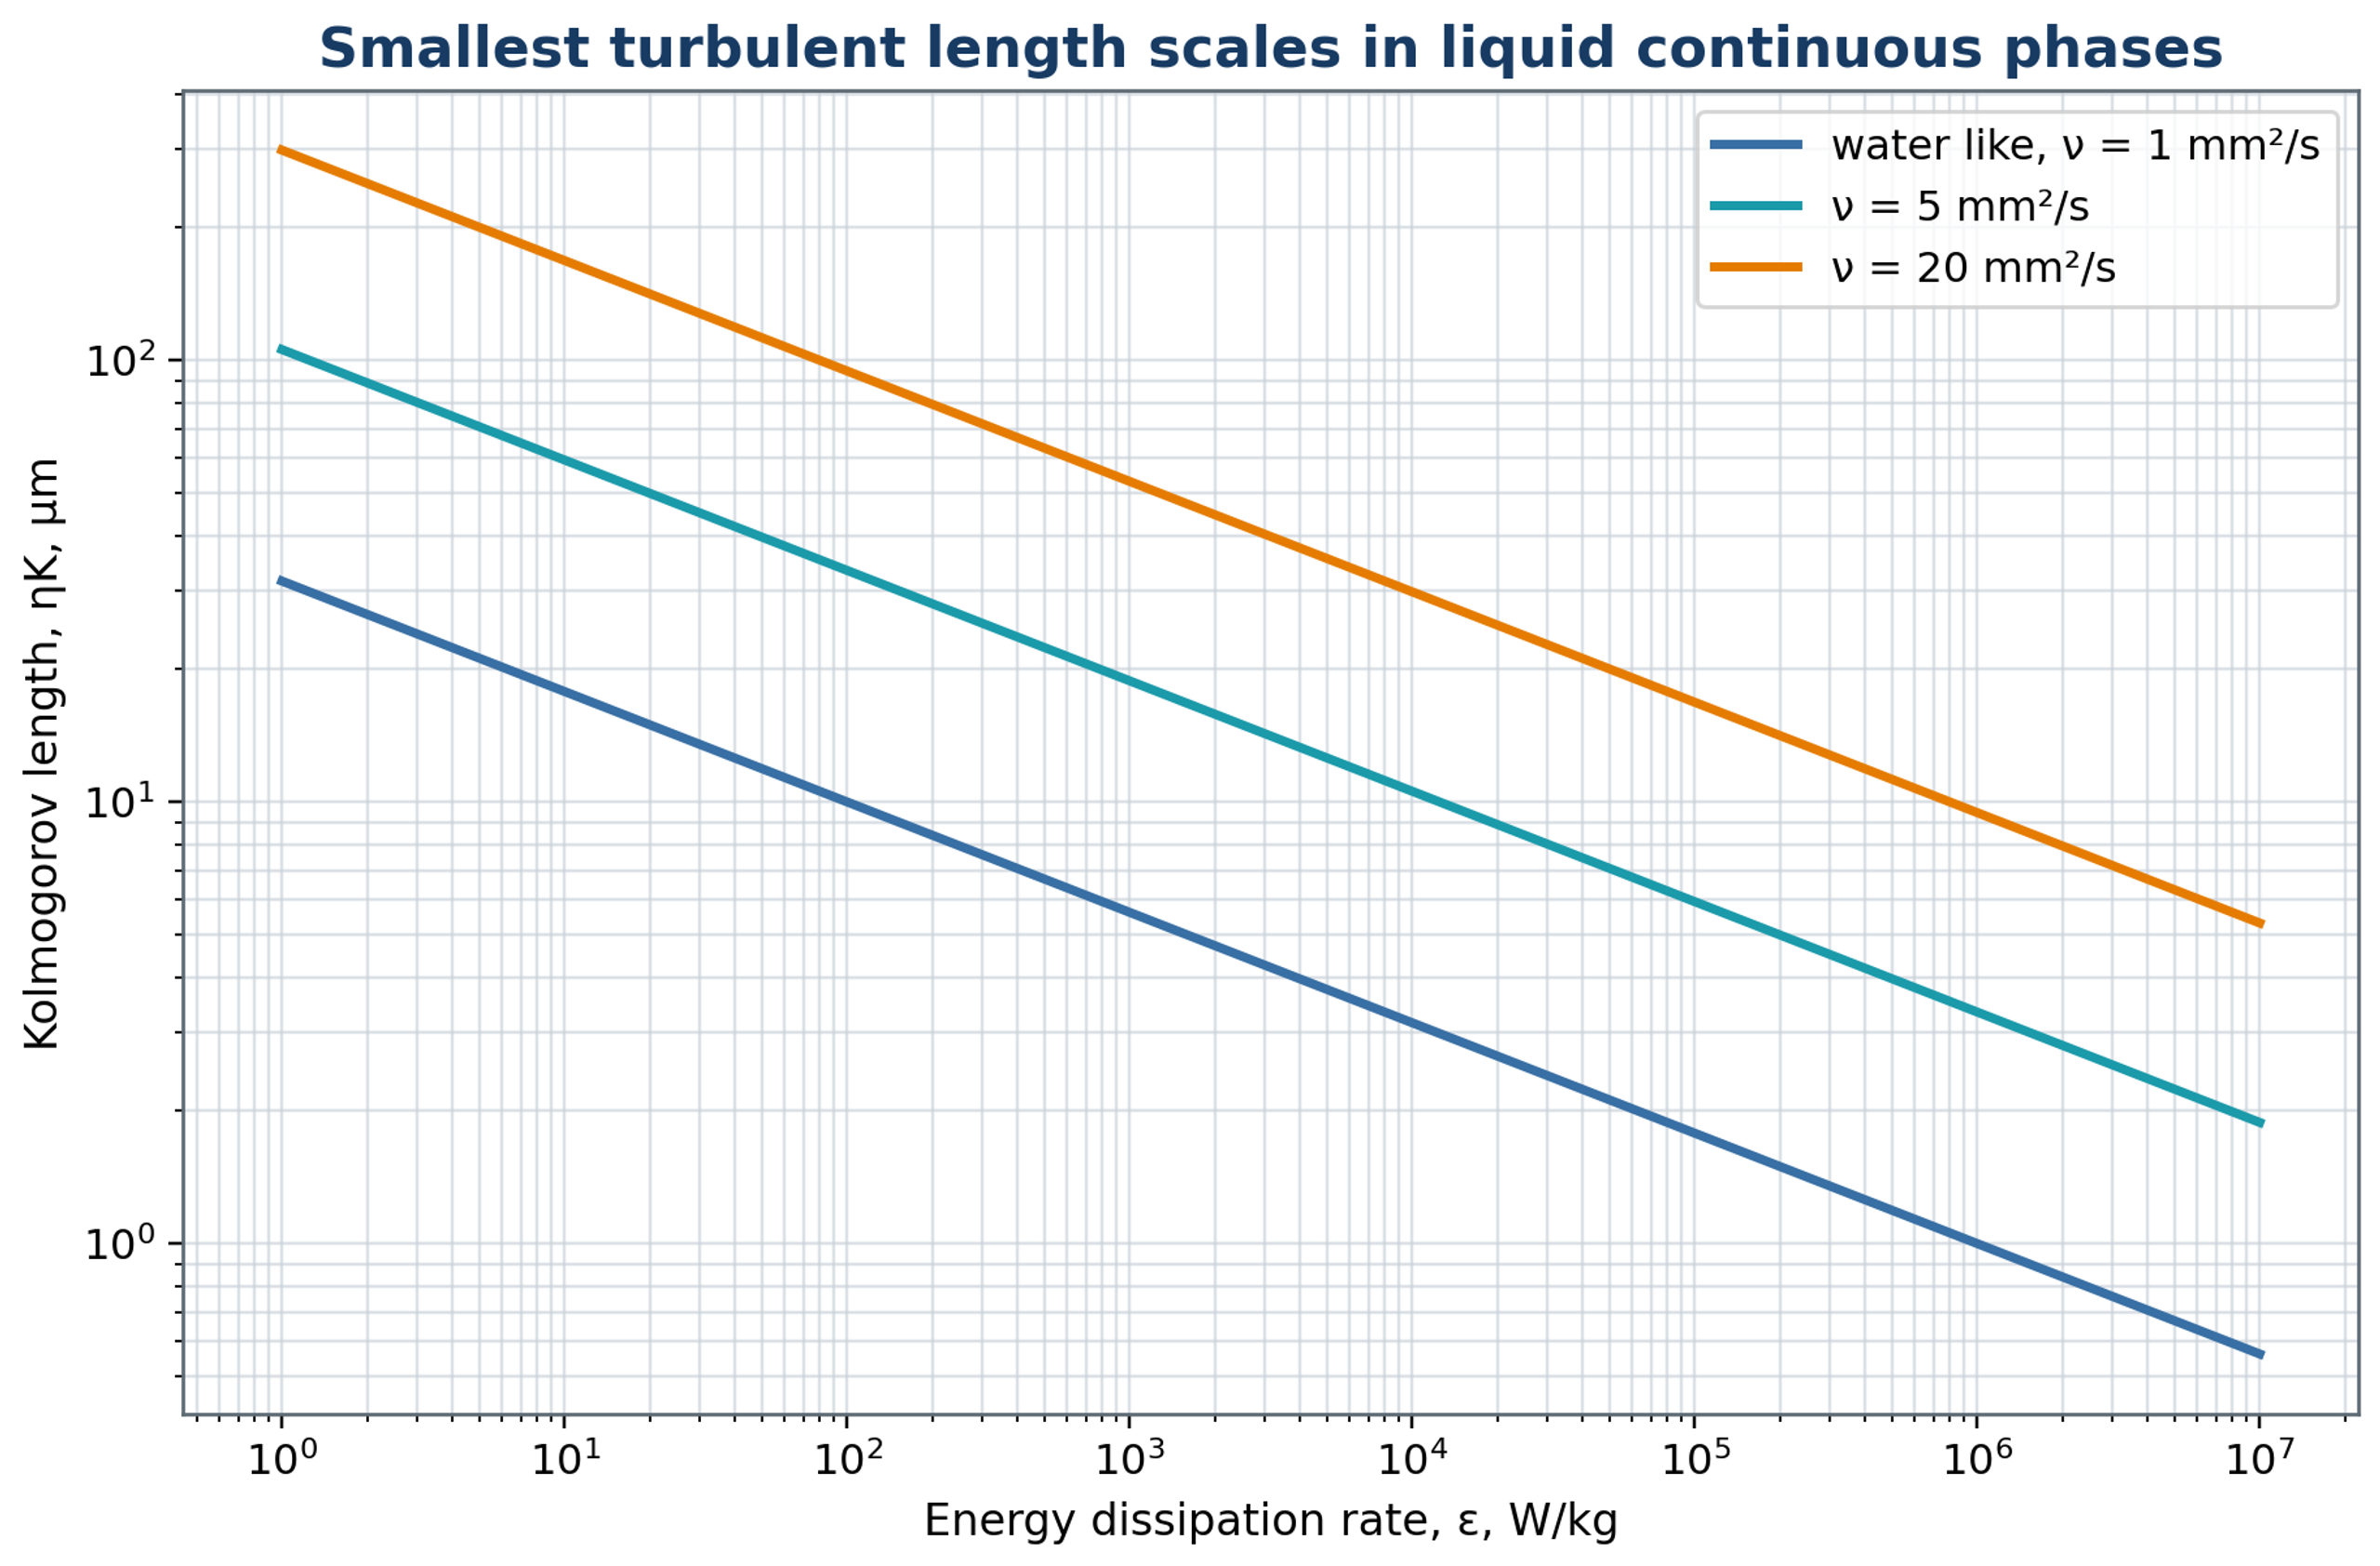
Figure 6.2. Calculated dependence of the Kolmogorov length scale on energy dissipation for the representative continuous phase kinematic viscosities indicated in the plot, following equation (6.7).
For droplets within the inertial subrange, larger than the dissipative scale but smaller than the energy containing eddies, the velocity difference across a droplet scales as
The corresponding turbulent inertial stress scale is
The capillary restoring stress is of the order
Equating the turbulent inertial and capillary stress scales gives an estimate of the maximum stable diameter:
where is a coefficient whose fitted value depends on the definitions and the experimental regime. Its transferability must be established for the relevant geometry and formulation.
Equation (6.12) is a Kolmogorov Hinze type relation. It predicts a decrease in the characteristic limiting size as dissipation increases or interfacial tension decreases, within the assumptions of turbulent inertial breakup. It does not explicitly account for finite residence time, adsorption, coalescence, confinement, or cavitation. Moreover, maximum stable diameter is not automatically identical to a measured Sauter mean. Using average shaft power to estimate local dissipation without specifying the active volume can absorb unresolved geometry effects into the fitted coefficient [3, 4, 8].
Formulation effects remain relevant even within an experimentally identified turbulent inertial regime. Campardelli and coauthors studied emulsions prepared with paraffin, soybean oil, and isopropyl myristate over several rotational speeds and oil fractions. Their regression framework included dispersed phase concentration and physical properties in addition to the flow related variables [4]. This provides experimental support for testing correlations across more than one liquid pair and composition. A successful fit for a single formulation should not be treated as evidence that viscosity, phase fraction, or interfacial properties can be omitted during transfer to another product.
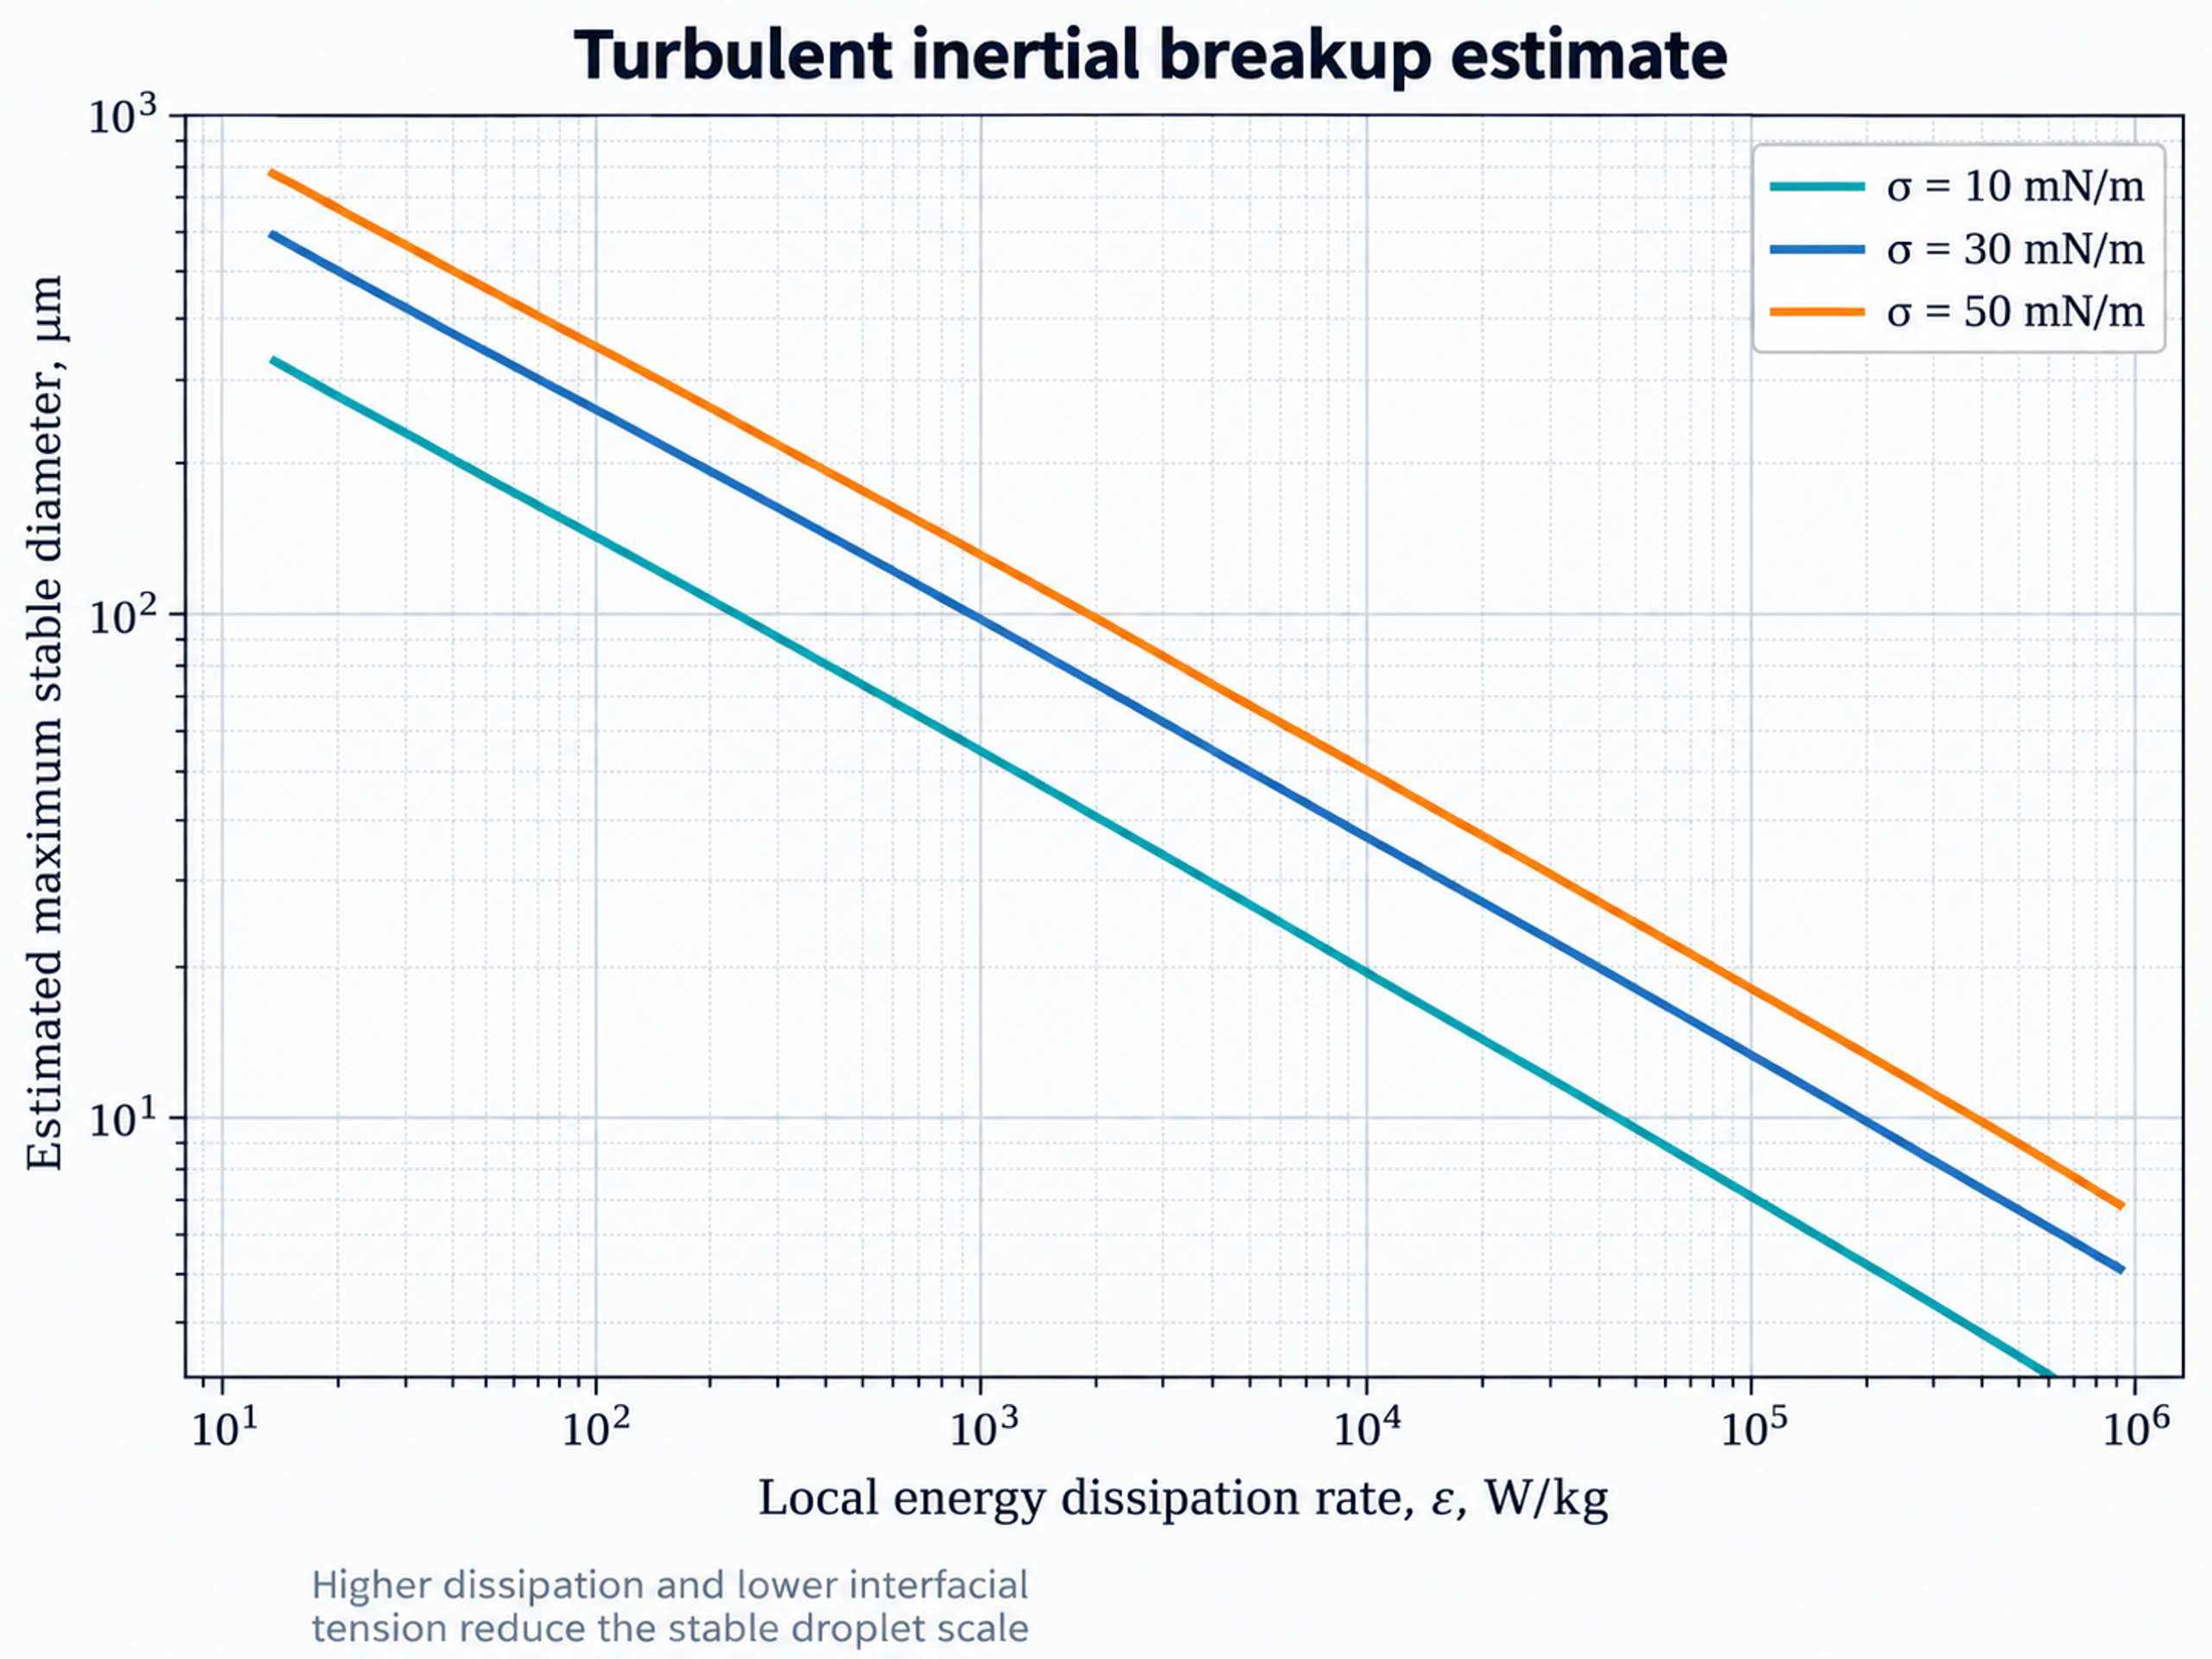
Figure 6.3. Illustrative turbulent inertial dependence of a maximum stable droplet scale on local energy dissipation and interfacial tension, consistent with equation (6.12). The curves use representative properties and do not directly predict a measured Sauter mean diameter.
A capillary response timescale can be estimated from the balance of continuous phase inertia and interfacial tension:
The inertial eddy timescale associated with the droplet diameter is
Substantial deformation requires adequate disruptive stress and sufficient time for the droplet to respond. A short pulse and a longer exposure with the same peak stress need not produce the same outcome. The ratio of stress duration to capillary response time is
which provides a timescale comparison rather than an independent universal breakup threshold. In these expressions denotes a capillary response time; in the preceding stress balance the same source symbol denotes a capillary stress. The physical quantity and units must therefore be identified from the equation context.
6.3 Viscous breakup regime
When the droplet is smaller than the smallest turbulent eddies, the surrounding velocity field is approximately smooth over its dimensions. Deformation can then be described in terms of a local strain rate and viscous stress rather than an inertial velocity difference across the droplet. The attainable size still depends on viscosity ratio, flow type, and interfacial response. A simplified estimate of a limiting diameter in this regime is
The effective strain rate must represent the deformation actually experienced by the droplets and need not equal the nominal ratio of tip speed to clearance. It may be estimated from validated simulations, local velocity measurements, or an experimentally calibrated relation. In studies by Gazolu Rusanova and coauthors, rapidly adsorbing modified starch supported stable droplets in the approximate range of 100 to 500 nm, whereas gum Arabic produced larger droplets when coalescence remained substantial [6]. The reported results illustrate the need to combine a viscous breakup description with adsorption, temperature, and droplet interaction effects.
6.4 Breakup morphology and fragment distribution
Breakup morphology describes the sequence by which a deformed parent droplet produces its daughter population. Small oscillations may relax without fragmentation. Larger deformations can produce membranes, rims, sheets, or ligaments, while binary breakup creates two principal daughters and more extensive fragmentation creates several. These modes need not occur at the same frequency in all rotor stator flows. Numerical and experimental studies show that stress magnitude, viscosity ratio, and exposure history influence the observed form of breakup and the resulting distribution of daughter sizes [25, 27].
If b(v | ) denotes the expected number of daughter droplets per unit daughter volume produced by a parent of volume , conservation of dispersed volume requires
where v is daughter volume and is parent volume. The integral weights daughter number by daughter volume; b is therefore not a probability density normalized to unity unless it is rescaled explicitly.
The daughter distribution affects the coarse fraction and distribution width independently of the mean diameter. Two devices can yield similar values of while producing different high percentiles, spans, and subsequent stability. A comparison of mixer performance should therefore include the full measured distribution and any evidence of distinct droplet populations.
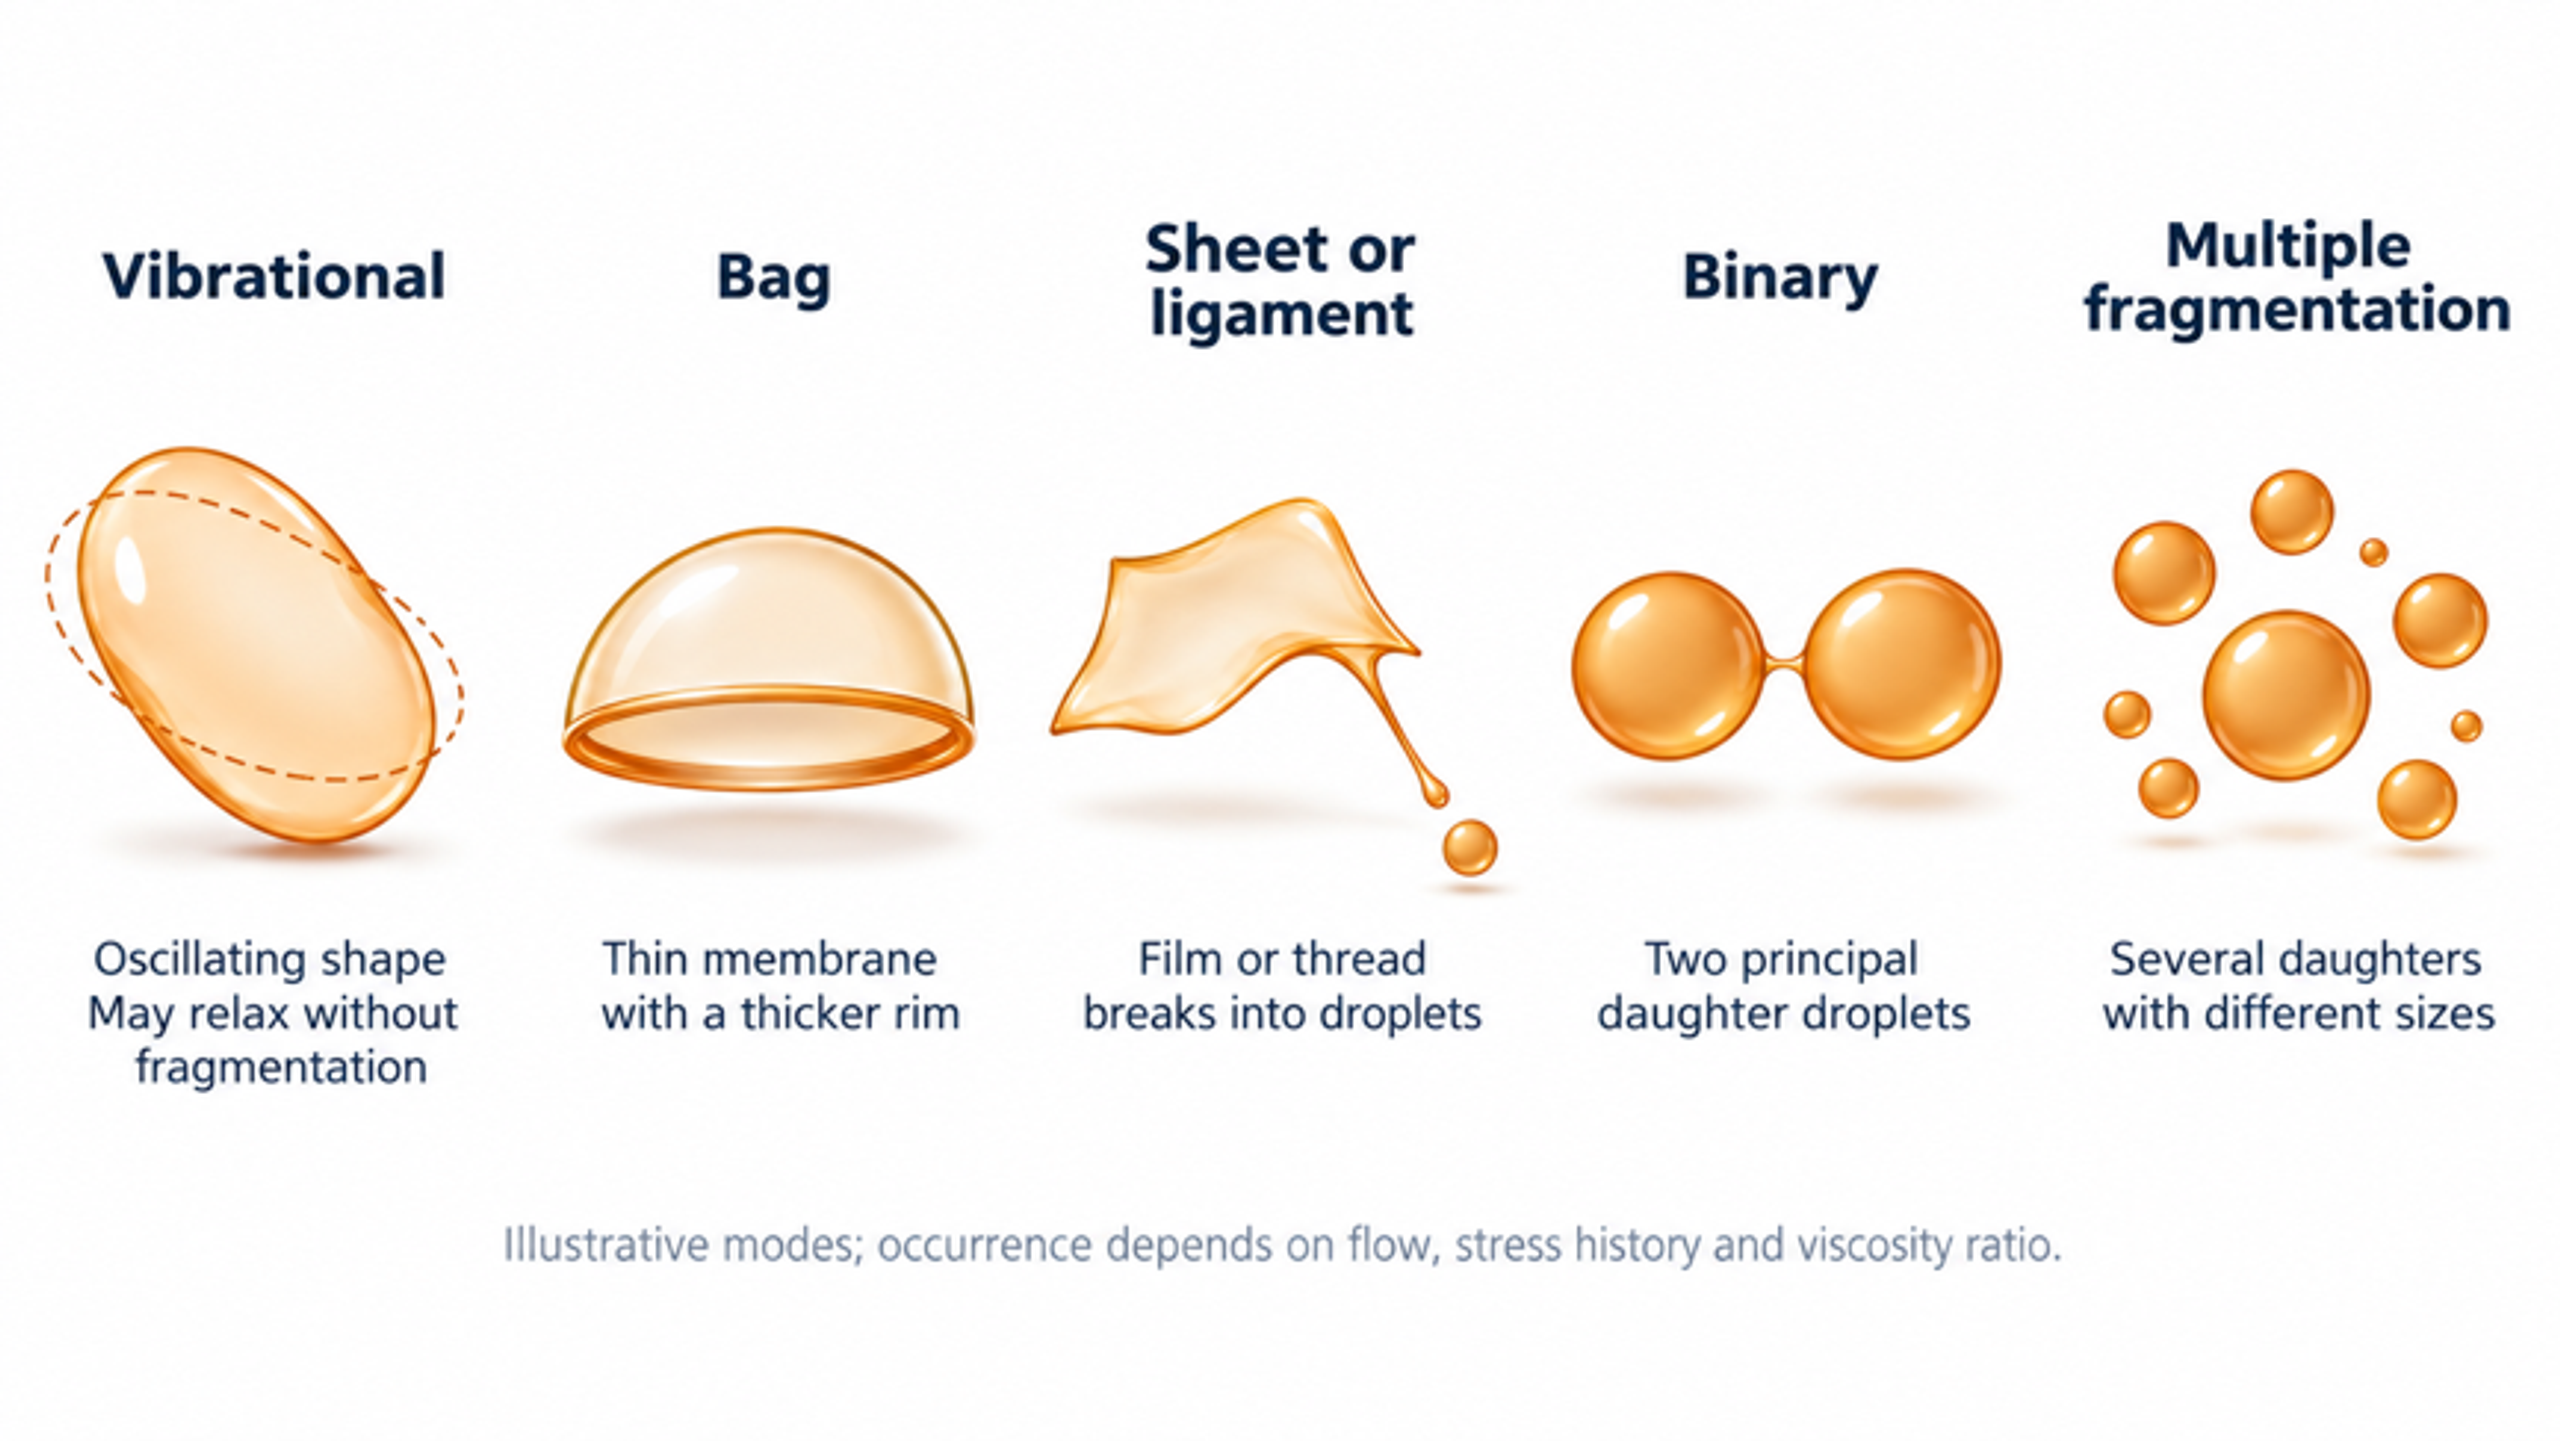
Figure 6.4. Illustrative droplet deformation and fragmentation morphologies. Vibrational deformation, bag formation, sheet or ligament extension, binary fragmentation, and extensive fragmentation represent possible responses to different stress histories. Their occurrence is regime dependent, and the drawings do not define a universal sequence.
7 Coalescence and population balance
The droplet distribution measured after processing reflects both fragmentation and the loss of newly formed droplets through coalescence. These mechanisms alter droplet number in opposite directions while conserving the total dispersed volume when phase transfer is negligible. A population balance provides a systematic way to combine these events with transport and residence time. It also identifies which experimental quantities are required to distinguish a mechanically limited process from one controlled by interfacial stabilization.
7.1 Collision and film drainage
Coalescence is the process by which colliding droplets merge after the intervening continuous phase film drains and ruptures. Collision is necessary but does not guarantee merger. Adsorbed surfactants, proteins, polymers, or particles can change film mobility, introduce repulsive forces, and provide interfacial mechanical resistance. Continuous phase viscosity also affects drainage and contact time. The probability of coalescence therefore depends jointly on hydrodynamics and formulation and cannot be inferred from collision frequency alone.
For droplets assigned to classes i and j, a class pair collision rate can be written as
where is the collision kernel and and are number concentrations. The expression applies directly to distinct classes. For the number of unordered collisions within one class, a factor of one half is required to avoid counting each pair twice.
The fraction of collisions that results in merger is represented by the coalescence efficiency:
where is the probability that a collision produces coalescence under the specified conditions. The same pair counting convention used for the collision rate must be retained.
Turbulent relative motion can increase the collision kernel, whereas effective interfacial stabilization reduces coalescence efficiency. Increasing rotor speed may therefore accelerate both fragmentation and encounters between droplets. The observed population evolves according to the balance of these processes and the distribution of exposure times. A final or slowly changing mean diameter does not imply that all microscopic events have ceased.
7.2 Population balance representation
A population balance describes the evolution of droplet number across size classes while accounting for transport, fragmentation, and coalescence. Unlike a correlation for a single mean diameter, it retains information about the distribution and can connect local flow conditions to the product leaving a device. For a number density expressed per unit physical volume and per unit droplet volume, the balance takes the form
where and denote births and deaths caused by breakup, while and denote births and deaths caused by coalescence. Density also depends on position, although that dependence is suppressed in the displayed notation. The balance shown assumes that droplets share the represented transport velocity; separate slip or spatial dispersion terms may be needed when these effects are significant.
For a breakup frequency that is specified for each droplet volume, the corresponding death term is
where g(v) is the frequency at which droplets of volume v undergo breakup.
The birth term sums daughter droplets created by breakup of all larger parents:
Loss of droplets through coalescence with other sizes is described by
Closure requires the coalescence birth term as well as the displayed loss term. For binary merger, this term collects pairs whose volumes sum to the product droplet volume and includes the pair counting factor needed to prevent duplication. Breakup and coalescence kernels must be calibrated or independently validated and must conserve dispersed volume. Coupling the population balance to computational fluid dynamics also requires consistent treatment of local stress, residence time, and stochastic exposure. A model fitted only to one average diameter can reproduce that quantity while predicting an incorrect distribution or coarse fraction [8, 24, 25, 26].
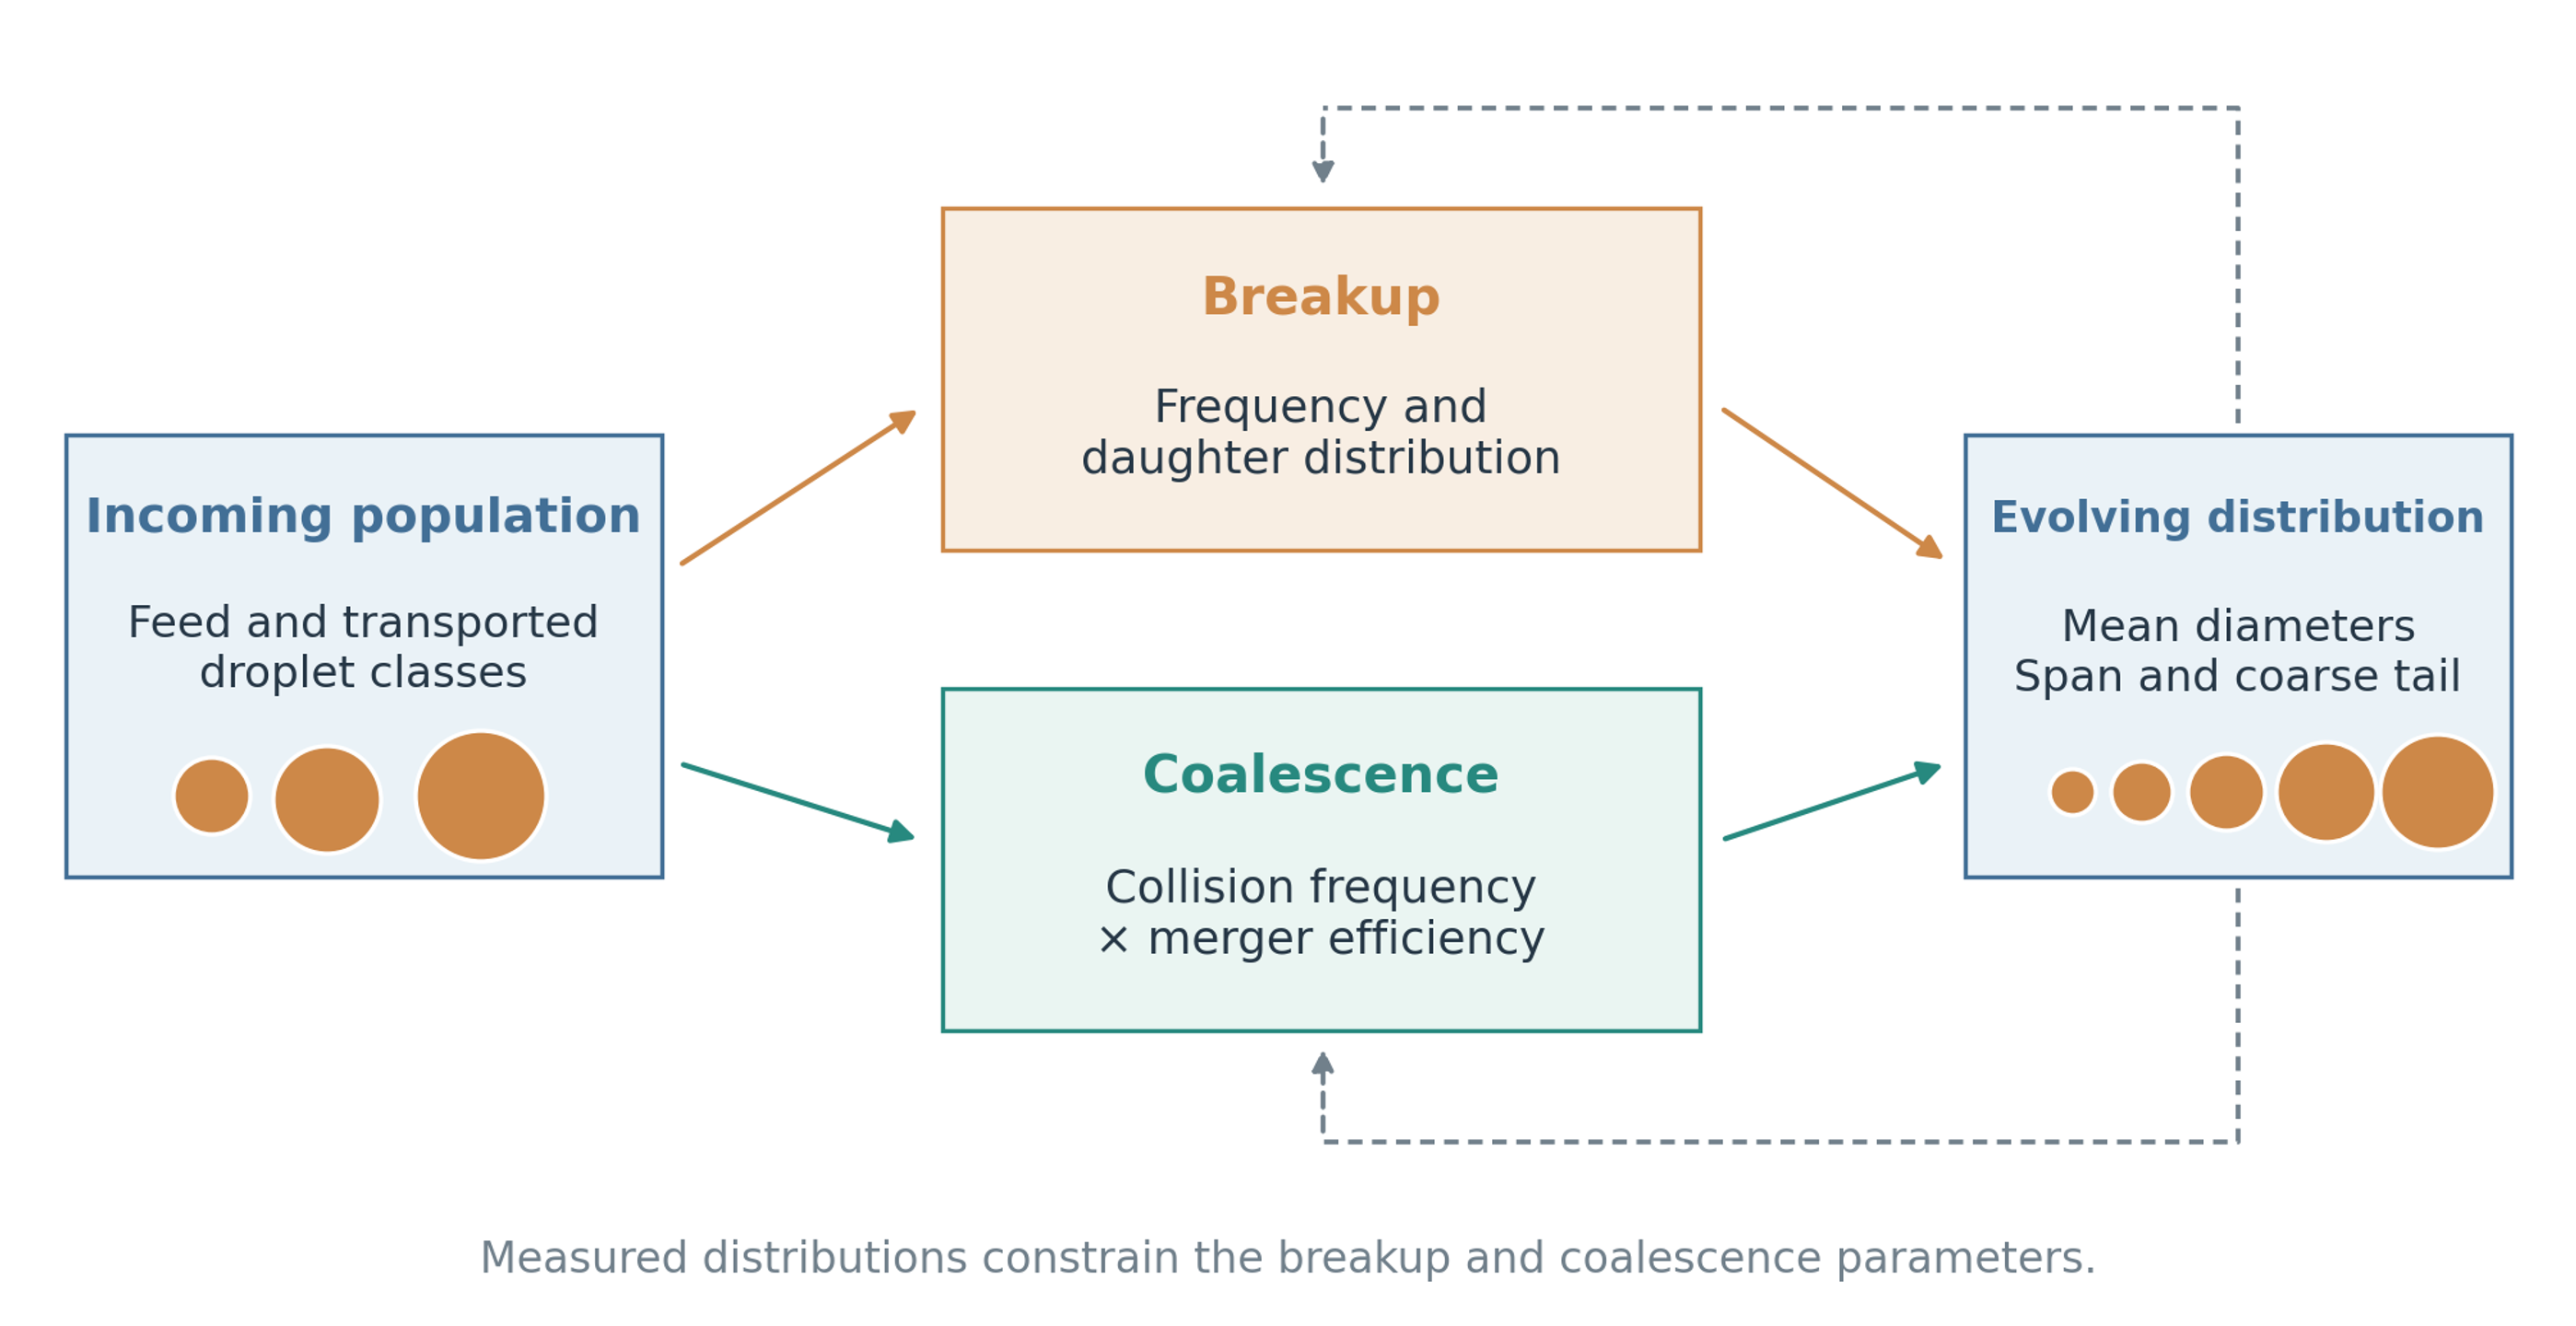
Figure 7.1. Population balance representation of emulsification. Transport, breakup frequency, daughter size distribution, collision frequency, and coalescence efficiency determine the evolving droplet distribution. Measurements are needed to constrain model parameters.
7.3 Approach to an asymptotic distribution
Repeated treatment commonly produces progressively smaller changes in the measured distribution. An empirical approach to an asymptote can describe this behavior over a calibrated range of equivalent pass number. The relation is useful for estimating treatment time and identifying diminishing returns, provided that the formulation and operating conditions remain approximately constant. One such expression is
where is the initial Sauter mean diameter, is the fitted asymptotic value, and is an empirical pass constant. In this equation denotes equivalent pass number, rather than the rotational frequency denoted by in the hydrodynamic expressions.
The fitted asymptote describes the tested process and does not establish a fundamental mechanical limit. Emulsifier availability, adsorption, temperature change, air incorporation, coalescence, or nonuniform circulation can each influence the apparent limiting diameter. Model fitting should therefore use the accompanying temperature, power, and distribution data, and extrapolation beyond the investigated pass range should be treated as a prediction requiring confirmation. A useful endpoint is reached when the product specification is met with acceptable thermal exposure and when additional passes provide insufficient benefit to justify their energy cost.
8 Effects of operating variables
Operating variables affect several mechanisms simultaneously. A change in speed, flow, phase fraction, or temperature can alter the imposed stress, the time available for deformation, and the rate at which new interface is stabilized. The following discussion interprets these coupled effects and identifies the measurements needed to determine which mechanism controls the observed product [1, 3, 6, 10].
8.1 Rotor speed and tip speed
Rotor speed is a principal operating variable because it changes both the intensity and the frequency of hydrodynamic exposure. Increasing speed simultaneously changes tip velocity, pumping, blade passage frequency, turbulence, pressure pulsation, and power consumption. Tip speed provides a useful initial scale up parameter because it characterizes a local velocity scale. However, equal tip speeds do not imply equal residence times, velocities through the stator openings, Reynolds numbers, or power densities. Hall obtained useful translation of mean droplet size among the inline mixers investigated by combining comparable tip speed with comparable residence time; stator open area also had a substantial effect [3].
The dependence of mechanical power on speed and rotor diameter is commonly expressed through a dimensionless power number:
Here, is the power number. Its value depends on the geometry, Reynolds number, imposed flow, and fluid rheology; it should be established for the operating regime under consideration.
At fixed geometry and approximately constant power number, the fully turbulent scaling implies that power increases with the cube of rotor speed. A relatively small speed increase can therefore impose a substantial additional motor and cooling load. The operating speed should be selected together with exposure time so that the required droplet distribution and stability are obtained within the mechanical and thermal limits. The minimum speed is not necessarily the minimum energy condition, because a higher speed may shorten the processing time.
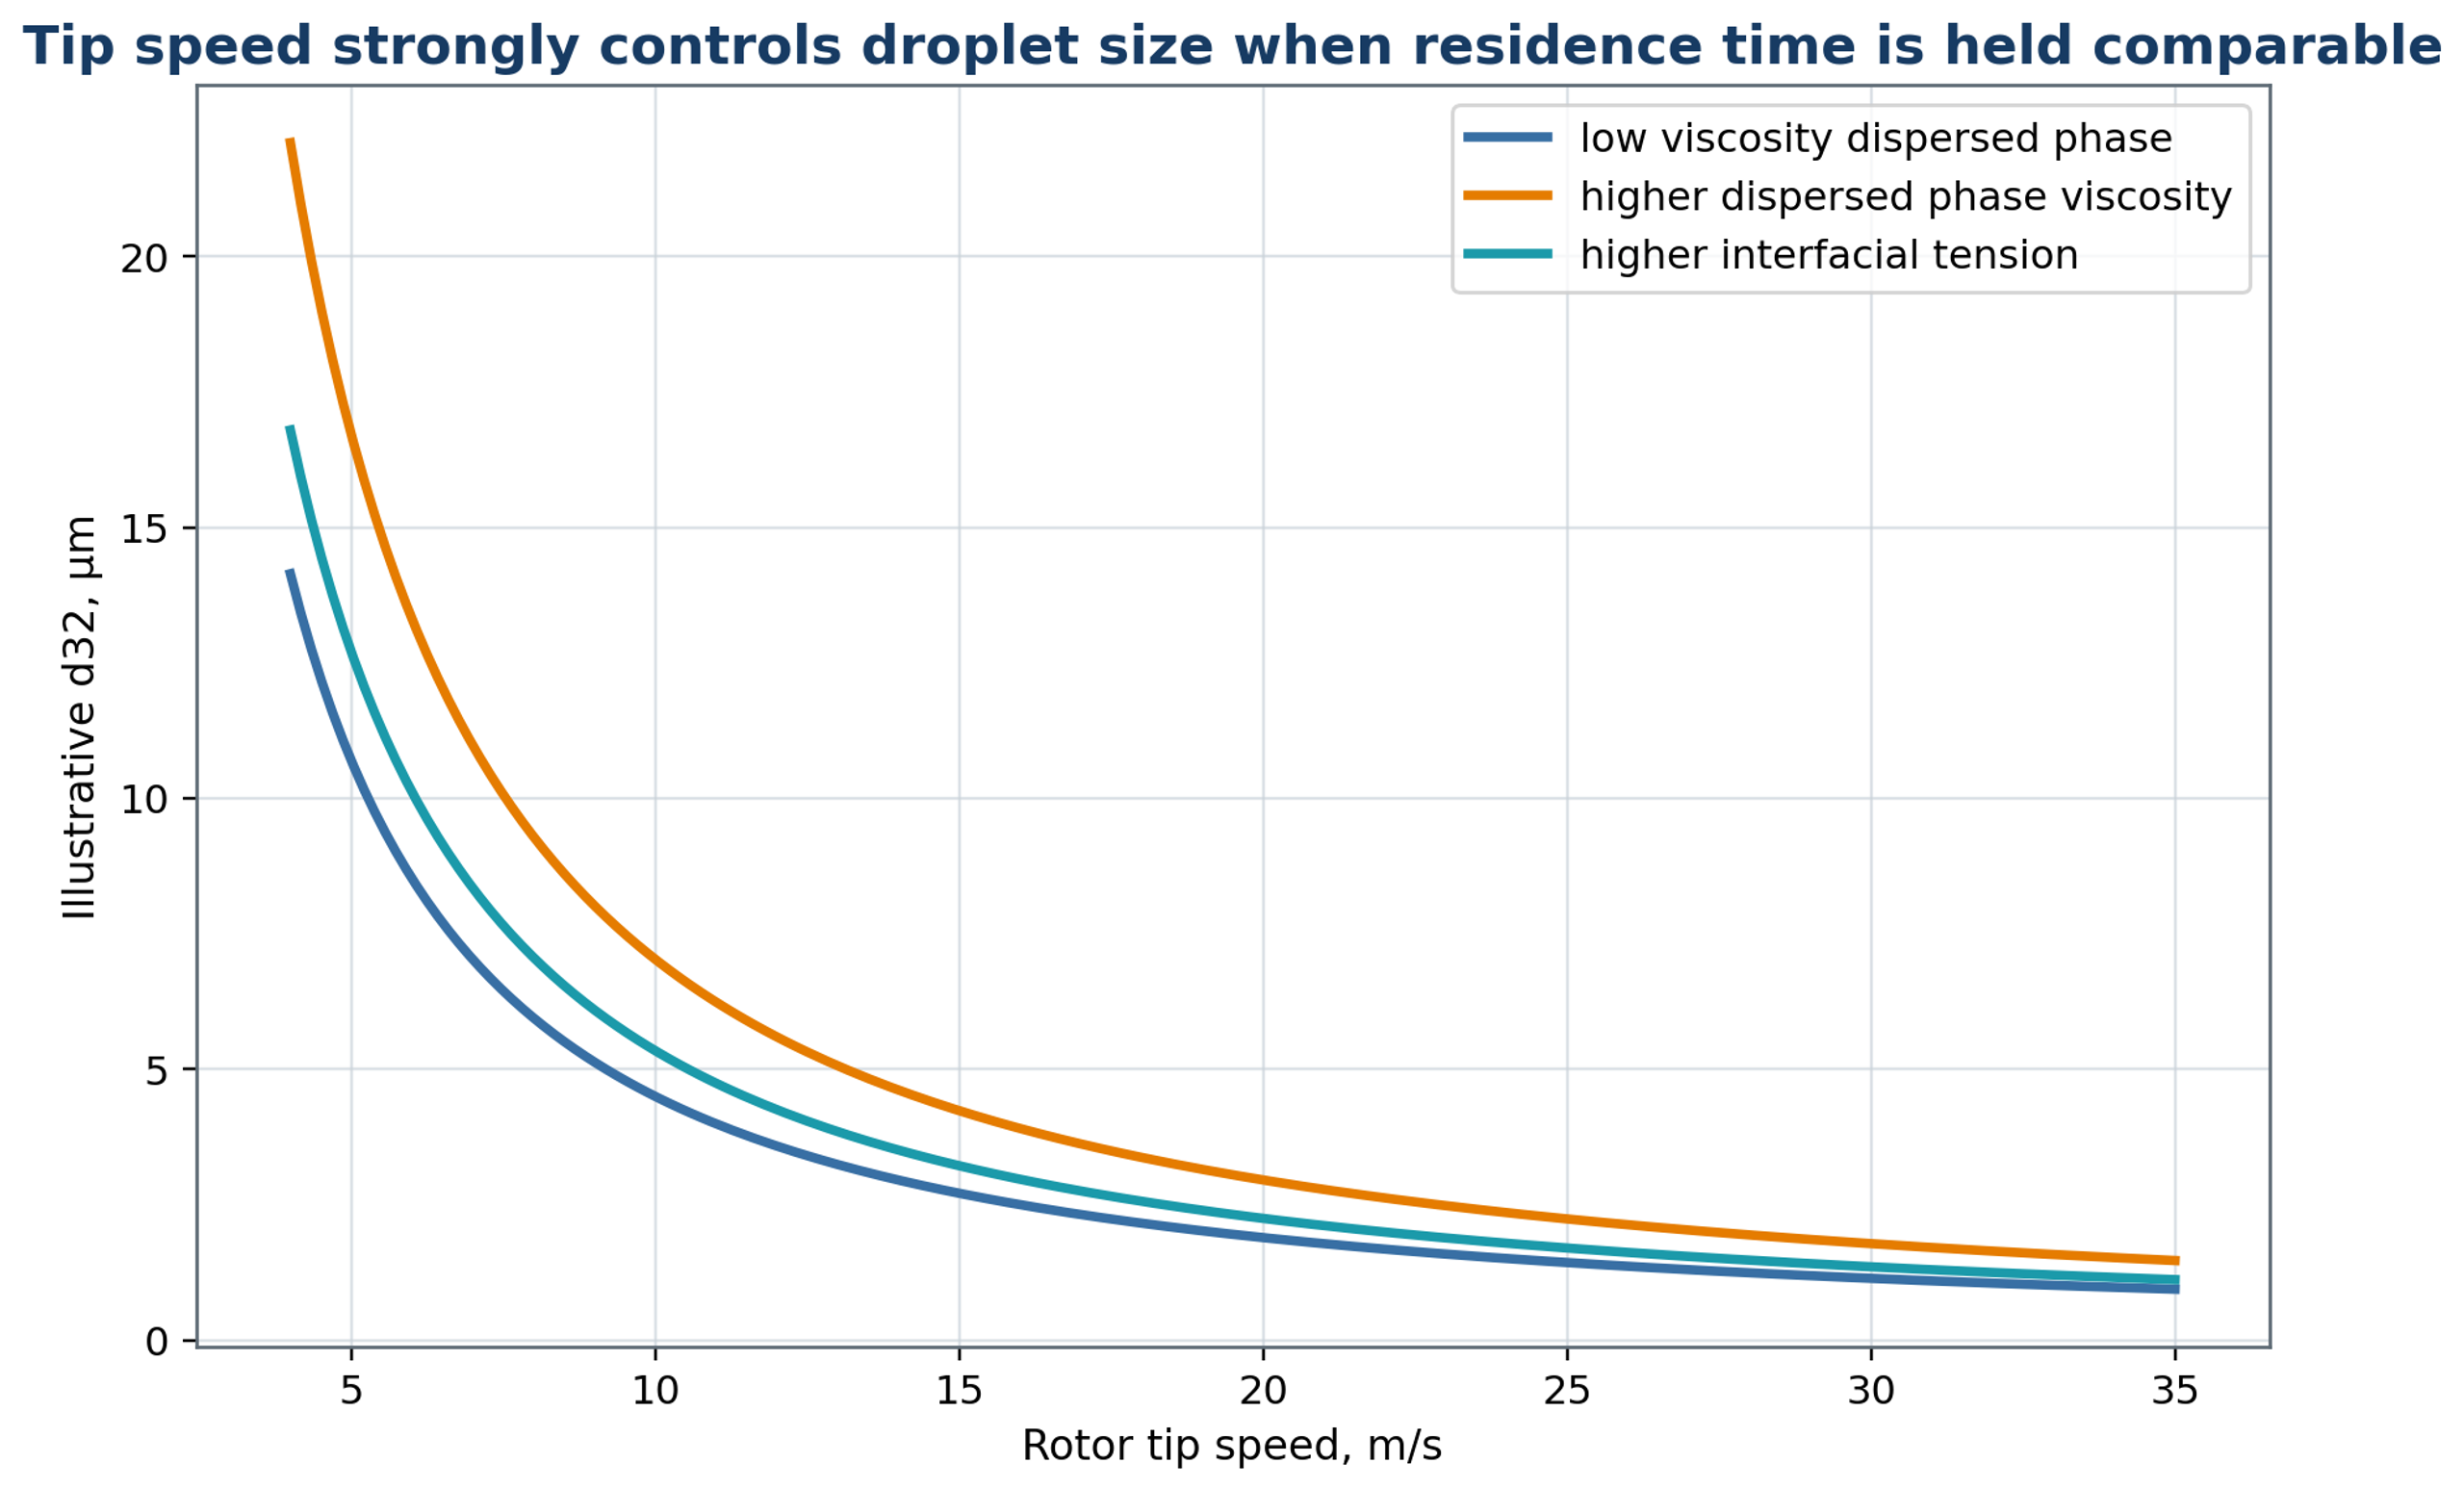
Figure 8.1. Illustrative dependence of droplet diameter on rotor tip speed, with schematic changes associated with dispersed phase viscosity and interfacial tension [2, 3, 4]. The curves are not universal equipment correlations or comparative manufacturer data.
8.2 Flow rate, residence time, and pass number
Flow rate determines how rapidly material enters and leaves the active region and therefore couples throughput to exposure. In an inline mixer, a higher flow rate generally reduces mean residence time while increasing the velocity through the stator openings. These effects compete, and the observed mean droplet diameter can increase, decrease, or remain approximately unchanged. Flow rate should consequently be evaluated together with rotor speed, open area, and the pressures upstream and downstream of the head [1, 3, 10].
Direct flow measurements support this coupled interpretation. Espinoza and coauthors used particle image velocimetry in a transparent inline Silverson head and observed that the dominant flow could shift between radial and tangential motion. External flow promoted radial transport, while increasing rotor speed or outlet backpressure favored tangential motion under the conditions studied. These findings indicate that the surrounding pump and pipework can change the exposure history even at a fixed head geometry [33].
For a prescribed volumetric flow, a characteristic average velocity through the open passages is
where denotes the total instantaneous open area. This estimate assumes that the stated flow passes through that area; local velocities can differ because of nonuniform flow splitting and time dependent rotor obstruction.
The corresponding port Reynolds number, based on the hydraulic diameter , is
Repeated processing usually removes the coarse population most rapidly during the early passes, after which the rate of refinement decreases. Further passes continue to increase energy input and temperature and may expose sensitive ingredients to oxidation or structural damage. The required pass number should be determined from the evolution of , , distribution span, and stability with cumulative specific energy. Processing time alone does not identify the exposure received by each fluid element.
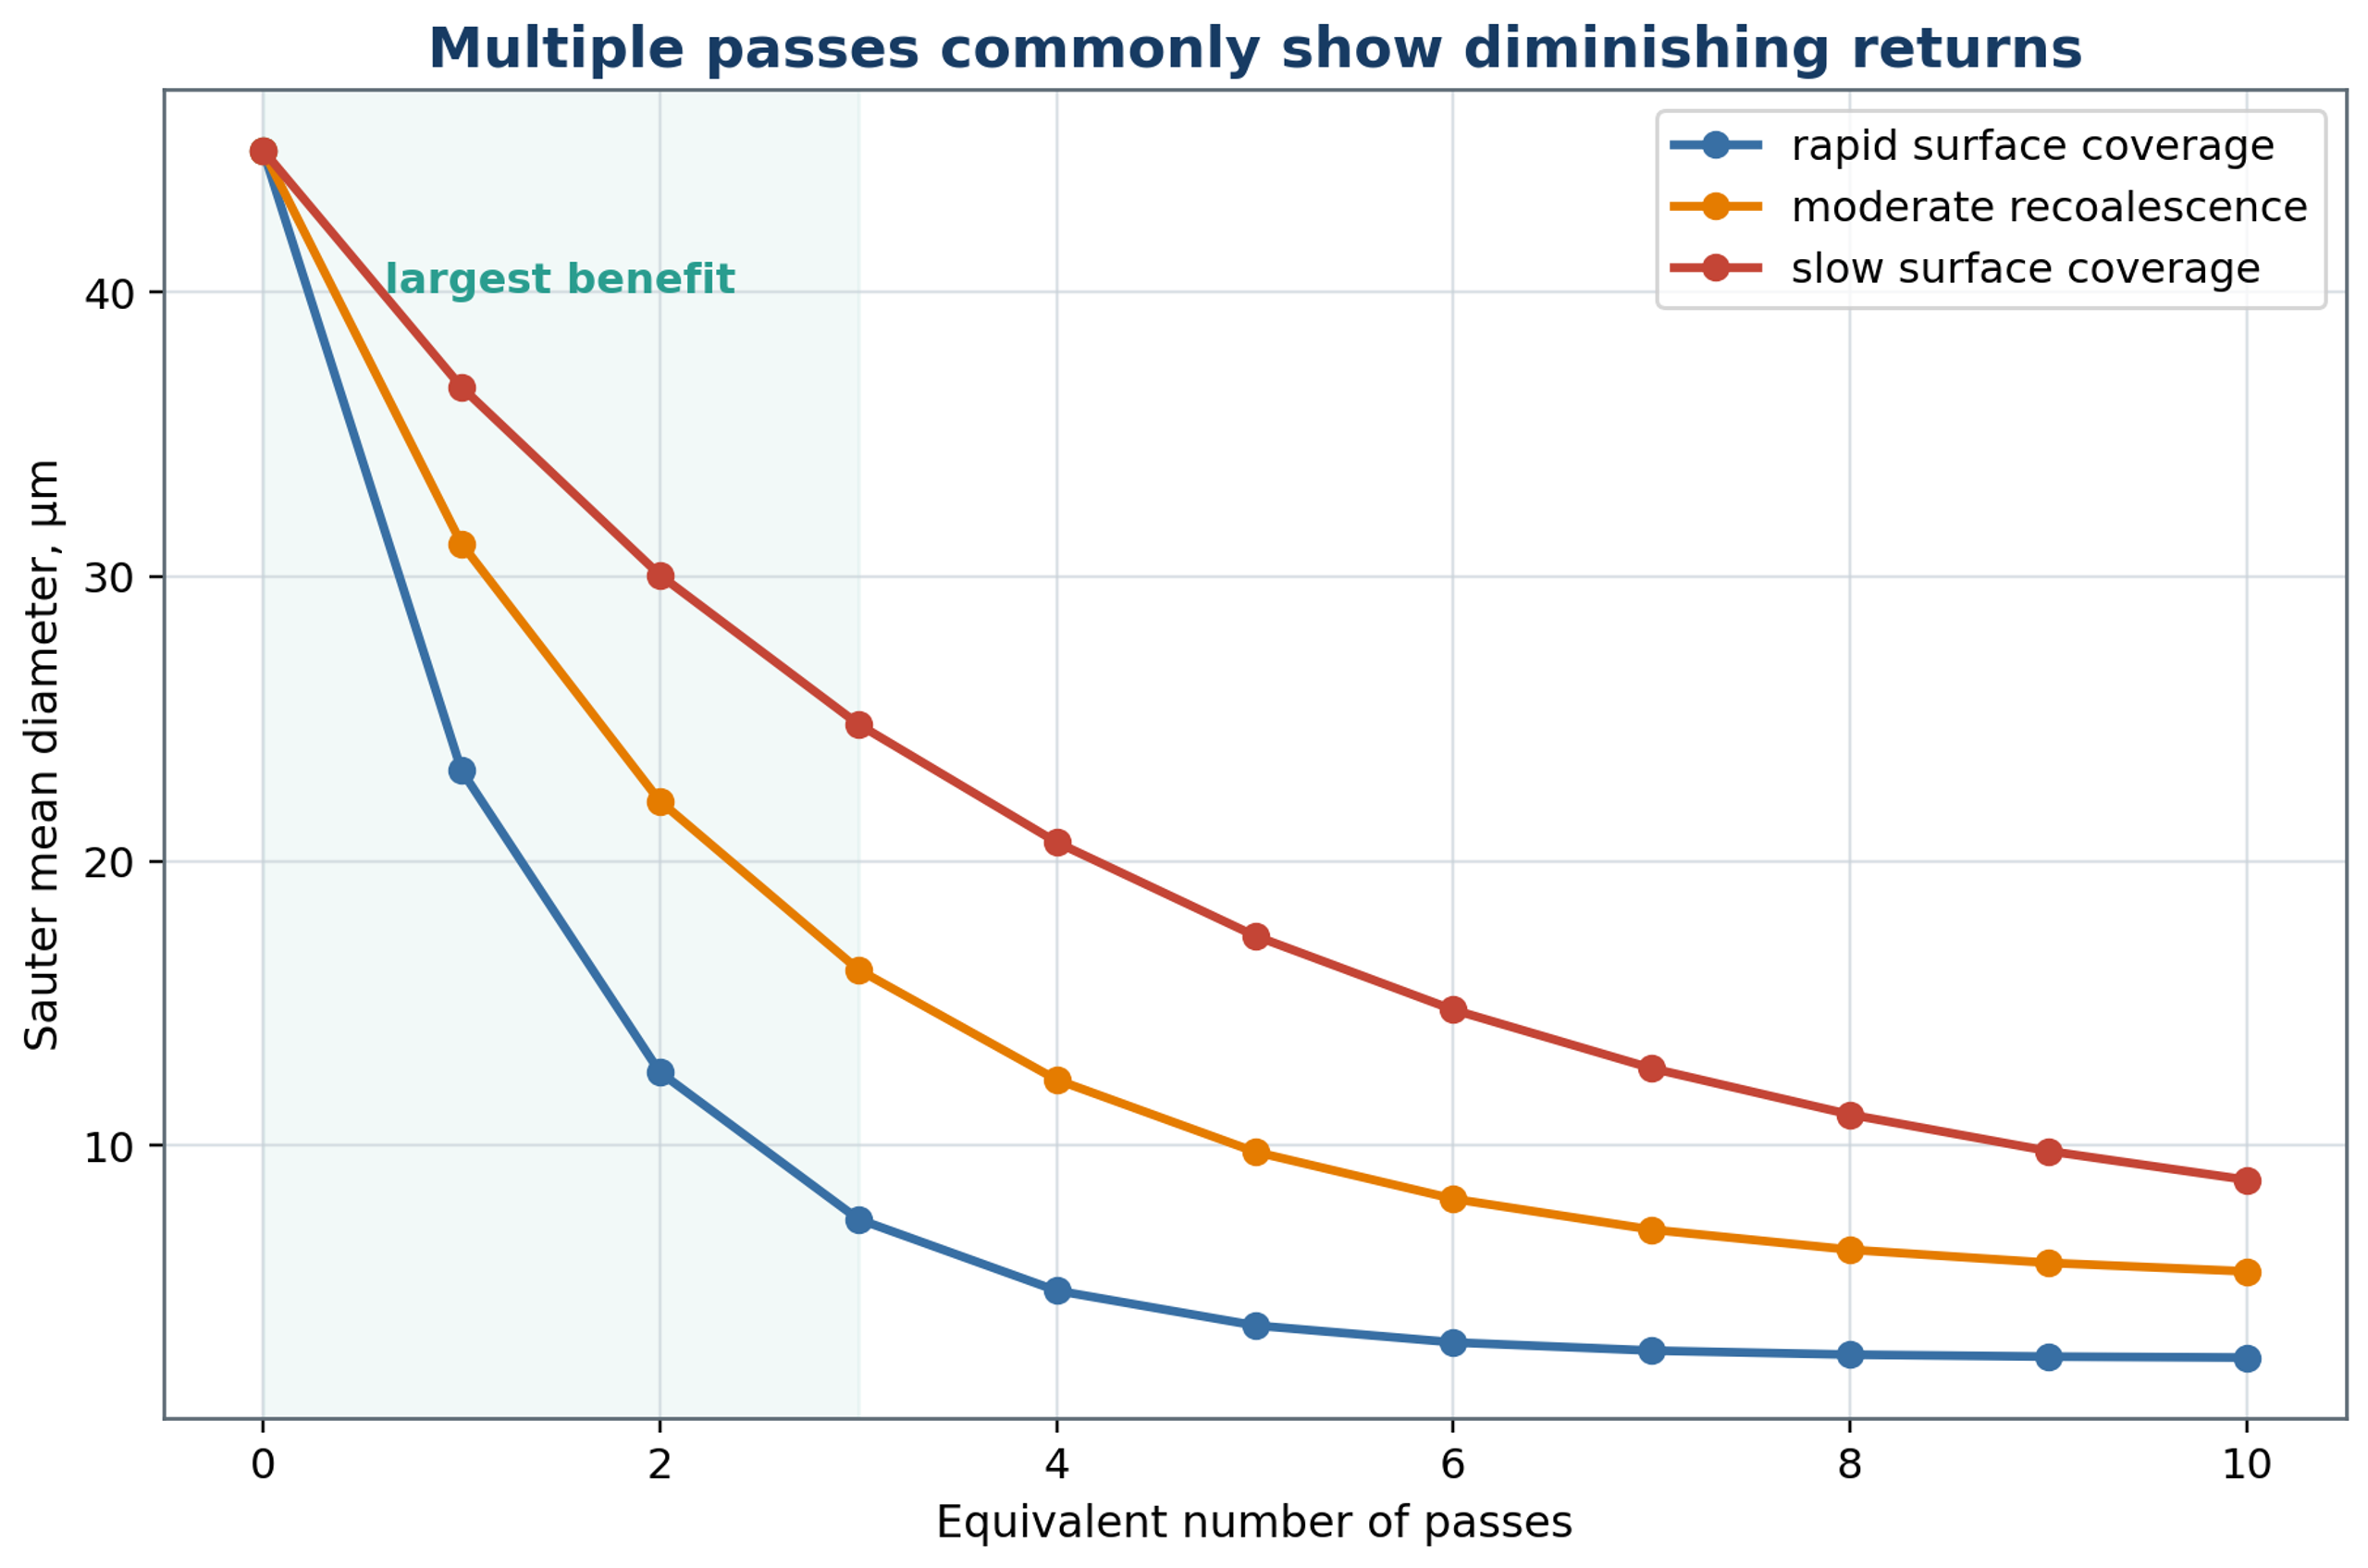
Figure 8.2. Illustrative approach to a limiting droplet size with repeated equivalent passes. Differences in adsorption and recoalescence can change both the limiting diameter and the rate of approach. The curves are conceptual examples.
8.3 Phase viscosities and viscosity ratio
The viscosities of the two phases govern different aspects of emulsification. Dispersed phase viscosity resists internal motion, neck thinning, and fragment separation, whereas continuous phase viscosity controls the surrounding viscous stress, turbulent damping, and transport through the mixer. At otherwise comparable conditions, a larger viscosity ratio commonly increases the resistance to breakup or changes the breakup morphology. An increase in continuous phase viscosity can facilitate viscous deformation while simultaneously reducing turbulent fluctuations and pumping. The dominant mechanism must therefore be identified before a viscosity trend is generalized [3, 4, 6, 27].
Both viscosities should be evaluated at the actual processing temperature. For a non-Newtonian formulation, a single viscosity value is insufficient: the rheological measurements should cover the conditions relevant to the feed pump, bulk circulation, and active head. Temperature or composition changes during a batch can move the process between different flow and breakup regimes.
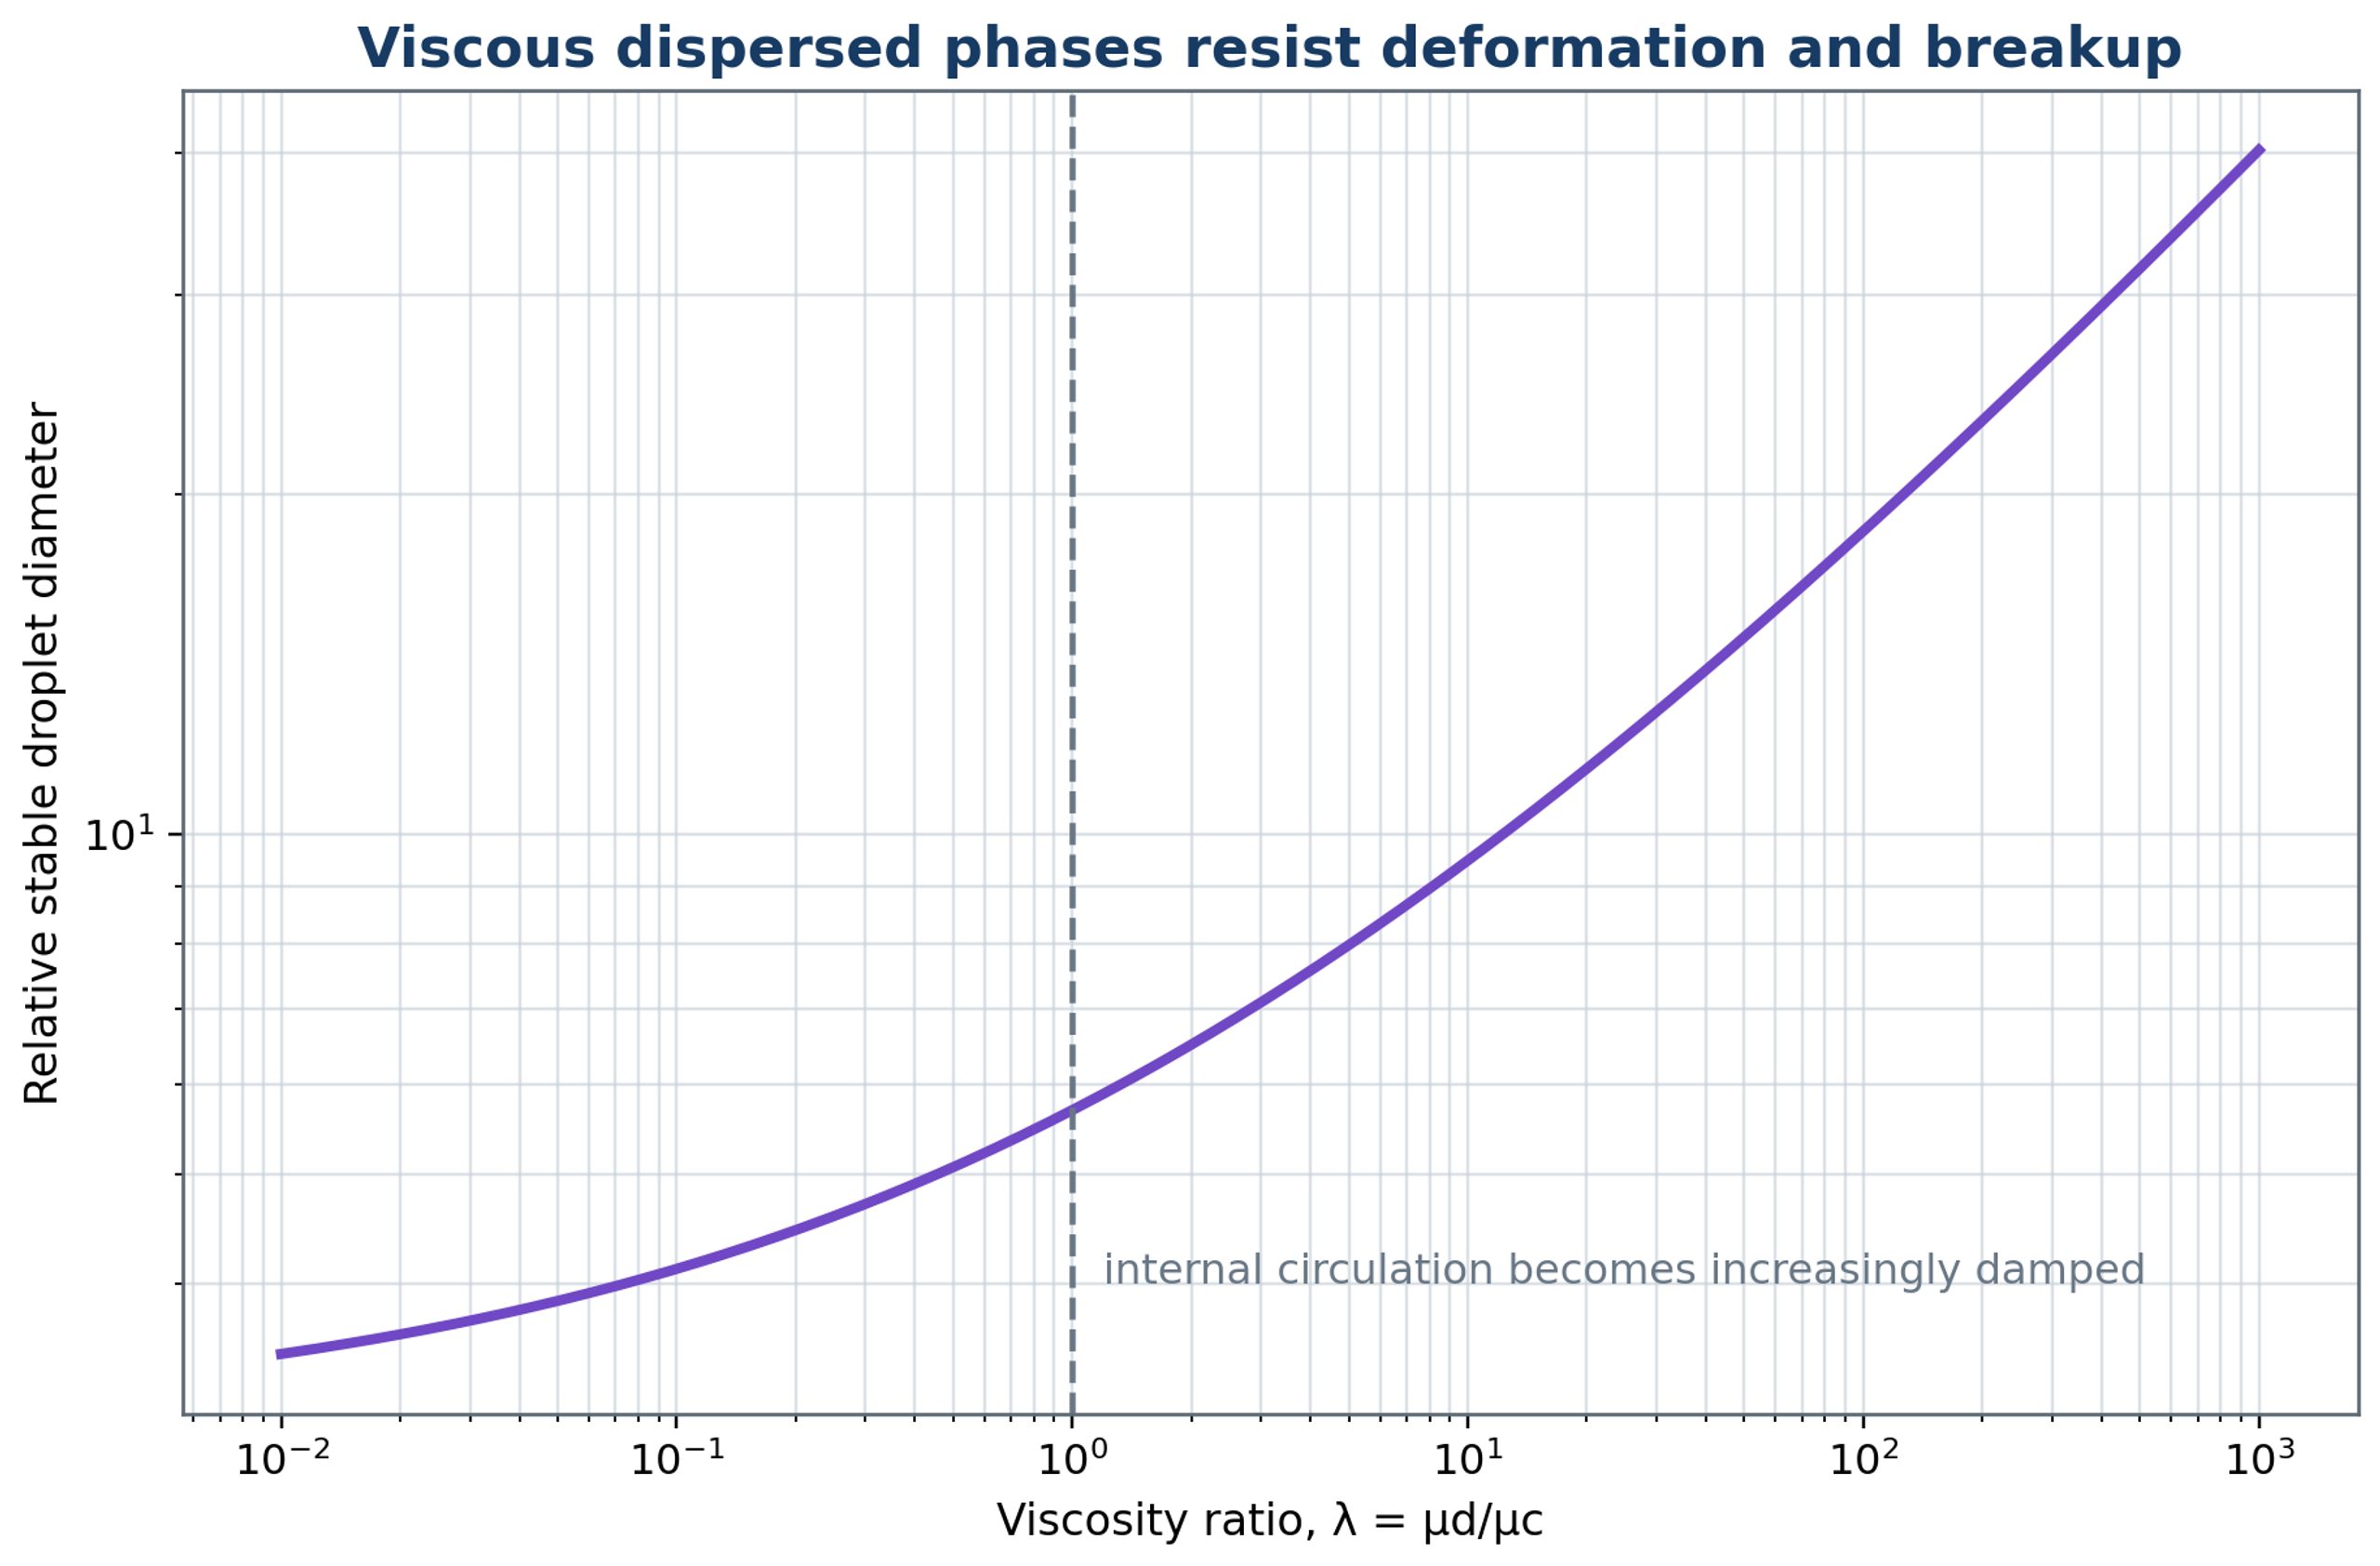
Figure 8.3. Schematic influence of dispersed to continuous phase viscosity ratio on resistance to deformation and breakup. The plotted trend is qualitative; a quantitative response also depends on the flow regime, interfacial mobility, and stress duration.
8.4 Dispersed phase fraction
The dispersed phase fraction connects formulation concentration to the amount of interface, the frequency of droplet encounters, and the bulk rheology. Increasing increases the interfacial area required at a specified diameter and generally increases the opportunity for collisions. It can also increase apparent viscosity and reduce the continuous phase volume available to transport emulsifier. In concentrated systems, interactions among droplets modify the local flow, so breakup correlations established under dilute conditions may no longer apply [3, 6].
The mean separation between neighboring droplet surfaces provides a conceptual measure of crowding. In process development, rheology, conductivity, and microscopy often provide more accessible evidence of structural change or an approaching phase inversion. Trials should include the minimum, nominal, and maximum intended phase fractions. A correlation calibrated at a single concentration should not be transferred to a substantially different concentration without verification.
8.5 Temperature, gas, and cavitation
Temperature and gas content affect both the liquid properties and the hydrodynamic conditions in the head. Heating commonly lowers phase viscosity and may lower interfacial tension, but the magnitude and direction of these changes depend on the formulation. Higher temperature also increases vapor pressure and can accelerate oxidation, chemical reactions, protein denaturation, or degradation of active ingredients. The recorded thermal history should include inlet and outlet temperatures, the maximum temperature in a recirculation loop, and the duration of exposure.
Air entrainment changes the apparent density, measured particle distribution, power demand, and pressure response. In batch operation, a surface vortex can draw gas into an inadequately submerged head; in inline operation, suction leaks can introduce gas into the process stream. The resulting bubbles can generate foam and modify cavitation collapse. Adequate immersion, a submerged return, and monitored suction conditions improve reproducibility. Deaeration can be useful when compatible with the formulation, although vacuum treatment may remove volatile constituents.
Table 8.1. Operating variables and diagnostic responses.
| Variable increased | Expected useful response | Possible adverse response | Essential diagnostic |
|---|---|---|---|
| Rotor speed | Higher stress and faster passage frequency | Cubic power rise, heat, air ingestion, wear | Torque, power, temperature, DSD |
| Flow rate | Higher capacity and port velocity | Shorter residence, pressure loss, bypass | Flow, pressure, residence distribution |
| Processing time or passes | Lower mean and coarse tail initially | Diminishing returns, heat, oxidation | DSD by pass and cumulative energy |
| Dispersed phase fraction | Higher production concentration | Collision, viscosity, inversion | Rheology, conductivity, DSD |
| Emulsifier concentration | Lower tension and faster coverage | Cost, taste, micelles, phase behavior | Dynamic tension and storage test |
| Temperature | Lower viscosity | Degradation, vapor, lower collapse intensity | Full temperature history |
| Backpressure | Alters recovery and cavitation | Excess pressure load or suppressed inception | Fast pressure and acoustic signal |
| Dissolved gas | More nuclei | Foam and collapse cushioning | Dissolved gas and void fraction |
9 Effects of rotor and stator geometry
Rotor and stator geometry transforms the motor input into spatially distributed shear, extension, jets, and pressure fluctuations. This section considers the dimensions that should be recorded when a process is compared or transferred: clearance, teeth, openings, stage arrangement, and the condition of worn parts. The geometric variables must be considered together with flow rate because an opening that raises local velocity at imposed flow can also restrict circulation [1, 3].
9.1 Radial clearance and tooth geometry
The clearance and the shape of the working elements determine where fluid accelerates and where large velocity gradients arise. Reducing radial clearance increases the nominal gap shear rate at a fixed tip speed, but also increases sensitivity to shaft deflection, thermal expansion, particle blockage, and manufacturing tolerances. Designs that use a controlled liquid film or hydrodynamic support to maintain a small operating gap have been described in patent literature [22]. The practical clearance must be selected from both the required hydrodynamic action and the mechanical conditions, including balance, bearing support, solids content, and allowable wear.
Rotor geometries include straight or swept teeth, grooves, slots, perforations, and several concentric rows. Stators may contain round openings, axial or radial slots, screens, concentric rings, or serrated surfaces. These features influence open area, jet direction, contraction, pressure recovery, pumping, and the sequence of shear and pulsation events. A geometric description should therefore include dimensions and flow paths rather than rely only on commercial designations such as coarse or fine [1, 3, 13, 14, 18, 21, 22].
Manufacturer documentation illustrates the range of practical configurations without establishing equivalent product performance. Silverson describes interchangeable general purpose heads, slotted heads, and emulsor screens, together with multistage combinations of inner and outer stators. This modularity permits passage geometry to be matched to liquid emulsification or to feeds containing larger or fibrous material. The appropriate combination must still be selected from trials with the intended formulation [11].
Patent disclosures provide additional examples of geometry rather than independent performance validation. Paterson describes rotor and stator arrangements for mixers and emulsifiers, while Ekstrom and coauthors describe an inline housing containing successive rotor and stator elements [34, 35]. Other disclosures address performance estimation and scale up, or outlet configurations that influence the discharge from a dispersion machine [36, 37]. These documents should be interpreted together with the measured hydrodynamics of the particular device.
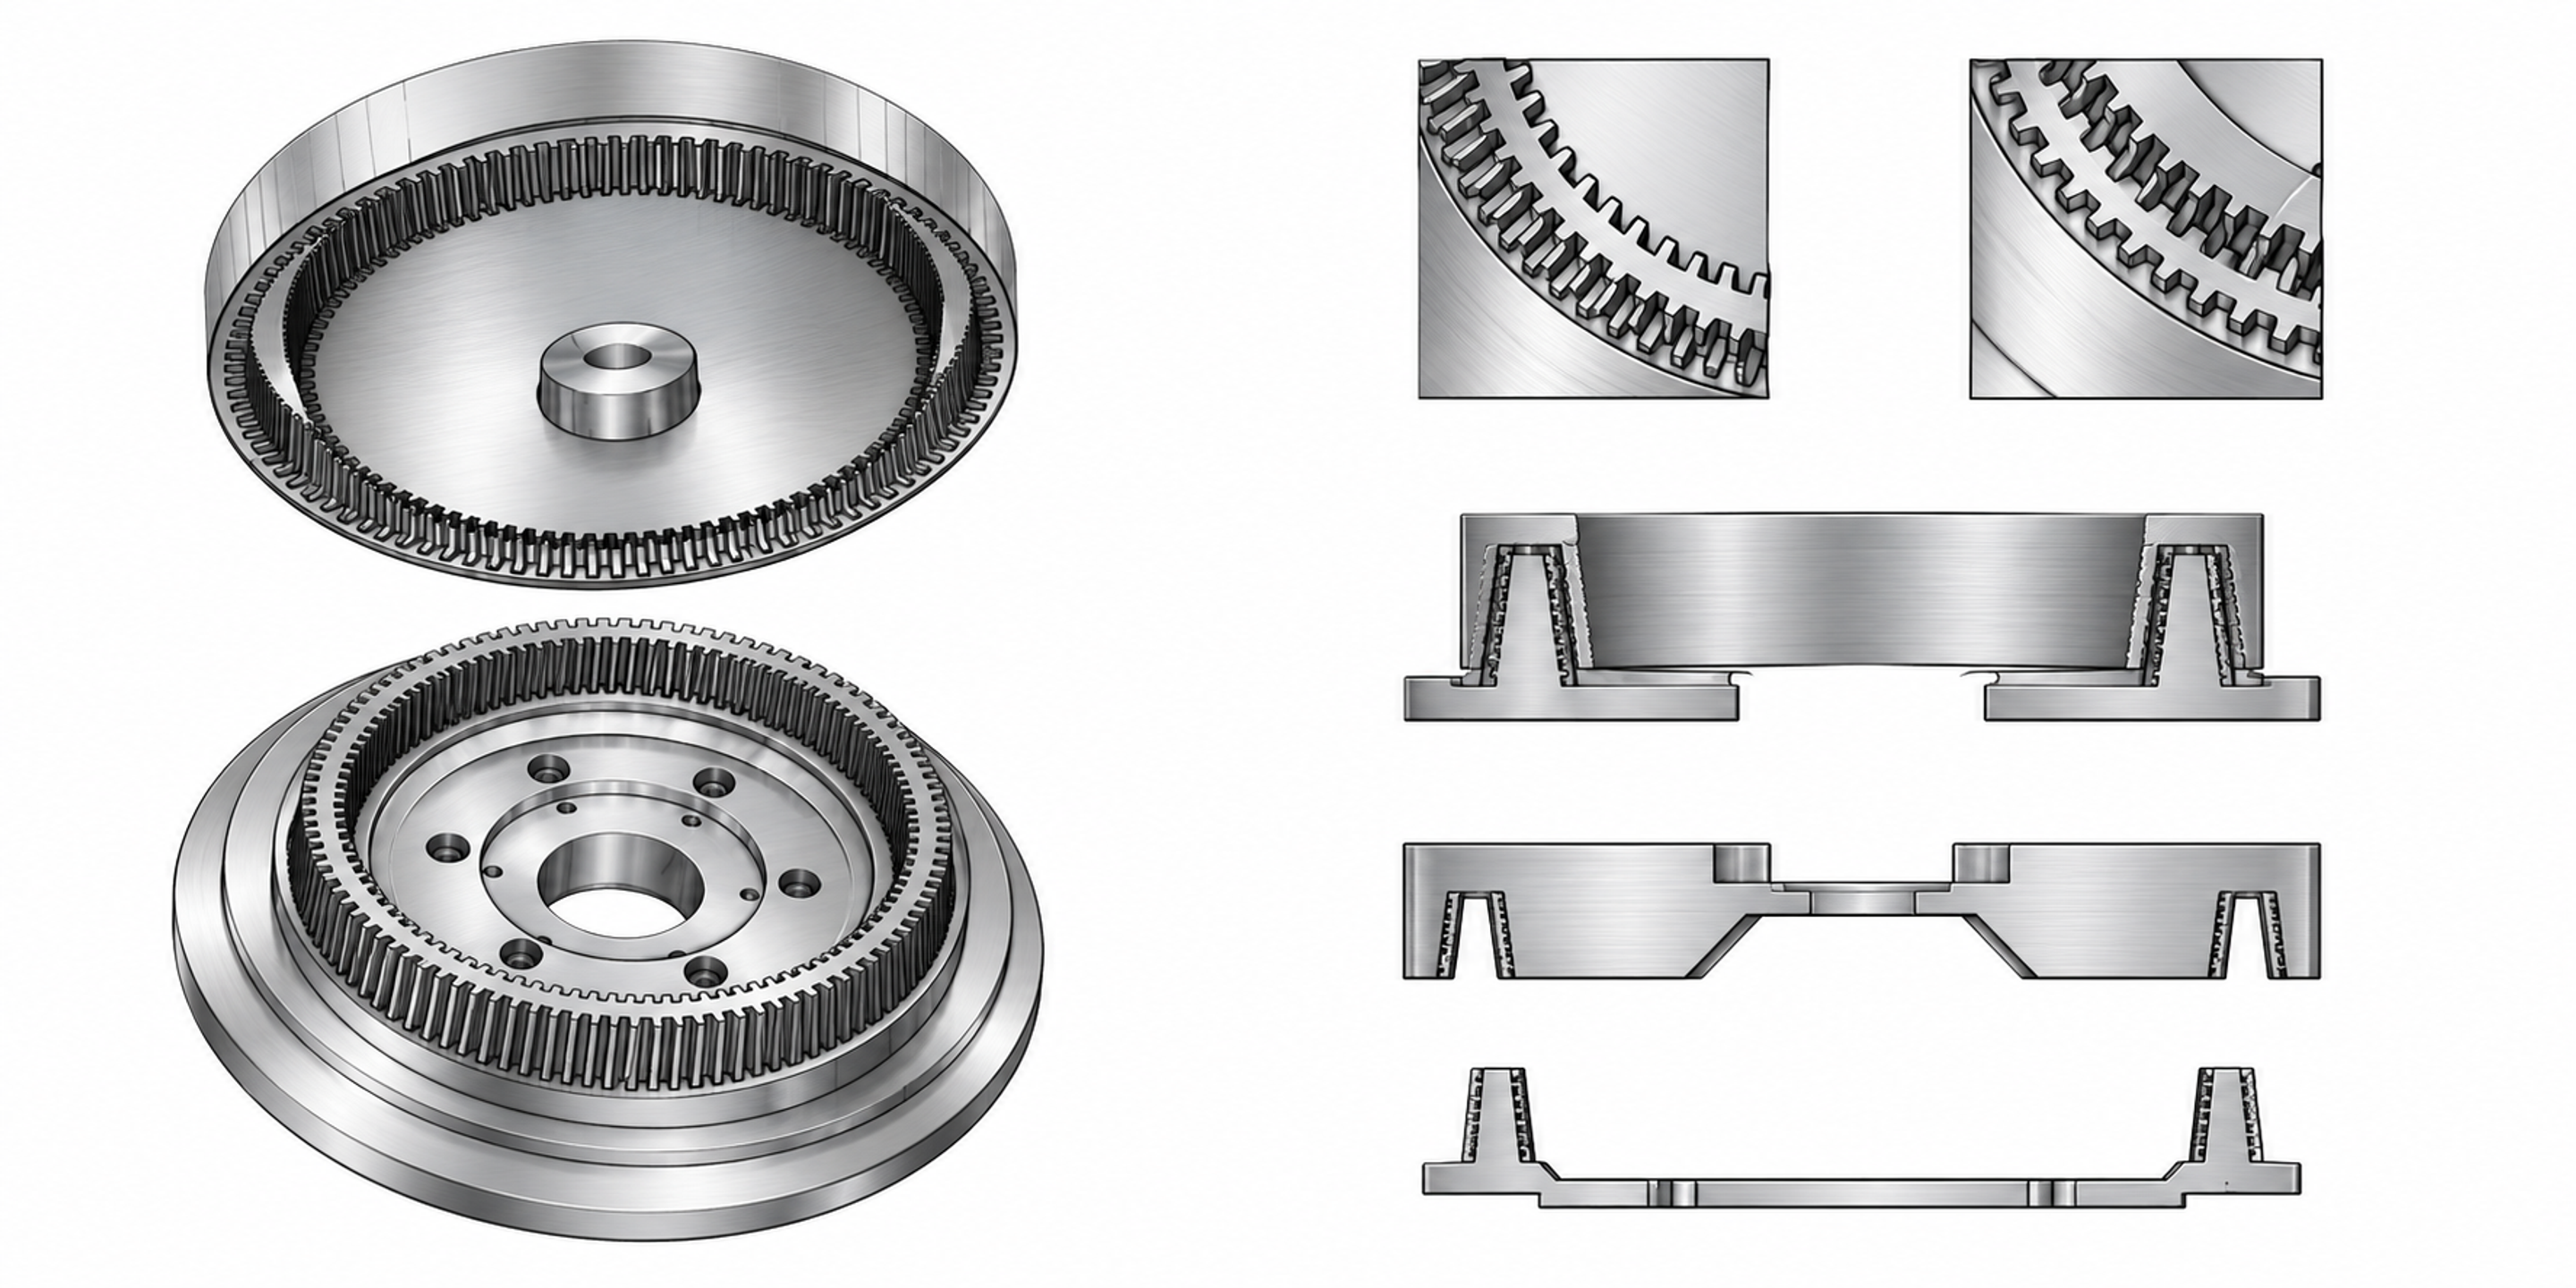
Figure 9.1. Grooved rotor and stator components, groove details, and sectional arrangements. The views are not dimensional manufacturing drawings.
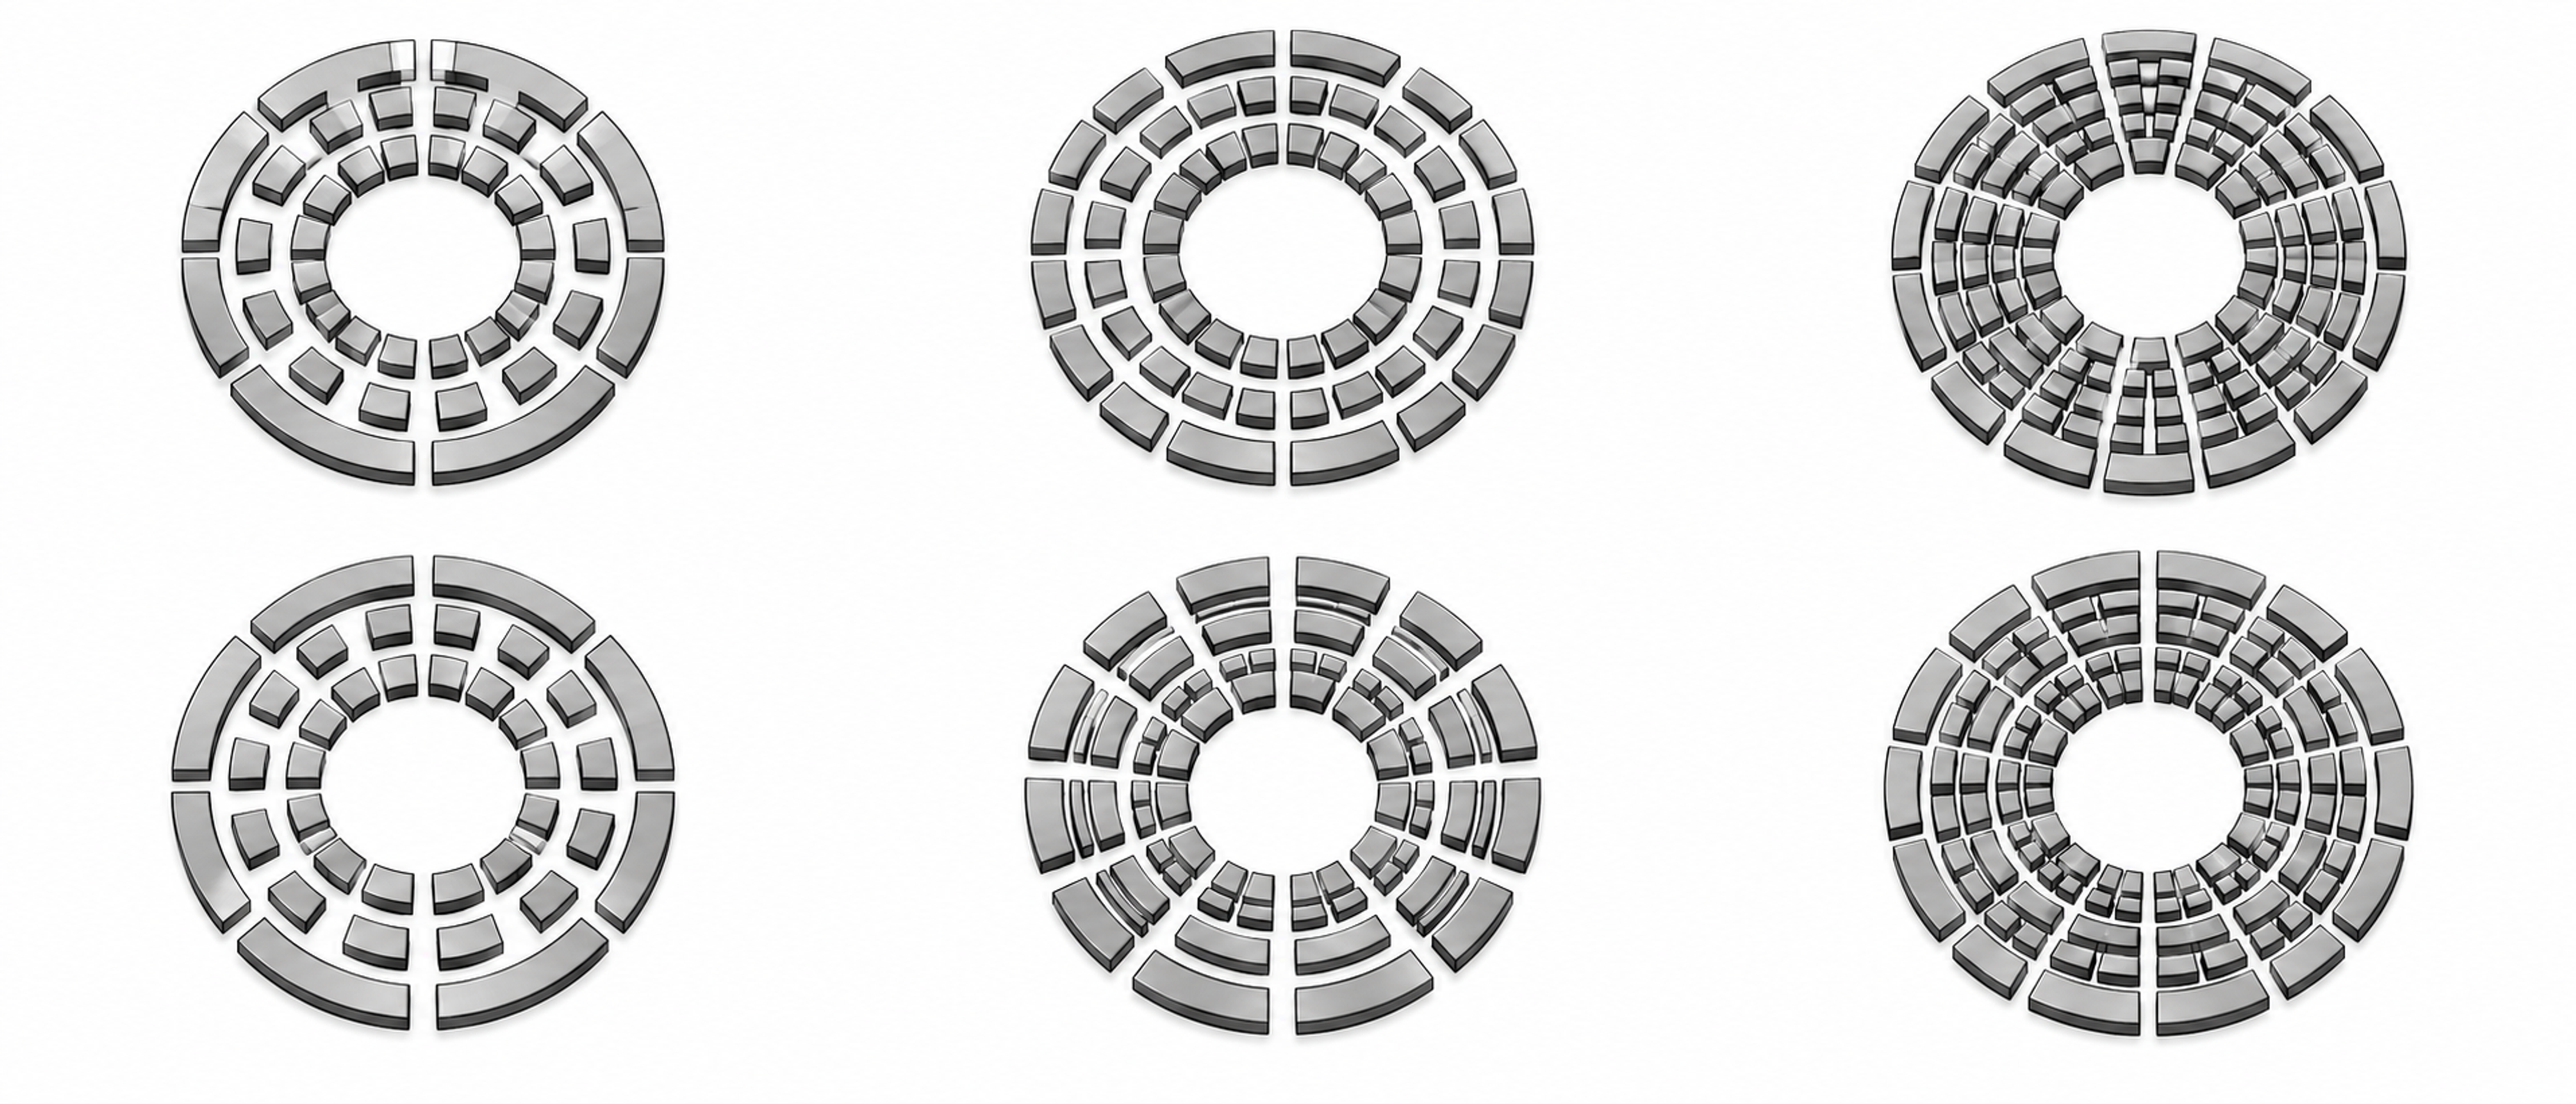
Figure 9.2. Six concentric ring arrangements. Alternating segmented passages permit periodic changes in opening area. The patterns illustrate geometric concepts and are not dimensional manufacturing drawings.
9.2 Stator open area and slot width
The stator opening pattern establishes the hydraulic connection between the rotating region and the surrounding or downstream liquid. A useful geometric descriptor is the fraction of the reference stator area that is open to flow:
Here, is the reference stator surface area. The selected reference surface and the treatment of openings temporarily blocked by the rotor should be stated so that reported open area ratios are comparable.
At an imposed flow rate, reducing open area raises the average velocity through the remaining openings and can increase pressure loss. In a self-pumping system, however, the flow rate also changes, so the response cannot be inferred from area alone. Fine openings can modify deformation and residence histories and may reduce the coarse fraction, while increasing sensitivity to fibers, crystals, agglomerates, and fouling. Hall identified open area as a particularly influential geometric variable for power consumption and emulsification in the inline mixers studied [3].
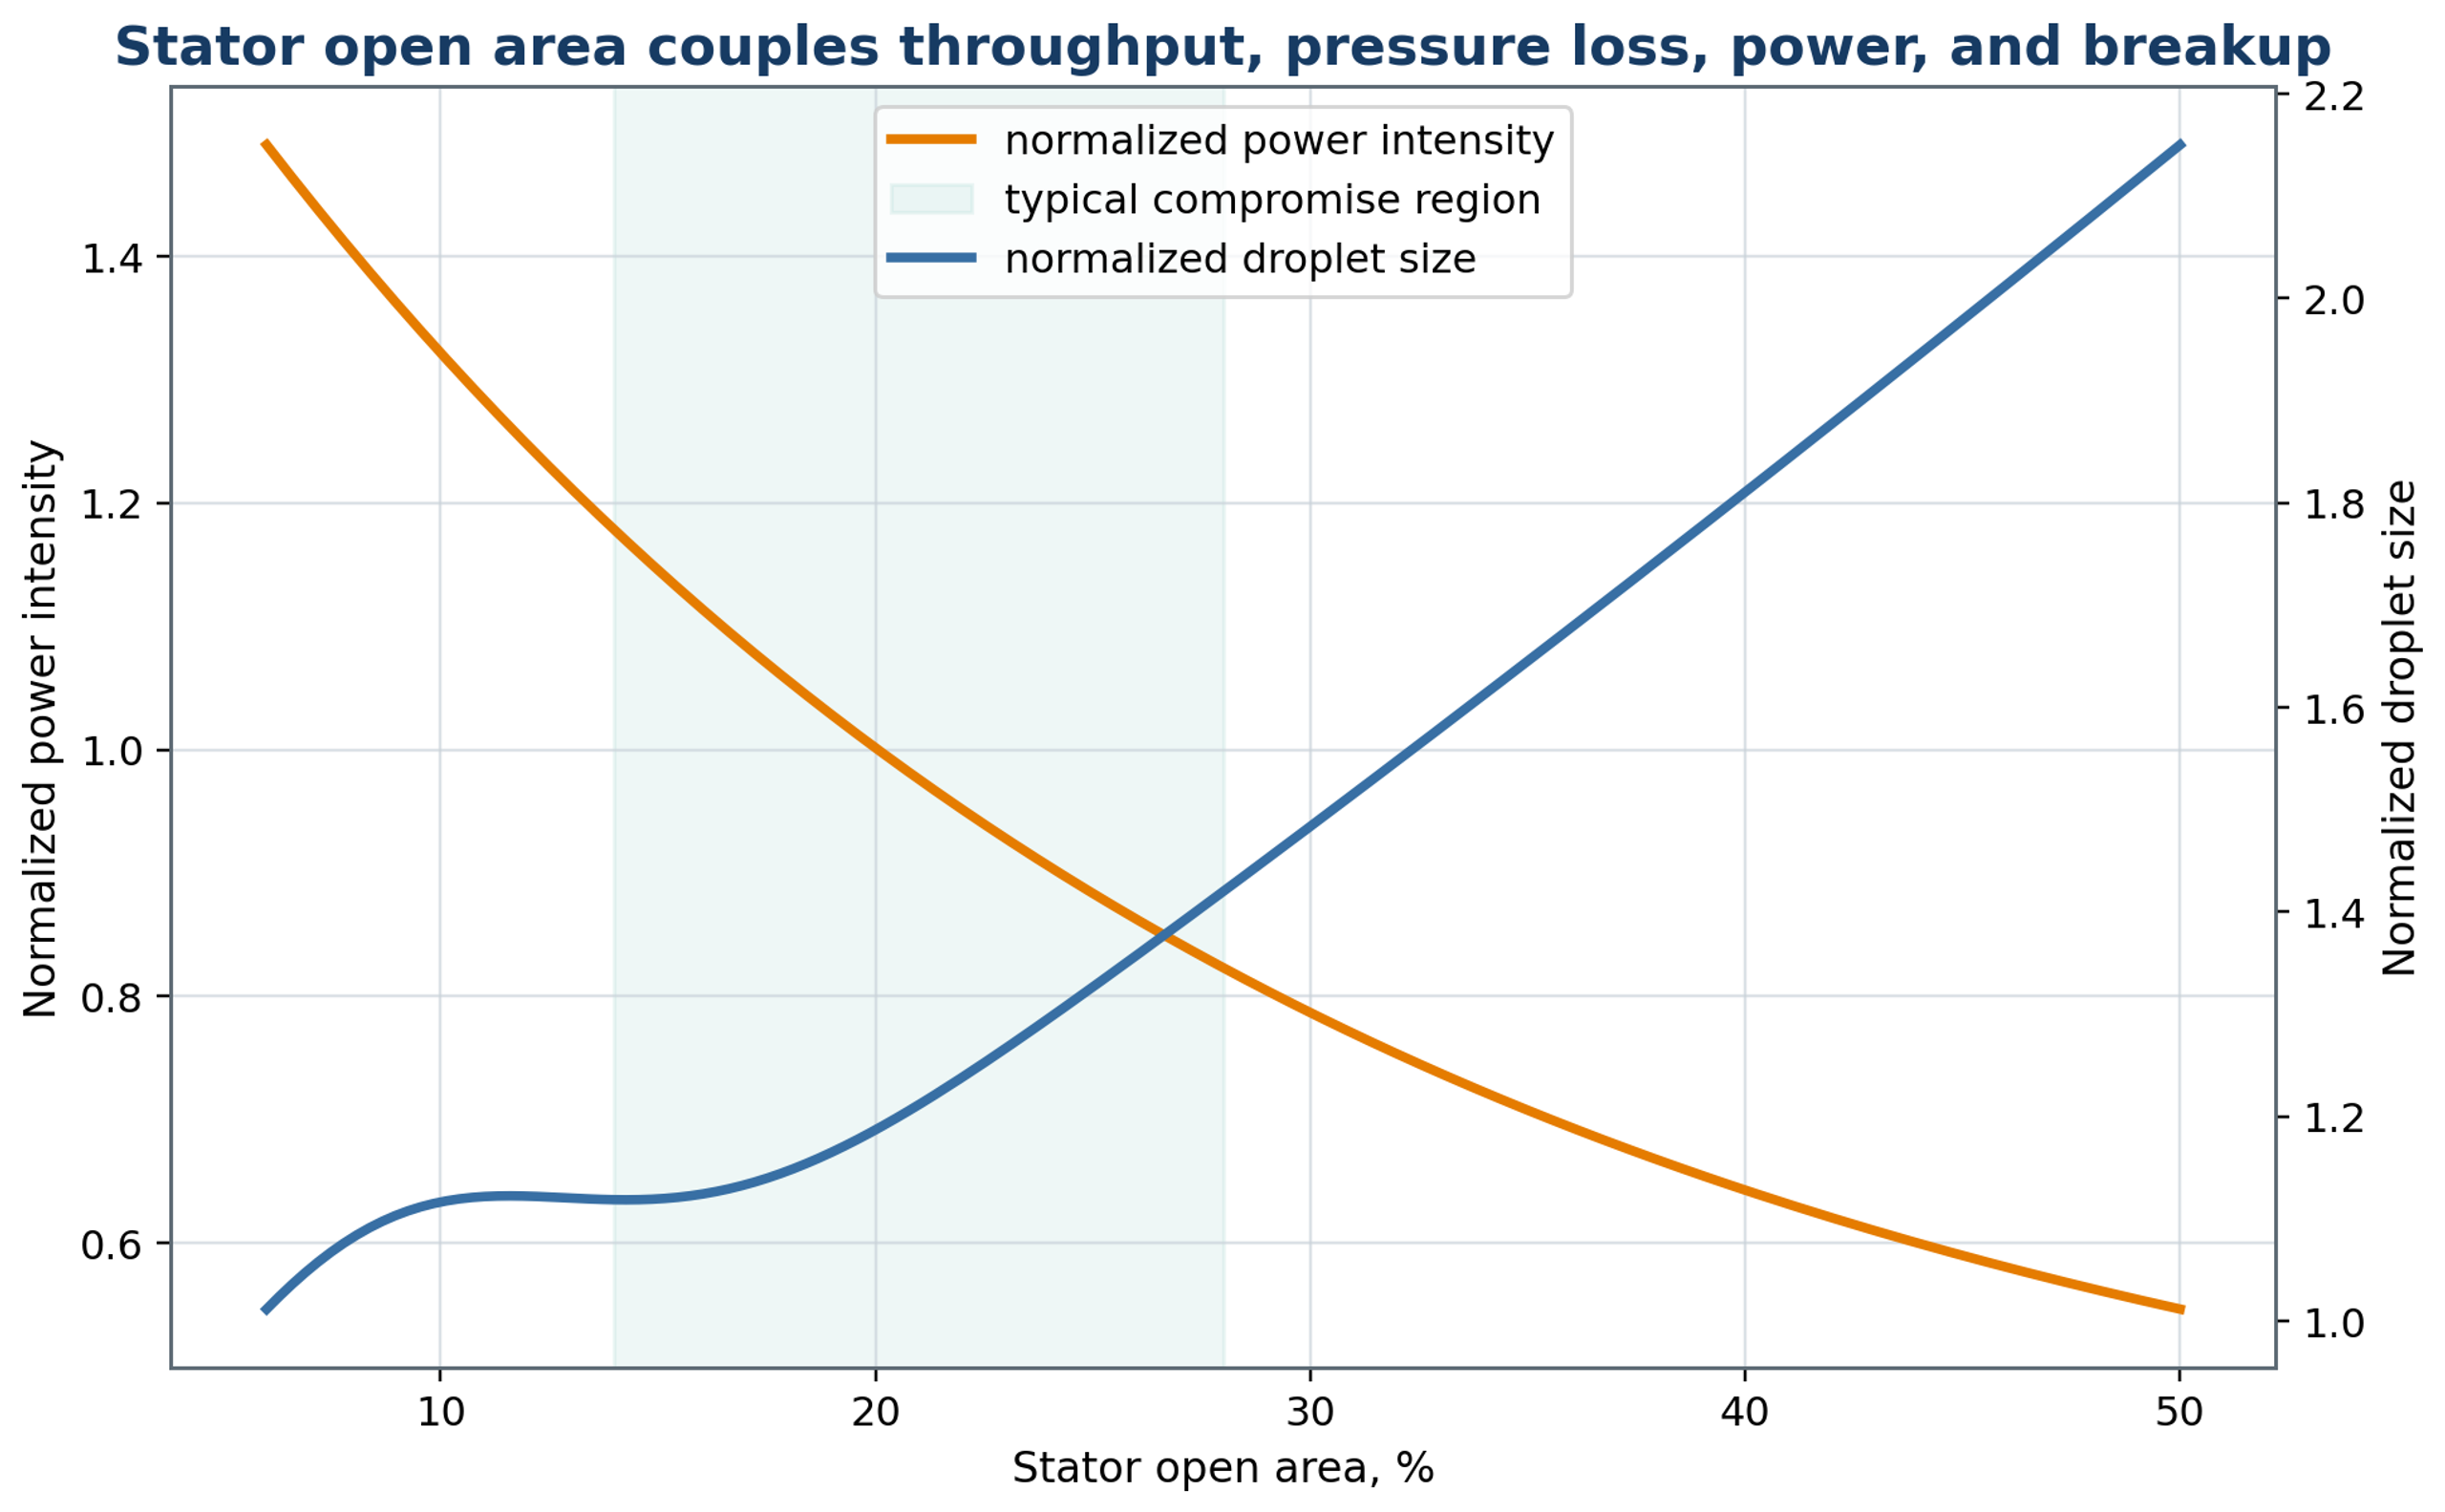
Figure 9.3. Conceptual relationship among stator open area, normalized power intensity, and droplet size. The shaded interval is an illustrative compromise region, not a validated universal design range.
9.3 Stage sequence and feed orientation
A sequence of processing stages permits the geometry to be adapted to the changing dispersion. A relatively coarse first stage distributes the secondary phase and reduces large domains before the material enters finer stages. This arrangement can improve operating robustness when the feed contains a broad droplet distribution or agglomerates. The orientation of successive openings also affects jet direction and the exposure history. Adequate passage area and pressure control are required throughout the sequence; simply adding stages does not establish that additional energy will improve the product.
IKA specifies three successive rotor stator generators for its DISPAX REACTOR DR 2000, with standard progression from coarse to medium to fine elements. The equipment can be integrated into a recirculating batch arrangement or supplied continuously. This documented configuration provides a practical example of staged processing, while the number of passes and resulting distribution remain dependent on the product and operating conditions [12].
The feed position determines whether the secondary liquid first encounters the rotor inlet, the annular region, or an upstream premixing zone. Injection close to an active region can shorten the interval available for bulk separation. However, a concentrated feed can also produce local phase inversion or encounter insufficient emulsifier. Computational flow analysis, tracer measurements, and conductivity tests can be used to investigate bypass and unequal feed distribution before product trials.
9.4 Wear and geometric drift
Wear gradually changes the geometry on which a process correlation depends. Edge rounding, clearance growth, erosion, and stator deformation alter local velocities and stress distributions. The nominal blade passage frequency remains determined by speed and element count, although damaged or missing features can alter the pressure spectrum. Average power can remain similar while the droplet distribution changes. Dimensional inspections, vibration measurements, and baseline flow and torque tests should therefore accompany routine maintenance. Replaceable generators are useful when abrasive ingredients or cavitation cause measurable wear.
Table 9.1. Geometry variables and design consequences.
| Geometry variable | Primary hydrodynamic effect | Product consequence | Mechanical consequence |
|---|---|---|---|
| Rotor diameter | Changes tip speed and power scale | Changes breakup intensity | Changes torque and shaft load |
| Radial gap | Controls local shear and leakage | Can affect fine size and uniformity | Tolerance, heating, contact risk |
| Number of rotor teeth | Changes passage frequency | Changes pulse count per residence | Balance and fabrication complexity |
| Stator open area | Controls port velocity and pressure loss | Strong effect on DSD and capacity | Motor load and blockage risk |
| Slot width | Sets contraction scale and solids tolerance | Influences coarse tail | Fouling and cleaning sensitivity |
| Number of stages | Adds sequential exposure | Can narrow DSD | Adds heat, pressure loss, parts |
| Groove orientation | Controls collision and circulation | Changes deformation history | Wear pattern and manufacturability |
10 Energy consumption and thermal management
An energy balance places droplet refinement in the context of power demand and thermal exposure. It also provides a common basis for comparing batch and continuous operation. The following relations distinguish shaft power, net process power, specific energy, interfacial free energy, and cooling duty; these quantities should be evaluated over the same material inventory and processing interval.
10.1 Shaft power, hydraulic power, and specific energy
Energy measurements provide a basis for comparing operating conditions and estimating the thermal load. Electrical input includes losses in the drive and motor, whereas shaft power is obtained from the rotational speed and transmitted torque. The distinction is necessary when comparing equipment with different motors or mechanical arrangements. For rotational speed in revolutions per second, the shaft power is
where denotes torque. Torque must be distinguished from the absolute temperature symbol used later in the thermal motion equations.
The net power assigned to the process is obtained by subtracting an appropriate mechanical baseline from the loaded power measured on the same basis:
The hydraulic power associated with a specified pressure difference and volumetric flow is
For a steady process, the specific energy delivered per unit mass is
where the denominator is the mass flow rate. For a batch, the corresponding accumulated specific energy is
where is the batch mass and the integral includes any variation of net power during processing.
For steady inline operation, the energy input per unit processed volume is
with representing the volumetric throughput.
An average power density based on a defined active volume is
These quantities describe different features of operation. Specific energy characterizes the cumulative energy demand and provides a basis for a thermal balance; active volume power density describes an average intensity within a selected region. Neither quantity directly specifies the local dissipation maxima responsible for individual breakup events. The active volume definition, baseline correction, auxiliary pump contribution, and measurement method should therefore be reported. Installed motor rating alone is insufficient for an energy comparison [1, 3, 10].
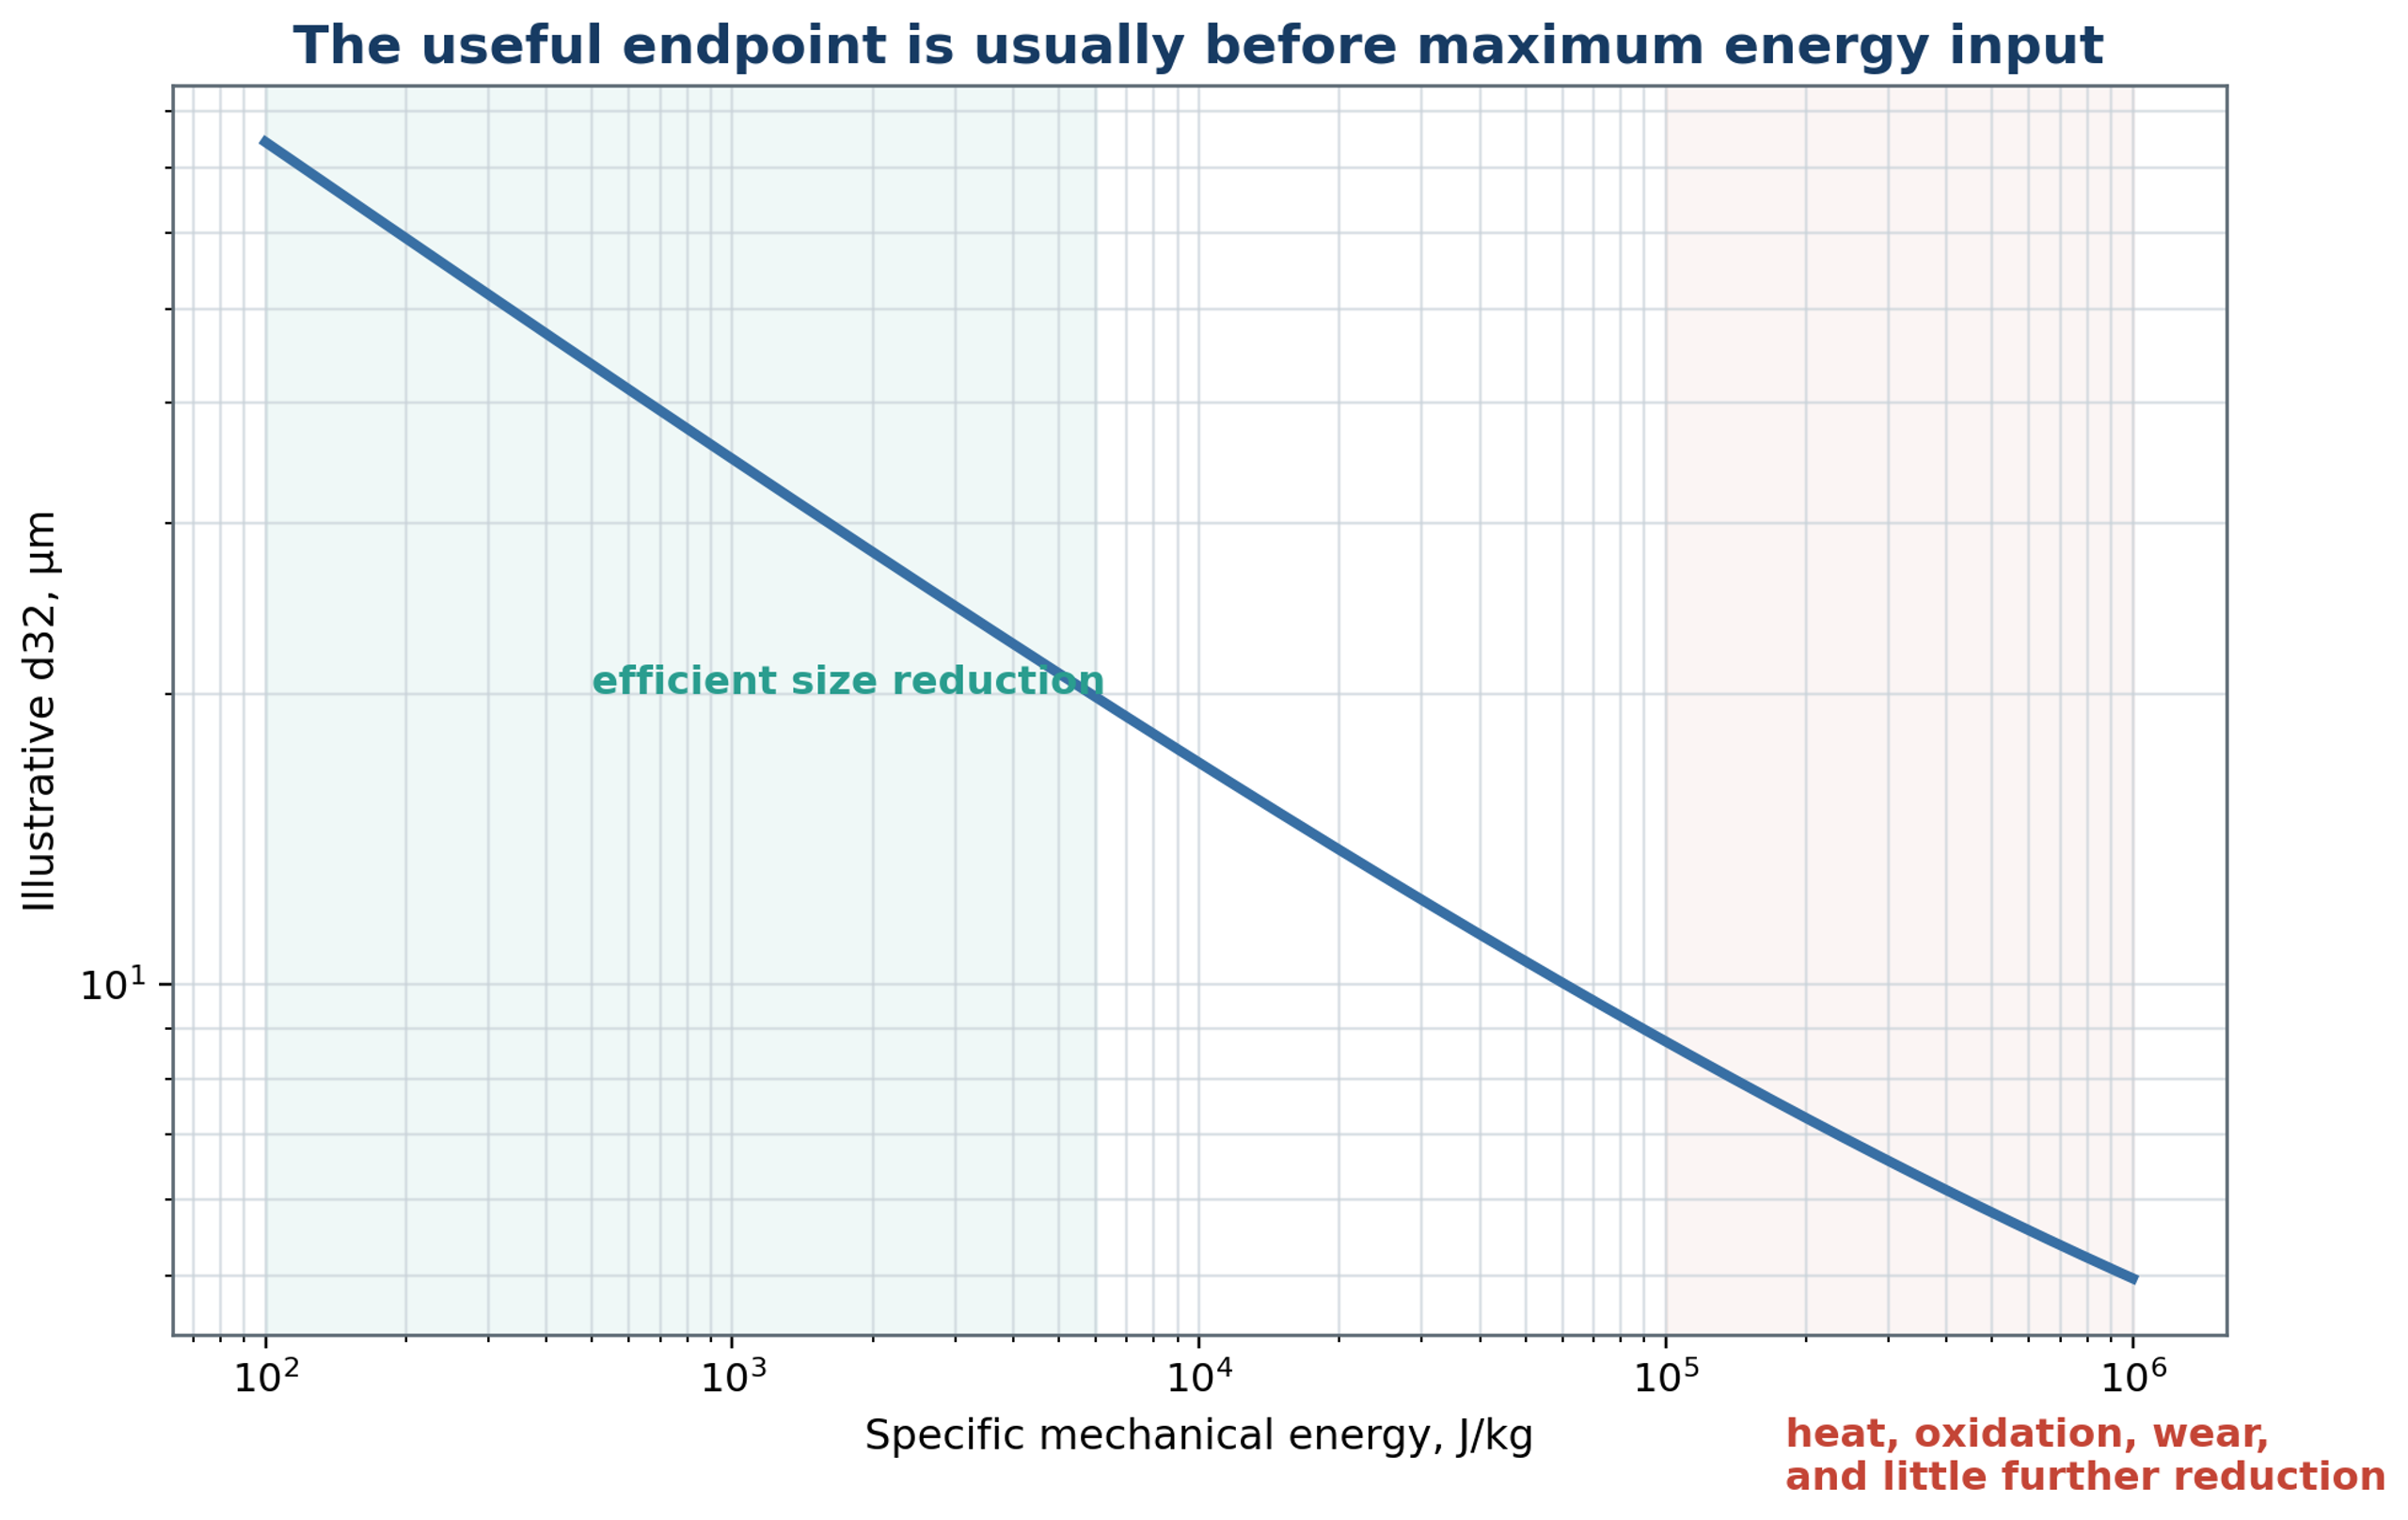
Figure 10.1. Conceptual relationship between specific energy and droplet reduction. The shaded regions illustrate diminishing returns and possible thermal or mechanical penalties. The indicated energy ranges are schematic and must not be used as universal operating limits.
10.2 Minimum interfacial work and energetic efficiency
Creating additional droplet surface requires interfacial free energy, although this requirement represents only a small fraction of the mechanical input. If interfacial tension can be treated as constant over the change in area, the increase is
where and are the initial and final interfacial areas. When interfacial tension changes with surface age or composition, this expression is a screening approximation to the corresponding interfacial work.
A convenient apparent interfacial energy efficiency is defined as
where is the measured net energy delivered during the same processing interval.
The resulting efficiency is generally small because much of the input is dissipated as heat or used in circulation and other fluid motion. Its interpretation also depends on dynamic interfacial tension, adsorption, coalescence, and deviations from spherical droplet shape. The metric is most useful for comparisons made with the same formulation, definition of input energy, and method of estimating area. It does not quantify the universal thermodynamic efficiency of the mixer.
10.3 Temperature rise and cooling duty
The thermal calculation connects energy consumption to formulation stability and cooling requirements. If all of the specified net energy is retained as sensible heat within the product, the estimated adiabatic temperature increase is
where is the effective heat capacity of the emulsion over the temperature interval considered.
For a steady stream that must be cooled from to a lower target temperature, the sensible cooling duty is
Heat transfer to the vessel, housing, and surroundings can reduce the measured temperature rise. The adiabatic estimate provides an upper bound only for the energy terms and material inventory included in the balance; pump heat, chemical heat release, and other inputs must be added where relevant. Cooling capacity should be evaluated for the highest intended load and viscosity, including recirculation. Because cooling changes viscosity and adsorption kinetics, temperature control also changes the emulsification conditions.
Kinematica describes MEGATRON inline systems with single or multistage working chambers and options for heating or cooling jackets. Such provisions permit thermal management to be integrated with the processing head, but jacket availability alone does not define the cooling rate or product temperature. The required thermal duty and residence history must be established from the actual power input, flow rate, and heat transfer conditions [38].
10.4 Energy based process endpoint
An energy based endpoint identifies the earliest verified condition at which the full product specification is satisfied. Suitable acceptance variables include , , span, storage stability, temperature, and a chemical or sensory measure appropriate to the formulation. Further processing should be supported by a measurable benefit. Investigations of milk pulsation homogenization illustrate the value of evaluating dispersion and energy together, although the reported relationships remain specific to the apparatus and operating conditions [16, 17, 39, 40].
11 Stability after rotor-stator processing
The state of the emulsion at the mixer outlet is only the initial condition for storage or subsequent processing. Gravitational migration, aggregation, coalescence, molecular transfer, and phase inversion can each change the product after hydrodynamic treatment has stopped. Identifying the active mechanism is necessary because reducing the initial mean diameter does not provide the same protection against every instability [6, 7, 20].
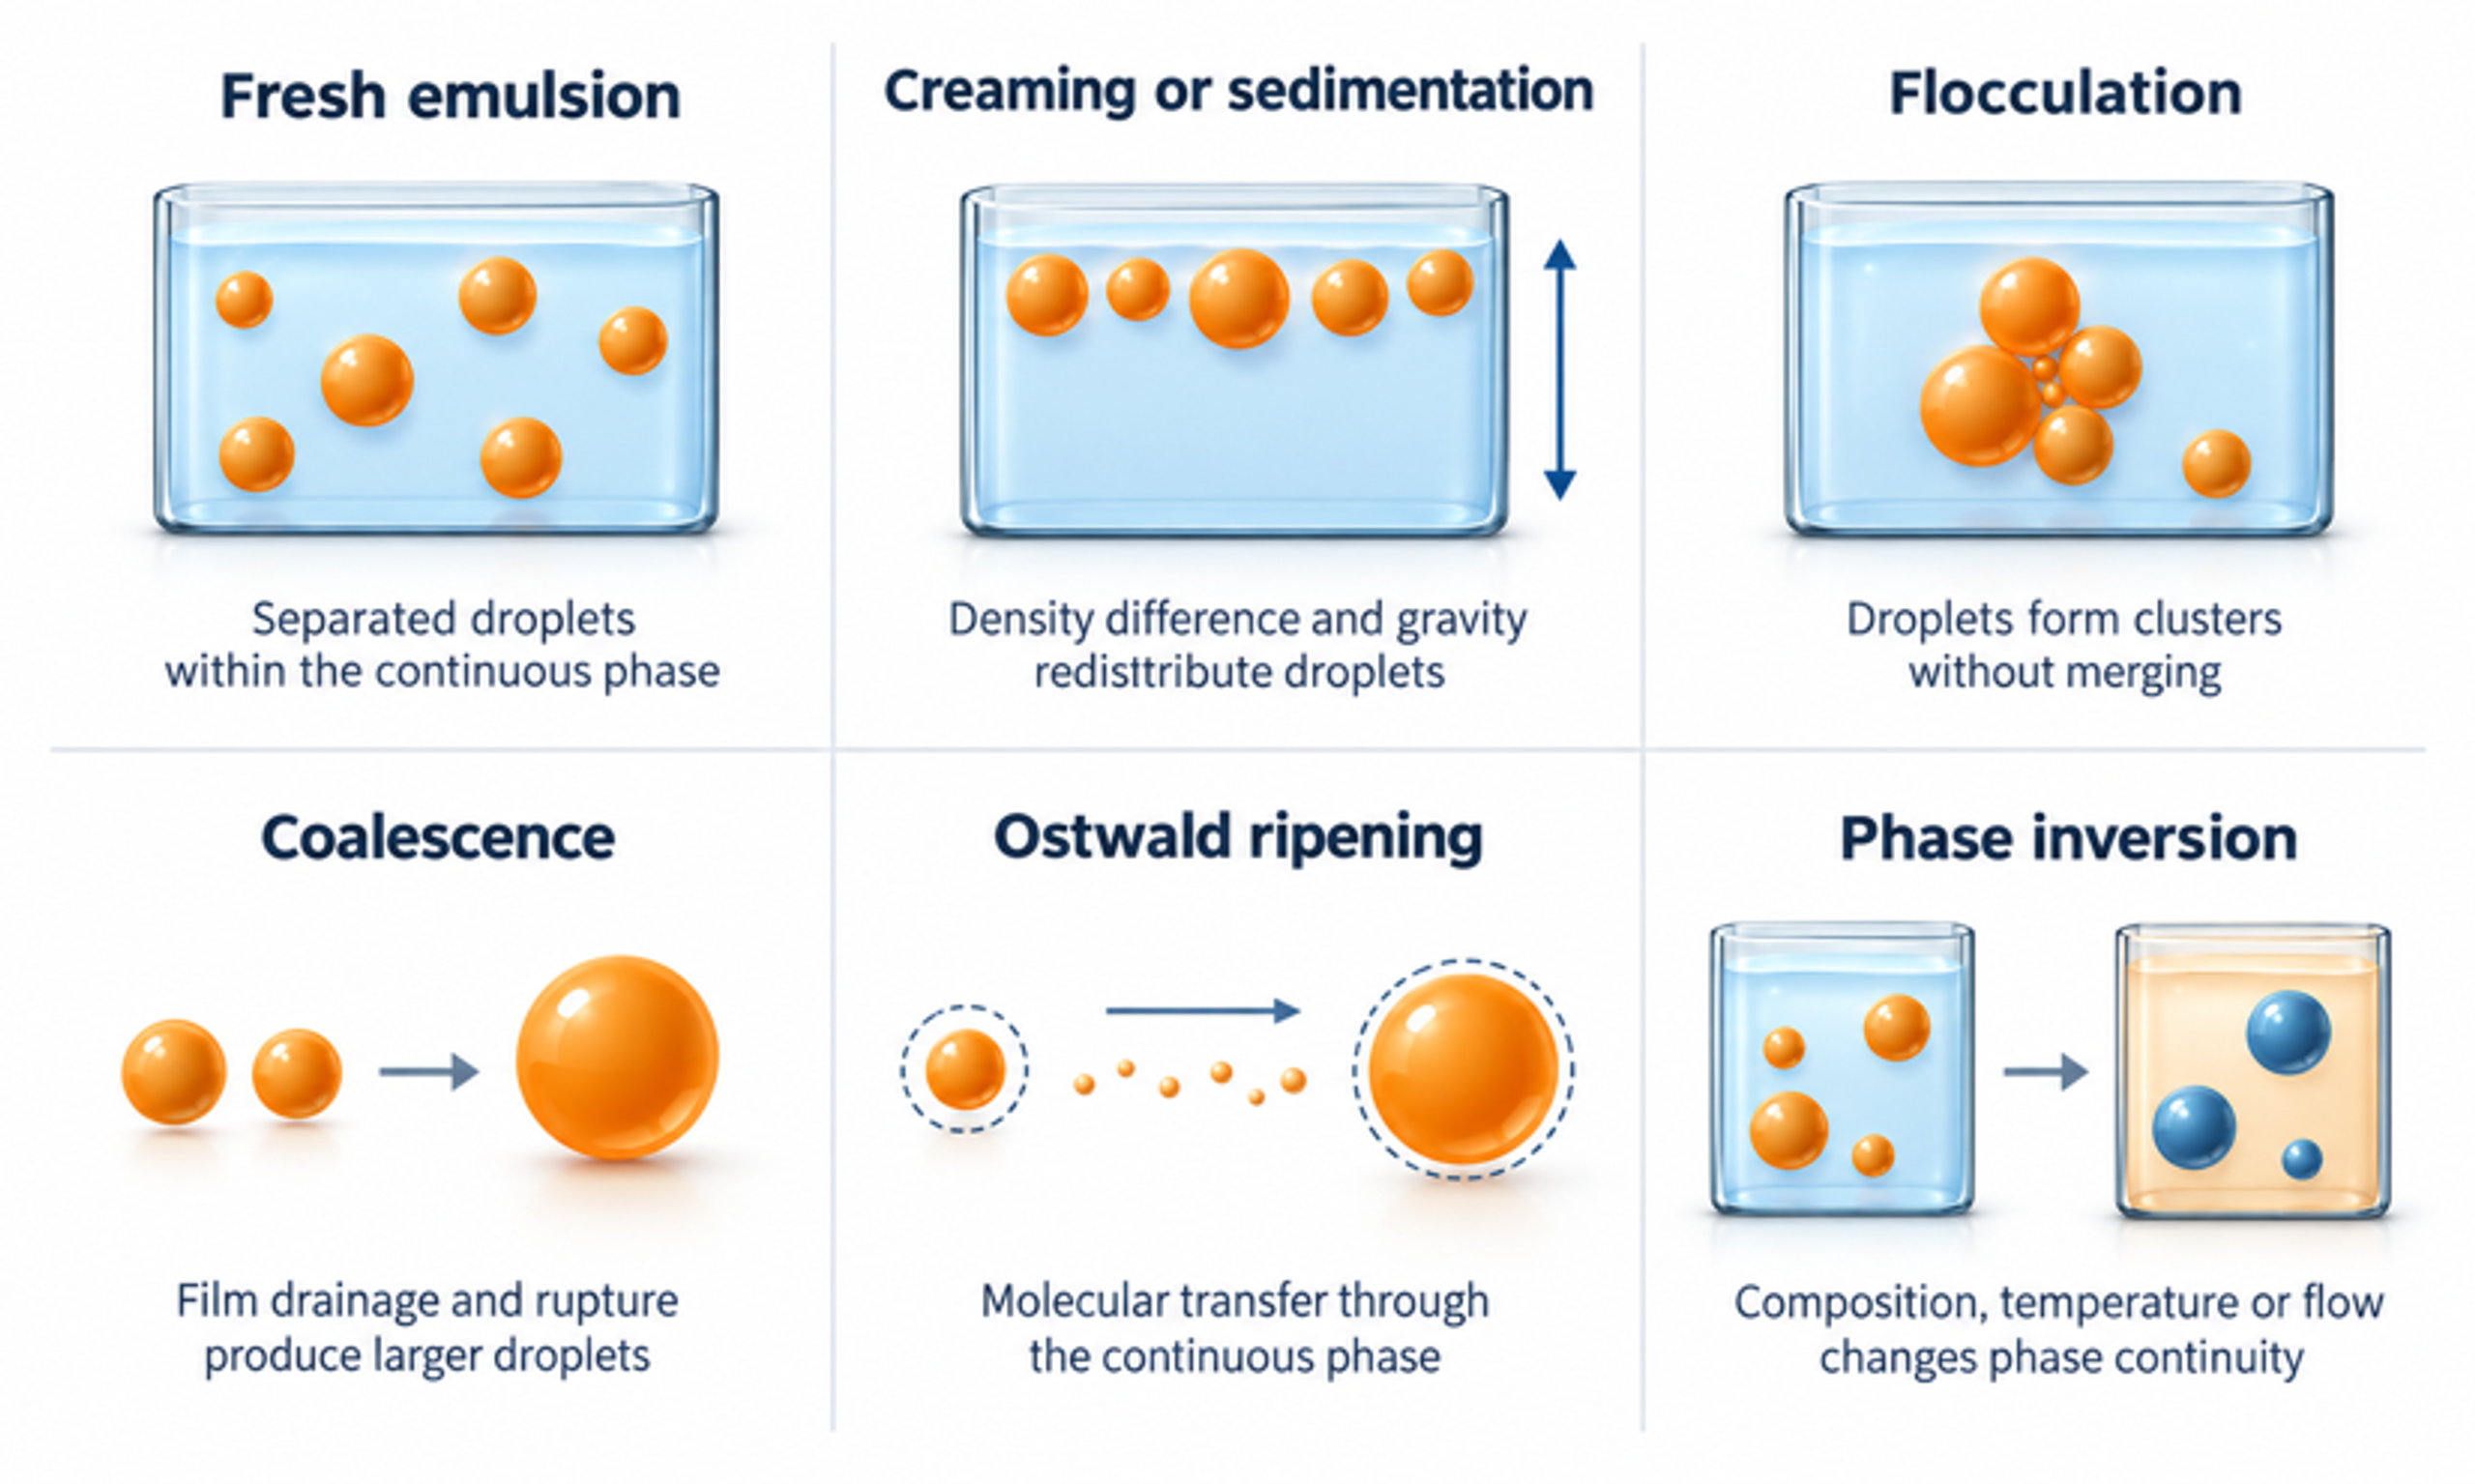
Figure 11.1. Principal physical destabilization mechanisms in emulsions: gravitational migration, flocculation, coalescence, Ostwald ripening, and phase inversion. The mechanisms change different aspects of the droplet population and require different diagnostic measurements.
11.1 Creaming and sedimentation
Gravitational separation redistributes droplets after processing and can occur without an increase in their individual diameters. Droplets that are less dense than the surrounding liquid rise by creaming, whereas denser droplets settle. For a dilute population of spherical droplets at low Reynolds number, the Stokes estimate provides a useful first assessment of the dependence on density difference, diameter, and continuous phase viscosity:
Here, g is gravitational acceleration. The sign of the density difference determines the direction of migration; the magnitude is used when comparing separation rates. The expression corresponds to rigid sphere drag and is a useful approximation for droplets with an effectively immobilized interface.
Quadratic dependence on diameter makes the coarse population particularly important. With otherwise unchanged properties, reducing diameter from 20 µm to 2 µm decreases the predicted Stokes velocity by a factor of one hundred. At larger dispersed phase fractions, hydrodynamic interactions can hinder relative motion. A commonly used screening form is
where n is an empirical exponent that must be appropriate to the dispersion and concentration range.
The hindered motion expression should be interpreted as an approximation. Flocculation, non-Newtonian rheology, concentration gradients, temperature gradients, and container geometry can dominate actual storage behavior. In addition, a freely mobile liquid interface has a different drag from a rigid sphere. Measured separation profiles are therefore needed to establish shelf life rather than relying solely on a calculated terminal velocity.
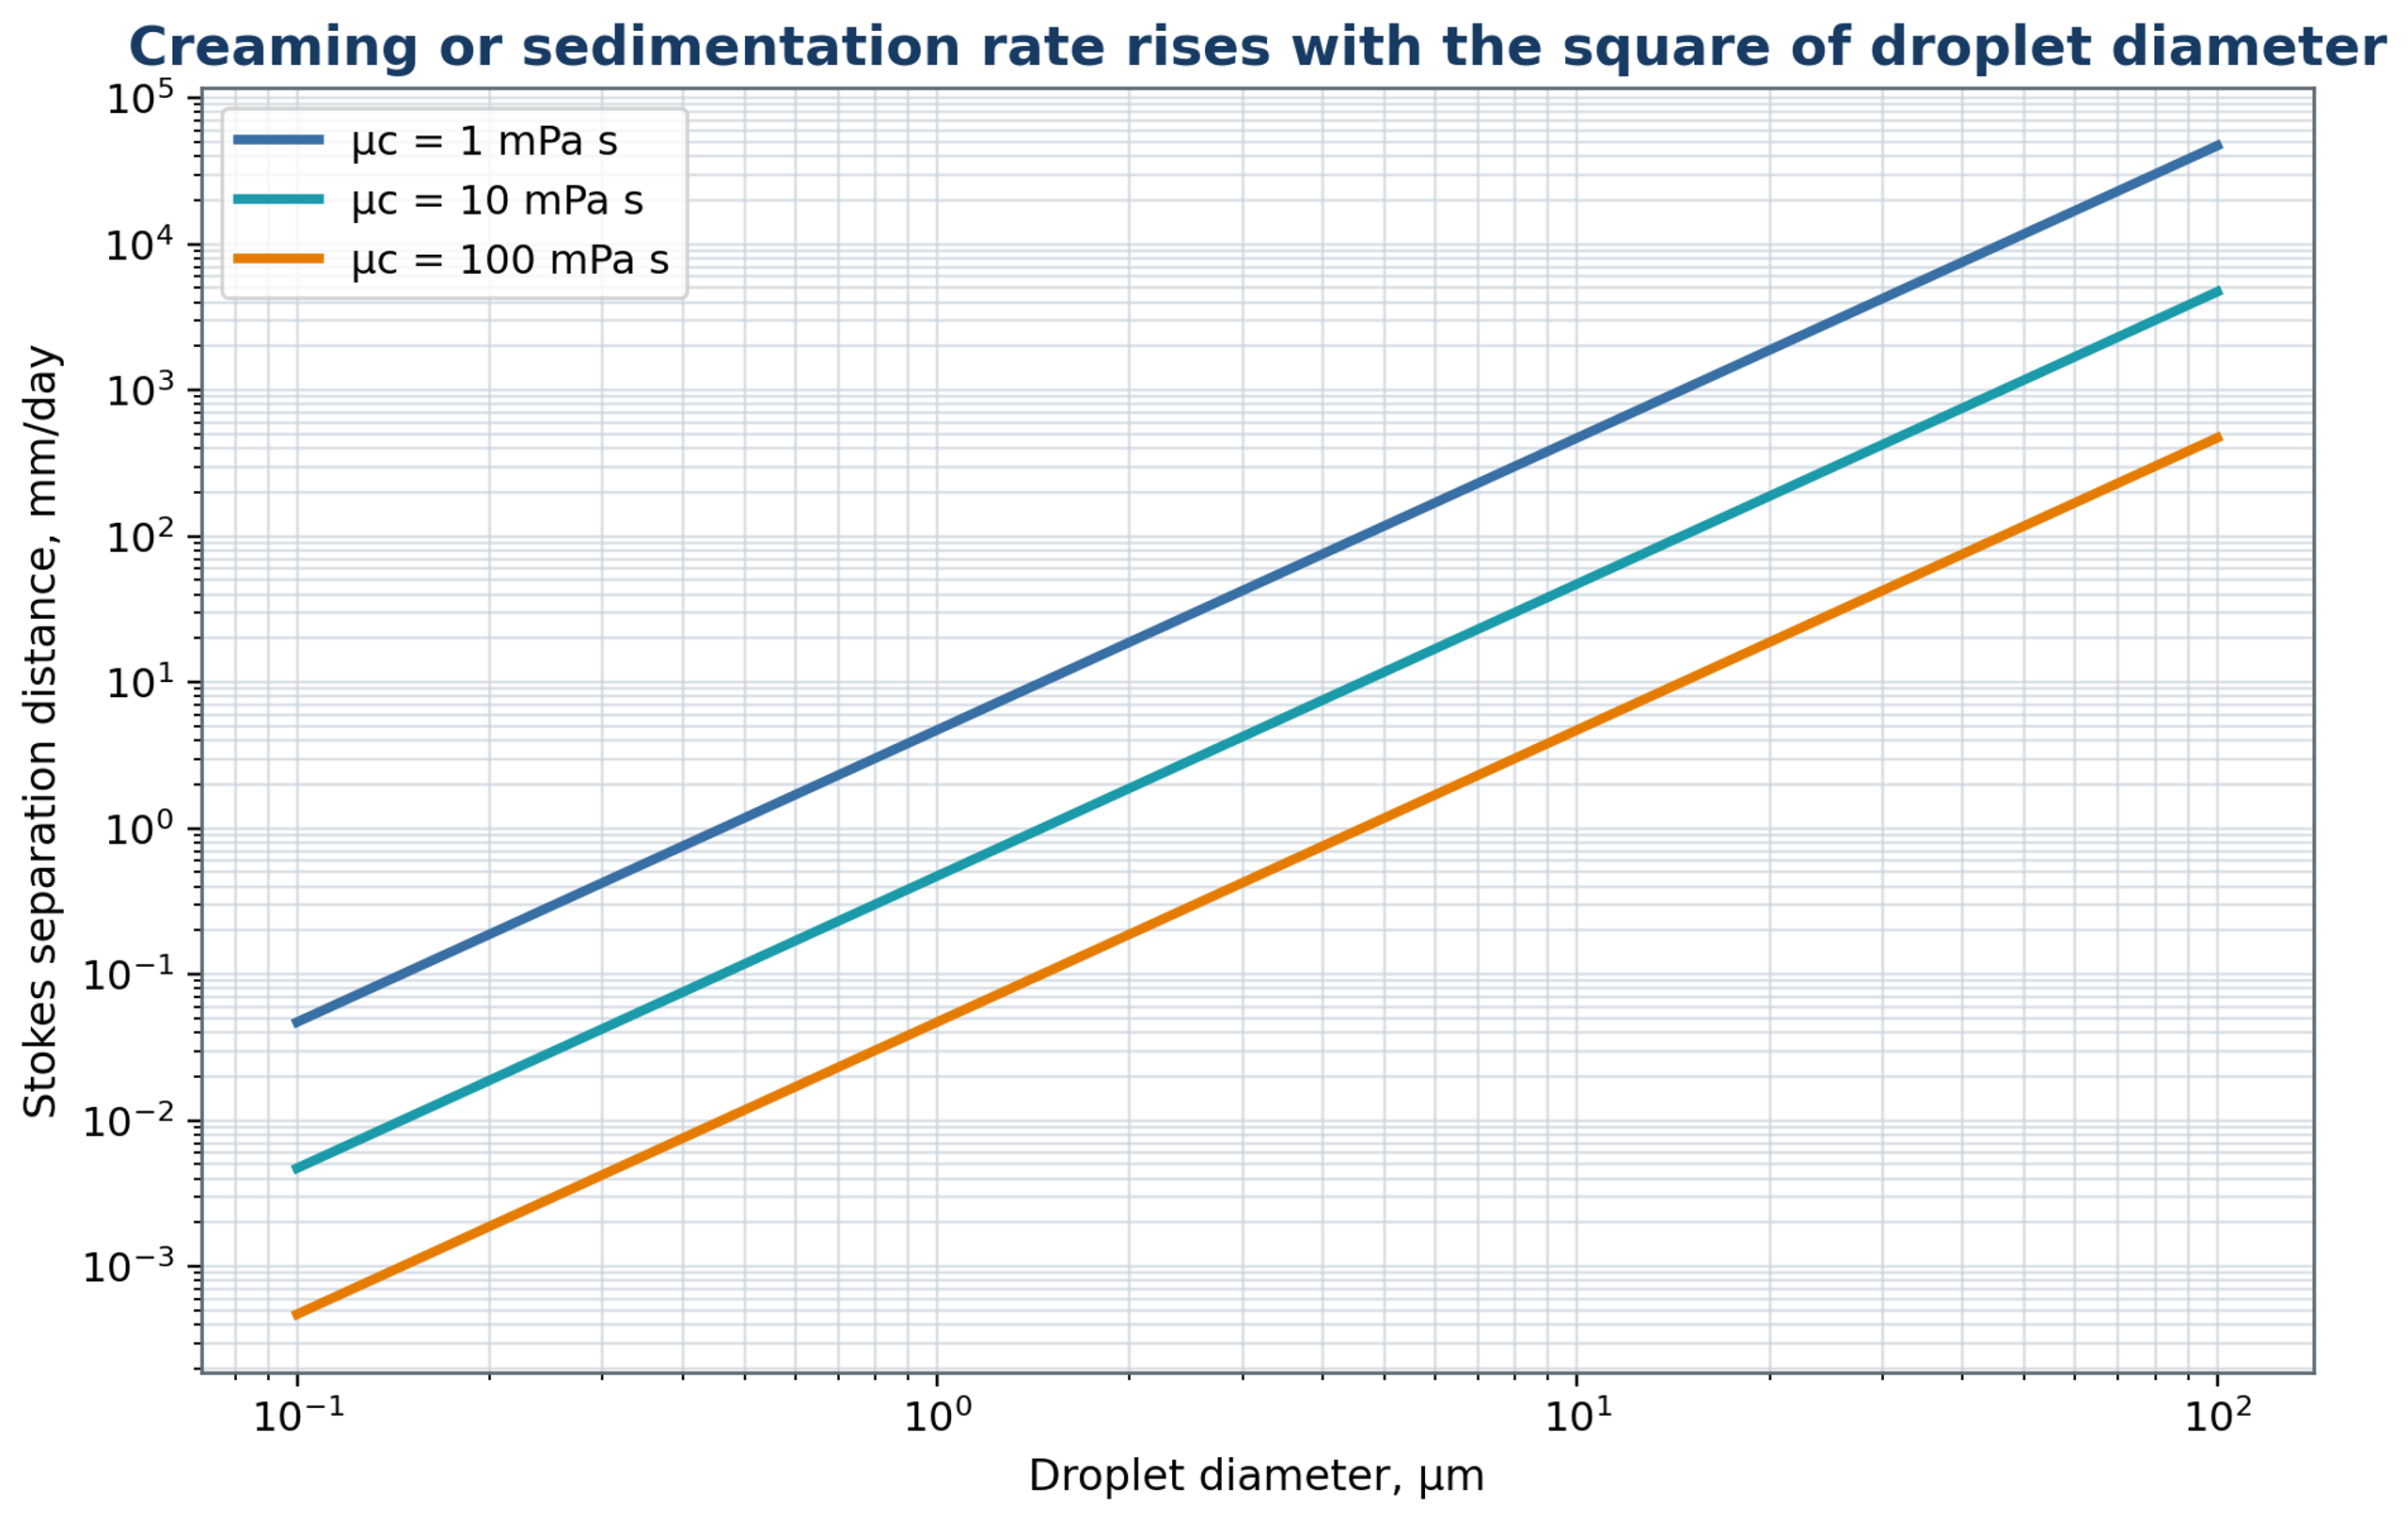
Figure 11.2. Stokes migration estimates for a density difference of approximately 100 kg m⁻³ and the continuous phase viscosities indicated, following equation (11.1). The calculation assumes dilute, spherical droplets with an effectively immobilized interface and creeping flow.
11.2 Flocculation and coalescence
Aggregation and coalescence change emulsion structure through different mechanisms and require different corrective measures. Flocculation produces clusters while preserving the individual droplet interfaces; it may be reversible and can increase the measured particle size without increasing primary droplet diameter. Coalescence combines droplets after the intervening liquid film drains and ruptures. Microscopy, controlled dilution, rheology, and droplet sizing under defined dispersion conditions help distinguish these processes.
Processing can improve stability by distributing emulsifier and reducing droplet size, but the same flow can increase collisions or damage weak interfacial structures. Measurements should therefore be made promptly after processing and repeated after a defined rest interval. An increase in with relatively little change in a number sensitive mean suggests growth of a coarse population, although this observation alone does not distinguish recoalescence from flocculation or a sampling artifact.
The competition between thermal motion and gravitational migration can be screened using the Stokes Einstein estimate of Brownian diffusivity:
where is Boltzmann constant and is absolute temperature. The expression assumes a spherical dispersed object in a Newtonian continuous phase.
A gravitational Peclet number based on the droplet diameter is
A small value indicates that Brownian diffusion is relatively important on the diameter length scale, whereas a large value indicates stronger gravitational transport. This comparison does not itself predict aggregation, which also depends on electrostatic, steric, and other interfacial interactions.
11.3 Ostwald ripening
Ostwald ripening is a molecular transport mechanism rather than a collision process. Material dissolves from droplets with higher curvature and is transported through the continuous phase to larger droplets. The mechanism is relevant when the dispersed liquid has appreciable solubility in the continuous liquid. Under idealized ripening conditions, a selected characteristic droplet size can follow a cubic growth relation:
where is an effective ripening constant. It depends on solubility, diffusivity, molar volume, temperature, and interfacial tension, and its numerical value depends on the definition of characteristic diameter.
Mechanical size reduction cannot permanently suppress ripening when molecular transfer is favored by the formulation. Possible formulation measures include a less soluble oil component, a suitable inhibitor of ripening, a different continuous phase, or a lower storage temperature. Their effectiveness must be established experimentally. Even an initially narrow nanoemulsion distribution can grow if molecular transfer remains appreciable.
11.4 Phase inversion and rheology
Phase inversion changes the identity of the continuous phase and can therefore change rheology, conductivity, pumping behavior, and apparent processing efficiency abruptly. Catastrophic inversion is associated with an increase in dispersed phase loading beyond the range sustainable by the existing structure. Transitional inversion results from changes in temperature, composition, salinity, or emulsifier affinity that alter the preferred interfacial curvature. Conductivity, viscosity, and microscopy provide complementary evidence during formulation addition and processing.
Concentrated emulsions commonly exhibit shear thinning and may develop yield stress. Their apparent viscosity controls pumpability and bulk circulation, while the viscosity at the local deformation rate affects transport through the head. Rheology should be measured before and after processing at the intended product temperature. An increase in viscosity can arise from finer droplets, flocculation, a higher phase fraction, or partial inversion, so rheological data should be interpreted together with droplet and topology measurements.
Table 11.1. Stability tests and their engineering interpretation.
| Test | Primary observation | Useful interpretation | Limitation |
|---|---|---|---|
| Immediate laser diffraction or imaging | DSD and coarse tail | Breakup result before aging | Sampling and dilution can alter flocs |
| Centrifugation | Accelerated separation | Relative formulation screening | Does not duplicate long term gravity exactly |
| Conductivity | Continuous phase identity | Detects inversion in many systems | Not useful when both phases are weakly conducting |
| Rheology | Viscosity, yield stress, thixotropy | Structure and processability | Cannot distinguish droplet refinement from flocculation alone |
| Microscopy | Droplet shape, flocs, coalescence | Direct structural evidence | Limited field of view and resolution |
| Turbiscan or vertical optical scan | Migration and clarification profiles | Separation kinetics without opening container | Optical contrast and multiple scattering affect response |
| Storage at multiple temperatures | Realistic aging | Detects coalescence, ripening, oxidation | Requires time and controlled packaging |
| Freeze thaw or thermal cycling | Stress resistance | Reveals interfacial and phase instability | May exceed actual product use conditions |
12 Special emulsion systems and applications
Application requirements determine which combination of droplet size, rheology, stability, temperature, and containment is acceptable. The same generator can produce different outcomes when the continuous phase, emulsifier, phase fraction, or intended structure changes. The examples below apply the general framework to food emulsions, pulsation homogenization, water in oil systems, concentrated structures, multiple emulsions, and particle stabilized interfaces.
12.1 Oil in water food and beverage emulsions
Food emulsions illustrate the need to combine hydrodynamic control with interfacial and product requirements. Milk, cream, nondairy beverages, sauces, dressings, flavor dispersions, and formulations containing lipophilic ingredients commonly use oil in water structure. Proteins, modified starches, gums, phospholipids, and suitable molecular emulsifiers provide different stabilization mechanisms. Rotor stator processing can prepare the premix or produce the final dispersion when the available stress and adsorption kinetics are sufficient [6, 7]. Studies with other homogenizer types provide useful formulation and stability comparisons but should not be treated as direct evidence of rotor stator performance [19].
The processing window must also account for temperature, oxidation, flavor retention, microbial control, contamination, and cleaning. An acceptable droplet distribution does not demonstrate that protein functionality or sensory quality has been retained. Chemical, microbiological, and sensory measurements should be selected according to the product and evaluated alongside droplet size and physical stability.
12.2 Milk homogenization and Ukrainian pulsation research
Milk homogenization provides a specific example of processing an emulsion with a complex natural interface. Native fat globules are surrounded by a membrane, while the aqueous phase contains proteins, lactose, minerals, and other constituents. Size reduction changes creaming, optical properties, texture, and the interfacial area available for protein adsorption. Ukrainian investigations include both apparatus with a vibrating rotor and related pulsation devices with an oscillating perforated piston. These configurations share periodic acceleration mechanisms, but their geometry and exposure histories should be distinguished [16, 17, 39, 40].
Samoichuk and Ivzhenko described a calculation approach for a pulsation homogenizer with a vibrating rotor, in which periodic passage overlap, and axial motion contribute to unsteady flow [16]. In a separate experimental study, Deynichenko and coauthors used a crank driven perforated piston rather than a conventional rotating workhead. They reported an average milk fat globule size of approximately 0.8 µm and specific energy not exceeding 3.4 kJ kg⁻¹ for a tested condition with 10 mm oscillation amplitude and 150 s⁻¹ frequency [17]. These results support investigation of controlled acceleration, but they do not establish a universal performance advantage or a direct scale up law for rotor stator mixers.
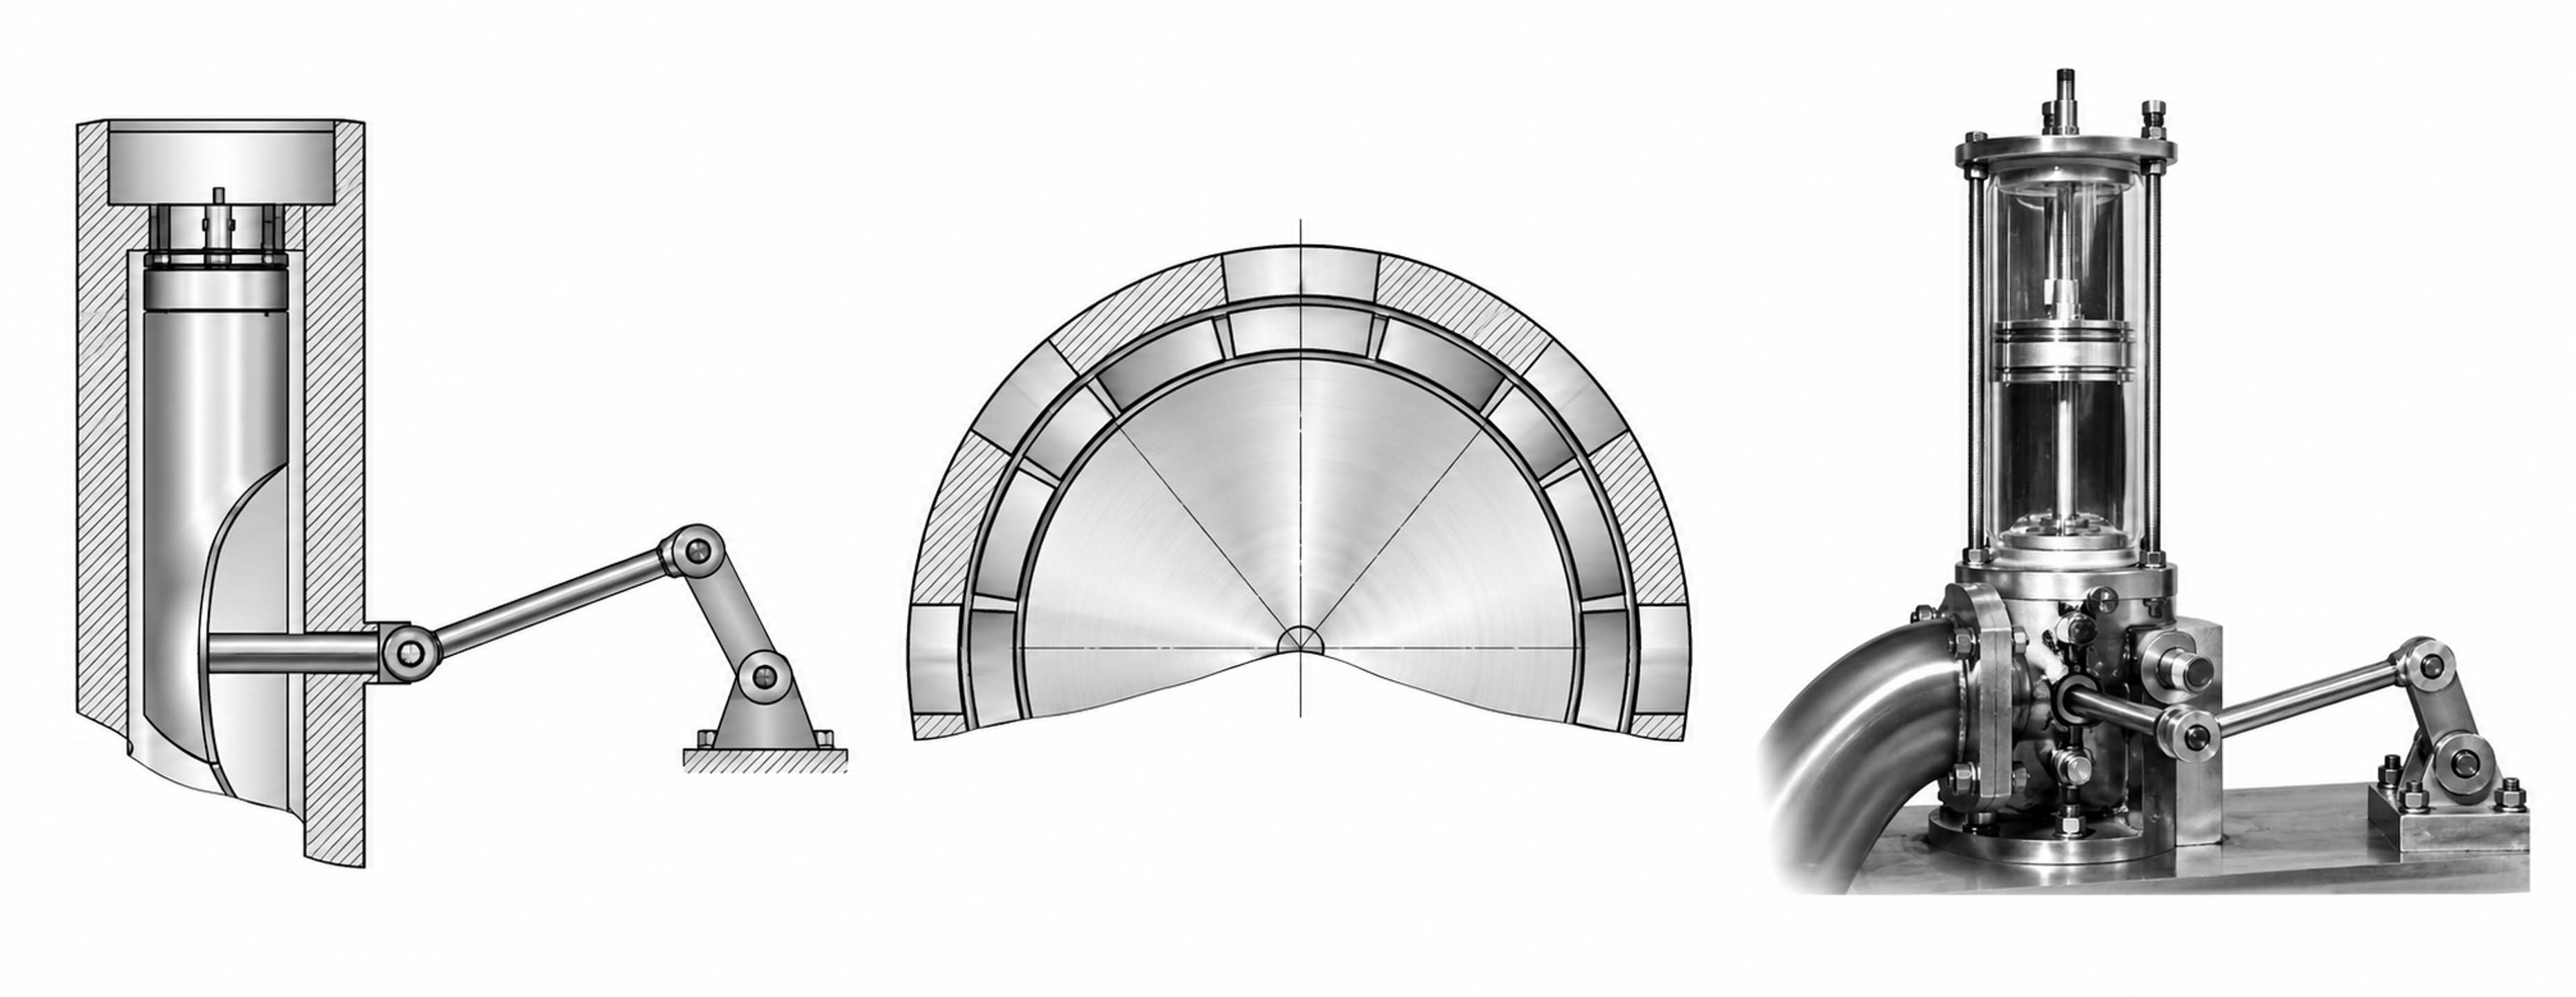
Figure 12.1. Two related pulsation technologies. The longitudinal and radial views at left and center show the vibrating rotor concept; the apparatus at right shows the reciprocating perforated piston concept. The views are not dimensional apparatus drawings.
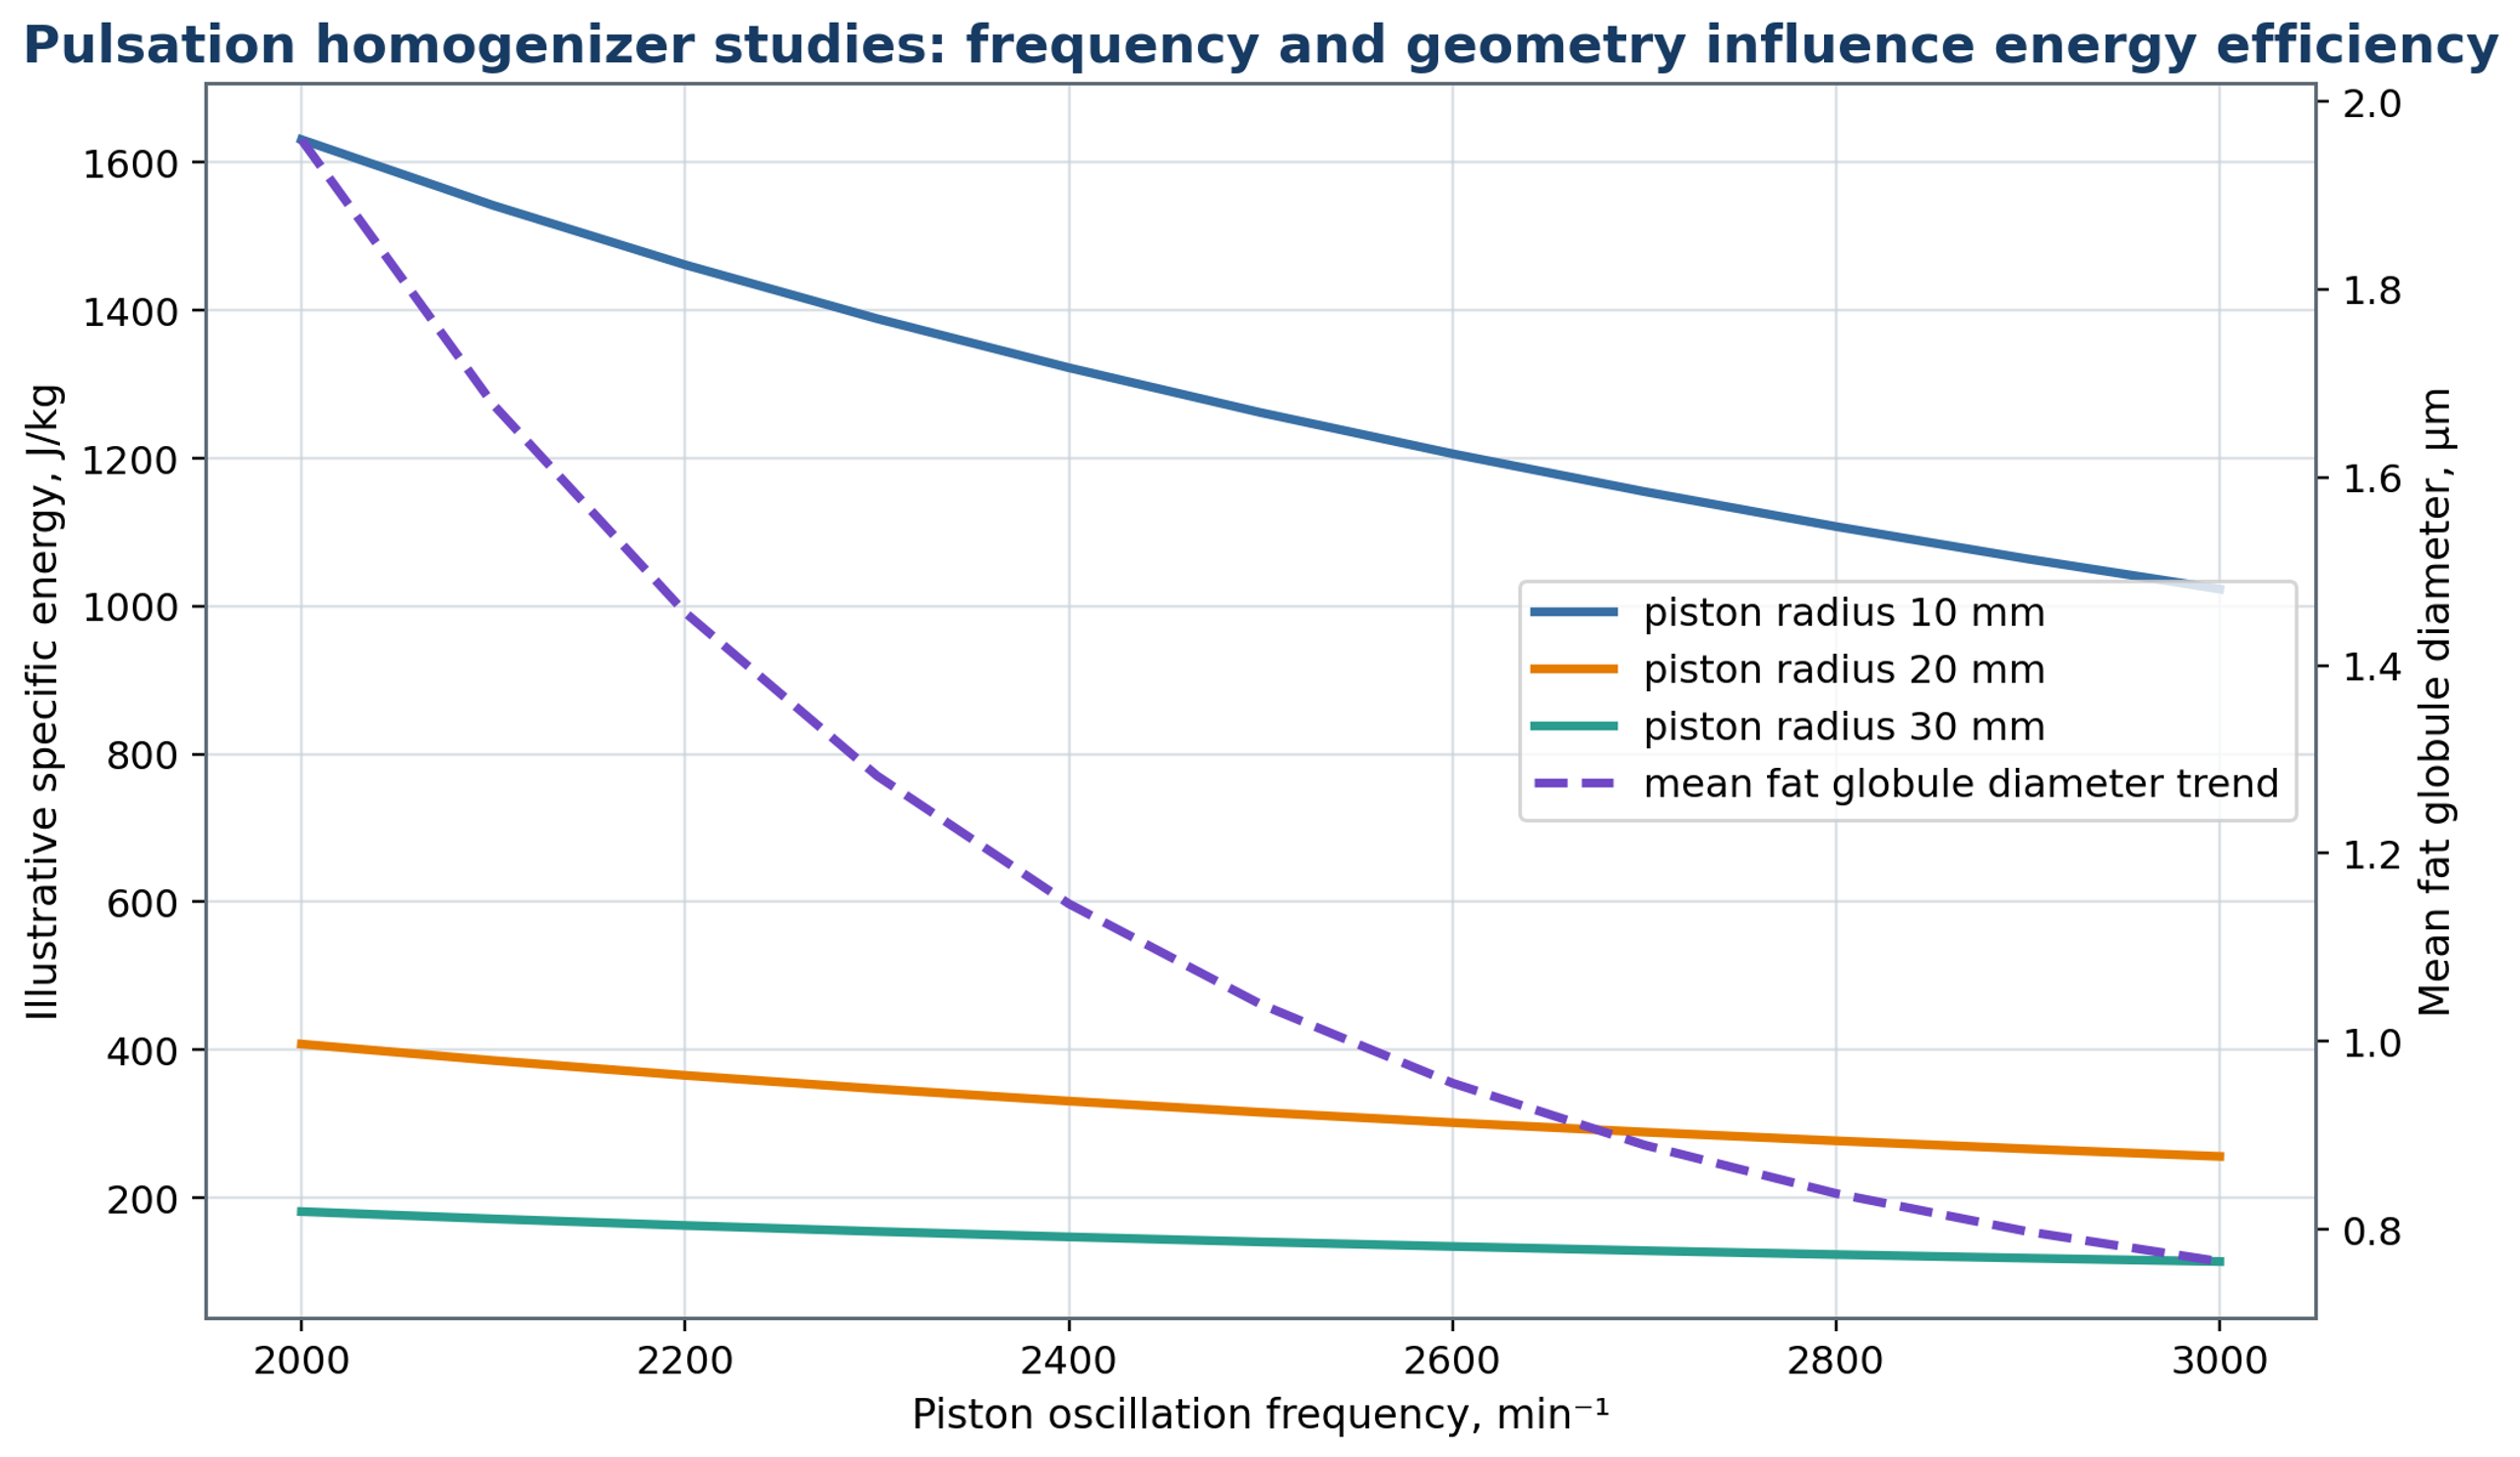
Figure 12.2. Conceptual trends linking oscillation frequency and geometric parameters to mean fat globule size and specific energy, motivated by pulsation studies [16, 17, 39, 40]. The frequency range and radius labels are hypothetical illustration parameters and do not reproduce the experimental conditions of the cited papers.
12.3 Water in oil and fuel emulsions
Water in oil emulsification differs from oil in water processing because the more viscous oil often forms the continuous phase. Lipophilic emulsifiers may be needed, and dispersed water can settle when its density exceeds that of the oil. High continuous phase viscosity can suppress turbulence and limit circulation, requiring appropriate pumping, temperature control, or generator selection. Local water accumulation should be avoided because it can produce large domains or promote inversion before the intended structure is established.
For fuel emulsions, droplet distribution and storage stability must be considered together with corrosion, combustion behavior, and compatibility with pumps and injectors. Dissolved gas, volatile constituents, and pressure fluctuations affect both processing and containment requirements. The materials, seals, elastomers, and electrical equipment must be selected for the specified fuel and operating environment.
12.4 High internal phase and structured emulsions
High internal phase emulsions couple droplet deformation to the development of a concentrated material structure. As the dispersed phase loading increases, droplets become crowded and can develop nonspherical shapes, yield stress, and pronounced shear thinning. The resulting product may cease to circulate effectively through a conventional batch head even while the head continues to draw power. Bulk agitation, auxiliary pumping, or staged addition should therefore be considered as part of the emulsification system.
The composition path is particularly important in these systems. Rapid addition can produce local inversion or isolated large domains that are difficult to process later. Controlled addition near a well-supplied inlet, together with adequate vessel turnover, improves the uniformity of contact. After the desired droplet distribution has been established, a less intense finishing stage may be appropriate when further processing would damage the intended structure.
12.5 Multiple emulsions
Multiple emulsions require preservation of an internal dispersion while a second interface is formed. Water in oil in water system is commonly prepared by first forming stabilized primary water in oil emulsion and then dispersing it into the external aqueous phase. The second operation must create the outer droplets without extensively rupturing the primary structure. Lower stress, larger openings, or shorter exposure may therefore be appropriate in the second stage, subject to verification of both external size and internal integrity.
External droplet size alone cannot establish the success of encapsulation. Measurements should include encapsulation efficiency or release, with microscopy, conductivity, or an appropriate tracer method used to examine the internal structure. A narrow external size distribution can coexist with substantial leakage of the enclosed phase.
12.6 Pickering emulsions and particle stabilized interfaces
Pickering emulsions are stabilized by particles adsorbed at the liquid interface. Their formation depends on particle wettability and the energetic preference for remaining at the interface, together with the rate at which particles are dispersed and transported to newly created surfaces. Rotor stator operation must provide adequate dispersion while avoiding undesirable particle fragmentation or agglomeration. Particle size, contact angle, surface treatment, ionic strength, and addition sequence should be specified. Adsorption and rearrangement can be slow, so the premix and feed path may be as important as the maximum hydrodynamic stress.
12.7 Rotor-stator nanoemulsions
Submicron emulsions can be produced by rotor stator processing under suitable formulation and operating conditions, although the result cannot be inferred from a machine designation alone. Gazolu Rusanova and coauthors reported droplets of approximately 100 to 500 nm using modified starch; gum Arabic gave larger droplets in their study, associated with slower adsorption and more coalescence [6]. Other experiments have related size to turbulent inertial stresses and viscosity effects [4], while observations of approximately lognormal distributions provide evidence for repeated stochastic fragmentation under the conditions investigated [5]. These studies describe different formulations and regimes rather than one universal nanoemulsion mechanism.
A nanoemulsion designation should be accompanied by the measured distribution, weighting basis, and test method. A number weighted mean below 500 nm can coexist with a relevant volume fraction above 1 µm. Dynamic light scattering, laser diffraction, microscopy, and separation tests probe different features of the sample and can respond differently to dilution or aggregates. The measurement method, optical assumptions, and preparation protocol should be reported with the size result.
Beverage nanoemulsion formulations have also been disclosed in patent literature on high shear processing [41]. A patent specification establishes a disclosed formulation and process concept; its claims do not replace an independent comparison of droplet distributions, stability, and energy consumption under common test conditions.
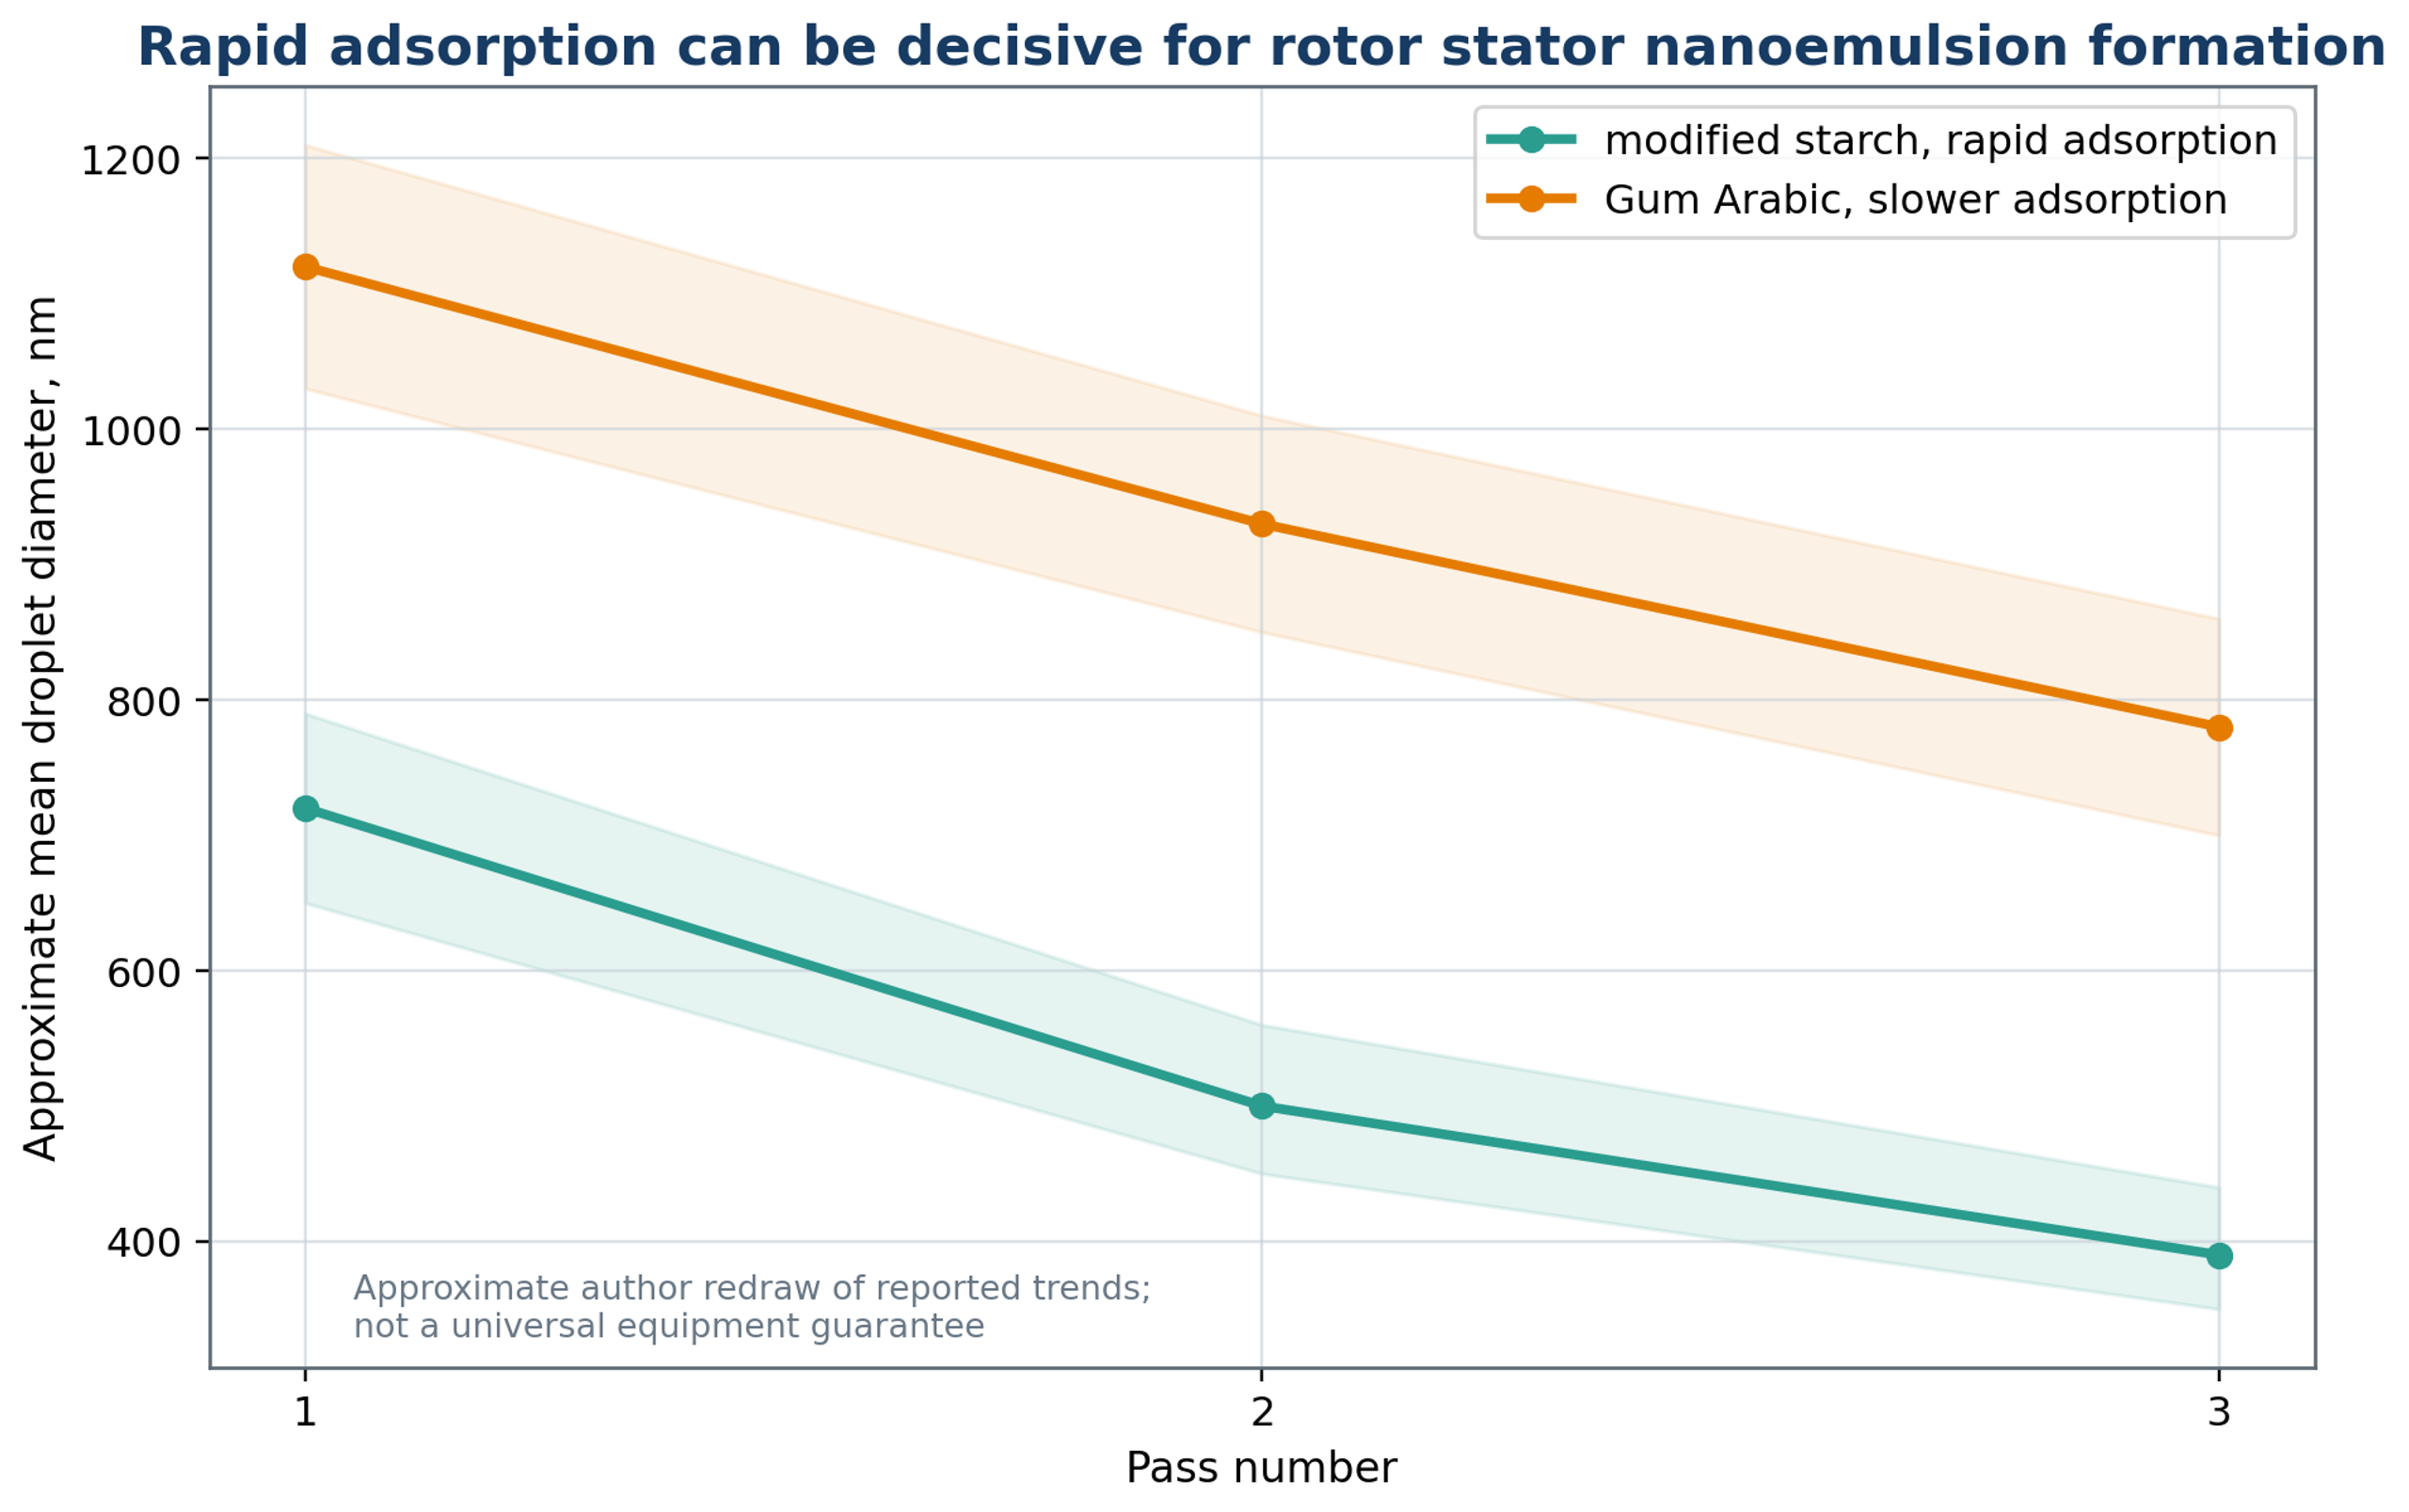
Figure 12.3. Schematic pass dependent trends for modified starch and gum Arabic emulsifiers, motivated by the formulation effects reported by Gazolu Rusanova and coauthors [6]. The curves are illustrative, and the shaded regions represent schematic formulation variability rather than measured confidence intervals.
Table 12.1. Application specific rotor stator priorities.
| Application | Primary quality target | Dominant process concern | Recommended additional measurement |
|---|---|---|---|
| Milk and cream | Fat globule distribution and creaming | Protein interaction and heat | Microscopy, creaming index, viscosity |
| Mayonnaise and dressing | Texture and phase stability | High viscosity and inversion | Rheology, conductivity, oiling off |
| Beverage flavor emulsion | Fine stable DSD and optical quality | Ripening and flavor loss | Turbidity, storage, volatile retention |
| Cosmetic cream | Sensory texture and stability | Air, heating, batch reproducibility | Rheology, microscopy, microbial control |
| Pharmaceutical emulsion | Dose uniformity and stability | Contamination and active degradation | Assay, sterility strategy, particle count |
| Agrochemical concentrate | Dilution stability and sprayability | High active loading and crystals | Dilution test, nozzle test, sedimentation |
| Fuel emulsion | Stable water distribution | Safety, corrosion, volatility | Flash point strategy, corrosion, engine test |
| Polymer latex or coating | Particle and droplet uniformity | Viscosity, reaction, foam | Solids, rheology, film performance |
13 Scale up and technology transfer
Technology transfer requires preserving the product attributes that motivated the original processing conditions. Scaling the equipment can change local stresses and exposure distributions in different ways, so agreement in a single operating parameter is insufficient evidence of equivalent processing. The following discussion compares common scaling criteria and describes the pilot measurements needed to establish their useful range [1, 3].
13.1 Why geometric similarity is insufficient
Scale up requires reproduction of a product response across changes in equipment size and processing rate. Geometric similarity is insufficient because a change in rotor diameter also changes velocity, power, torque, local residence, circulation, and the proportion of material occupying active regions. Clearance and manufacturing tolerances may not scale proportionally, and changes in heating or adsorption history can alter the formulation response. A transferable process description must therefore identify the variables that control both breakup and stabilization [1, 3, 10].
A useful hierarchy begins with product requirements and then considers the associated stress, exposure, residence distribution, energy, and thermal conditions. Mechanical limitations are applied to the candidate operating range. This sequence prevents a convenient equipment parameter from becoming the sole acceptance criterion when the droplet distribution or stability has changed.
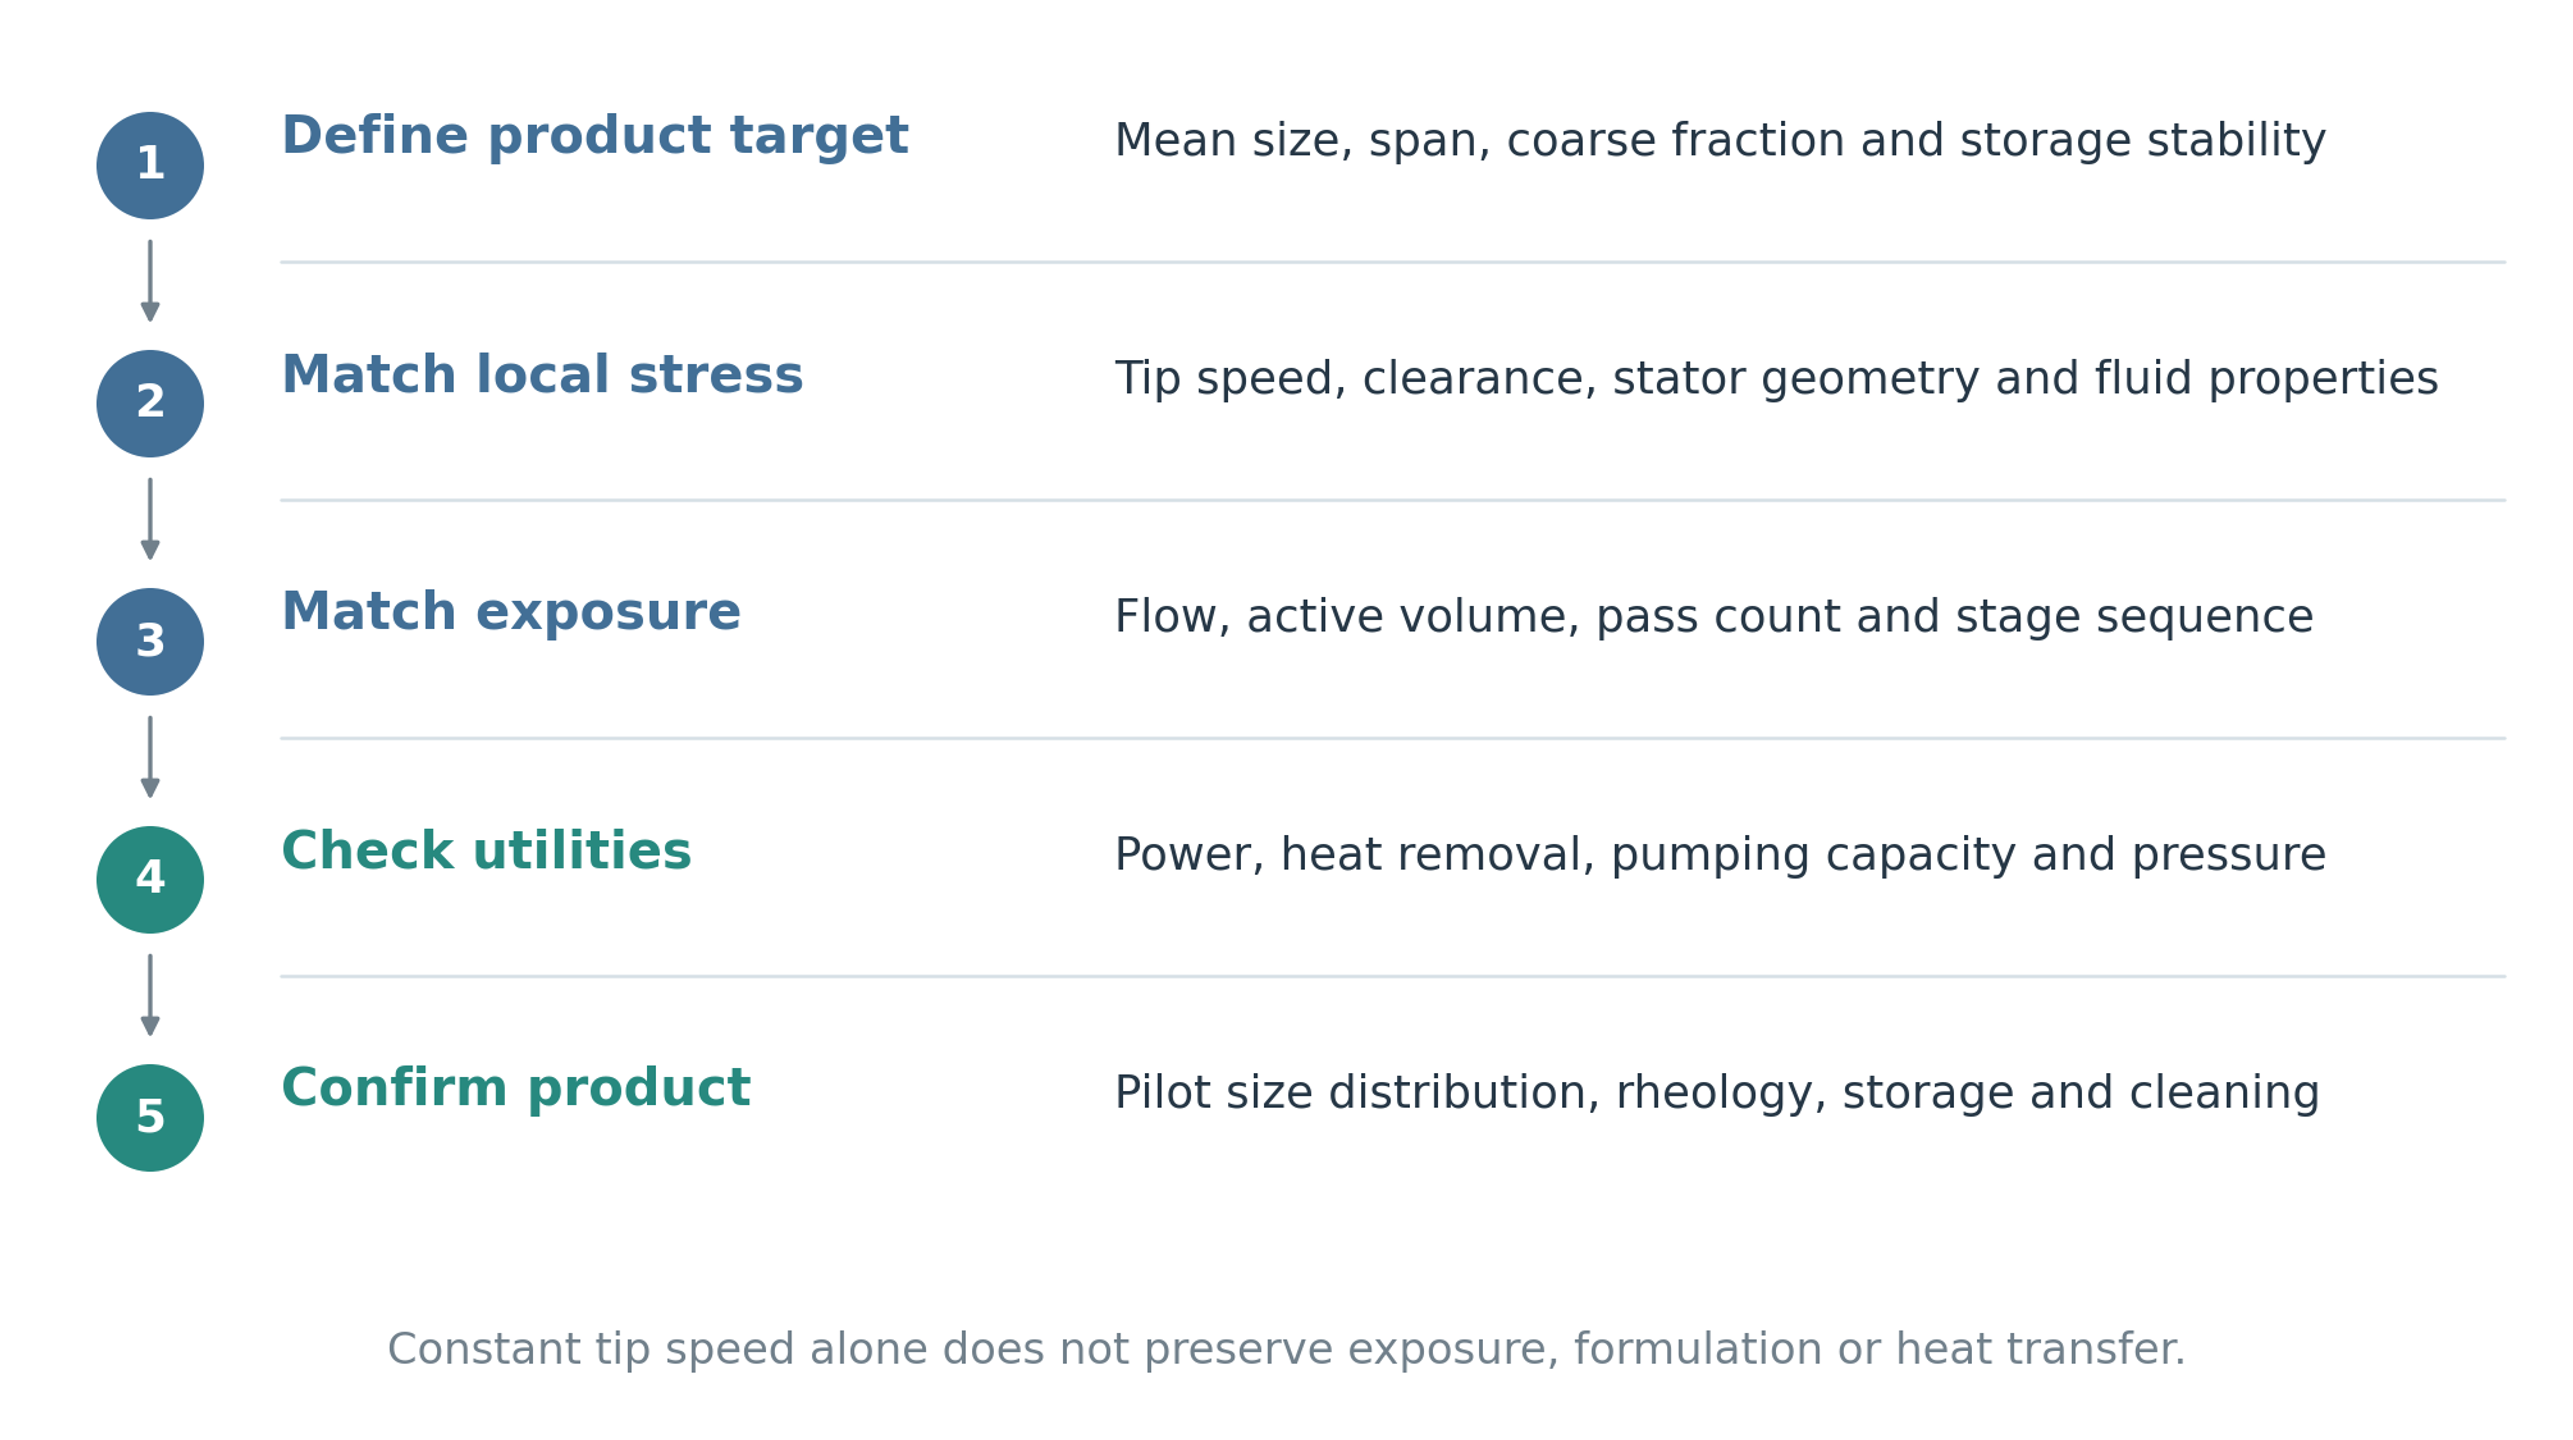
Figure 13.1. A sequence for transferring an emulsification process to a larger scale. Product specifications, local stress, exposure, utilities, and validation must be considered together; matching tip speed alone is insufficient.
13.2 Common scale up criteria
Several scale up criteria are useful as controlled comparisons, provided their physical meaning and limitations are stated. Constant tip speed maintains a characteristic peripheral velocity and requires
which gives the corresponding speed relation
Maintaining the rotor Reynolds number instead requires
and, for unchanged density and viscosity, gives
For the same definition of processed material inventory, constant power per unit mass requires
Equality of mean active region residence time requires
Equality of the nominal velocity gradient across the radial clearance requires
These criteria cannot generally all be maintained when scale changes. For example, constant tip speed requires speed to vary inversely with diameter, whereas constant Reynolds number requires an inverse square dependence for unchanged fluid properties. The relevant criterion should follow from the breakup regime and validated process response. Hall obtained useful mean size scaling with tip speed at comparable residence time, but the influence of open area and other geometric differences remained significant [3]. The coarse fraction and subsequent stability require separate validation.
13.3 Scale out and modular operation
Parallel operation provides an alternative when increasing the size of a single head would create excessive torque, tip speed, or manufacturing difficulty. Several units can retain a previously validated geometry and provide flexibility in capacity and maintenance. This approach transfers part of the engineering problem to the manifold: flow, pressure, temperature, and feed composition must be distributed consistently. Unequal branches can create a broad or bimodal combined product even when each head performs adequately under its own conditions.
13.4 Pilot validation matrix
Pilot validation should determine the operating region in which both size reduction and stabilization are reproducible. The experimental factors should include rotor speed, flow or processing time, stator geometry, phase fraction, emulsifier concentration, temperature, and a defined gas condition. The responses should include , , span, net power, temperature, viscosity, and storage behavior. Recording these variables together allows an apparent improvement in mean size to be assessed against its energy, thermal, and stability consequences.
The experimental domain should also reflect the fluids used to establish a correlation. For example, Campardelli and coauthors evaluated paraffin, soybean oil, and isopropyl myristate in oil in water emulsions at different phase ratios and rotor speeds. Such controlled variation allows fluid property and operating effects to be separated more clearly than a single formulation trial. Applying the fitted relationship to another geometry or formulation still requires verification [4].
Table 13.1. Minimum pilot matrix for a new rotor stator emulsion.
| Factor | Suggested levels | Primary response | Secondary response |
|---|---|---|---|
| Rotor speed | Low, center, high within mechanical limit | DSD and coarse tail | Power, heat, air ingestion |
| Flow or residence | At least three levels | Capacity and DSD | Pressure loss and exposure distribution |
| Stator geometry | Coarse, intermediate, fine | DSD and throughput | Fouling and cleaning |
| Phase fraction | Minimum, nominal, maximum | DSD and rheology | Inversion and pumpability |
| Emulsifier level | Below, near, above expected coverage | Recoalescence and storage | Cost and sensory constraints |
| Temperature | Low, nominal, maximum allowed | Viscosity and DSD | Degradation and vapor pressure |
| Pass number | 1, 2, 3, 5, endpoint value | Diminishing return curve | Oxidation and heat |
| Gas condition | As received and controlled degassed state | Reproducibility and foam | Cavitation and oxidation |
13.5 Statistical and uncertainty considerations
Quantitative comparison requires separation of true process effects from sampling and measurement variability. Replicate runs capture variation in premix preparation, temperature, hydrodynamic exposure, and analysis. Regression or response surface is valid only over the investigated region unless its transfer is independently demonstrated. Extrapolation across viscosity, composition, geometry, or scale can otherwise produce a precise numerical prediction with little physical support.
For a calculated result y = f(x₁, x₂, …, xₙ), the first order propagation of uncorrelated input uncertainties is
where and denote standard uncertainties in the result and input quantities, respectively. Correlated inputs require covariance terms that are not included in this simplified expression.
Uncertainty should include droplet measurement repeatability, sample location, dilution, refractive index assumptions, and instrument operating conditions. Model parameters and estimated circulation rates can contribute additional uncertainty. A claimed scale effect should be evaluated relative to the combined uncertainty rather than inferred solely from a small difference between fitted means.
14 Engineering design workflow
Process design integrates the formulation, hydrodynamic model, equipment, and acceptance measurements into a reproducible sequence. The starting point is the required product function and distribution; these requirements determine the properties that must be measured and the equipment conditions that must be tested. The following workflow organizes the transition from laboratory screening to production validation and provides a common basis for recording design decisions.
1. Define the product specification. State the topology, dispersed phase fraction, , coarse fraction, distribution span, rheology, stability period, thermal limits, chemical requirements, microbial requirements, and allowable air content.
2. Characterize both phases. Measure density and viscosity across the relevant temperatures and deformation rates, interfacial tension as a function of surface age, and dispersed phase solubility. Include vapor pressure when pressure reduction or volatile components are relevant.
3. Establish the formulation. Specify emulsifier identity, concentration, phase location, hydration, and preparation method. Evaluate whether sufficient active material can reach the interfacial area required at the target diameter.
4. Prepare a reproducible premix. Control the addition sequence, feed rate, temperature, and initial droplet distribution. Confirm that the premix remains suitable for processing during the interval before it reaches the active region.
5. Select the process architecture. Compare immersed batch, continuous inline, recirculating, and multistage arrangements against throughput, viscosity, heat removal, containment, and the required distribution of exposure.
6. Screen the generator geometry. Include representative coarse and fine arrangements, and record rotor diameter, clearance, opening dimensions, open area, and the number and sequence of stages.
7. Determine the operating window. Vary speed, flow or processing time, temperature, and pass number while measuring power, thermal history, and the complete product response.
8. Establish the endpoint. Select an operating condition that meets all quality and stability requirements with an acceptable energy demand and appropriate allowance for process and measurement variability.
9. Transfer the process using validated mechanisms. Preserve the variables shown to control the product and verify the resulting residence and circulation distributions, as well as tip speed and energy input.
10. Validate sustained operation and cleaning. Use the intended production materials, seals, pipework, heat exchange, cleaning conditions, and instrumentation to confirm reproducibility and reliability.
Table 14.1. Design data sheet for rotor stator emulsification.
| Category | Required input | Unit or description | Why it is needed |
|---|---|---|---|
| Product | Topology and phase fraction | O/W, W/O, multiple; volume fraction | Determines formulation and inversion risk |
| Product | Target , , span | µm or nm | Defines breakup and coarse tail requirement |
| Stability | Shelf life and stress tests | Time and temperature | Defines stabilization requirement |
| Fluids | Density and viscosity | kg m⁻³, Pa s | Sets Reynolds, creaming, power, pumping |
| Interface | Dynamic and equilibrium tension | N m⁻¹ versus time | Sets capillary resistance and adsorption rate |
| Equipment | Rotor diameter, gap, openings | m, count, open area | Defines velocity, frequency, and hydraulic resistance |
| Operation | Speed, flow, passes, temperature | s⁻¹, m³ s⁻¹, count, K | Defines stress and exposure |
| Energy | Torque, power, pressure, heat | N m, W, Pa, W | Defines utility and thermal requirement |
| Measurement | DSD method and sampling plan | Instrument and protocol | Defines comparability and uncertainty |
| Mechanical | Materials, seals, tolerances | Specification | Defines wear, hygiene, and reliability |
15 Worked engineering example
15.1 Design basis
The following calculation illustrates how interfacial area, emulsifier coverage, pass requirement, energy, and temperature can be evaluated on one consistent basis. The values are an assumed engineering design case and do not represent a new experimental dataset. A 1,000 L oil in water batch contains 20 percent dispersed oil by volume. Its initial Sauter mean diameter is ,0 = 50 µm, and the target is ,f = 5 µm with ≤ 12 µm. The assumed density is 980 kg m⁻³, heat capacity is 3.8 kJ kg⁻¹ K⁻¹, and maximum permissible temperature rise is 8 K. Dynamic interfacial tension at the relevant surface age is 10 mN m⁻¹, and effective interfacial coverage requires 2 mg m⁻² of emulsifier. The estimated flow through the batch head is 0.035 m³ s⁻¹ and net shaft power is 30 kW. For illustration, the empirical pass model in equation (7.7) is assigned = 4.2 µm and = 0.95.
The batch volume expressed in SI units is
and the dispersed phase volume is
The initial droplet distribution corresponds to an interfacial area of
At the target Sauter mean diameter, the required area becomes
The increase in interfacial area is
With the assumed effective coverage of 2 mg m⁻², the adsorbed mass required on the final interface is
Assuming that 40 percent of the added formulation is effectively available for adsorption and applying a coverage allowance of 25 percent, the screened total formulation dose is
This is a total dose on the stated availability basis. When emulsifier is already present in the premix, its effective contribution must be subtracted before an additional quantity is specified. The calculation does not establish that the resulting adsorption rate is sufficient during droplet breakup.
15.2 Pass requirement and processing time
The empirical pass model translates the size target into a mean cumulative exposure requirement. Solving equation (7.7) for the number of equivalent passes required to reach 5 µm gives
With the assumed constant circulation through the head, the corresponding ideal processing time is
which is approximately 2.0 min. Here, denotes equivalent pass number; it should not be confused with the rotor frequency used elsewhere in the article.
The predicted endpoint is a screening value because individual fluid elements receive different exposure in a batch. Samples at approximately 90, 120, 150, and 180 s would bracket the calculated endpoint and permit evaluation of , , span, and stability. The pass model predicts the selected mean size; it does not establish compliance with the requirement or guarantee that every part of the batch has passed through the head.
15.3 Energy and heat balance
The energy calculation uses the same processing interval as the droplet calculation so that product performance can be related to its energy and thermal demand. The estimated batch mass is
At the rounded processing time of 122 s, the accumulated net specific energy is
The corresponding adiabatic temperature increase is
when the specific energy and heat capacity are expressed consistently in kJ kg⁻¹ and kJ kg⁻¹ K⁻¹.
Under these assumptions, the calculated temperature rise is below the specified 8 K limit. The result excludes additional energy from auxiliary pumping or other sources and increases if processing continues beyond the assumed endpoint. Continuous temperature measurement remains necessary because the actual circulation, power, and heat transfer may differ from the design estimates.
Using the assumed constant interfacial tension, the increase in interfacial free energy is
The calculated net mechanical input over the same interval is 3.66 × 10⁶ J. The apparent interfacial energy efficiency is therefore
or approximately 0.059 percent.
This small ratio is consistent with most mechanical input being dissipated outside the final interfacial free energy increase. It demonstrates why theoretical surface work alone cannot be used to select a motor or compare process productivity. The practical comparison should use measured specific energy at a common product specification, together with throughput and stability.
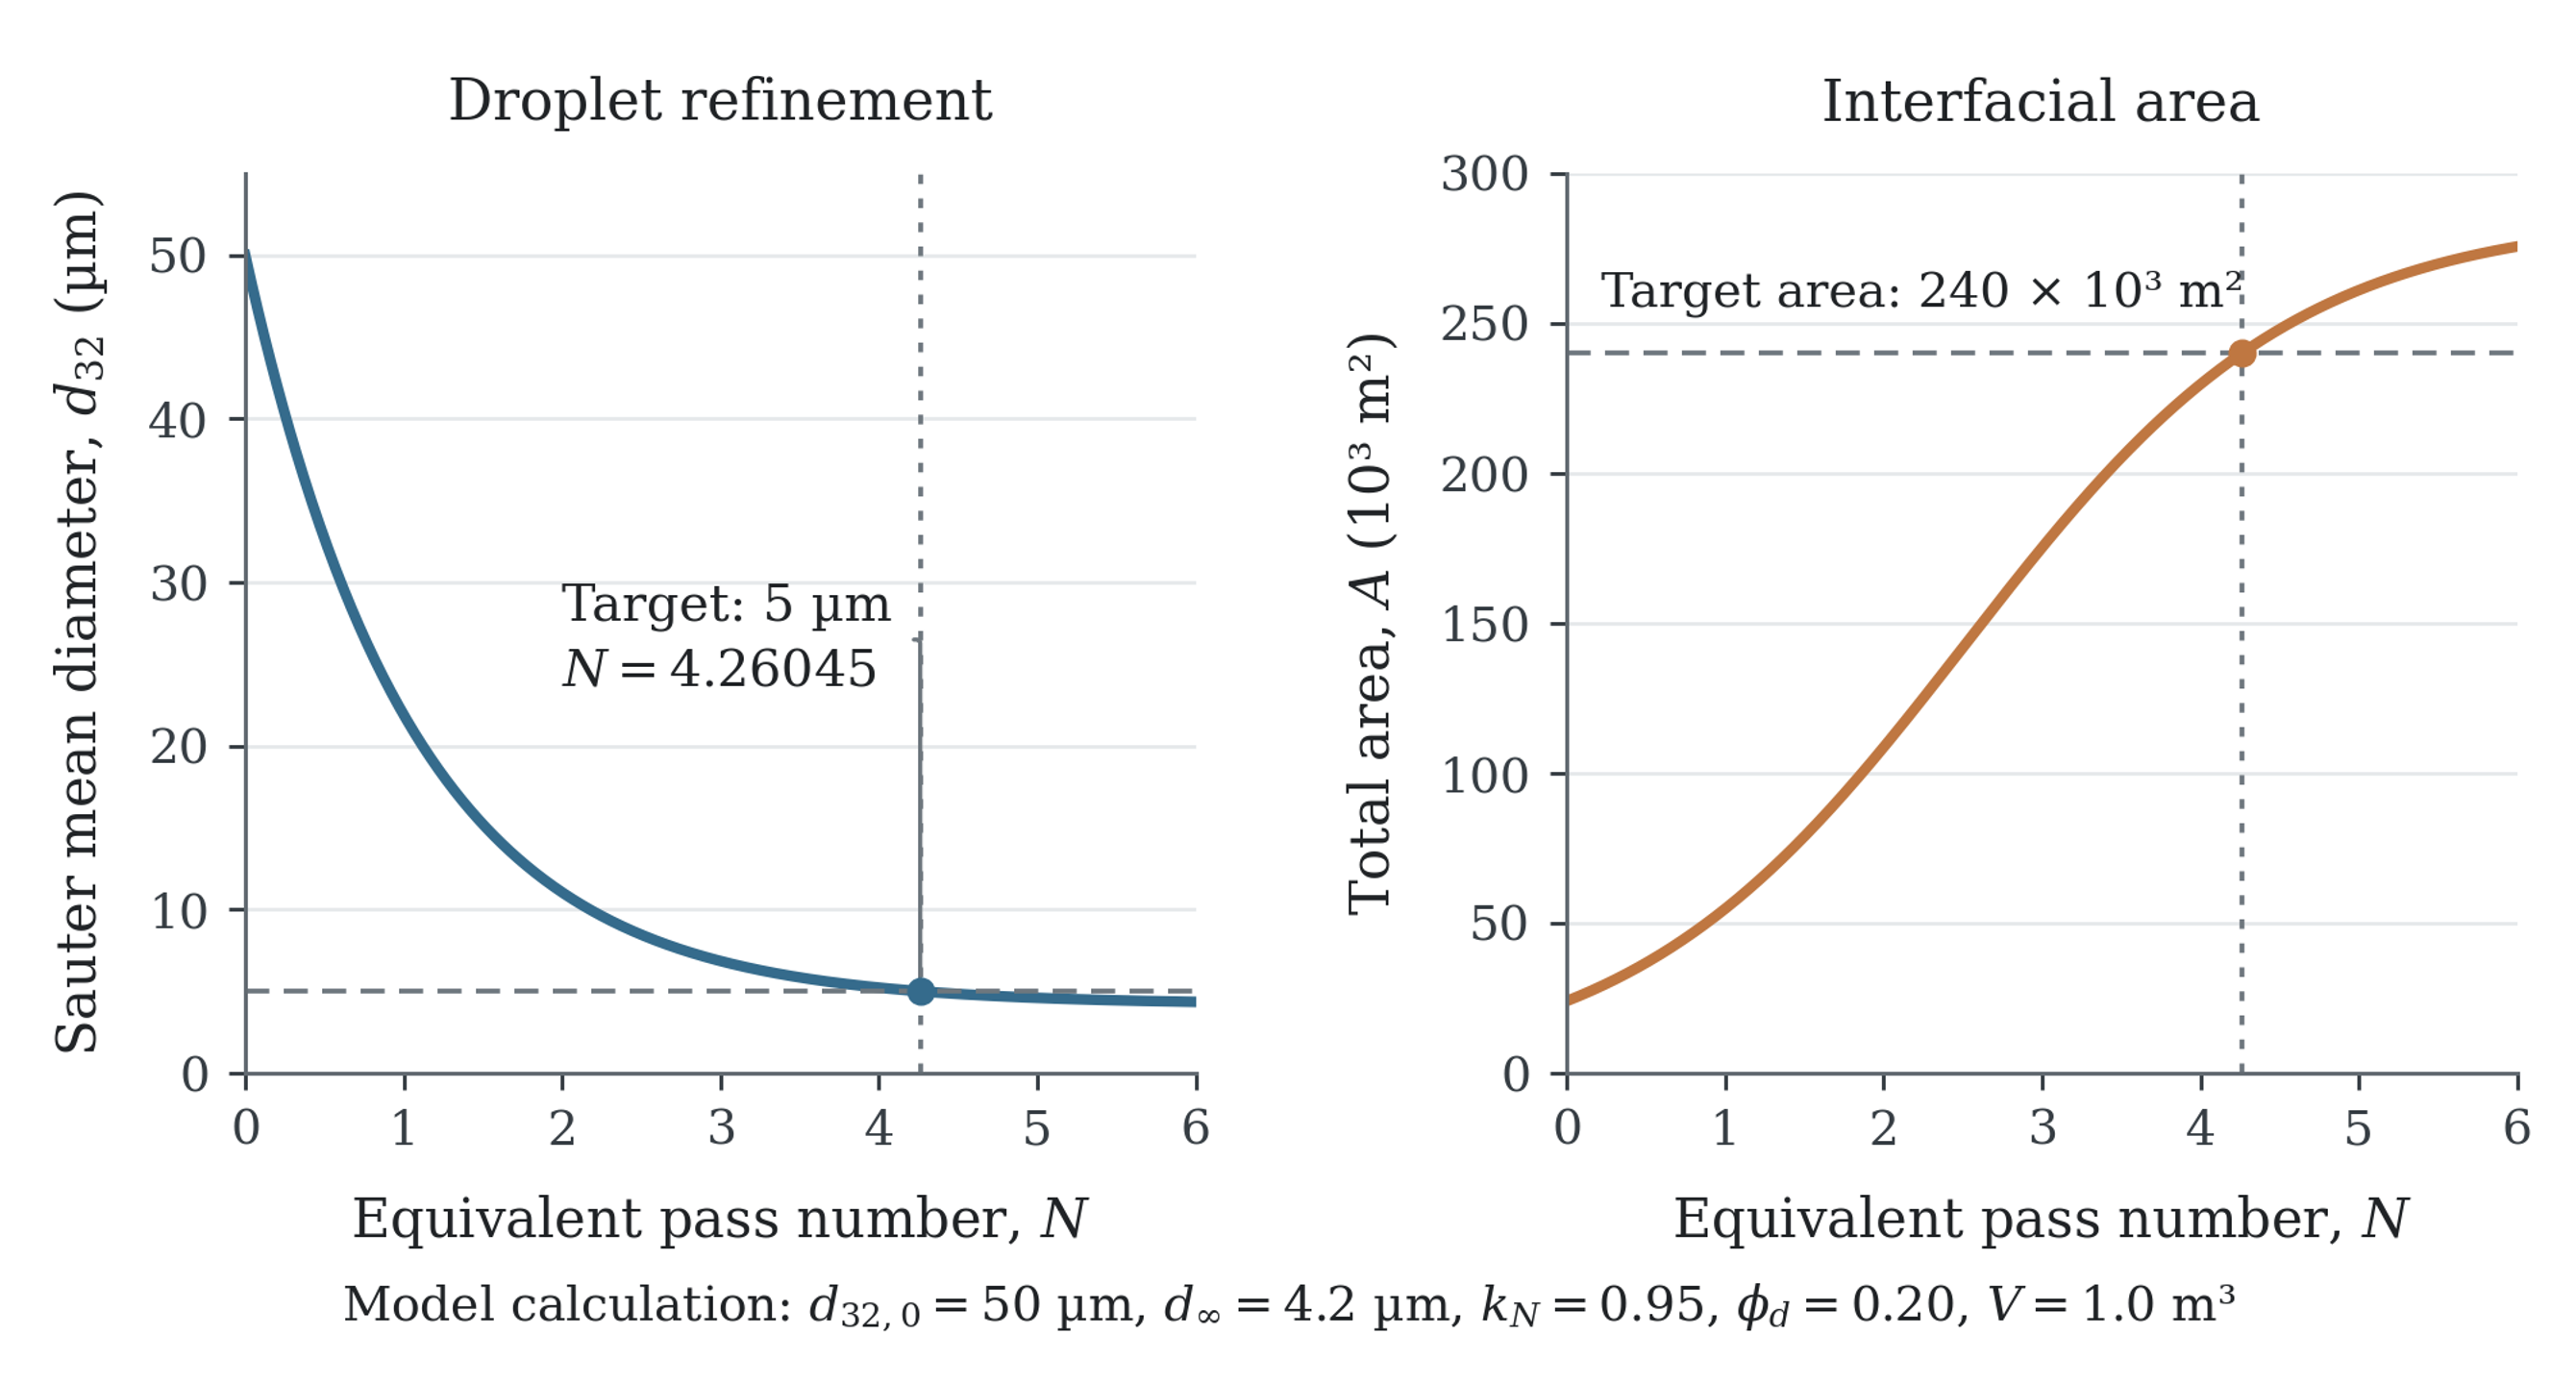
Figure 15.1. Calculated droplet diameter and total interfacial area for the assumed design basis in Section 15. The curves follow equations (7.7) and (2.8), with an initial diameter of 50 µm, an asymptote of 4.2 µm, and a pass coefficient of 0.95. The 5 µm target is reached at approximately 4.26 equivalent passes, when the total interface is 2.40 × 10⁵ m².
Table 15.1. Worked example summary and verification requirements.
| Item | Calculated value | Design interpretation | Verification |
|---|---|---|---|
| Initial interfacial area | 24,000 m² | Coarse premix | Confirm premix |
| Target interfacial area | 240,000 m² | Tenfold increase | Confirm final and topology |
| Ideal adsorbed emulsifier | 0.48 kg | Surface coverage only | Measure stability and free emulsifier |
| Screened formulation dose | 1.50 kg | Includes adsorption efficiency and reserve | Optimize by formulation trials |
| Equivalent passes | 4.26 | Mean model prediction | Sample around endpoint |
| Ideal time | 122 s | Based on 0.035 m³ s⁻¹ head flow | Verify circulation with tracer or manufacturer data |
| Specific energy | 3.73 kJ kg⁻¹ | Reasonable pilot endpoint | Measure net torque or power |
| Adiabatic rise | 0.98 K | Below 8 K limit | Record actual thermal history |
| Apparent interfacial efficiency | 0.059% | Most energy dissipates elsewhere | Compare only on common formulation basis |
16 Measurement, sampling, and validation
Reliable experimental evidence depends on a defined relationship between the process, the collected sample, and the reported measurement. Droplet size, topology, power, and temperature should be measured on a consistent basis so that apparent processing effects can be distinguished from analytical artifacts. The procedures below specify the information needed for reproducible comparison and for validation of the illustrative calculation.
16.1 Droplet size measurement
A measurement strategy must distinguish the droplet population from aggregates, entrained bubbles, and sampling artifacts. Laser diffraction provides volume sensitive distributions over a broad range of droplet sizes. Dynamic light scattering is useful for sufficiently dilute submicron dispersions, but the scattering response can be strongly influenced by a small population of larger objects. Microscopy reveals topology, flocculation, shape, and coarse droplets, although its field of view and resolution limit representativeness. Validated image analysis can provide a number based distribution. Complementary methods are therefore preferable when the product contains several structural scales.
The refractive index, absorption assumptions, inversion or dispersion model, obscuration, dilution medium, sonication, and sample handling should be documented. Dilution can change ionic strength or emulsifier availability, disrupt flocs, and induce osmotic transport. A qualified protocol should distinguish intentionally coarse and fine samples without creating the change it is intended to measure.
16.2 Sampling location and time
Sampling defines which part of the process is actually represented by a reported distribution. A sample from the vessel surface may differ from the discharge of the active head. Batch samples should be collected from a reproducible location and after a specified circulation interval. Inline sample lines should have minimal stagnant volume and be flushed before collection. Prompt analysis followed by analysis after a defined rest interval helps separate the immediate breakup result from subsequent aggregation or coalescence.
For a specified diameter statistic, an empirical homogenization efficiency can be expressed as
where and df are the initial and final values of the same diameter statistic and is its fitted limiting value.
This index provides convenient normalization within the fitted model, but it does not replace the coarse fraction or stability measurements. A high value can coexist with unacceptable large droplets. The value of the fitted limiting diameter and the conditions over which it was obtained should be reported.
16.3 Power, torque, flow, and pressure measurement
Hydrodynamic and energy comparisons require measurements of actual operating conditions. Shaft torque and rotational speed provide a direct estimate of shaft power; calibrated electrical measurements require corrections for drive and motor efficiency. The baseline must be evaluated at comparable speed and thermal conditions using a method compatible with the equipment. Inline trials should record flow, upstream and downstream pressures, and product temperature. Time resolved pressure measurements are particularly useful when periodic forcing or cavitation is part of the proposed mechanism.
16.4 Experimental acceptance criteria
Acceptance criteria should describe reproducible product and process performance. An illustrative qualification plan may require several consecutive batches, or an appropriate period of continuous operation, to meet limits for droplet distribution, temperature, power, and storage stability. The number of replicates and observation period should be chosen from the process variability and intended use. Process capability should be assessed only after the measurement procedure, and operating conditions have been demonstrated to be stable.
Table 16.1. Recommended reporting set for rotor stator emulsification studies.
| Category | Minimum reported information |
|---|---|
| Formulation | Identity and mass or volume fraction of all phases and emulsifiers |
| Fluid properties | Density, viscosity, interfacial tension, temperature, and measurement methods |
| Mixer geometry | Rotor diameter, stator type, gap, open area, slot or hole size, number of stages |
| Operation | Speed, tip speed, flow, processing time, passes, feed order, temperature, backpressure |
| Energy | Net power, torque method, specific energy, pressure loss, cooling duty |
| Product | , , or , span, rheology, topology, stability |
| Sampling | Location, time, dilution, storage before measurement |
| Statistics | Replicates, uncertainty, fitting range, and excluded data |
| Mechanical | Wear state, generator condition, seal arrangement, cleaning state |
17 Troubleshooting, hygiene, reliability, and safety
Long term process performance depends on the condition of the equipment as well as the selected formulation and operating point. Product defects, loss of cleaning effectiveness, and mechanical deterioration can produce similar changes in power or droplet size. Diagnosis should therefore combine product measurements with flow, temperature, pressure, vibration, and inspection records before corrective action is chosen.
17.1 Troubleshooting logic
Troubleshooting is most effective when the time at which the defect appears is established first. A product that is coarse immediately after processing suggests inadequate stress or exposure, excessive interfacial resistance, or a damaged generator. A satisfactory initial distribution that becomes coarse during storage suggests instability or a measurement artifact. A broad distribution can also arise from bypass, poor bulk circulation, intermittent feeding, or unequal parallel streams. Foam and unstable power provide additional evidence of air ingress. The diagnosis should be confirmed by measurements before an operating change is selected.
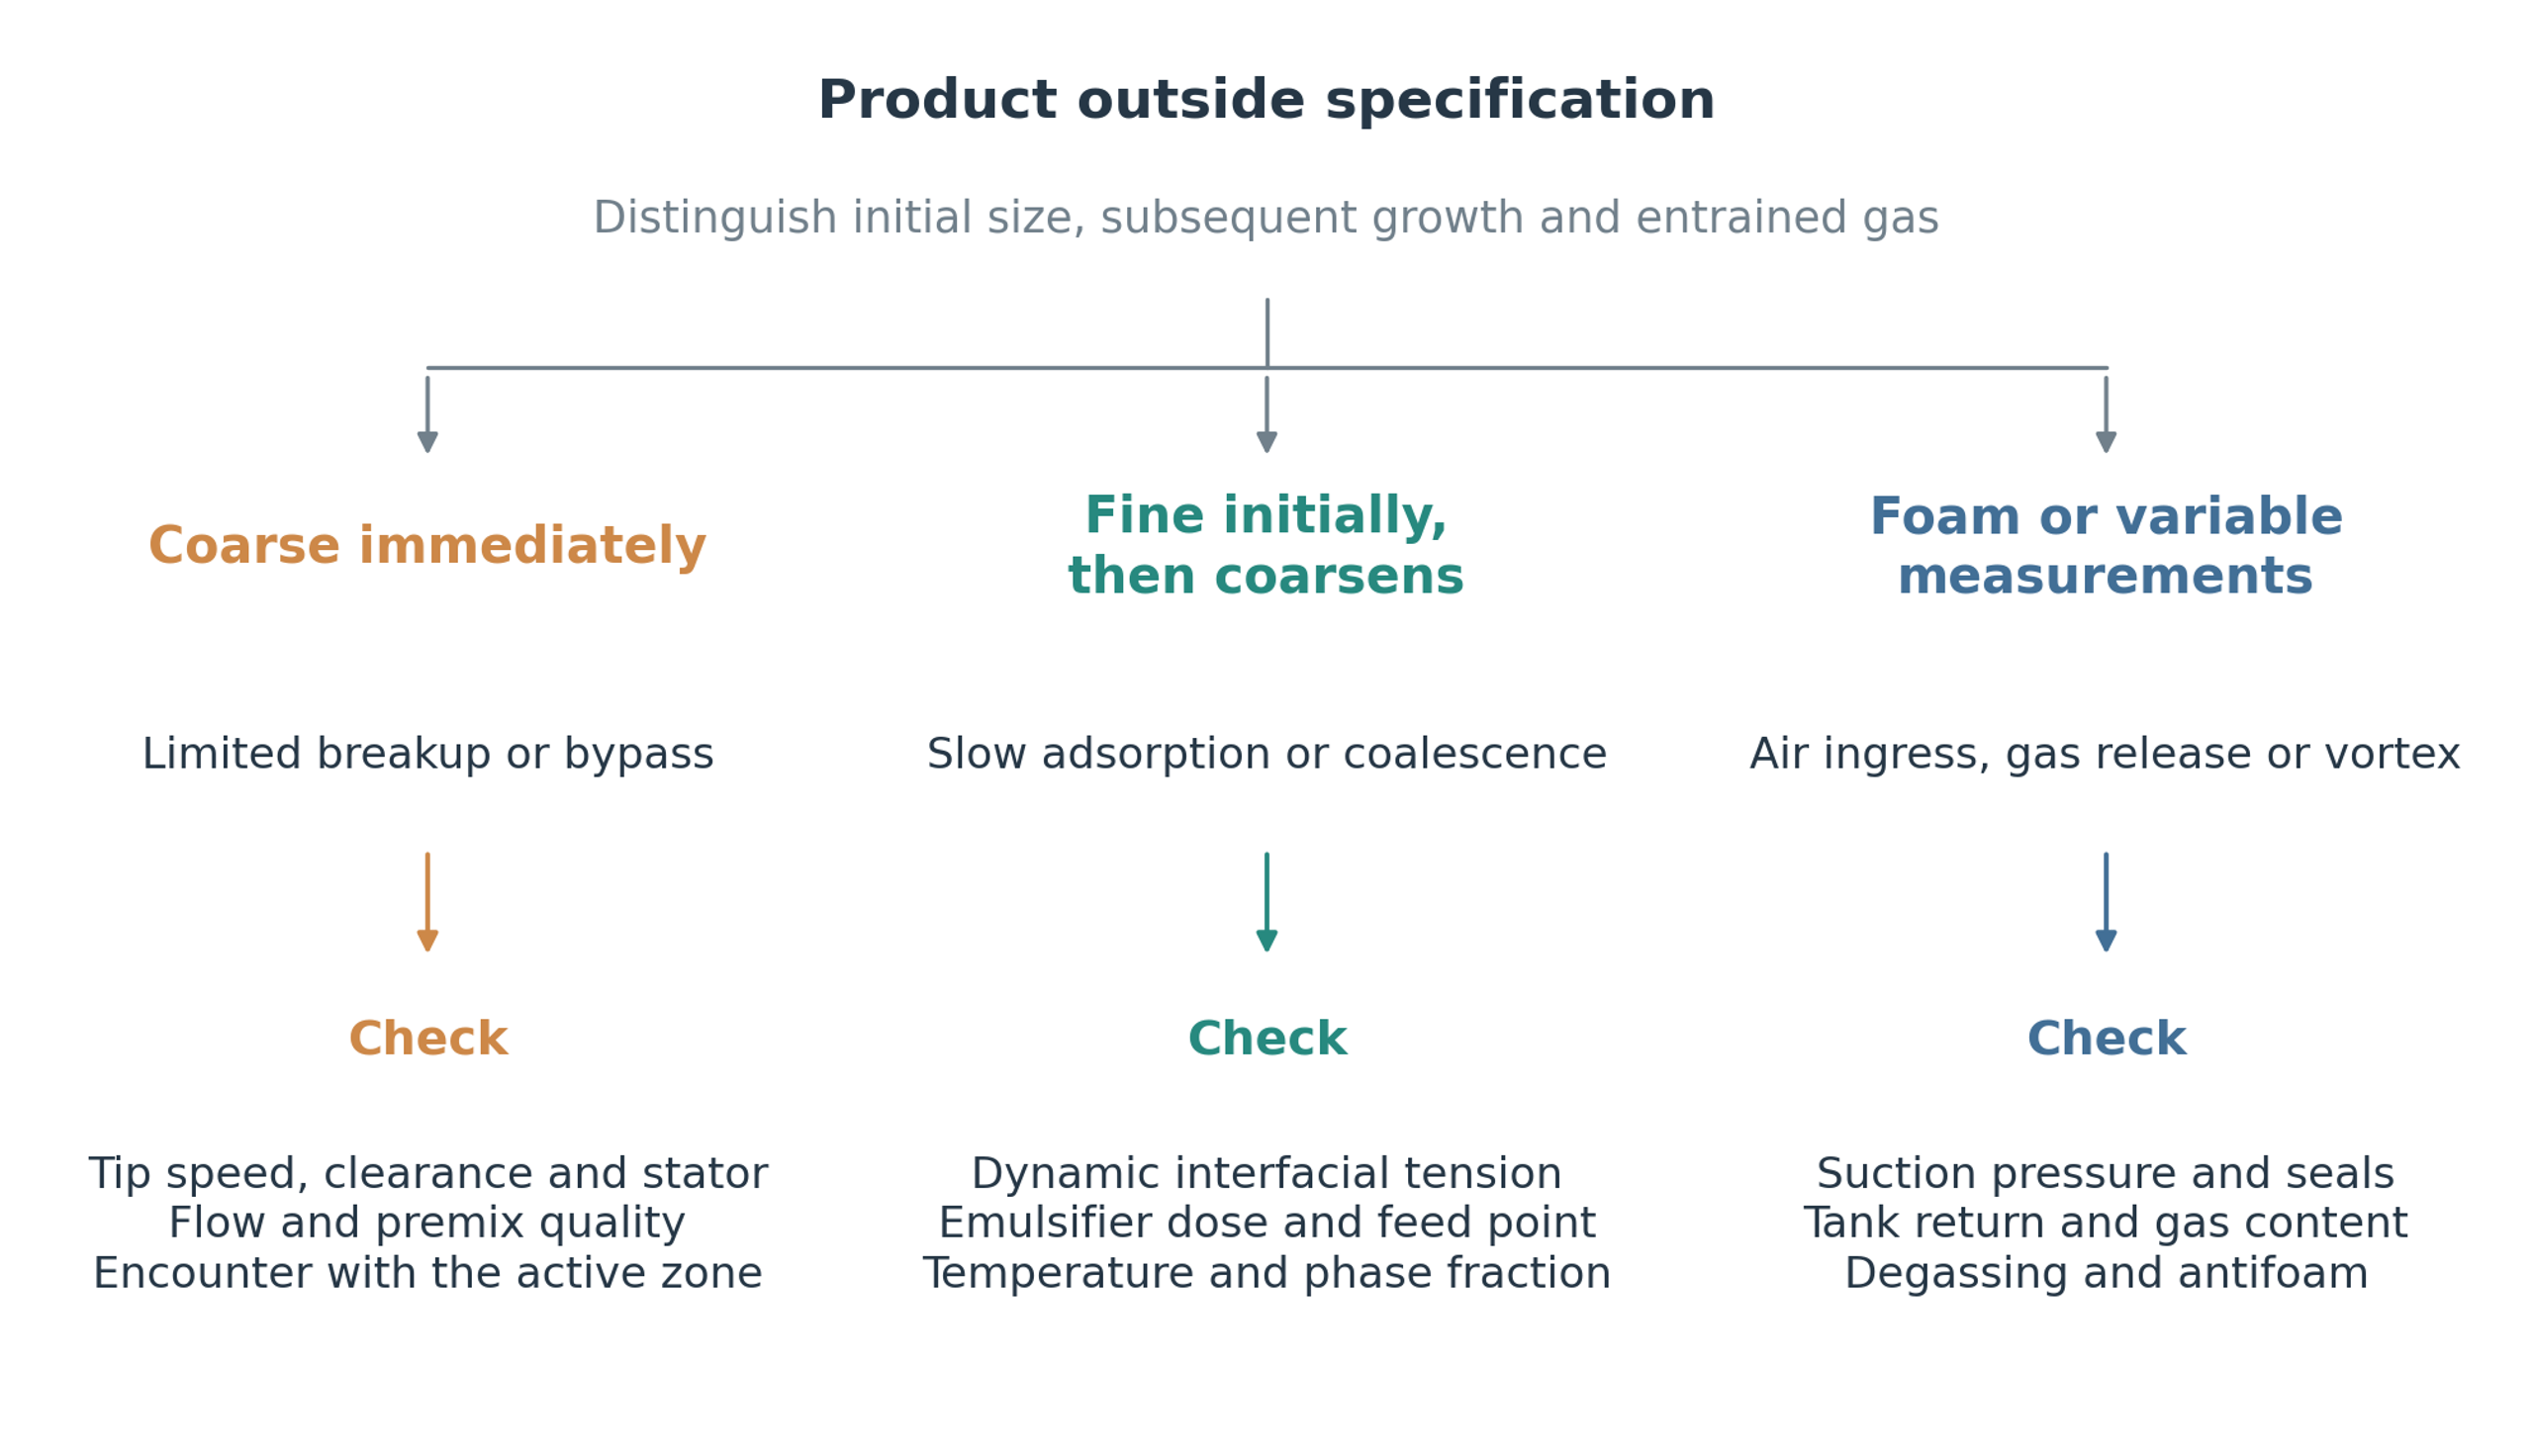
Figure 17.1. Diagnostic sequence for an emulsion that is coarse, unstable, or affected by entrained gas. Immediate size, subsequent growth, and variability guide separate investigations of mechanical exposure, interfacial stabilization, and air incorporation.
Table 17.1. Common failure modes and corrective actions.
| Observation | Probable cause | Diagnostic check | Corrective action |
|---|---|---|---|
| and both coarse | Stress or exposure too low | Speed, flow, gap, stator condition | Increase speed within limits, increase passes, use finer generator |
| Mean acceptable but high | Bypass or poor premix | Tank circulation, sampling, feed path | Improve bulk turnover, premix, or manifold balance |
| Size decreases then increases with time | Recoalescence or flocculation | Immediate and delayed DSD, microscopy | Increase or change emulsifier, cool, reduce collision exposure |
| Size improves then worsens at high speed | Heating, air, phase inversion, overprocessing | Temperature, power, conductivity, foam | Reduce speed, cool, control feed, deaerate |
| Excessive foam | Free surface vortex or suction leak | Submergence, seals, suction pressure | Increase submergence, eliminate leak, submerge return |
| Power rises during batch | Viscosity growth, blockage, cooling loss | Rheology, pressure, generator inspection | Add bulk agitator, clean, control temperature |
| Power falls while size worsens | Wear, gas loading, phase change | Torque baseline, stator inspection, conductivity | Replace generator, remove gas, confirm topology |
| Pressure drop drifts upward | Fouling or solids buildup | Clean water baseline, inspection | Clean, enlarge opening, improve premix filtration |
| Metallic particles | Rotor stator contact or erosion | Vibration, gap, magnetic or elemental analysis | Stop, inspect bearings and gap, replace parts |
| Poor batch repeatability | Variable premix, temperature, or addition | Batch records and raw material properties | Standardize preparation and endpoint control |
17.2 Hygienic design and cleaning
Hygienic performance depends on the complete wetted flow path, including the workhead, seals, connections, and adjacent pipework. Food, cosmetic, and pharmaceutical applications require suitable surface finish, drainability, compatible materials, and a validated cleaning procedure. Fine openings and multiple stages can retain product if cleaning flow does not reach them effectively. Cleaning conditions should therefore be defined by the required time, temperature, flow, chemistry, and verification method rather than by the mixer designation alone.
The need for disassembly depends on the generator design and the cleaning requirements. When cleaning in place is used, its effectiveness must be demonstrated for the complete assembly. Where disassembly is necessary, handling and reassembly should preserve clearance, balance, and surface finish. Cleaning agents must be compatible with the wetted metals, coatings, and sealing materials.
17.3 Mechanical reliability
Mechanical reliability establishes the range within which hydrodynamic optimization can be performed. The rotating assembly must be suitable for the maximum intended speed, temperature, density, and viscosity. Shaft dynamics, bearing life, rotor balance, seal loading, and thermal expansion require engineering assessment. Operation with an incompletely filled head can remove liquid cooling and damping. Appropriate monitoring and protective interlocks should address loss of liquid supply, excessive vibration, and temperature excursions.
Periodic rotor and pressure loads can excite structural vibration even when average torque is acceptable. Their frequency content should be considered in relation to the shaft, housing, pipework, and supports. Where cyclic excitation is substantial, fatigue and vibration assessments should accompany the process design. Flexible connections can isolate some transmitted motion, but do not resolve the underlying cause of excessive vibration.
17.4 Process safety
A process hazard assessment should consider the combined equipment and material conditions, including rotating components, retained pressure, hot product, volatile liquids, powder addition, biological material, and cleaning chemicals. Cavitation can contribute to erosion and gas release. Relief, containment, and operating limits should be established for the complete installation, including a blocked outlet, thermal expansion, pump shutoff pressure, and possible phase change. The relevant requirements depend on the actual service and installation.
18 Conclusions
Rotor-stator emulsification is governed by the interaction of hydrodynamic exposure, droplet resistance, and interfacial stabilization. Material passes through regions of intake, acceleration, clearance flow, stator discharge, and pressure recovery, each of which contributes a different deformation history. Geometry and operation determine the intensity and duration of these events. The formulation determines whether deformation produces fragmentation and whether the new droplets remain separated. A reliable process description must therefore connect droplet distribution and stability to both local stress and the distribution of exposure.
The principal conclusions are as follows.
First, a product specification should define phase topology, a surface sensitive droplet mean, the coarse fraction, and stability under relevant storage conditions. An apparently satisfactory mean diameter can coexist with a coarse tail or subsequent growth. Formulation properties, especially dynamic interfacial tension and the availability and transport of emulsifier, must therefore be considered alongside the mechanical capability of the mixer.
Second, scale up requires a comparison of local deformation and exposure history. Tip speed provides a useful operating descriptor, but stator openings, clearance, stage arrangement, throughput, and vessel circulation determine how that speed is translated into disruptive stresses and repeated encounters. A correlation should be transferred only within an experimentally established range of geometry, rheology, and interfacial conditions.
Third, the process endpoint should be identified from simultaneous measurements of product quality, net power, specific energy, and temperature. Further treatment is justified only when it produces a useful change without unacceptable heating, recoalescence, degradation, or mechanical loading. The complete process should be verified using the intended production materials, thermal control, cleaning procedure, and storage conditions.
The practical value of rotor stator equipment arises from its adaptability to vessel and pipeline operation, different rheologies, and interchangeable processing geometries. That adaptability also limits the transferability of correlations between superficially similar machines. Predictive calculations are most useful when their assumptions are stated, and their parameters are supported by measurements on the relevant formulation. The worked example demonstrates a consistent calculation sequence; product qualification still requires independent verification of the coarse fraction, stability, exposure distribution, and energy balance.
19 Nomenclature
Table 19.1. Latin symbols and abbreviations.
| Symbol | Meaning | SI unit or status |
|---|---|---|
| Interfacial area | m² | |
| , | Initial and final interfacial area | m² |
| Total open area of stator passages | m² | |
| Reference stator surface area | m² | |
| Interfacial area per unit emulsion volume | m² m⁻³ | |
| Daughter volume distribution from parent volume | m⁻³ or normalized distribution | |
| Bulk emulsifier concentration | kg m⁻³ or mol m⁻³ | |
| , | Empirical breakup constants | Dimensionless or correlation specific |
| Specific heat capacity | J kg⁻¹ K⁻¹ | |
| Droplet diameter | m | |
| Number moment mean ; distinct from the tenth volume percentile | m | |
| Sauter mean diameter | m | |
| Volume weighted mean diameter | m | |
| , , | Cumulative volume percentile diameters | m |
| Hydraulic diameter of a passage | m | |
| Rotor diameter | m | |
| Brownian diffusivity | m² s⁻¹ | |
| Adsorption Damköhler type ratio | Dimensionless | |
| Signed interfacial coefficient; = − | N m⁻¹ | |
| Coalescence efficiency | Dimensionless | |
| Specific energy per unit mass | J kg⁻¹ | |
| Energy per unit volume | J m⁻³ | |
| Blade or port passage frequency | Hz | |
| Effective opening frequency | Hz | |
| Fraction not yet processed in an ideal mixed loop | Dimensionless | |
| Gravitational acceleration | m s⁻² | |
| Breakup frequency | s⁻¹ | |
| Adsorption constant | Concentration dependent | |
| Ostwald ripening rate constant | m³ s⁻¹ | |
| Boltzmann constant | J K⁻¹ | |
| Empirical pass constant | pass⁻¹ | |
| Batch mass | kg | |
| Emulsifier mass | kg | |
| Rotor rotational frequency or equivalent pass number, as defined | s⁻¹ or dimensionless | |
| Mean head encounters | Dimensionless | |
| Equivalent passes | Dimensionless | |
| Number of droplets in class | Count or number concentration | |
| Effective opening events per revolution | Dimensionless | |
| Power | W | |
| Hydraulic power | W | |
| Net process power | W | |
| Shaft power | W | |
| Gravitational Péclet number | Dimensionless | |
| Power number | Dimensionless | |
| Vapor pressure | Pa | |
| Volumetric flow rate | m³ s⁻¹ | |
| Head circulation flow rate | m³ s⁻¹ | |
| Recirculation loop flow rate | m³ s⁻¹ | |
| Rotor Reynolds number | Dimensionless | |
| Gap Reynolds number | Dimensionless | |
| Port Reynolds number | Dimensionless | |
| Collision rate between classes and | m⁻³ s⁻¹ | |
| Torque or absolute temperature, as defined | N m or K | |
| Time | s | |
| Interface age | s | |
| Port velocity | m s⁻¹ | |
| Stokes migration velocity | m s⁻¹ | |
| Rotor tip speed | m s⁻¹ | |
| Volume | m³ | |
| Active processing volume | m³ | |
| Batch volume | m³ | |
| , | Continuous and dispersed phase volumes | m³ |
| Weber number | Dimensionless | |
| O/W | Oil in water emulsion | Abbreviation |
| W/O | Water in oil emulsion | Abbreviation |
| W/O/W | Water in oil in water multiple emulsion | Abbreviation |
| DSD | Droplet size distribution | Abbreviation |
| CMC | Critical micelle concentration | Abbreviation |
| CFD | Computational fluid dynamics | Abbreviation |
| CIP | Clean in place | Abbreviation |
Table 19.2. Greek letters and related notation.
| Symbol | Letter name | Meaning | SI unit or status |
|---|---|---|---|
| Alpha | Stator open area ratio | Dimensionless | |
| Beta | Collision kernel | m³ s⁻¹ | |
| Gamma | Surface excess | kg m⁻² or mol m⁻² | |
| Gamma infinity | Maximum surface coverage | kg m⁻² or mol m⁻² | |
| Delta | Rotor stator radial clearance | m | |
| Delta p | Pressure difference | Pa | |
| Delta p sub L | Laplace pressure | Pa | |
| Delta T | Temperature rise | K | |
| Epsilon | Local energy dissipation rate per unit mass | W kg⁻¹ | |
| Eta | Apparent interfacial energy efficiency | Dimensionless | |
| Eta | Homogenization efficiency | Dimensionless | |
| Eta | Kolmogorov length | m | |
| Theta | Available interfacial coverage ratio | Dimensionless | |
| Lambda | Dispersed to continuous phase viscosity ratio | Dimensionless | |
| , | Mu | Continuous and dispersed phase dynamic viscosity | Pa s |
| Nu | Continuous phase kinematic viscosity | m² s⁻¹ | |
| Pi | Density ratio | Dimensionless | |
| Pi | Stress duration to capillary time ratio | Dimensionless | |
| , | Rho | Continuous and dispersed phase density | kg m⁻³ |
| Sigma | Interfacial tension | N m⁻¹ | |
| Sigma sub c | Cavitation number | Dimensionless | |
| Tau | Time scale or stress, as defined | s or Pa | |
| Tau adsorption | Adsorption time scale | s | |
| Tau K | Kolmogorov time scale | s | |
| Phi | Dispersed phase volume fraction | Dimensionless | |
| Gamma dot | Shear or strain rate | s⁻¹ |
Bibliography
[1] Håkansson, A. Rotor Stator Mixers: From Batch to Continuous Mode of Operation, A Review. Processes 2018, 6, 32. https://doi.org/10.3390/pr6040032.
[2] Padron Aldana, G. A. Effect of Surfactants on Drop Size Distributions in a Batch, Rotor Stator Mixer. Ph.D. dissertation, University of Maryland, College Park, MD, USA, 2005. https://hdl.handle.net/1903/2160.
[3] Hall, S. Scale Up of Emulsification in Inline Rotor Stator Mixers. Engineering Doctorate thesis, University of Birmingham, Birmingham, United Kingdom, 2013. https://etheses.bham.ac.uk/id/eprint/4045/.
[4] Campardelli, R.; De Negri Atanasio, G.; Carotenuto, C.; Griffo, R.; Ahmed, E. N.; Corrales-González, M.; Wei, J.; Tuju, P. E.; Mazzino, A.; Pralits, J. O. Rotor Stator Emulsification in the Turbulent Inertial Regime: Experiments toward a Robust Correlation for the Droplet Size. Langmuir 2023, 39, 18518-18525. https://doi.org/10.1021/acs.langmuir.3c02868.
[5] L’Estimé, M.; Schindler, M.; Shahidzadeh, N.; Bonn, D. Droplet Size Distribution in Emulsions. Langmuir 2024, 40, 275-281. https://doi.org/10.1021/acs.langmuir.3c02463. Open preprint: arXiv:2311.09813.
[6] Gazolu-Rusanova, D.; Lesov, I.; Tcholakova, S.; Denkov, N.; Ahtchi, B. Food Grade Nanoemulsions Preparation by Rotor Stator Homogenization. Food Hydrocolloids 2020, 102, 105579. https://doi.org/10.1016/j.foodhyd.2019.105579. Open author manuscript: https://arxiv.org/abs/1912.07861.
[7] Liu, Q.; Huang, H.; Chen, H.; Lin, J.; Wang, Q. Food Grade Nanoemulsions: Preparation, Stability and Application in Encapsulation of Bioactive Compounds. Molecules 2019, 24, 4242. https://doi.org/10.3390/molecules24234242.
[8] Janssen, J.; Mayer, R. Computational Fluid Dynamics (CFD) Based Droplet Size Estimates in Emulsification Equipment. Processes 2016, 4, 50. https://doi.org/10.3390/pr4040050.
[9] Kozyuk O. Rotor Stator Mixer. [Unpublished technical manuscript and supporting data] 2026.
[10] Ayas, M.; Skocilas, J.; Jirout, T. Analysis of Power Input of an Inline Rotor Stator Mixer for Viscoplastic Fluids. Processes 2020, 8, 916. https://doi.org/10.3390/pr8080916.
[11] Silverson Machines. High Shear In-Line Mixers. Manufacturer technical documentation. https://www.silverson.com/us/products/in-line-mixers/ (accessed 21 October 2026).
[12] IKA Werke GmbH & Co. KG. DISPAX-REACTOR DR. Manufacturer technical documentation. https://www.ikaprocess.nl/en/Products/Inline-dispersers-mills-dispersing-machine-high-shear-cph-6/DISPAX-REACTOR-DR-csb-DR/
[13] Промтов, М. А. Пульсационные аппараты роторного типа: теория и практика [Rotary Pulsation Apparatus: Theory and Practice]. Машиностроение 1: Moscow, 2001; 260 p. https://dn.tstu.ru/index.php/science-schools/167-science/participants/1423-promtov-ma.
[14] Промтов, М. А.; Степанов, А. Ю.; Алешин, А. В. Методы расчета характеристик роторного импульсного аппарата [Methods for Calculating Characteristics of a Rotary Impulse Apparatus]. Тамбовский государственный технический университет: Tambov, 2015; 148 p. https://tstu.ru/book/elib/pdf/2015/promtov-t.pdf.
[15] Долинский, А. А.; Иваницкий, Г. К. Тепломассообмен и гидродинамика в парожидкостных дисперсных средах. Теплофизические основы дискретно импульсного ввода энергии [Heat and Mass Transfer and Hydrodynamics in Vapor Liquid Dispersed Media]. Наукова думка: Kyiv, 2008; 381 p. https://ittf.kiev.ua/wp-content/uploads/2026/02/dolinskij-ivanickij.pdf.
[16] Самойчук, К. О.; Івженко, А. О. Методика розрахунку пульсаційного гомогенізатора з вібруючим ротором [Calculation Method for a Pulsation Homogenizer with a Vibrating Rotor]. Збірник наукових праць Вінницького національного аграрного університету. Технічні науки 2015, 1(89), Part 2, 133-138. https://www.tsatu.edu.ua/ophv/people/samojchuk-kyrylo-olehov/.
[17] Deynichenko, G.; Samoichuk, K.; Yudina, T.; Levchenko, L.; Palianychka, N.; Verkholantseva, V.; Dmytrevskyi, D.; Chervonyi, V. Parameter Optimization of Milk Pulsation Homogenizer. Journal of Hygienic Engineering and Design 2018, 24, 63-67. https://elar.tsatu.edu.ua/bitstreams/e45467d8-7ecc-463a-abaf-bc0aab6e6c2a/download.
[18] Filippov, I. A.; Frolov, V. I.; Vasiliev, V. D.; Shkrebtiienko, N. E. Rotor Pulsation Apparatus. Russian Patent RU 2124935 C1, 20 January 1999. https://patents.google.com/patent/RU2124935C1/en.
[19] Hebishy, E.; Buffa, M.; Guamis, B.; Blasco Moreno, A.; Trujillo, A. J. Characterization of Whey Protein Oil in Water Emulsions with Different Oil Concentrations Stabilized by Ultra High Pressure Homogenization. Processes 2017, 5, 6. https://doi.org/10.3390/pr5010006.
[20] Bai, L.; McClements, D. J. Extending Emulsion Functionality: Post Homogenization Modification of Droplet Properties. Processes 2016, 4, 17. https://doi.org/10.3390/pr4020017.
[21] Bosch, E. T.; Langhorn, K. D.; Cohen, D. M. High Shear Rotors and Stators for Mixers and Emulsifiers. United States Patent US 6,241,472 B1, 5 June 2001. https://patents.google.com/patent/US6241472B1/en.
[22] Uesugi, M.; Tsunofuri, M.; Nagano, J.; Mizobuchi, S. Rotor Stator Type Homogenizer. United States Patent US 6,869,212 B2, 22 March 2005. https://patents.google.com/patent/US6869212B2/en.
[23] Kinematica AG. Pilot Plant and Production: Homogenizing and Dispersing Technology. Manufacturer brochure, June 2024. https://kinematica.ch/wp-content/uploads/2025/pdf/download/brochure/PPP_06-2024_EN_V01.pdf (accessed 21 October 2026).
[24] Håkansson, A. Estimating Breakup Frequencies in Industrial Emulsification Devices: The Challenge of Inferring Local Frequencies from Global Methods. Processes 2021, 9, 645. https://doi.org/10.3390/pr9040645.
[25] Håkansson, A. The Role of Stochastic Time Variations in Turbulent Stresses When Predicting Drop Breakup: A Review of Modelling Approaches. Processes 2021, 9, 1904. https://doi.org/10.3390/pr9111904.
[26] Håkansson, A. Towards a Standard Method for Estimating Fragmentation Rates in Emulsification Experiments. Processes 2021, 9, 2242. https://doi.org/10.3390/pr9122242.
[27] Håkansson, A.; Olad, P.; Innings, F. Identification and Mapping of Three Distinct Breakup Morphologies in the Turbulent Inertial Regime of Emulsification: Effect of Weber Number and Viscosity Ratio. Processes 2022, 10, 2204. https://doi.org/10.3390/pr10112204.
[28] Ashar, M.; Arlov, D.; Carlsson, F.; Innings, F.; Andersson, R. Single droplet breakup in a rotor stator mixer. Chemical Engineering Science 2018, 181, 186-198. https://doi.org/10.1016/j.ces.2018.02.021.
[29] Mortensen, H. H.; Innings, F.; Håkansson, A. The effect of stator design on flowrate and velocity fields in a rotor stator mixer. An experimental investigation. Chemical Engineering Research and Design 2017, 121, 245-254. https://doi.org/10.1016/j.cherd.2017.03.016.
[30] Rink, R.; Shestakov, S. D.; Smeshek, E. Y. Rotary Cavitation Disintegrator of Fluid Media. Russian Patent RU 2469778 C9, 10 April 2013. https://patents.google.com/patent/RU2469778C9/en.
[31] Maradiaga Rivas, J. E.; Chen, L.-J.; Lin, S.-Y.; Hussain, S. A Study on the Dilational Modulus Measurement of Polyacrylic Acid Films at Air Water Interface by Pendant Bubble Tensiometry. Polymers 2024, 16, 1359. https://doi.org/10.3390/polym16101359.
[32] Kovalchuk, V. I.; Aksenenko, E. V.; Makievski, A. V.; Fainerman, V. B.; Miller, R. Dilational interfacial rheology of tridecyl dimethyl phosphine oxide adsorption layers at the water/hexane interface. Journal of Colloid and Interface Science 2019, 539, 30-37. https://doi.org/10.1016/j.jcis.2018.12.019.
[33] Espinoza, C. J. U.; Simmons, M. J. H.; Alberini, F.; Mihailova, O.; Rothman, D.; Kowalski, A. J. Flow studies in an in-line Silverson 150/250 high shear mixer using PIV. Chemical Engineering Research and Design 2018, 132, 989-1004. https://doi.org/10.1016/j.cherd.2018.01.028.
[34] Paterson, J. A. Rotors and Stators for Mixers and Emulsifiers. United States Patent US 6000840 A, 14 December 1999. https://patents.google.com/patent/US6000840A/en.
[35] Ekstrom, D. R.; Ekstrom, M. L.; Bennett, R. P. In Line Homogenizer Using Rotors and Stators in a Housing for Creating Emulsions, Suspensions and Blends. United States Patent US 6502980 B1, 7 January 2003. https://patents.google.com/patent/US6502980B1/en.
[36] Kamiya, T. Mixer of a Rotor Stator Type, Performance Estimation Method Thereof, and Scale Up Method Thereof. United States Patent US 9278322 B2, 8 March 2016. https://patents.google.com/patent/US9278322B2/en.
[37] Wittek, A. Outlet Means of a Rotor Stator Dispersion Machine. European Patent Application EP 2572777 A1, 27 March 2013. https://patents.google.com/patent/EP2572777A1/en.
[38] Kinematica AG. Megatron MT-V Series. Manufacturer technical documentation. https://shop-kinematica.ch/product/megatron-mt-v-series/
[39] Дейниченко, Г. В.; Самойчук, К. О.; Левченко, Л. В. Ефективність гомогенізації молока у пульсаційному гомогенізаторі [Efficiency of Milk Homogenization in a Pulsation Homogenizer]. Вібрації в техніці та технологіях 2017, 1(84), 110-115. https://elar.tsatu.edu.ua/bitstreams/dbcb5738-f73b-472b-8ee3-80b49cf2d28a/download.
[40] Самойчук, К. О.; Івженко, А. О. Ефективність гомогенізації молока в пульсаційному апараті з вібруючим ротором [Efficiency of Milk Homogenization in a Pulsation Apparatus with a Vibrating Rotor]. Вісник Харківського національного технічного університету сільського господарства імені Петра Василенка 2015, 166, 98-104. https://elibrary.donnuet.edu.ua/586/1/Deynichenko_article_01_10_2015.pdf.
[41] Ahtchi-Ali, B. Beverage Nanoemulstions Produced by High Shear Processing. International Patent Application WO 2017/091462 A1, 1 June 2017. https://patents.google.com/patent/WO2017091462A1/en.