
Technical publication
Back to publications
Reactors & equipment
Cavitation in Hydraulic Machinery, Valves, Piping, and Marine Systems
okozyuk.com
Published
Read complete publication for whole-document Find and printing. Browser Find and native printing on this reader include only loaded content.
4 Marine Propellers, Waterjets, and Hydrofoils
4.1 Local Cavitation Number and Unsteady Loading
A marine propeller blade is subjected to axial inflow, rotational velocity, induced velocity, and the nonuniform wake produced by the hull. The local pressure margin therefore changes with radius and blade angular position. A representative local cavitation number sigma_r is given by Eq. (8), where p_a is atmospheric or chamber pressure, h is local immersion, and V_R(r) is the specified local resultant velocity. Propeller analysis also uses nondimensional thrust, torque, advance, and loading coefficients. Reduced immersion, increased shaft speed, high blade loading, wake peaks, maneuvering, surface roughness, and appendage interaction all promote cavitation [9,10].
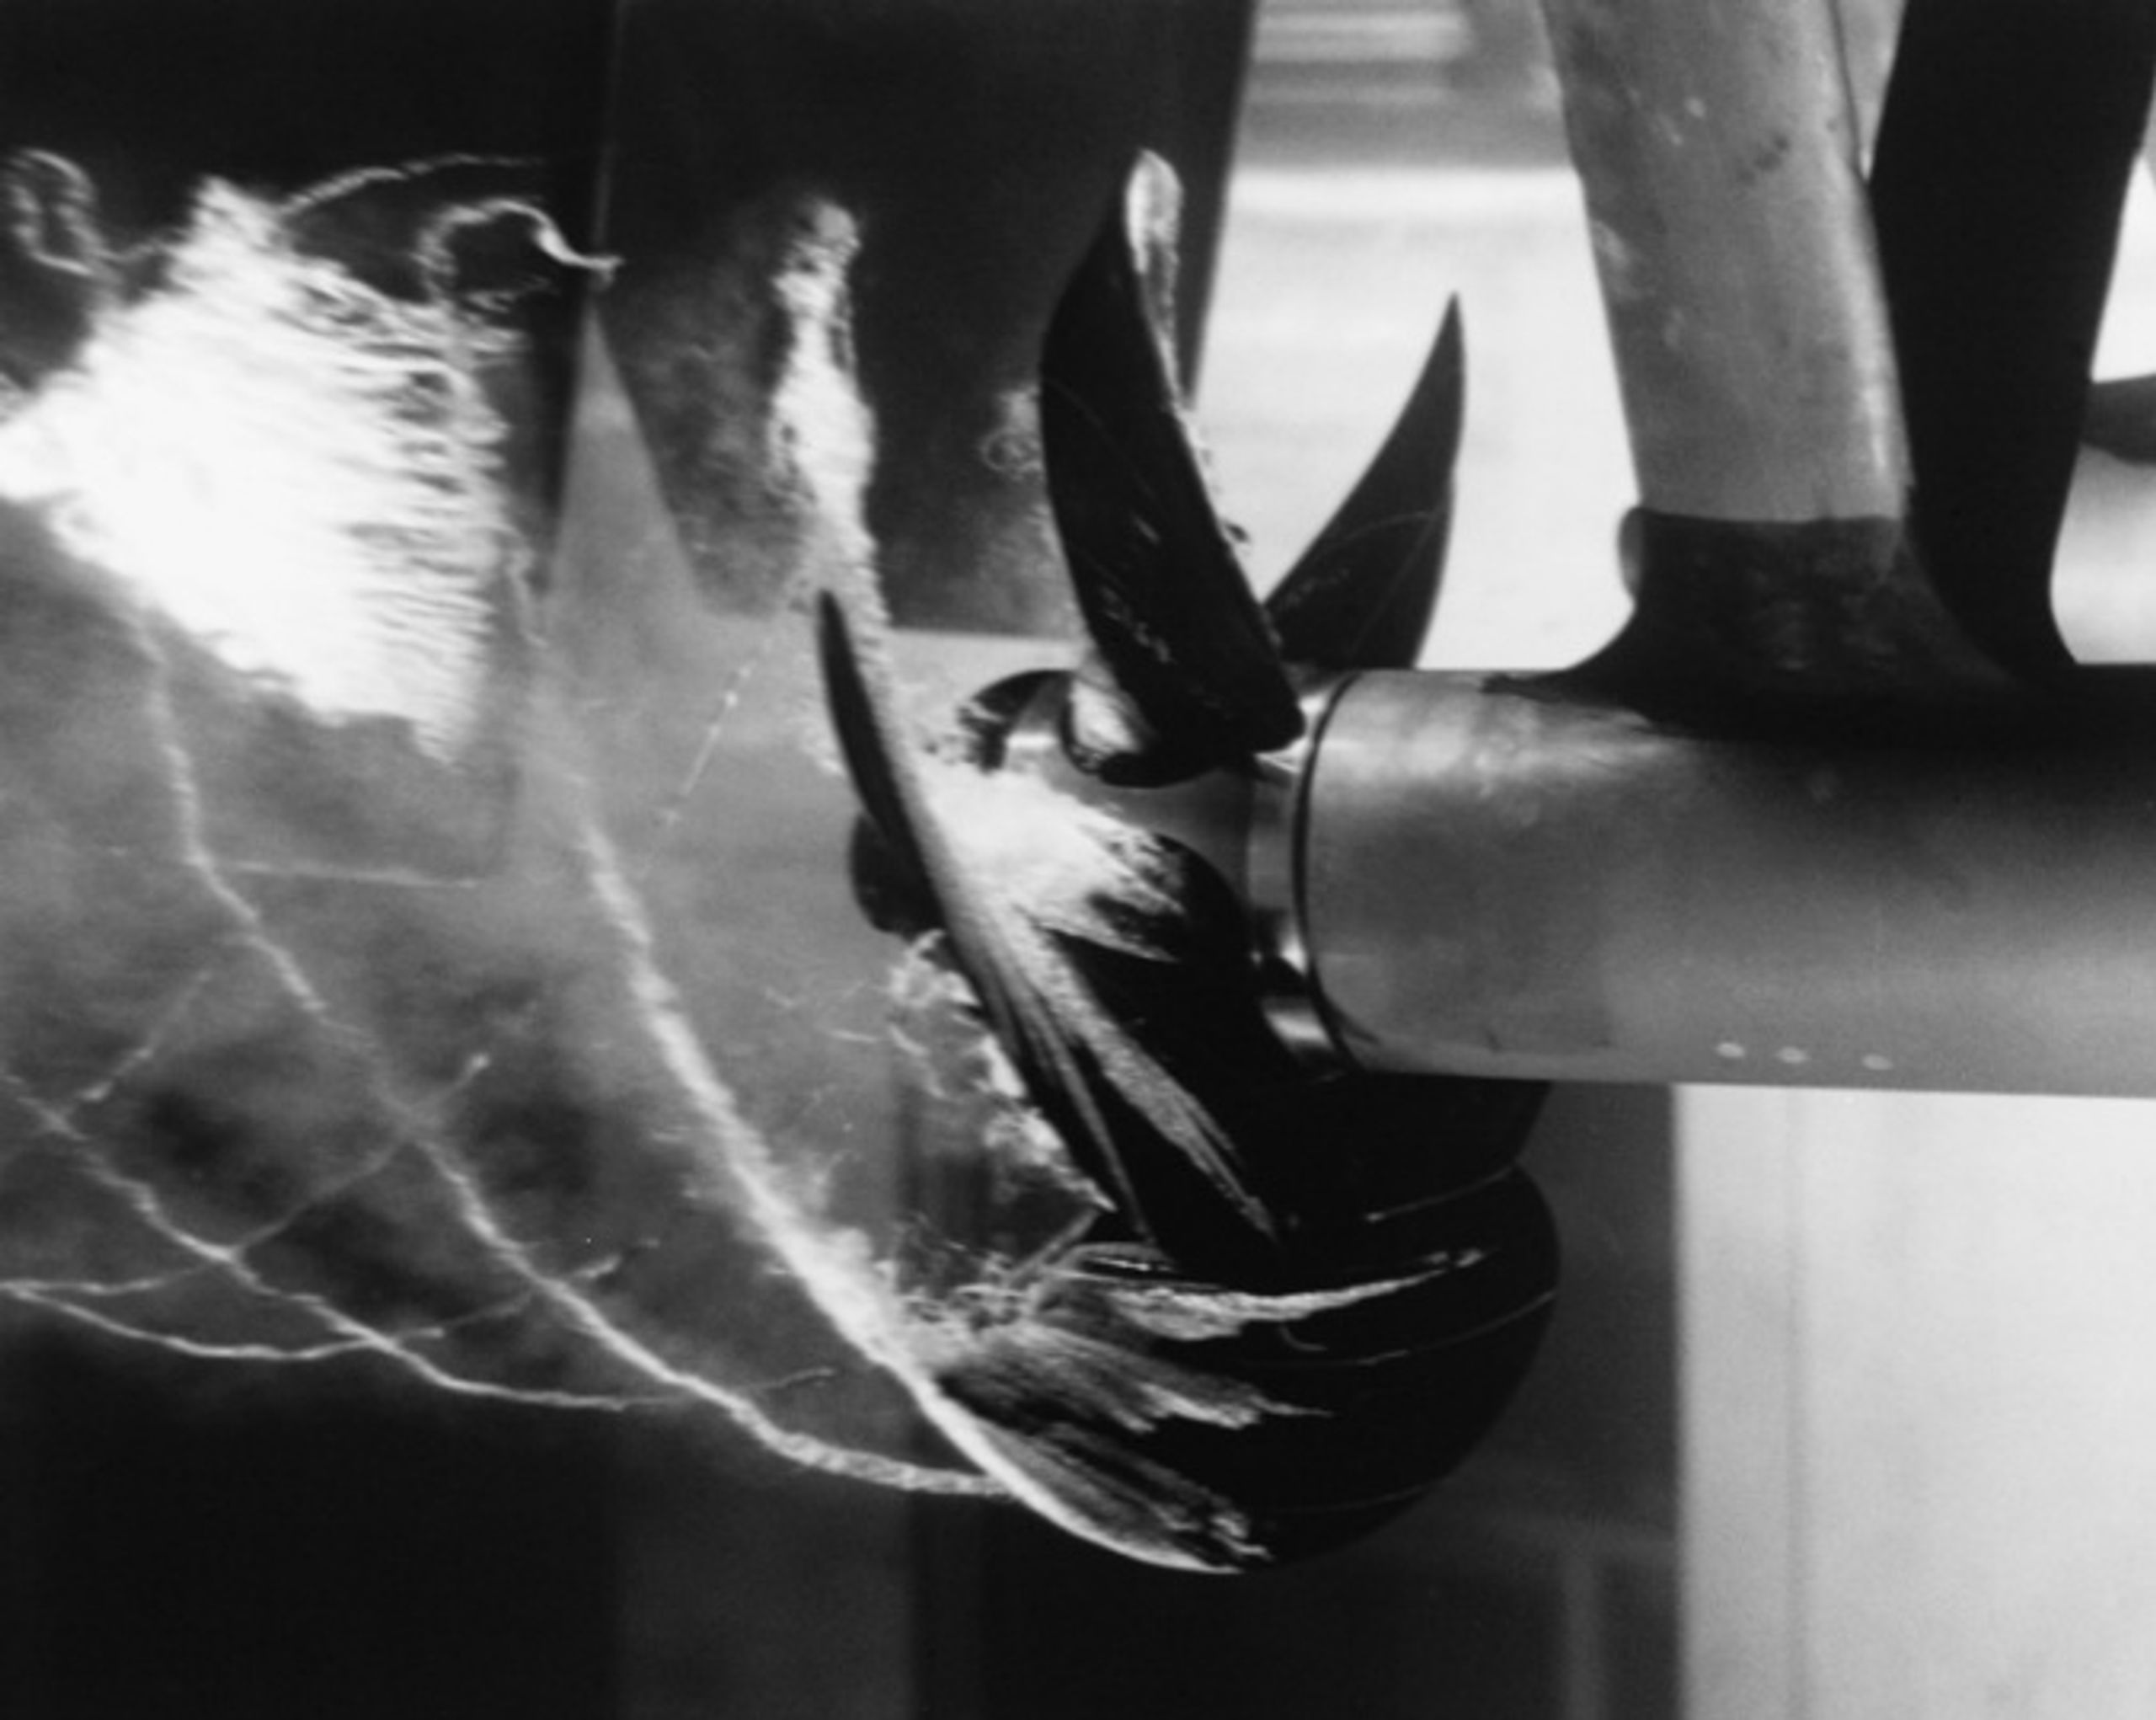
Figure 5. Cavitating propeller in a water tunnel at the David Taylor Model Basin. U.S. Navy photograph, public domain [11].
4.2 Cavitation Forms on Propulsors
Marine cavitation is classified according to the geometry, persistence, and location of the vapor structure on the propulsor or nearby appendages. These categories are not mutually exclusive. For example, an attached sheet cavity may shed a cloud, while a tip vortex may simultaneously interact with a rudder or hull surface.
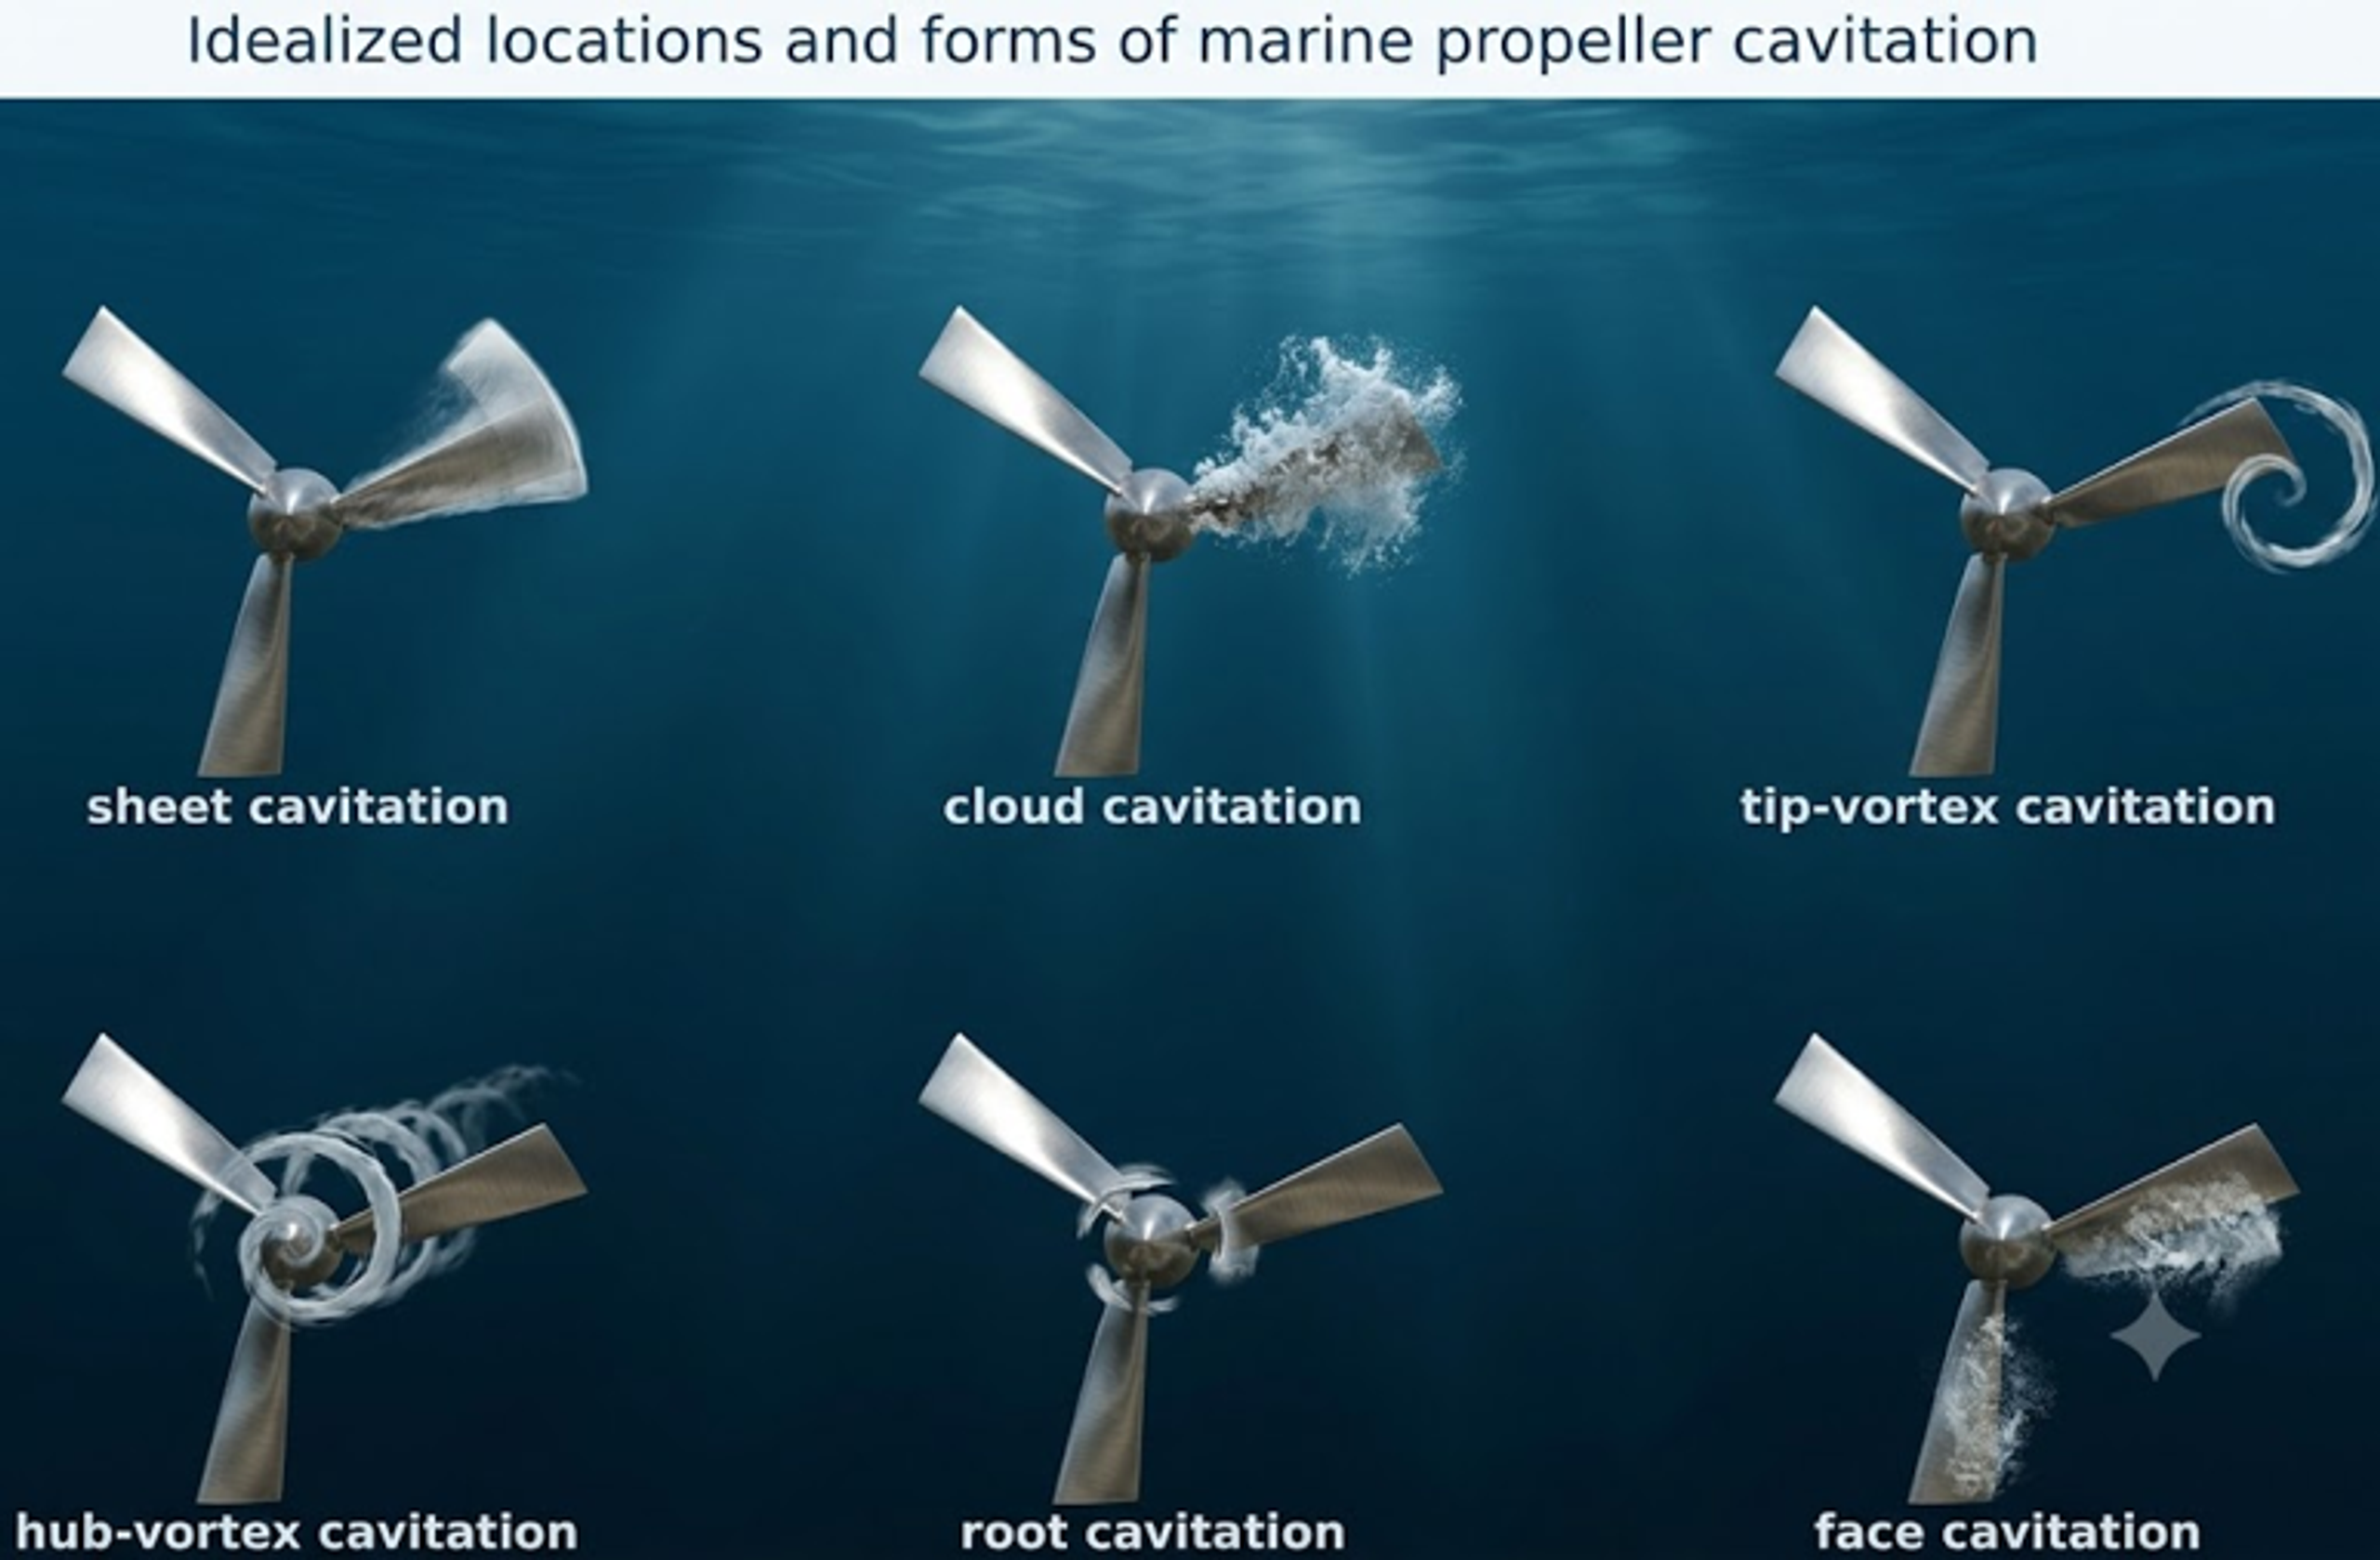
Figure 6. Idealized locations and forms of marine propeller cavitation [2].
Table 3. Marine propeller cavitation forms.
| Form | Typical location and cause | Principal consequence |
|---|---|---|
| Back sheet cavitation | Suction side near the leading edge under high positive loading. | Thrust and torque change, cloud shedding, erosion, and pressure pulses. |
| Face cavitation | Pressure side under negative incidence, crash astern, or local wake reversal. | Severe off design loading and localized erosion. |
| Tip vortex cavitation | Low pressure core of the rolled up tip vortex. | Radiated noise, long range interaction, and possible rudder or hull erosion. |
| Hub vortex cavitation | Vortex downstream of the hub or boss cap. | Noise, hub and rudder interaction, and efficiency loss. |
| Root cavitation | Blade root or fillet under concentrated loading and three dimensional flow. | Local erosion and crack sensitive surface damage. |
| Cloud cavitation | Periodic breakup of an attached cavity. | Strong unsteady loads, broadband noise, and high erosion potential. |
| Bubble cavitation | Isolated nuclei grow over a blade pressure minimum. | Inception signature and scattered pitting. |
4.3 Erosion, Noise, and Structural Loading
The consequence of propeller cavitation depends on cavity extent, unsteadiness, and collapse location. A stable tip vortex may be governed primarily by radiated noise, whereas repeated cloud collapse close to a blade can produce severe erosion. Associated pressure pulses may excite the hull, stern structure, shaft line, rudder, and other appendages. Acoustic detectability is important in naval and research applications, while commercial vessels are commonly constrained by comfort, fatigue, efficiency, and maintenance requirements [9,10,12,13].
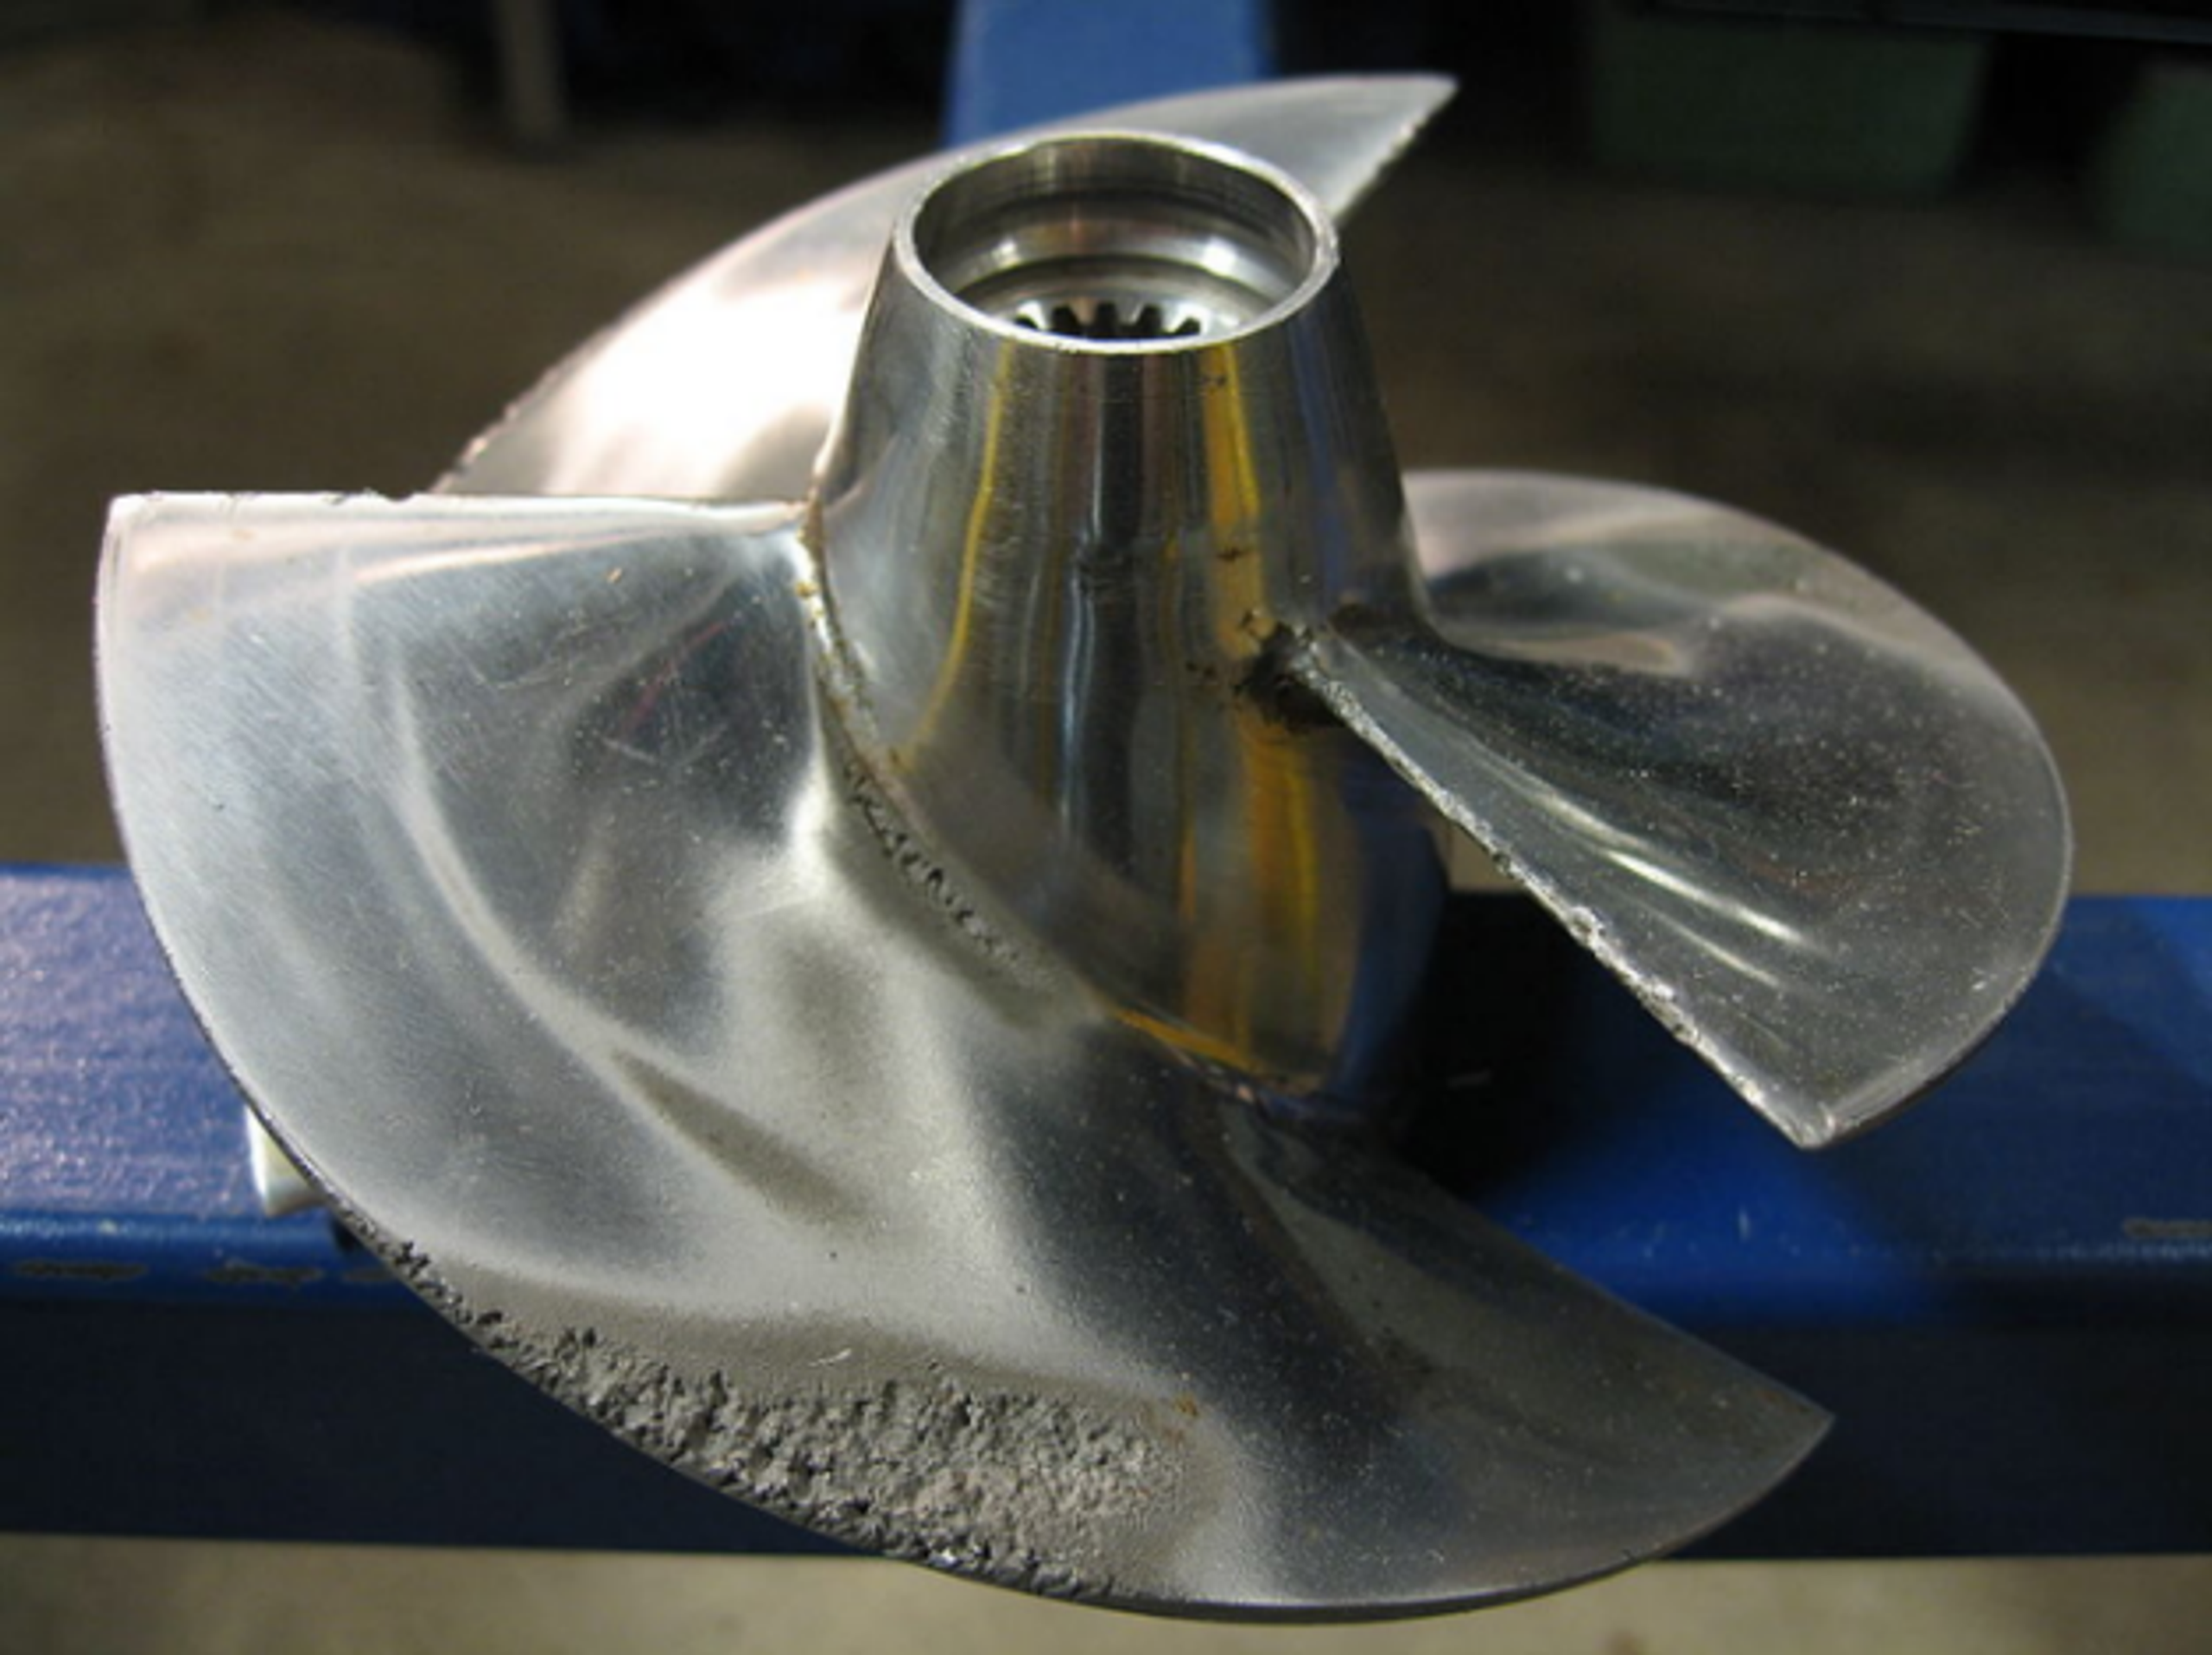
Figure 7. Cavitation erosion concentrated near the outer edge of a marine propeller. Photograph by Erik Axdahl [14].
4.4 Waterjets, Pumpjets, Hydrofoils, and Rudders
Waterjet and pumpjet systems may cavitate at inlet lips, rotor leading edges, stator vanes, tip clearances, and nozzle regions. Inlet distortion, gas ingestion, shallow operation, fouling, and maneuvering can cause rapid changes in cavitation behavior. Hydrofoils and rudders may cavitate at leading edges, tips, gaps, hinges, and separated flow regions. Propeller or tip vortices can also impinge on an appendage and collapse on a surface that is not the original formation site. The general diagnostic approach is therefore to identify the minimum pressure region and track cavity transport to the eventual collapse region [9,10,12,13,15].
4.5 Hydraulic Turbines and Thoma Coefficient
Reaction turbines may cavitate on runner blades, at the runner outlet, within tip or seal vortices, and in the draft tube. The Thoma cavitation coefficient sigma_T is given by Eq. (9), where H_a is atmospheric pressure head, H_v is vapor pressure head, H_s is the suction head or setting according to the adopted convention, and H is turbine head. Installation elevation, tailwater level, temperature, and operating point determine the available coefficient. Plant specific model testing and manufacturer limits remain necessary because turbine geometry and scale effects are significant [4].
4.6 Model Tests and Scaling
Cavitation tunnels and model basins reproduce a target cavitation number while controlling pressure, velocity, water quality, nuclei population, and observation conditions. Complete similitude is difficult because Reynolds number, nuclei distribution, surface roughness, gas content, structural stiffness, and acoustic propagation cannot all be scaled independently. ITTC procedures therefore define model preparation, observation, erosion assessment, and noise measurement practices to improve repeatability [12,13]. Model results should be interpreted together with the stated nuclei and roughness conditions rather than from nominal cavitation number alone.