# Cavitation in Hydraulic Machinery, Valves, Piping, and Marine Systems
## Abstract
Cavitation is a multiphase flow phenomenon produced when local liquid
pressure reaches or falls below the saturation vapor pressure and the
resulting vapor structures subsequently collapse or persist according to
the downstream pressure field. This article examines cavitation in
rotodynamic pumps, control valves and piping systems, marine propulsors,
hydrofoils, and hydraulic turbines. The discussion integrates net
positive suction head, pressure recovery, cavitation indices, liquid
choking, unsteady loading, erosion, noise, vibration, and performance
degradation with practical diagnostic and mitigation methods. Particular
emphasis is placed on distinguishing the location of vapor formation
from the location of collapse, because damage may occur downstream or
away from the apparent inception site. System pressure, local velocity,
equipment geometry, operating envelope, materials, coatings, and
verification methods are treated as coupled engineering variables. The
resulting framework supports mechanism based assessment and selection of
preventive measures across hydraulic and marine applications.
Keywords: hydrodynamic cavitation; net positive suction head; control
valves; hydraulic machinery; marine propulsors; cavitation erosion;
pressure recovery; vibration.
## 1 Introduction
Cavitation occurs in hydraulic equipment whenever a local pressure
minimum permits vapor formation and a subsequent pressure increase
causes vapor structures to collapse. The engineering consequences depend
on where cavities form, how they are transported, where they collapse,
and how frequently the associated pressure pulses interact with solid
boundaries. The same physical mechanism therefore appears differently in
pumps, throttling devices, propulsors, hydrofoils, and turbines.
Reliable assessment requires simultaneous consideration of the pressure
field, operating point, fluid properties, geometry, structural response,
and surface condition [1,2].
## 2 Cavitation in Pumps and Impellers
### 2.1 Locations and Mechanisms
In a centrifugal pump, shaft work is converted into fluid head by the
rotating impeller and the stationary casing or diffuser. Cavitation most
commonly develops at the impeller eye and blade leading edge, where high
relative velocity produces a local pressure minimum. Additional
cavitating structures may arise in tip leakage vortices, balance
passages, wear ring clearances, inlet and discharge recirculation zones,
blade wake interactions, and diffuser or volute regions. Because each
mechanism responds differently to operating point and geometry,
diagnosis and mitigation must be mechanism specific [1,2].
Table 1. Pump cavitation locations and characteristic signatures [1].
| Location or mechanism | Common operating condition | Typical evidence | Priority response |
|------------------------------------|---------------------------------------------------------------------------------------------|--------------------------------------------------------------------------------------|-------------------------------------------------------------------------------------|
| Impeller eye and leading edge | Insufficient suction head, high temperature, excessive speed, high flow, or inlet prewhirl. | Vapor at blade inlet, crackling noise, head loss as severity increases. | Increase suction pressure, reduce losses or speed, correct inlet geometry. |
| Inlet recirculation | Operation well below best efficiency flow. | Intermittent low frequency pressure fluctuations, vapor near inlet and suction pipe. | Move operating point, use minimum flow control, review impeller and suction design. |
| Discharge recirculation | Very low flow and high internal recirculation. | Noise and erosion near blade discharge or cutwater, heat rise. | Avoid prolonged low flow, provide bypass, revise impeller or casing geometry. |
| Tip or clearance vortex | Open impeller, inducer, axial machine, or large clearance. | Vortex core vapor and localized erosion away from the nominal leading edge. | Reduce clearance, weaken vortex, relocate collapse, improve surface resistance. |
| Diffuser or volute interaction | Off design incidence or strong blade wake. | Pressure pulsation at blade passing frequency and local vapor pockets. | Correct operating point, vane geometry, spacing, or cutwater clearance. |
| Internal seals and balance devices | High pressure drop through small clearance. | Pitting, unstable axial thrust, leakage change. | Stage pressure drop, change clearance geometry, raise local backpressure. |
### 2.2 Net Positive Suction Head
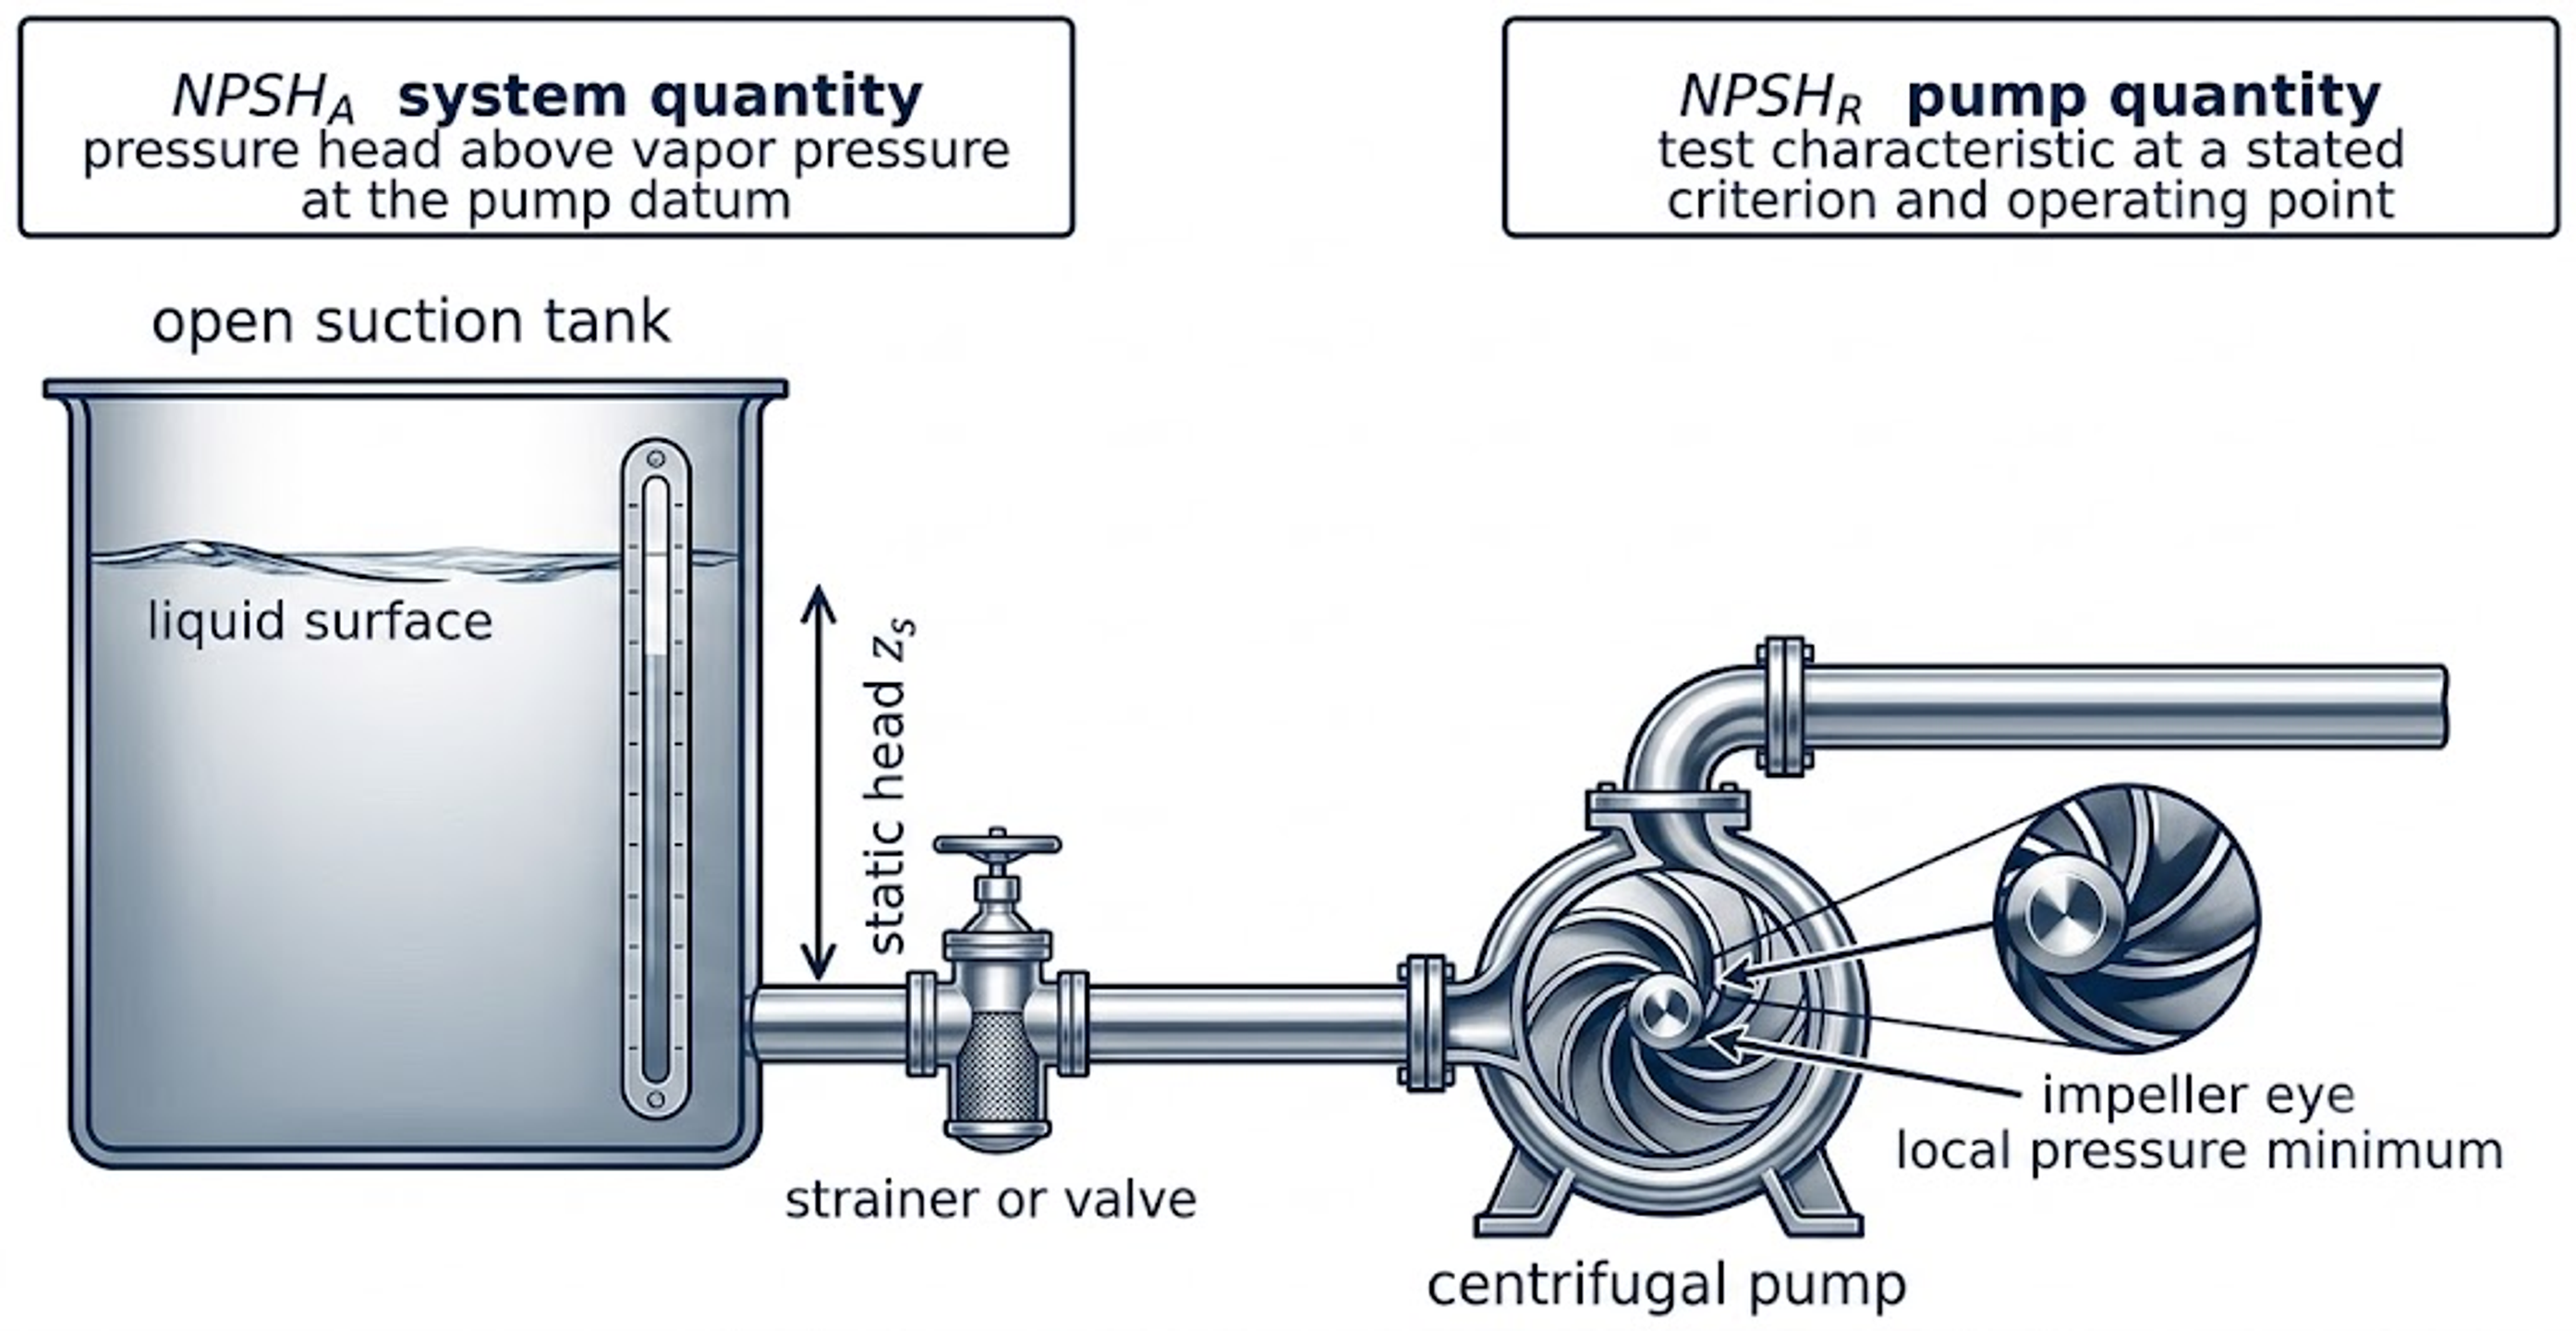
Net positive suction head available (NPSHA) is the total absolute
suction head at the pump datum in excess of the liquid vapor pressure
head. For a specified suction reference section and for an open suction
vessel, two commonly used forms are given by Eqs. (1) and (2),
respectively.
(1)
(2)
In these expressions, p_s is the absolute suction pressure, V_s is the
suction velocity, p_surface is the absolute pressure above the liquid
surface, z_s is the static elevation of that surface relative to the
pump datum, h_f,s is the suction line loss, p_v is the saturation vapor
pressure, rho is liquid density, and g is gravitational acceleration.
Sign conventions must be applied consistently. NPSHA varies with flow
rate, liquid level, vessel pressure, temperature, fouling, valve
position, and transient acceleration [1,3].
Figure 1. Schematic pump suction system showing an open suction tank, static head, suction restriction, centrifugal pump, impeller eye, and NPSHA and NPSHR concepts [2]Source: Kozyuk O. Hydrodynamic Cavitation. [Unpublished technical manuscript and supporting data] 2026.
[Figure 1](#figure-1). Pump suction system and NPSH concepts [2].
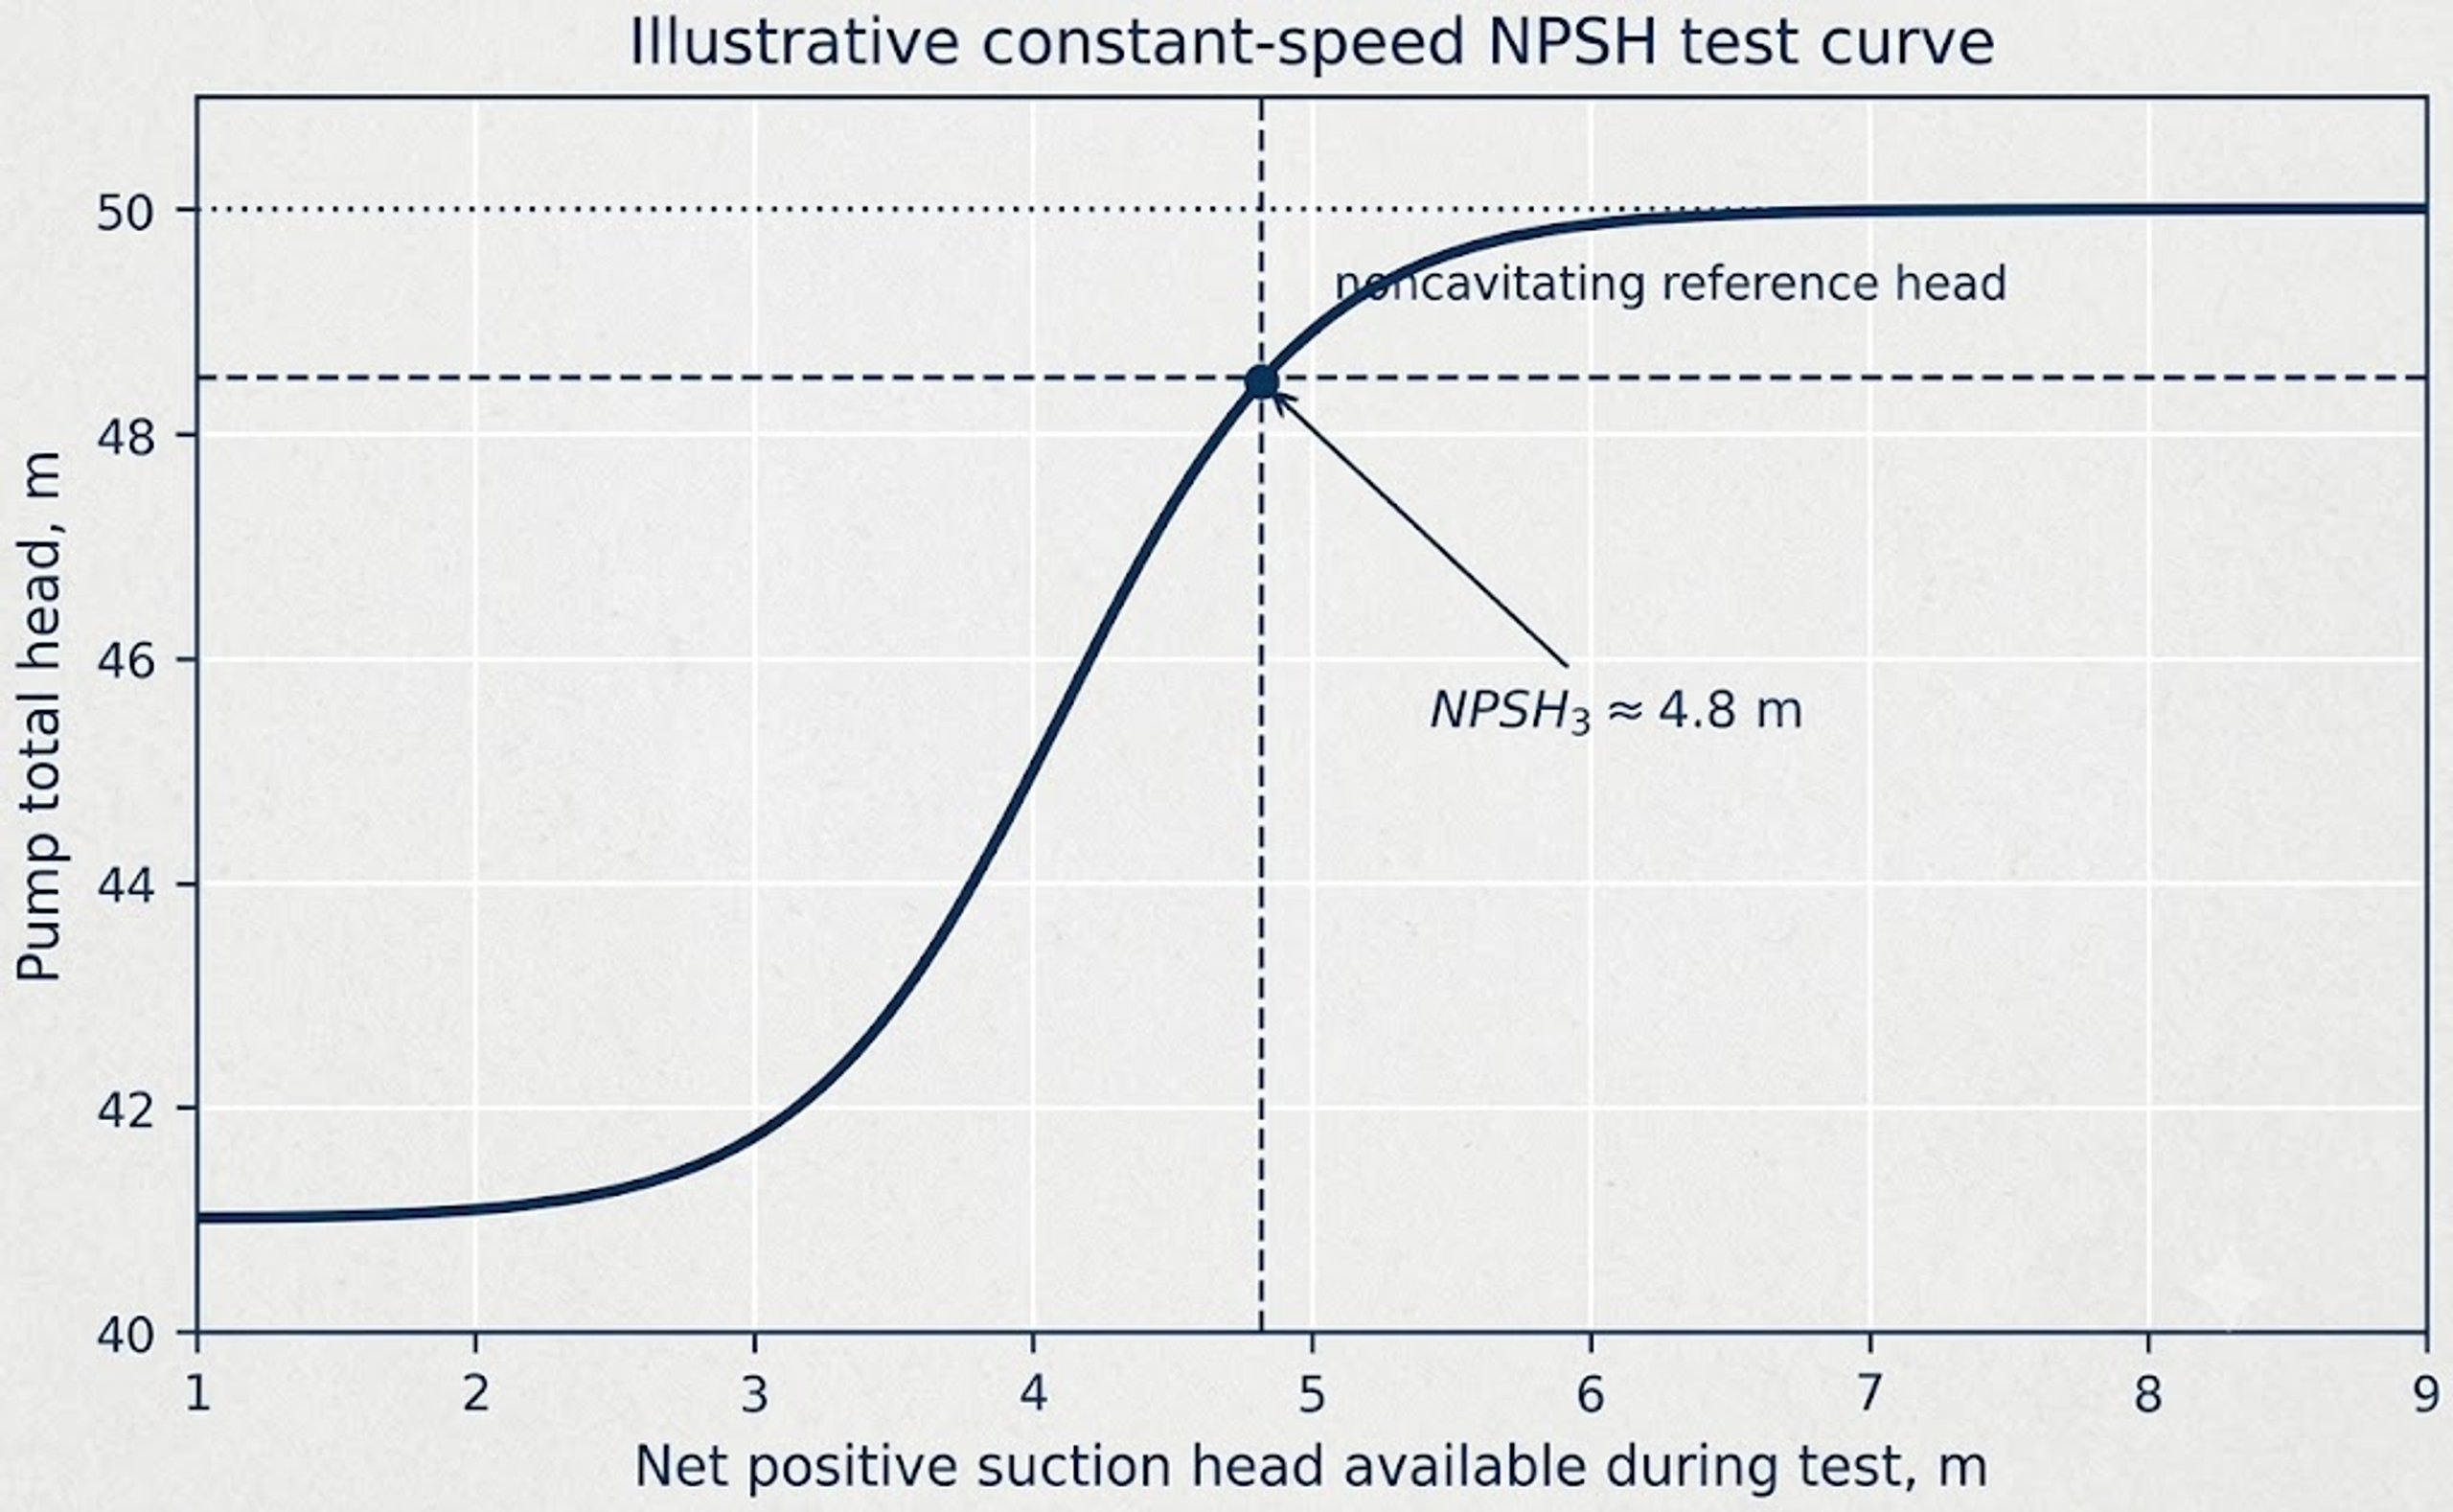
Net positive suction head required (NPSHR) is a pump characteristic
established by test at a specified speed, flow rate, liquid, and
acceptance criterion. NPSH3 commonly denotes the NPSH at which total
pump head has decreased by 3 percent relative to a noncavitating
reference. Cavitation inception generally precedes this test point, and
acoustic emission or erosion may occur at higher NPSH values.
Manufacturer curves should therefore be interpreted together with the
applicable test definition and the consequences of cavitation in the
intended service [1,3].
Figure 2. Illustrative constant-speed NPSH test curve showing pump total head versus net positive suction head available and the NPSH3 3 percent head-drop point [1,3]Source: Kozyuk O. Hydrodynamic Cavitation. [Unpublished technical manuscript and supporting data] 2026.
[Figure 2](#figure-2). Illustrative NPSH3 test curve. The 3 percent head drop
criterion is a repeatable pump test point, not a universal inception or
damage threshold [1,3].
Two simple measures are used to express NPSH margin: the absolute margin
M and the margin ratio M_R, as defined by Eq. (3). The required margin
is application specific because pump type, speed, energy density,
operating region, liquid properties, duty criticality, and acceptable
performance degradation differ among services. A single percentage
margin is therefore not universally applicable [1].
(3)
Suction specific speed is a comparative indicator defined by Eq. (4),
where n is rotational speed and Q is flow rate under a stated unit
convention. Its numerical value depends on the selected units and pump
definition, so the convention must be declared whenever the parameter is
reported. A high suction specific speed may indicate aggressive inlet
loading and a narrower stable low flow range, but it is not an
independent criterion for cavitation [1].
(4)
Hydraulic power and pump efficiency are related by Eq. (5).
(5)
A reduction in developed head, unstable power demand, loss of
efficiency, or flow limitation can provide indirect evidence of
developed cavitation. At inception, however, acoustic and pressure
signatures may appear before a measurable change in efficiency.
### 2.3 Damage Patterns and Operational Symptoms
Pump cavitation is often associated with crackling or gravel like noise,
but sound alone is not diagnostic because entrained gas, bearing
defects, solids, and recirculation can produce similar signatures. A
more reliable diagnosis combines the operating state, performance
trends, pressure or vibration data, and physical inspection. Cavitation
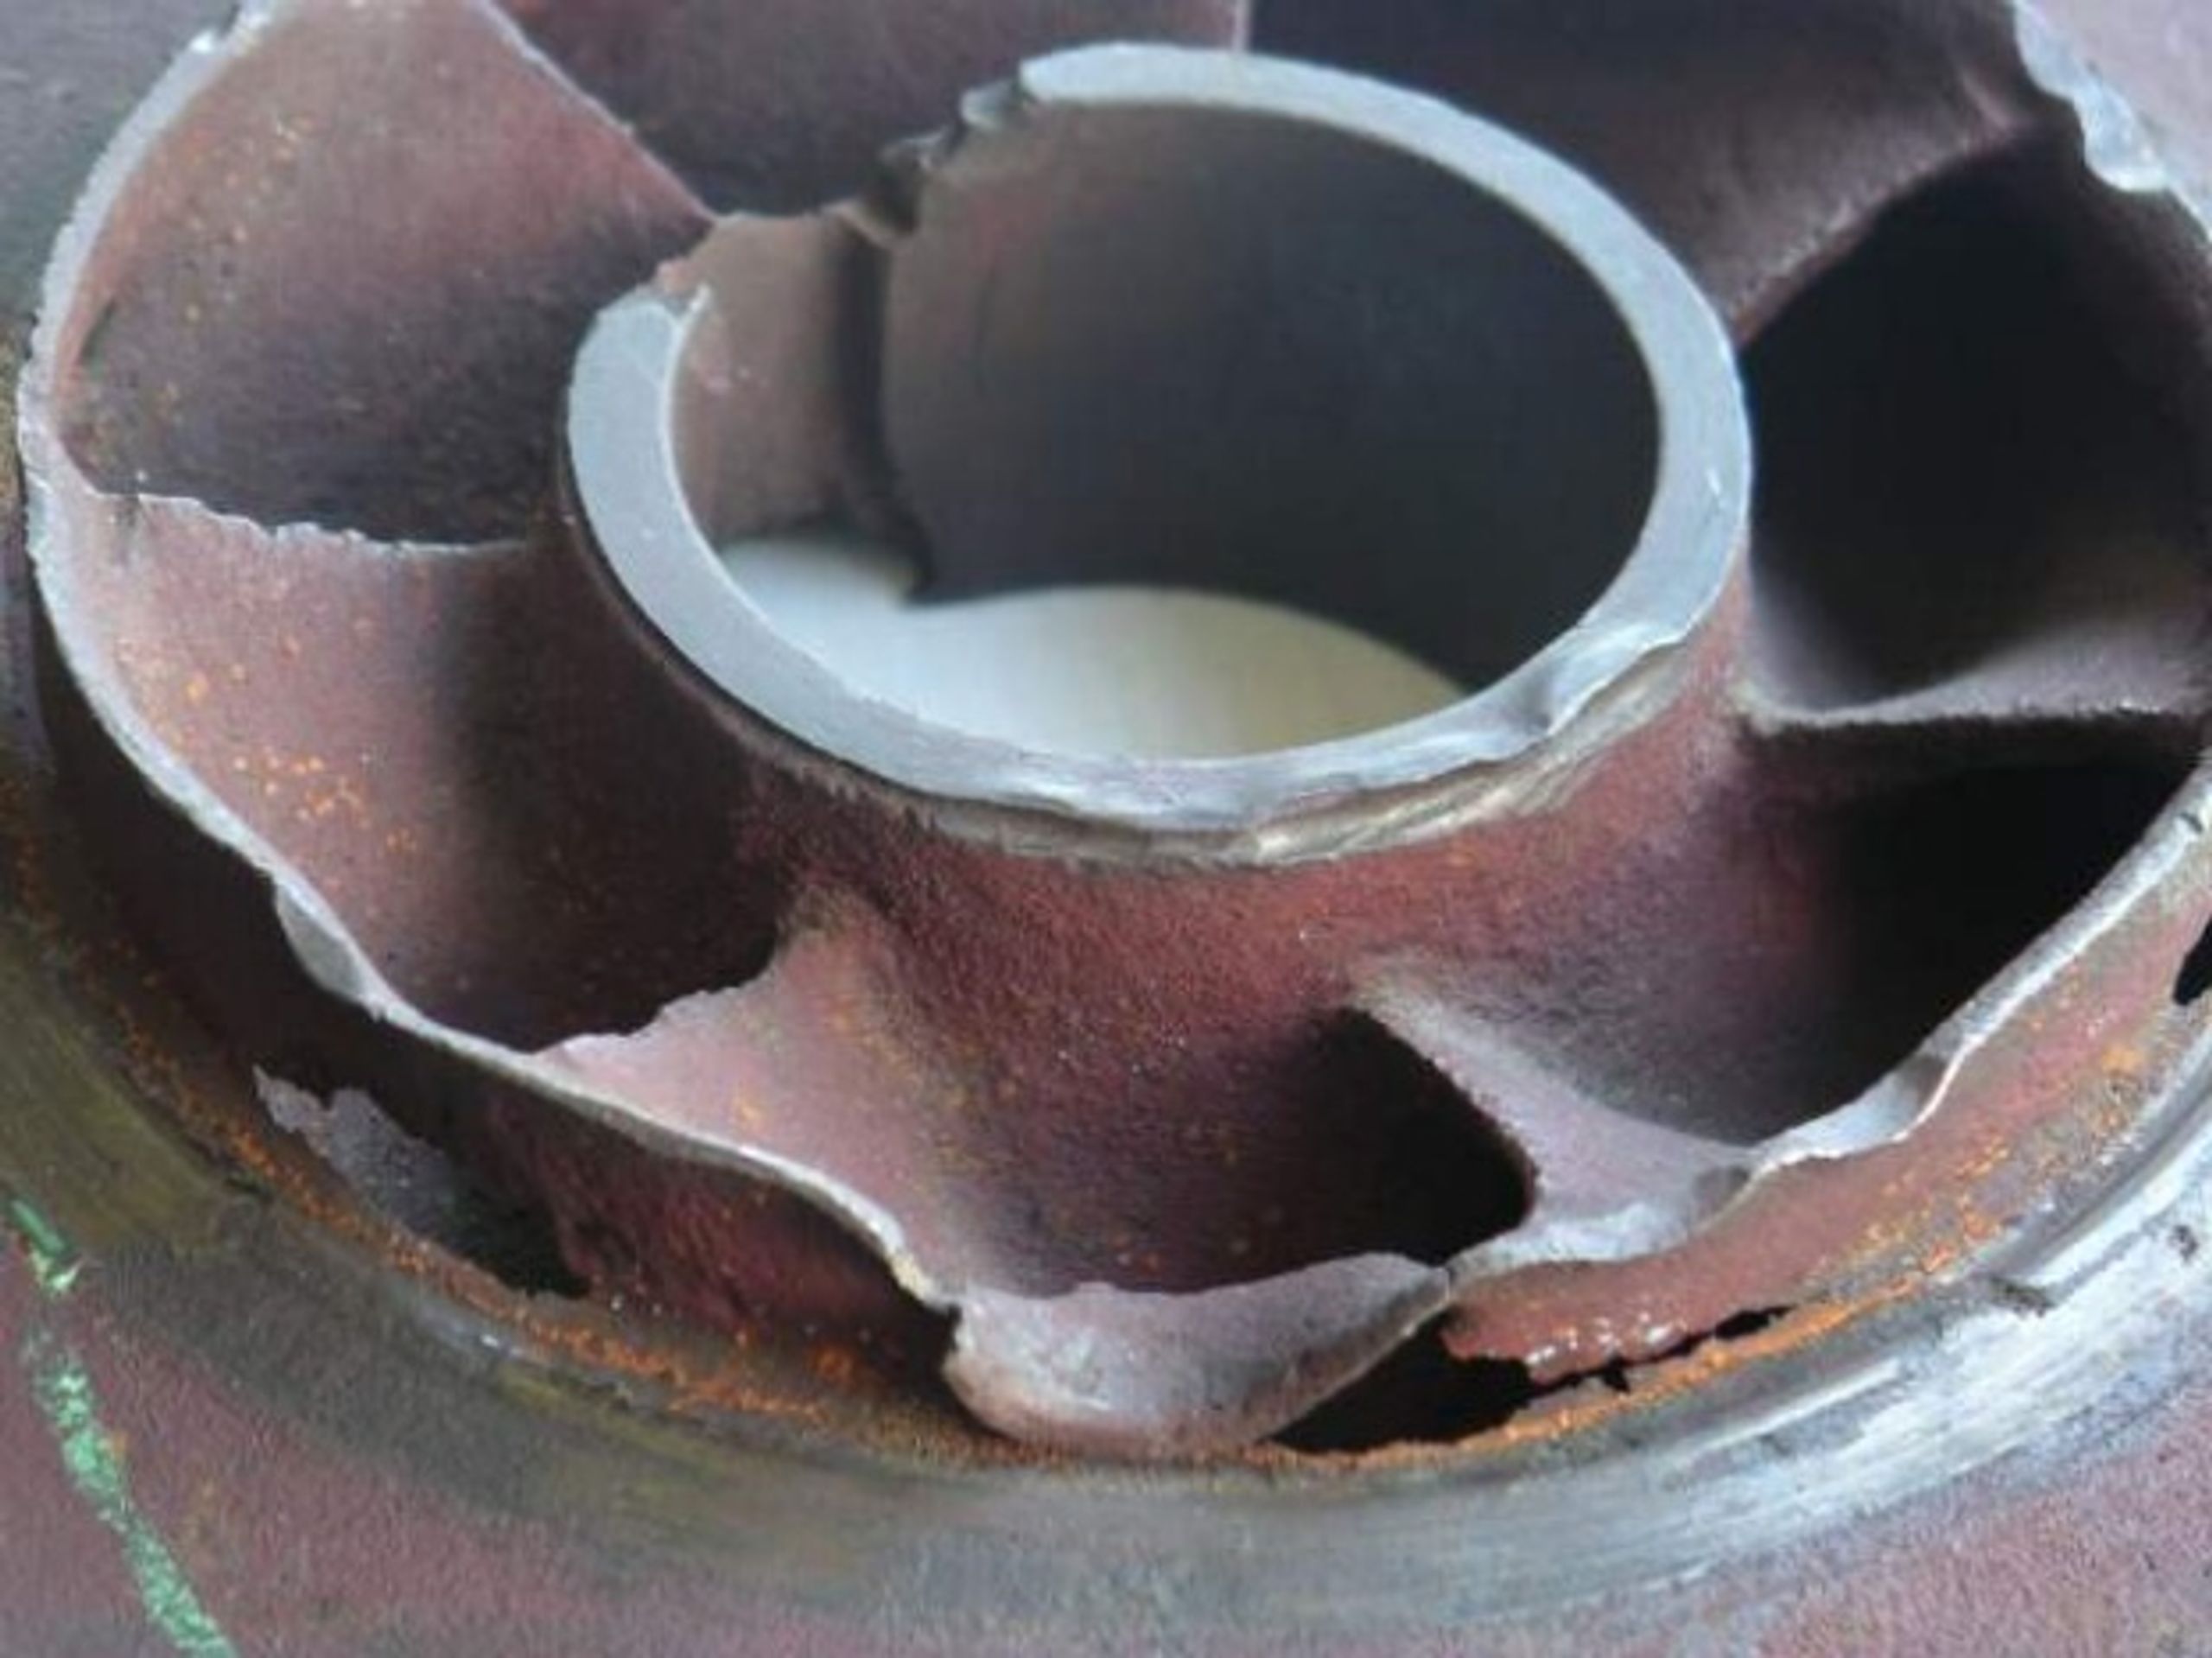
erosion near the impeller inlet typically appears as rough, scalloped
pitting and may progress to loss of blade profile, imbalance, crack
initiation, and leakage [1,4].
Figure 3. Photograph of cavitation damage and material loss on a centrifugal pump impeller [5]Jean Jacques Milan; Wikimedia Commons; CC BY-SA 3.0; file: Usure par cavitation d'un impulseur de pompe centrifuge 03.jpg; accessed July 21, 2026.
[Figure 3](#figure-3). Cavitation damage on a centrifugal pump impeller. Photograph
by Jean Jacques Milan [5].
### 2.4 Prevention Priorities for Pumps
Pump evaluation should begin with consistent measurements of absolute
suction pressure, liquid temperature, vapor pressure, liquid level, and
flow rate. Use of relative pressure without the appropriate barometric
correction can produce an incorrect NPSHA value.
- Reduce suction line losses by increasing pipe diameter where
justified, shortening the suction run, opening or removing restrictive
fittings, cleaning strainers, and eliminating gas pockets. Provide the
straight approach flow required by the pump inlet design.
- Increase the available suction head by raising liquid level or vessel
pressure, lowering the pump elevation, reducing liquid temperature
when the process permits, or using a booster pump or inducer.
- Reduce rotational speed or shift operation toward the preferred
operating region when feasible. Suction side throttling should not be
used as the routine method of flow control.
- Evaluate inlet recirculation and discharge recirculation independently
of low NPSH cavitation. A large NPSH margin does not correct an
unstable off design internal flow pattern.
- After a hydraulic or mechanical modification, verify the result using
pressure and performance data together with vibration or acoustic
trends and inspection. Sound alone is insufficient for confirmation.
## 3 Cavitation in Valves and Piping Systems
### 3.1 Vena Contracta and Pressure Recovery
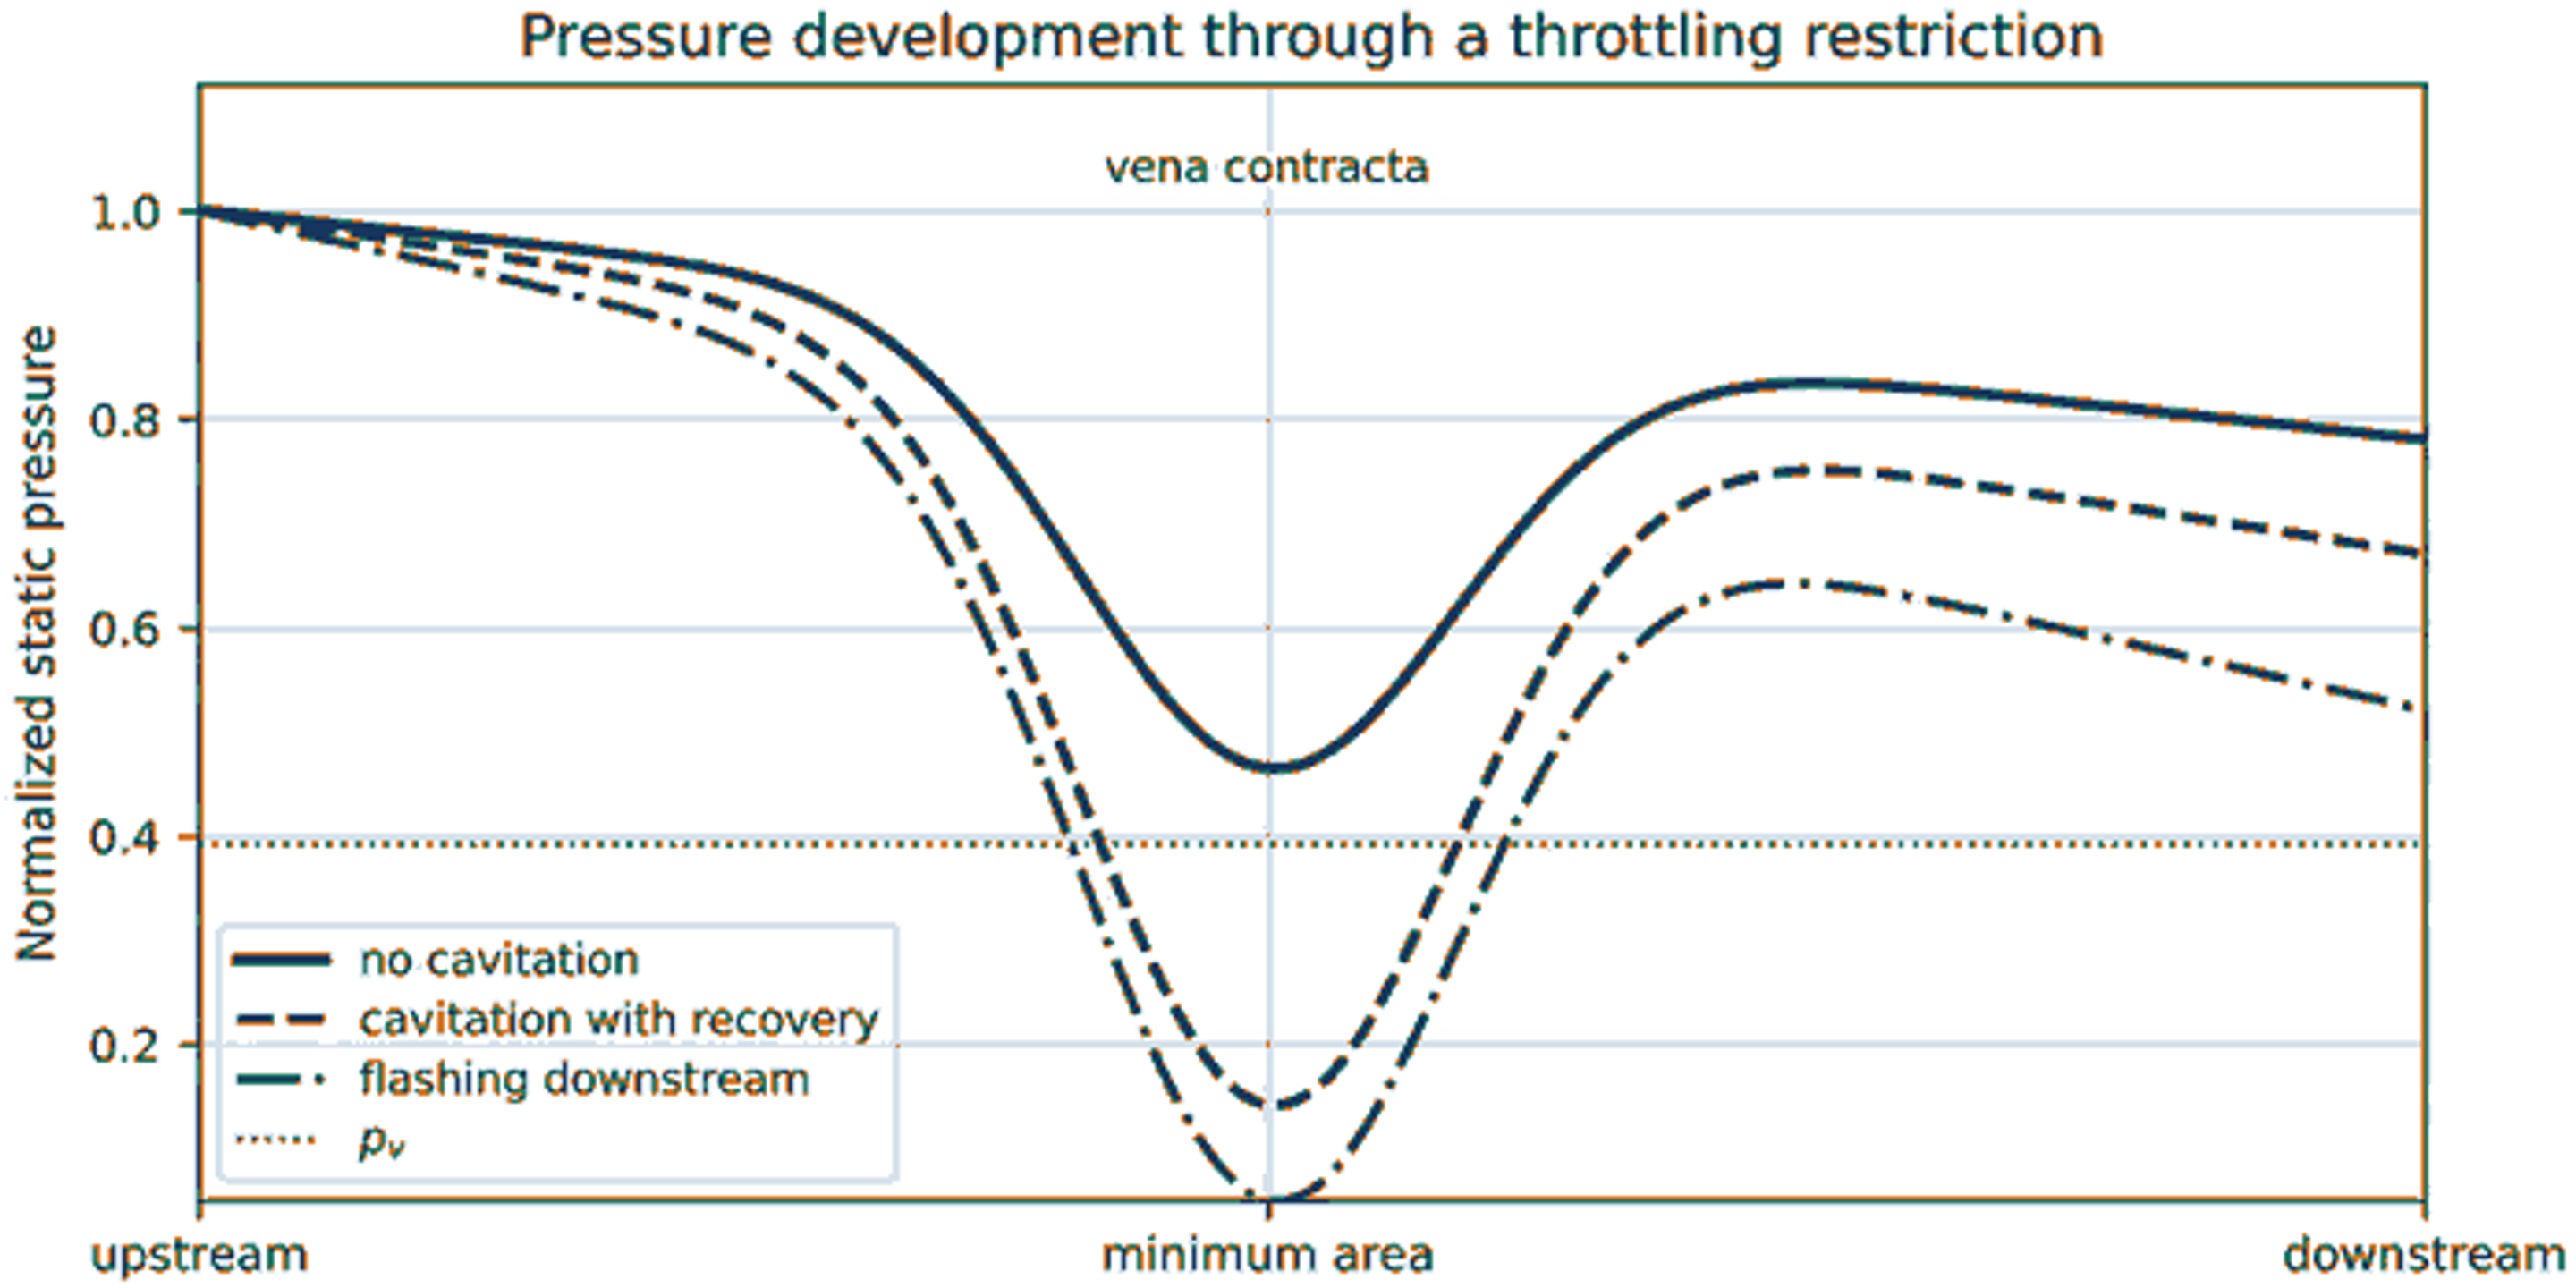
When a liquid accelerates through a throttling element, the jet
continues to contract downstream of the minimum geometric area. Static
pressure reaches a minimum near the vena contracta and then partially
recovers as the jet expands and mixes. Cavitation begins when the local
minimum pressure falls below vapor pressure and the resulting cavities
subsequently enter a region of higher pressure. Consequently, a trim
with strong pressure recovery can cavitate even when the measured
upstream and downstream pipe pressures remain above vapor pressure
[6,7,8].
Figure 4. Plot of normalized static pressure through a throttling restriction comparing no cavitation, cavitation with pressure recovery, and downstream flashing relative to vapor pressure [6,7,8]Source: Kozyuk O. Hydrodynamic Cavitation. [Unpublished technical manuscript and supporting data] 2026.
[Figure 4](#figure-4). Pressure profiles through a throttling restriction. Cavitation
requires pressure recovery above vapor pressure, whereas flashing
persists when downstream pressure remains below vapor pressure
[6,7,8].
### 3.2 Cavitation Indices and Recovery Factor
A commonly used valve cavitation index, sigma_v, is defined by Eq. (6),
where p_1 is the upstream pressure and p_2 is the downstream pressure.
Index conventions differ among industries, and some definitions use an
inverse ratio or a different pressure reference. Published inception,
constant cavitation, or damage thresholds must therefore be applied only
with the matching definition, valve style, size, travel, and test method
[6,7,8].
(6)
The liquid pressure recovery factor F_L is defined by Eq. (7), where
p_vc is the pressure at the vena contracta. A smaller recovery factor
indicates a larger difference between the minimum internal pressure and
the measured downstream pressure. Valve sizing methods combine pressure
recovery with the critical pressure ratio to predict liquid choking.
Final selection should follow a recognized sizing standard and
manufacturer data [6,7].
(7)
### 3.3 Cavitation, Choking, and Flashing
Table 2. Pressure states in valves and restrictions [2].
| State | Pressure relationship | Downstream behavior | Primary risk |
|------------------------|-----------------------------------------------------------------------------------|------------------------------------------------------|------------------------------------------------------------------------------------------------------------------------|
| Single phase liquid | Minimum pressure remains above vapor pressure. | No vapor generated by pressure reduction. | Turbulence, vibration, or erosion may still occur for other reasons. |
| Incipient cavitation | Small regions intermittently fall below vapor pressure. | Cavities collapse after pressure recovery. | High frequency noise; little performance change; possible early pitting. |
| Developed cavitation | A substantial vapor region forms near the vena contracta. | Repeated collapse in trim, body, or downstream pipe. | Noise, vibration, erosion, and reduced capacity. |
| Choked cavitating flow | Increasing pressure drop no longer produces the expected increase in liquid flow. | Vapor volume controls effective flow area. | Capacity limitation and severe dynamic loading. |
| Flashing | Downstream pressure remains at or below vapor pressure. | Two phase mixture persists downstream. | High velocity erosion, vibration, and large volume expansion; collapse may occur farther away if pressure later rises. |
### 3.4 Piping Locations and Control Measures
Cavitation may also develop at orifices, reducers, partially open
isolation valves, strainers, pump bypasses, sudden contractions,
separated elbows, nozzles, and high velocity branch connections. The
most vulnerable surface may lie downstream of the restriction because
cavity collapse occurs along the recovering jet. A modification that
merely relocates the pressure minimum can therefore transfer damage
rather than eliminate it [4,6,7,8].
**Stage the pressure drop.** Use multiple restrictions or multistage
trim so that each local pressure reduction remains below a damaging
level and the total dissipation is distributed.
**Use tortuous path or multiorifice trim.** Multiple small jets reduce
the energy of each individual jet and can relocate collapse into a
protected region, but passage dimensions must remain compatible with
solids loading and fouling.
**Increase downstream pressure.** A backpressure valve or process
modification can raise the local pressure profile, provided that the
added restriction does not create a new cavitating location.
**Increase valve size or change valve style.** Reduced velocity and a
valve geometry with lower pressure recovery can reduce cavitation
severity, but an oversized control valve may exhibit poor
controllability and unstable operation at low travel.
**Protect the downstream pipe.** Increase downstream pipe size, use a
diffuser where appropriate, provide adequate straight length, avoid
closely coupled elbows, and select resistant materials when residual
cavitation cannot be eliminated.
**Distinguish flashing.** Anti cavitation trim cannot condense vapor
when downstream thermodynamic conditions require a persistent two phase
state. Flashing service therefore requires erosion resistant geometry
and appropriate downstream sizing.
## 4 Marine Propellers, Waterjets, and Hydrofoils
### 4.1 Local Cavitation Number and Unsteady Loading
A marine propeller blade is subjected to axial inflow, rotational
velocity, induced velocity, and the nonuniform wake produced by the
hull. The local pressure margin therefore changes with radius and blade
angular position. A representative local cavitation number sigma_r is
given by Eq. (8), where p_a is atmospheric or chamber pressure, h is
local immersion, and V_R(r) is the specified local resultant velocity.
Propeller analysis also uses nondimensional thrust, torque, advance, and
loading coefficients. Reduced immersion, increased shaft speed, high
blade loading, wake peaks, maneuvering, surface roughness, and appendage
interaction all promote cavitation [9,10].
(8)
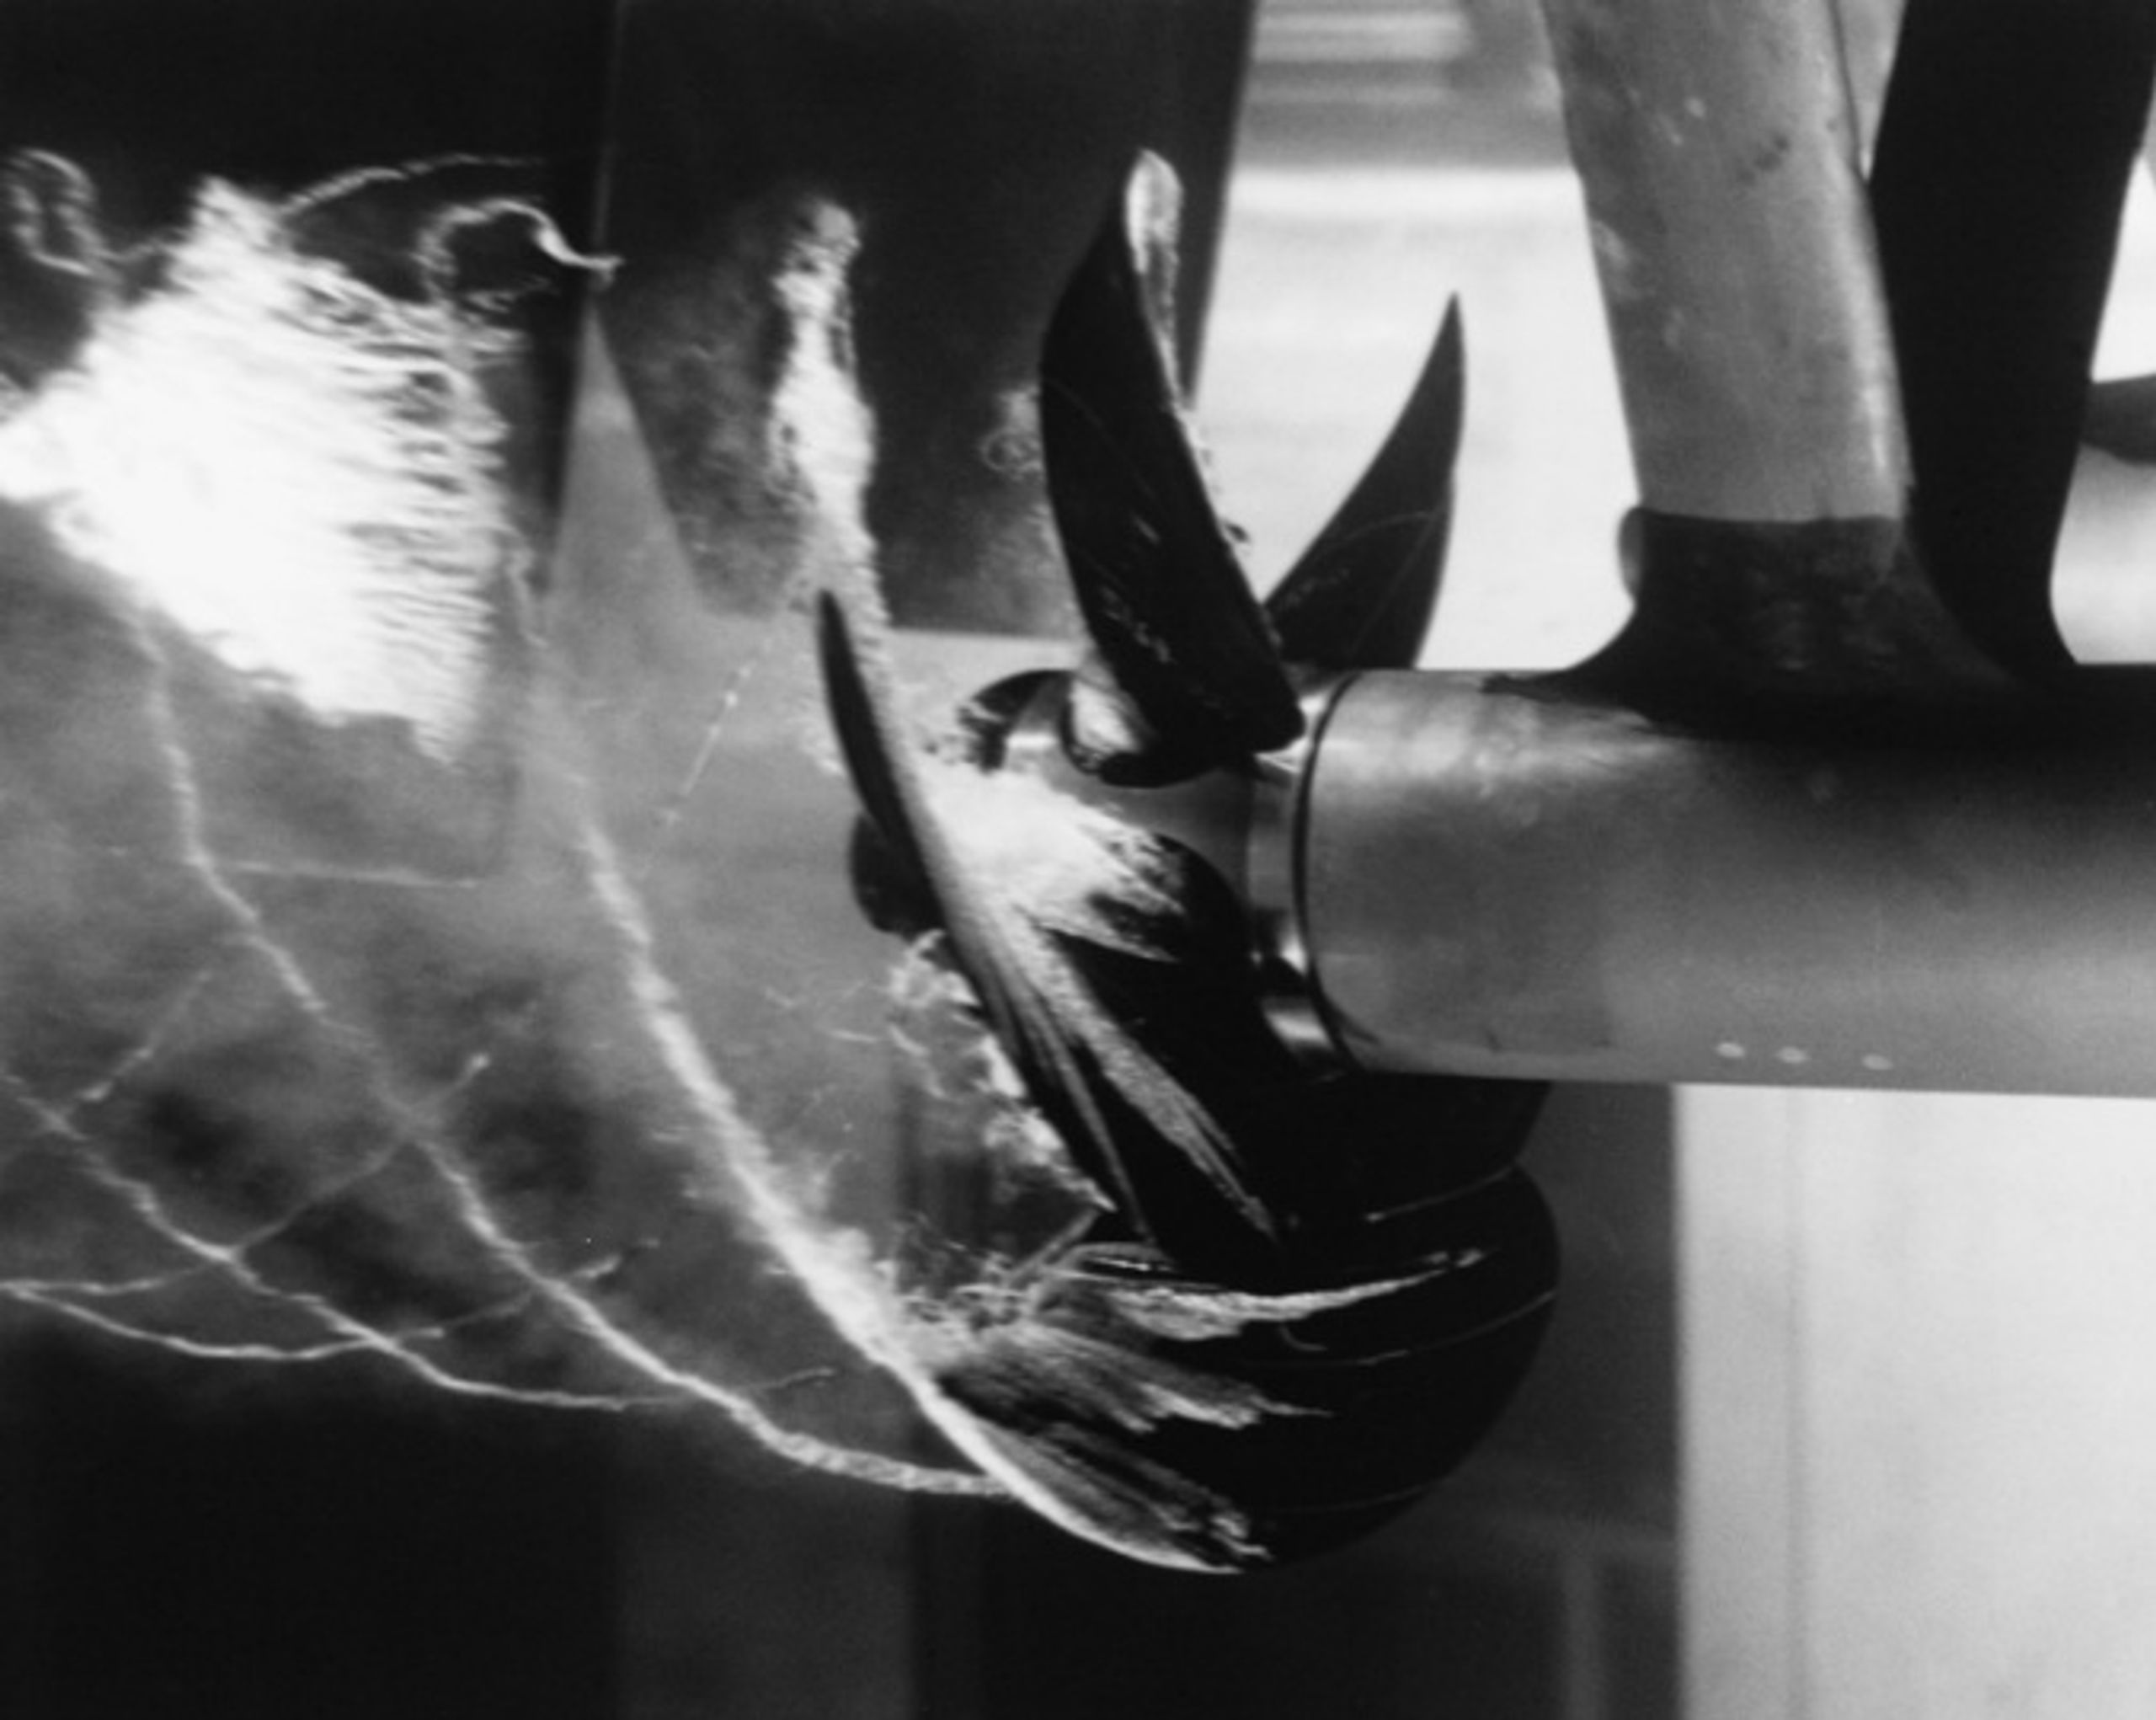
Figure 5. U.S. Navy photograph of a cavitating marine propeller operating in a water tunnel at the David Taylor Model Basin [11]U.S. Navy; Wikimedia Commons; public domain; file: Cavitating prop.jpg; accessed July 21, 2026.
[Figure 5](#figure-5). Cavitating propeller in a water tunnel at the David Taylor
Model Basin. U.S. Navy photograph, public domain [11].
### 4.2 Cavitation Forms on Propulsors
Marine cavitation is classified according to the geometry, persistence,
and location of the vapor structure on the propulsor or nearby
appendages. These categories are not mutually exclusive. For example, an
attached sheet cavity may shed a cloud, while a tip vortex may
simultaneously interact with a rudder or hull surface.
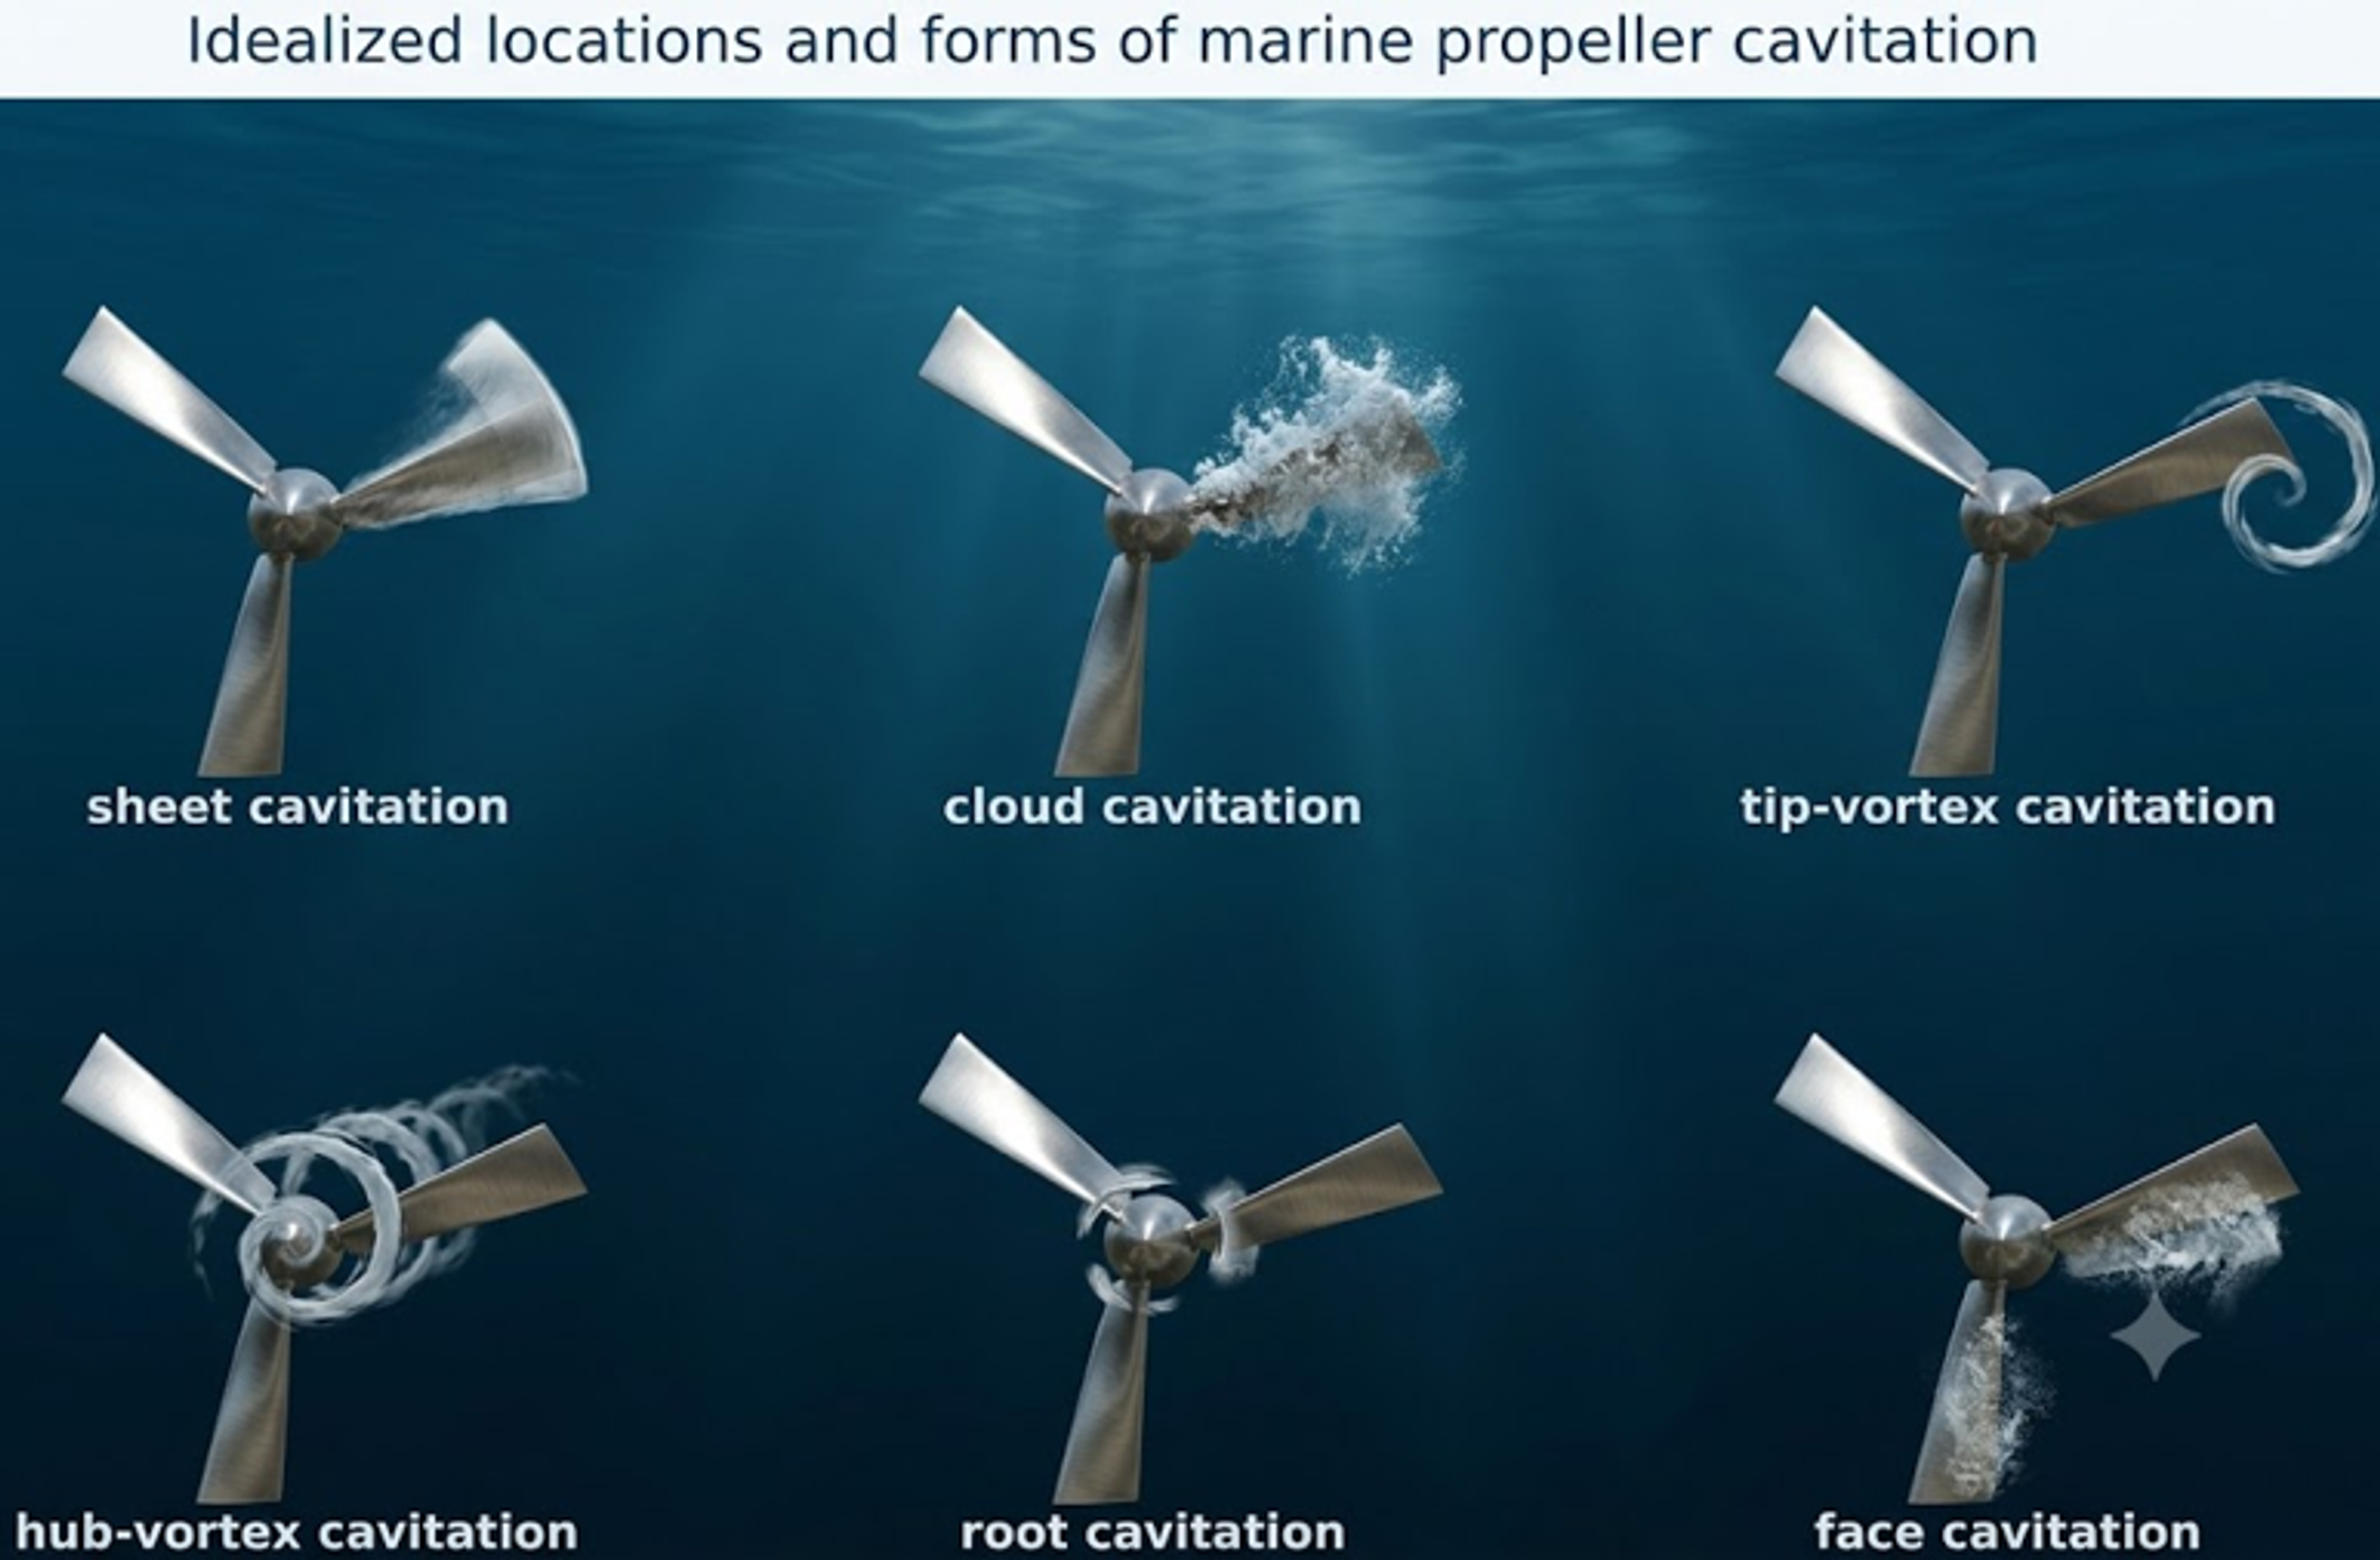
Figure 6. Idealized diagram showing sheet, cloud, tip-vortex, hub-vortex, root, and face cavitation locations on a marine propeller [2]Source: Kozyuk O. Hydrodynamic Cavitation. [Unpublished technical manuscript and supporting data] 2026.
[Figure 6](#figure-6). Idealized locations and forms of marine propeller cavitation
[2].
Table 3. Marine propeller cavitation forms.
| Form | Typical location and cause | Principal consequence |
|-----------------------|-------------------------------------------------------------------------------|------------------------------------------------------------------------------|
| Back sheet cavitation | Suction side near the leading edge under high positive loading. | Thrust and torque change, cloud shedding, erosion, and pressure pulses. |
| Face cavitation | Pressure side under negative incidence, crash astern, or local wake reversal. | Severe off design loading and localized erosion. |
| Tip vortex cavitation | Low pressure core of the rolled up tip vortex. | Radiated noise, long range interaction, and possible rudder or hull erosion. |
| Hub vortex cavitation | Vortex downstream of the hub or boss cap. | Noise, hub and rudder interaction, and efficiency loss. |
| Root cavitation | Blade root or fillet under concentrated loading and three dimensional flow. | Local erosion and crack sensitive surface damage. |
| Cloud cavitation | Periodic breakup of an attached cavity. | Strong unsteady loads, broadband noise, and high erosion potential. |
| Bubble cavitation | Isolated nuclei grow over a blade pressure minimum. | Inception signature and scattered pitting. |
### 4.3 Erosion, Noise, and Structural Loading
The consequence of propeller cavitation depends on cavity extent,
unsteadiness, and collapse location. A stable tip vortex may be governed
primarily by radiated noise, whereas repeated cloud collapse close to a
blade can produce severe erosion. Associated pressure pulses may excite
the hull, stern structure, shaft line, rudder, and other appendages.
Acoustic detectability is important in naval and research applications,
while commercial vessels are commonly constrained by comfort, fatigue,
efficiency, and maintenance requirements [9,10,12,13].
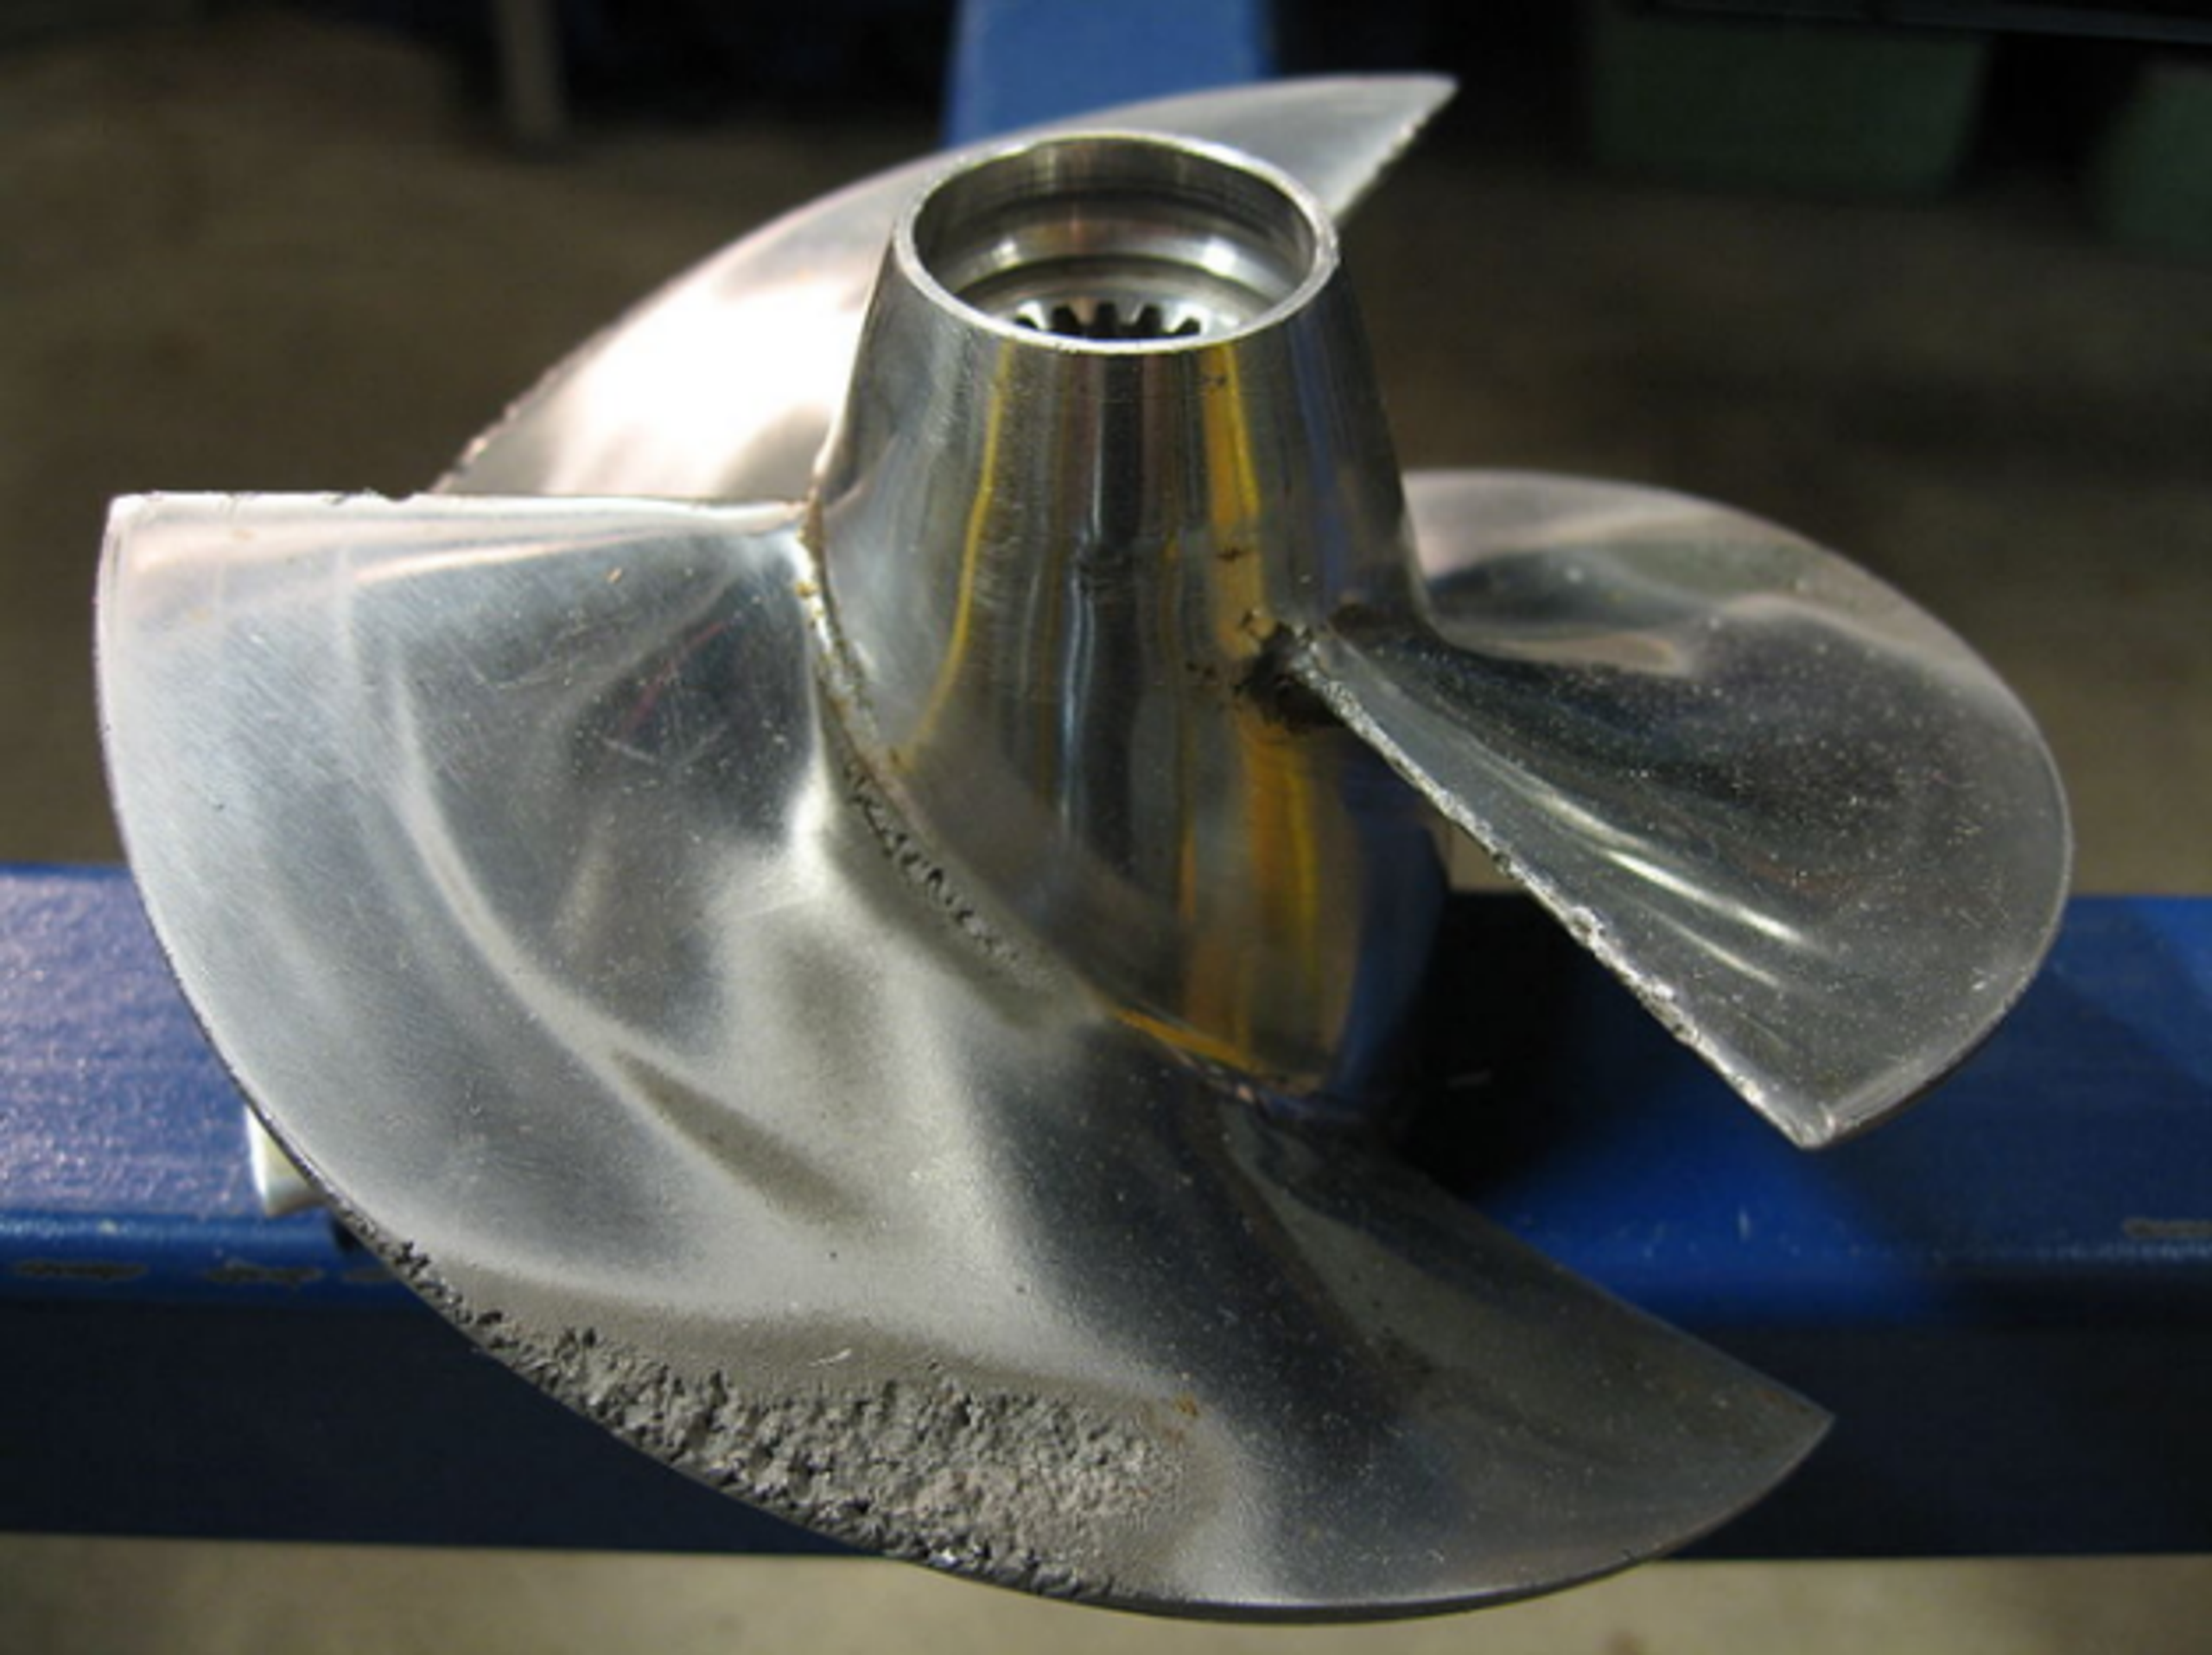
Figure 7. Photograph of cavitation erosion concentrated near the outer edge of a marine propeller blade [14]Erik Axdahl; Wikimedia Commons; CC BY-SA 2.5; file: Cavitation Propeller Damage.JPG; accessed July 21, 2026.
[Figure 7](#figure-7). Cavitation erosion concentrated near the outer edge of a
marine propeller. Photograph by Erik Axdahl [14].
### 4.4 Waterjets, Pumpjets, Hydrofoils, and Rudders
Waterjet and pumpjet systems may cavitate at inlet lips, rotor leading
edges, stator vanes, tip clearances, and nozzle regions. Inlet
distortion, gas ingestion, shallow operation, fouling, and maneuvering
can cause rapid changes in cavitation behavior. Hydrofoils and rudders
may cavitate at leading edges, tips, gaps, hinges, and separated flow
regions. Propeller or tip vortices can also impinge on an appendage and
collapse on a surface that is not the original formation site. The
general diagnostic approach is therefore to identify the minimum
pressure region and track cavity transport to the eventual collapse
region [9,10,12,13,15].
### 4.5 Hydraulic Turbines and Thoma Coefficient
Reaction turbines may cavitate on runner blades, at the runner outlet,
within tip or seal vortices, and in the draft tube. The Thoma cavitation
coefficient sigma_T is given by Eq. (9), where H_a is atmospheric
pressure head, H_v is vapor pressure head, H_s is the suction head or
setting according to the adopted convention, and H is turbine head.
Installation elevation, tailwater level, temperature, and operating
point determine the available coefficient. Plant specific model testing
and manufacturer limits remain necessary because turbine geometry and
scale effects are significant [4].
(9)
### 4.6 Model Tests and Scaling
Cavitation tunnels and model basins reproduce a target cavitation number
while controlling pressure, velocity, water quality, nuclei population,
and observation conditions. Complete similitude is difficult because
Reynolds number, nuclei distribution, surface roughness, gas content,
structural stiffness, and acoustic propagation cannot all be scaled
independently. ITTC procedures therefore define model preparation,
observation, erosion assessment, and noise measurement practices to
improve repeatability [12,13]. Model results should be interpreted
together with the stated nuclei and roughness conditions rather than
from nominal cavitation number alone.
## 5 Negative Effects and Failure Mechanisms
### 5.1 Performance Degradation
Vapor occupies volume that would otherwise transport liquid and alters
momentum transfer. In pumps, cavitation can reduce head, capacity,
efficiency, and stability. In valves, it can limit flow, modify control
gain, and increase actuator demand. On propellers and hydrofoils, it can
alter lift, thrust, torque, and control force. Large cavities may
obstruct passages, create rotating asymmetry, and generate abrupt load
changes [1,4,6,9].
### 5.2 Noise, Vibration, and Pressure Pulsation
Individual bubble collapse produces high frequency content, whereas
cloud shedding and blade interactions create lower frequency modulation.
The resulting fluid forces are transmitted through casings, pipes,
shafts, foundations, and hull structures. A small cavity may be
acoustically prominent without producing measurable erosion, while
collapse remote from the inception site can damage a surface that
appears hydraulically benign. Frequency content should therefore be
interpreted in relation to machinery orders, blade passing frequency,
structural resonances, and transmission paths [4,15].
### 5.3 Erosion, Corrosion, and Fatigue
Cavitation erosion develops through repeated localized liquid impact and
shock loading that produce microscopic plastic deformation, work
hardening, cracking, grain removal, and eventual pit coalescence.
Material loss may include an incubation period, an accelerating stage,
and a later change in rate as surface geometry and residual stress
evolve. Corrosion can remove or weaken protective films between impacts,
while cavitation removes corrosion products and exposes fresh metal. The
combined mechanical and electrochemical loss may exceed the contribution
of either process acting alone [4,9,16,17].
Mean depth of erosion rate (MDER) is commonly reported according to Eq.
(10), where delta V is volume loss, delta m is mass loss, rho_s is solid
density, A is exposed area, and delta t is the reporting interval.
Vibratory apparatus and cavitating liquid jet methods provide
comparative material data, but direct material ranking can vary with
amplitude, liquid properties, temperature, specimen geometry, and
exposure regime [16,17].
(10)
Table 4. Negative effects and representative failure pathways.
| Effect | Immediate mechanism | Potential consequence | Engineering evidence |
|-------------------------------|----------------------------------------------------------|-------------------------------------------------------------------------|-------------------------------------------------------------------------|
| Head, thrust, or control loss | Vapor blockage and altered pressure distribution. | Reduced capacity, unstable control, overspeed risk in coupled systems. | Performance curve shift, flow limitation, transient logs. |
| Noise | Bubble collapse, cloud shedding, vortex oscillation. | Nuisance, detectability, regulatory or comfort issue. | Operating condition correlation and characteristic spectral pattern. |
| Vibration and pulsation | Unsteady fluid force and asymmetric vapor. | Bearing load, piping fatigue, fastener loosening, structural resonance. | Pressure and vibration trends correlated with operating state. |
| Erosion | Microjets, shock waves, and repeated localized strain. | Loss of blade or trim profile, leakage, perforation, debris. | Pit morphology, mass or volume loss, replica or 3D scan. |
| Corrosion acceleration | Film removal and enhanced mass transfer. | Rapid loss in aggressive liquid. | Chemistry, potential, deposits, pit chemistry, material comparison. |
| Thermal and process effects | Two phase volume, local heating or cooling, gas release. | Temperature excursions, degassing, altered reaction or product quality. | Temperature, dissolved gas, composition, residence time. |
| Secondary mechanical failure | Imbalance, hydraulic instability, cyclic load. | Seal, bearing, shaft, weld, or support failure. | Alignment, orbit, shaft current, crack examination, fatigue assessment. |
### 5.4 Why Visible Cavitation Does Not Equal Damage
Visible cavity size does not directly determine erosion severity.
Erosion requires collapse energy to be delivered sufficiently close to a
susceptible surface and repeated often enough to accumulate damage. A
large attached cavity may collapse well downstream and cause little
local erosion, whereas a smaller cloud that repeatedly collapses near a
blade trailing edge can be highly erosive. Dissolved or entrained gas
can increase apparent cavity volume while cushioning collapse. Material
hardness alone is not a universal predictor of resistance because strain
rate response, toughness, phase stability, residual stress, corrosion
resistance, and coating adhesion also influence damage [4,9,17].
## 6 Prevention, Mitigation, and Operational Control
### 6.1 Control Hierarchy
The preferred control strategy is to remove or reduce the hydraulic
cause before relying on surface resistance. The control hierarchy is to
increase the minimum local pressure or reduce velocity, limit cavity
growth, suppress coherent cloud shedding, relocate collapse into the
liquid or a replaceable protected region, reduce rebound intensity by
controlled gas addition where appropriate, and improve material or
coating resistance. Operational limits and maintenance practices
complete the design. Because any intervention can alter the pressure
field, each modification should be checked for a new vapor formation or
collapse location [1,3,4,6,7,8,9,10,12,13].
Table 5. Prevention and mitigation measures.
| Control level | Representative measures | Best suited to | Important caution |
|---------------------------------|---------------------------------------------------------------------------------------------------------------------------|------------------------------------------------------------|-------------------------------------------------------------------------------------------|
| System pressure and static head | Raise suction level or vessel pressure; lower equipment; increase downstream pressure; reduce lift. | Pumps, valves, turbines, and process loops. | Added backpressure or elevation change can move the problem elsewhere. |
| System loss and velocity | Larger pipe, smoother inlet, open valves, clean strainers, lower speed, lower flow, parallel equipment. | Suction systems, bypasses, and high velocity restrictions. | A lower flow can worsen recirculation cavitation in pumps. |
| Geometry | Larger leading edge radius, lower loading, staged trim, diffuser, improved inlet bell, reduced clearance, vortex control. | Impellers, valves, propellers, hydrofoils, and nozzles. | Geometry changes affect efficiency, control range, solids passage, and structural stress. |
| Operating envelope | Preferred operating region, minimum flow, speed schedule, immersion limit, valve travel limit, transient ramp. | Installed machinery with variable duty. | Limits must cover start, stop, emergency, and degraded conditions. |
| Collapse management | Move collapse away from walls, use sacrificial liner, enlarge downstream pipe, controlled air or gas injection. | Residual cavitation that cannot be eliminated. | Gas can reduce performance, alter process chemistry, or increase cavity volume. |
| Material and surface | Tough alloy, hardfacing, resilient coating, polished finish, repairable insert. | Known unavoidable exposure zones. | Material changes do not correct blockage, vibration, or system instability. |
| Inspection and maintenance | Operating condition review, inspection interval, nuclei or gas control, and fouling control. | Critical equipment and variable liquids. | Criteria without operating context can be misleading. |
### 6.2 Pumps and Suction Systems
For pumps, the primary design requirement is adequate NPSHA under every
credible operating condition. The calculation should include the lowest
liquid level, highest liquid temperature, lowest barometric or vessel
pressure, maximum suction line loss, strainer fouling, simultaneous flow
in common headers, and transient acceleration. The pump should then be
selected and operated within an appropriate operating region with an
application specific NPSH margin [1,3].
- Use flooded suction where practical, eliminate high points that can
trap gas, and provide adequate submergence and intake vortex control.
- Select a larger or slower pump, a double suction impeller, an inducer,
or a booster pump when inlet energy density is excessive.
- Maintain inlet clearances and leading edge geometry. Wear can increase
leakage vortices and surface roughness, while aggressive repair can
distort the original inlet profile.
- Use variable speed control rather than routine suction throttling when
permitted by the system and process.
- Provide minimum flow protection and avoid prolonged shutoff or very
low flow operation. Internal recirculation can generate heat and raise
the local vapor pressure.
- Verify the installed pump datum, pressure reference location, and
velocity head convention when comparing field measurements with
manufacturer performance curves.
### 6.3 Valves and Piping
Control valve mitigation focuses on limiting pressure reduction per
stage and managing downstream pressure recovery. Multistage and
multipath trims divide the total pressure drop, while lower recovery
valve styles, diffusers, larger downstream piping, and straight outlet
runs can reduce collapse intensity at vulnerable surfaces. A valve that
operates most of its service life near the seat may require a different
trim or a smaller parallel valve rather than a larger body. In dirty
service, minimum passage size and plugging risk may govern selection of
an otherwise effective anti cavitation design [6,7,8].
### 6.4 Marine Propulsors and Hydrofoils
Marine mitigation measures include increasing blade area, reducing local
loading, applying appropriate skew, refining leading edge and tip
geometry, improving the wake, maintaining adequate immersion,
controlling surface finish, and defining operating limits for speed and
maneuvering. Boss cap fins, ducts, preswirl stators, and wake equalizing
devices can modify vortices and inflow, but their net benefit must
account for resistance, structural load, fouling, and off design
behavior. Controlled air injection can reduce erosive collapse or
radiated noise in specialized applications, although it may reduce
efficiency and alter acoustic signatures [9,10,12,13].
### 6.5 Materials, Coatings, and Surface Strategy
Table 6. Materials and surface strategies for cavitation exposure.
| Strategy | Potential benefit | Limitations and selection factors |
|----------------------------------------------|---------------------------------------------------------------------------|--------------------------------------------------------------------------------------------|
| Tough stainless or duplex alloy | Good combination of corrosion resistance, strength, and strain hardening. | Weld procedure, phase balance, chloride cracking, cost, and galvanic compatibility. |
| Nickel aluminum bronze or other marine alloy | Established propeller and seawater service with repair experience. | Casting quality, selective corrosion, weld repair, and actual cavitation regime. |
| Hardfacing or thermal spray | High hardness and local repairability. | Brittleness, porosity, residual stress, bond strength, and edge failure. |
| Elastomeric or compliant coating | Absorbs impact and can delay pitting. | Adhesion, swelling, temperature, abrasion, edge lifting, and process compatibility. |
| Polishing and profile restoration | Reduces roughness nuclei and local separation. | Cannot correct an adverse bulk pressure field; excessive grinding changes geometry. |
| Sacrificial or replaceable insert | Moves maintenance to a controlled component. | Interface sealing, fastener fatigue, debris, and replacement access. |
| Cathodic or corrosion control | Reduces electrochemical contribution in conductive liquids. | Does not prevent mechanical impact; excessive hydrogen may affect some alloys or coatings. |
Comparative cavitation tests are useful for material screening, but
field performance also depends on geometry, impact spectrum, corrosion,
residual stress, weld quality, and repair practice. A very hard material
may fail by brittle spallation, whereas a tougher material may better
accommodate repeated strain. Surface finish should be documented because
roughness influences both nuclei activation and local stress
concentration [4,9,16,17].
### 6.6 Operational Control and Verification
Operational control may use a speed schedule, minimum pressure override,
minimum flow recirculation, valve travel restriction, backpressure
control, temperature limit, or a marine speed and immersion envelope.
The controlled variable should correspond to the governing mechanism.
For example, reducing pump flow may improve NPSHA while worsening inlet
recirculation, and increasing valve backpressure may suppress cavitation
while reducing process throughput. Verification should repeat the
original performance assessment and specifically check for displaced
cavitation damage.
## 7 Conclusions
Cavitation control requires identification of both the vapor formation
region and the subsequent collapse region. Across pumps, valves, piping
restrictions, marine propulsors, hydrofoils, and turbines, the governing
variables are the local pressure minimum, vapor pressure, velocity
field, pressure recovery, operating point, and exposure of nearby
surfaces. NPSH margins, cavitation indices, model tests, and performance
trends provide useful quantitative indicators, but none should be
applied without the definition and operating context from which it was
derived. Effective mitigation therefore combines hydraulic design,
operating envelope control, geometry, material selection, maintenance,
and post modification verification. Where cavitation cannot be
eliminated, engineering effort should focus on reducing cavity growth,
controlling collapse location and intensity, and protecting components
that remain exposed.
## Nomenclature
The following nomenclature defines the symbols and abbreviations used in
this article. Unless otherwise stated, quantities are expressed in SI
units.
| Symbol | Definition | SI unit or status |
|-------------------|-------------------------------------------------------|----------------------|
| A | Exposed area used in erosion measurements | m² |
| | Pressure coefficient | dimensionless |
| | Small amplitude bubble resonance frequency | Hz |
| | Liquid pressure recovery factor for a control valve | dimensionless |
| H | Pump or turbine head | m |
| | Suction line friction and minor loss | m |
| M | Absolute NPSH margin | m |
| | NPSH margin ratio | dimensionless |
| MDER | Mean depth of erosion rate | m s⁻¹ or µm h⁻¹ |
| n | Rotational speed | s⁻¹ or r min⁻¹ |
| | Net positive suction head available | m |
| | Net positive suction head required | m |
| | NPSH at a 3 percent pump head drop | m |
| | Suction specific speed under a stated unit convention | convention dependent |
| p | Absolute static pressure | Pa |
| | Pressure at the bubble wall | Pa |
| | Saturation vapor pressure | Pa |
| | Pressure at the vena contracta | Pa |
| | Hydraulic power | W |
| | Pump shaft power | W |
| Q | Volumetric flow rate | m³ s⁻¹ |
| R | Bubble radius | m |
| | Ideal collapse time | s |
| V | Mean liquid velocity | m s⁻¹ |
| | Local resultant propeller velocity at radius r | m s⁻¹ |
### Greek Letters
| Symbol | Letter name | Meaning in this chapter |
|---------------|-------------|--------------------------------------|
| γ | Gamma | Surface tension |
| κ | Kappa | Polytropic exponent |
| μ | Mu | Dynamic viscosity |
| ρ | Rho | Liquid or solid density |
| σ | Sigma | Cavitation number |
| | Sigma | Valve cavitation index |
| | Sigma | Thoma cavitation coefficient |
| η | Eta | Efficiency |
| Δ | Delta | Finite difference or measured change |
## Bibliography
[1] Hydraulic Institute. ANSI/HI 9.6.1-2024: Rotodynamic Pumps:
Guideline for NPSH Margin. Parsippany, NJ: Hydraulic Institute; 2024.
[2] Kozyuk O. Hydrodynamic Cavitation. [Unpublished technical
manuscript and supporting data] 2026.
[3] International Organization for Standardization. ISO 9906:2012:
Rotodynamic Pumps, Hydraulic Performance Acceptance Tests, Grades 1, 2
and 3. Geneva: ISO; 2012.
[4] Brennen CE. Cavitation and Bubble Dynamics. New York: Oxford
University Press; 1995.
[5] Milan JJ. Cavitation damage on a centrifugal pump impeller
[photograph]. Wikimedia Commons; CC BY-SA 3.0. File: Usure par
cavitation d'un impulseur de pompe centrifuge 03.jpg. Accessed July 21,
2026.
[6] International Society of Automation. ISA RP75.23-1995 (R2024):
Considerations for Evaluating Control Valve Cavitation. Research
Triangle Park, NC: ISA; 2024.
[7] Emerson Automation Solutions. Control Valve Handbook. 6th ed.
Marshalltown, IA: Fisher Controls International; 2023.
[8] Jin ZJ, Gao ZX, Qian JY, Wu Z, Sunden B. A parametric study of
hydrodynamic cavitation inside globe valves. Journal of Fluids
Engineering. 2018;140(3):031208. doi:10.1115/1.4038090.
[9] Kuiper G. Cavitation in Ship Propulsion. Delft: Delft University
of Technology OpenCourseWare; 2012.
[10] Breslin JP, Andersen P. Hydrodynamics of Ship Propellers.
Cambridge: Cambridge University Press; 1994.
[11] U.S. Navy. Cavitating propeller in the David Taylor Model Basin
[photograph]. Wikimedia Commons; public domain. File: Cavitating
prop.jpg. Accessed July 21, 2026.
[12] International Towing Tank Conference. Recommended Procedure
7.5-02-03-03.5: Cavitation Induced Erosion on Propellers and Rudders,
Model Scale Experiments and Numerical Guidance. Rev. 03; 2024.
[13] International Towing Tank Conference. Recommended Guideline
7.5-02-03-03.9: Model Scale Propeller Cavitation Noise Measurements.
Rev. 03; 2024.
[14] Axdahl E. Cavitation erosion damage on a marine propeller
[photograph]. Wikimedia Commons; CC BY-SA 2.5. File: Cavitation
Propeller Damage.JPG. Accessed July 21, 2026.
[15] Arndt REA. Cavitation in vortical flows. Annual Review of Fluid
Mechanics. 2002;34:143-175. doi:10.1146/annurev.fluid.34.082301.114957.
[16] ASTM International. ASTM G32-16(2021)e1: Standard Test Method for
Cavitation Erosion Using Vibratory Apparatus. West Conshohocken, PA:
ASTM International; 2021.
[17] ASTM International. ASTM G134-17(2023): Standard Test Method for
Erosion of Solid Materials by a Cavitating Liquid Jet. West
Conshohocken, PA: ASTM International; 2023.