
Technical publication
Back to publications
Reactors & equipment
Anti-Cavitation Control Valves
okozyuk.com
Published
Read complete publication for whole-document Find and printing. Browser Find and native printing on this reader include only loaded content.
Abstract
Cavitation in liquid control valves results from local pressure reduction below vapor pressure followed by vapor collapse during pressure recovery. The associated microjets, pressure waves, vibration, and unsteady hydraulic forces can cause trim erosion, pressure boundary damage, noise, loss of control authority, and reduced service life. This article presents a unified engineering treatment of cavitation physics, liquid valve sizing parameters, pressure recovery behavior, and anti-cavitation trim architecture. The discussion relates cavitation indices and liquid choking criteria to practical design strategies, including staged pressure reduction, opposed jet bubble isolation, stacked disk and concentric sleeve trims, axial multistage geometries, multipath trims, dirty service configurations, and fixed energy dissipators. Material selection, seat protection, outlet velocity, actuator stability, solids tolerance, and system layout are examined as coupled design variables. Application considerations are summarized for water distribution, power generation, oil and gas, petrochemical, and low flow injection services. A worked sizing example demonstrates preliminary severity assessment, choked flow capacity, stage count estimation, and hydraulic power dissipation. The article also reviews field diagnosis, maintenance, computational fluid dynamics, patent development, topology optimization, and additive manufacturing. Final valve selection should be based on the complete operating envelope and tested coefficients for the specific valve and trim geometry. Keywords: cavitation; control valves; anti-cavitation trim; pressure staging; liquid choking; valve sizing; severe service.
2. Physical Basis of Cavitation in a Control Valve
2.1 Continuity, acceleration, and the vena contracta
For steady incompressible flow, continuity relates volumetric flow rate to local flow area and mean velocity.
As the effective flow area decreases near the throttling edge, mean velocity increases. The maximum mean velocity and minimum mean pressure occur at or near the vena contracta, typically downstream of the physical restriction. Its location depends on valve geometry, opening, flow direction, and turbulent separation. [1, 2, 13-15]
An engineering energy balance between an upstream station and a local station can be written as
The loss term includes viscous dissipation, mixing, separation, impingement, and repeated acceleration and deceleration. In a control valve, total pressure decreases monotonically, whereas static pressure can fall sharply and then recover partially. Instantaneous local pressure can be substantially lower than the mean because vortex cores and turbulent fluctuations generate localized pressure minima. Cavitation can therefore begin before a one-dimensional mean-pressure profile reaches vapor pressure. [3, 15, 22-24]
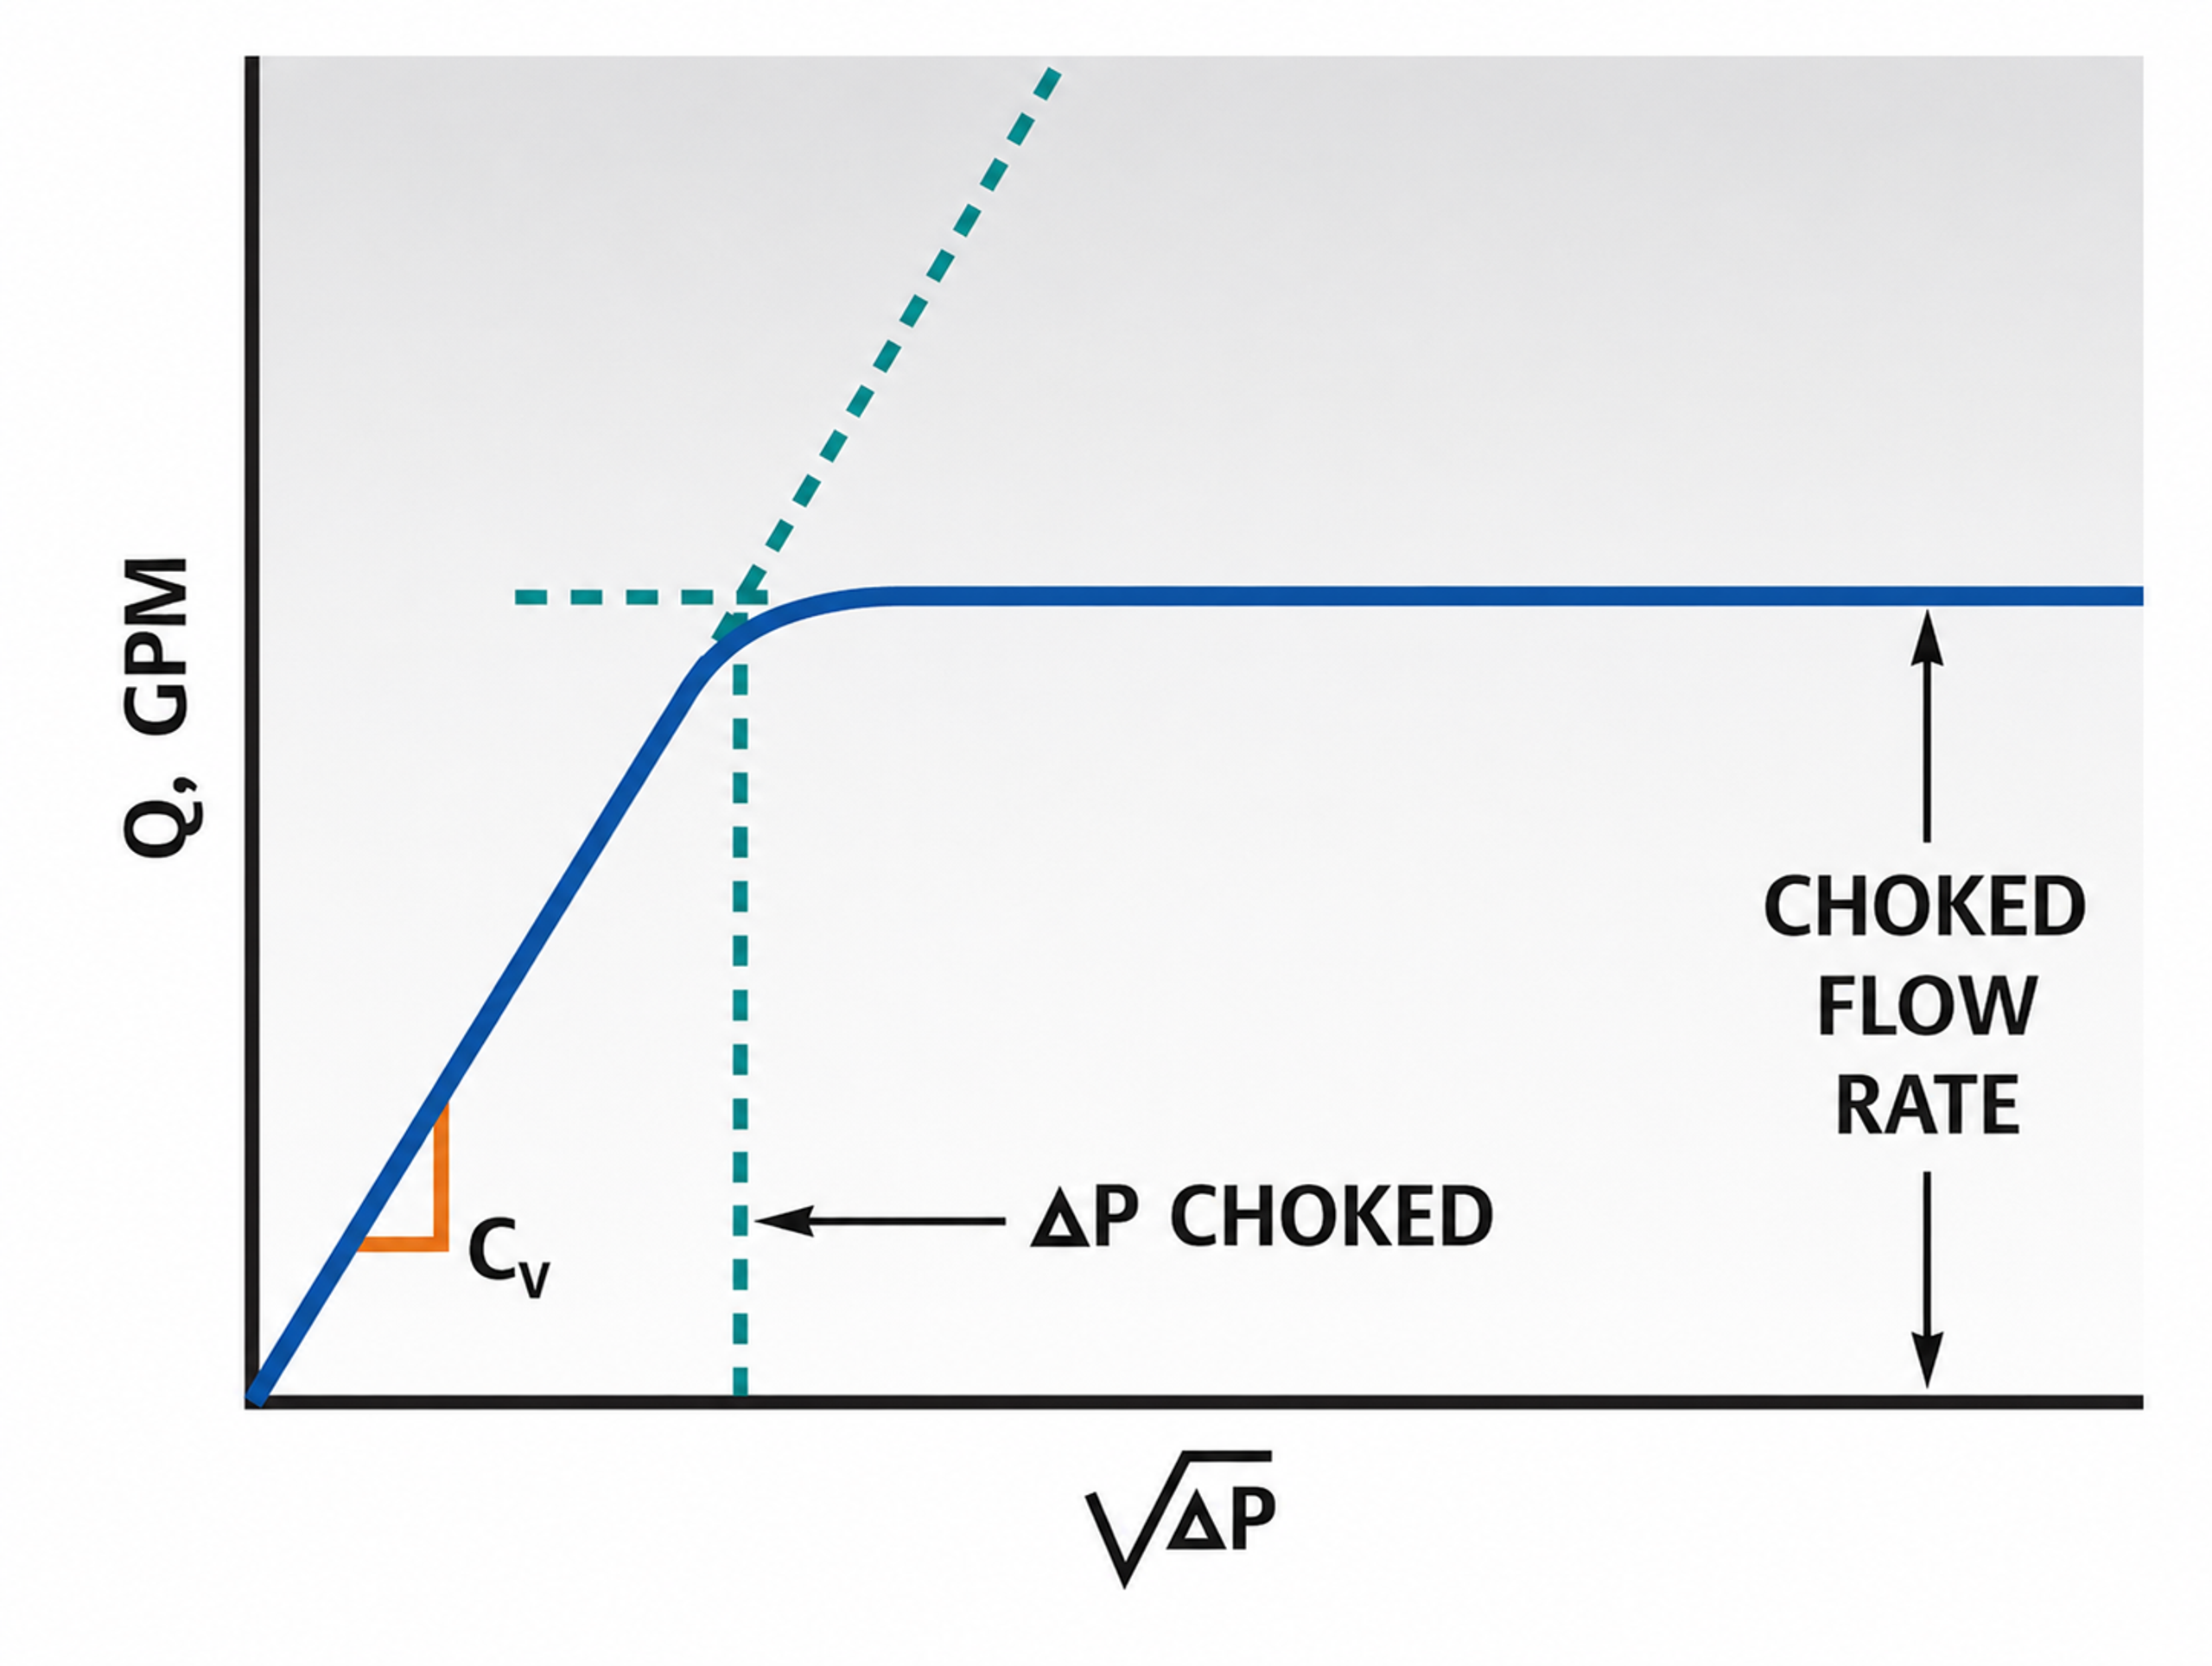
Figure 4. Choked flow behavior: flow rate versus the square root of pressure drop.
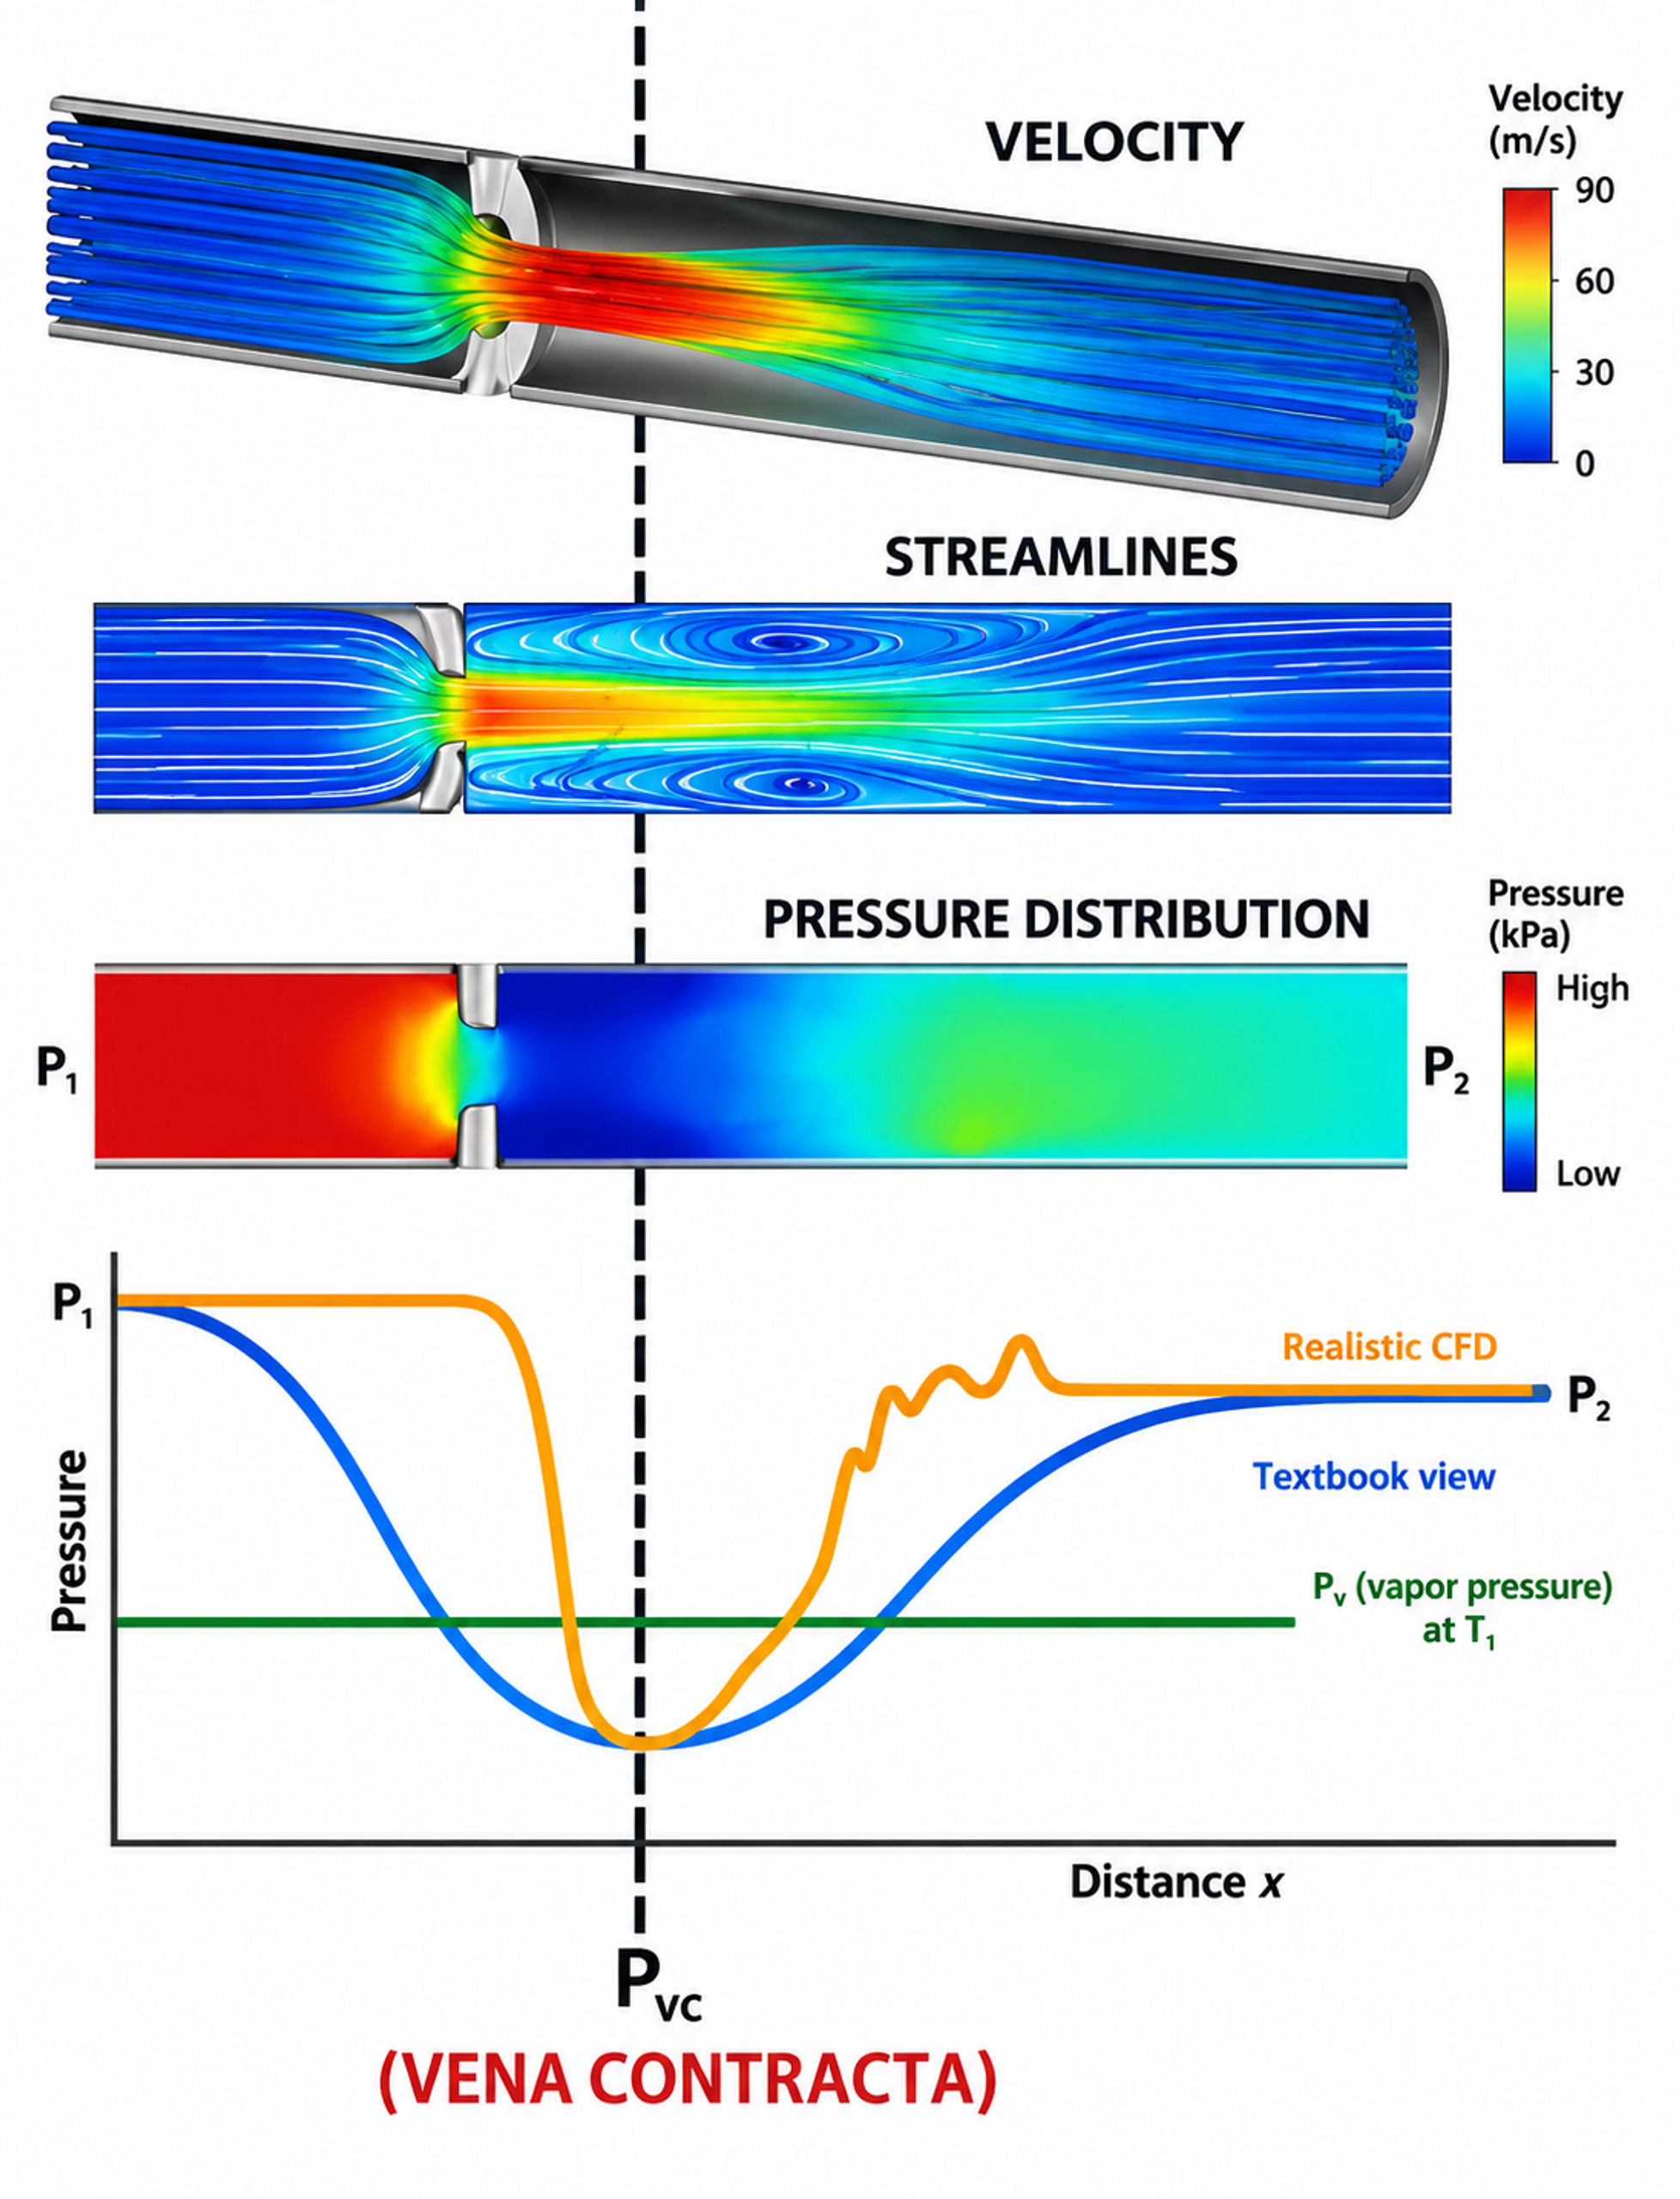
Figure 5. Mean pressure, local velocity, streamlines, and a CFD based pressure trace near a restriction.
2.2 Cavitation nuclei and incipient cavitation
A perfectly homogeneous liquid can sustain large tension, but industrial liquids contain dissolved gas, microscopic bubbles, crevices, suspended particles, and surface imperfections that act as nuclei. A spherical nucleus of radius is in mechanical equilibrium when the external pressure and surface tension balance the vapor and gas pressures inside the bubble. [3, 21]
If the enclosed gas changes approximately isothermally, a simplified gas relation is
As external pressure decreases, the bubble radius increases. Beyond a critical condition, the equilibrium becomes unstable and rapid growth begins. Incipient cavitation depends on the nuclei population, dissolved gas, temperature, surface tension, residence time, and the spectrum of pressure fluctuations. Because these variables are rarely characterized in industrial service, valve-sizing methods generally use vapor pressure and experimentally determined valve coefficients as practical reference quantities. [3, 21-24]
2.3 Bubble growth and collapse
Spherical bubble dynamics are commonly described by the Rayleigh Plesset equation. One standard form is
where represents the pressure inside the bubble. This equation shows that collapse rate increases when the surrounding pressure rises above the internal pressure. It also shows the roles of inertia, surface tension, and viscosity. For an empty spherical cavity collapsing under a constant pressure difference, the classical Rayleigh estimate is
Near a solid boundary, final bubble collapse is generally asymmetric. A pressure gradient across the bubble can drive a liquid microjet through the cavity toward the wall. Microjet impact and the associated pressure wave generate high local stress over a small area and short duration. Repeated impacts can initiate plastic deformation, fatigue, cracking, and progressive material removal. [3, 15, 21]
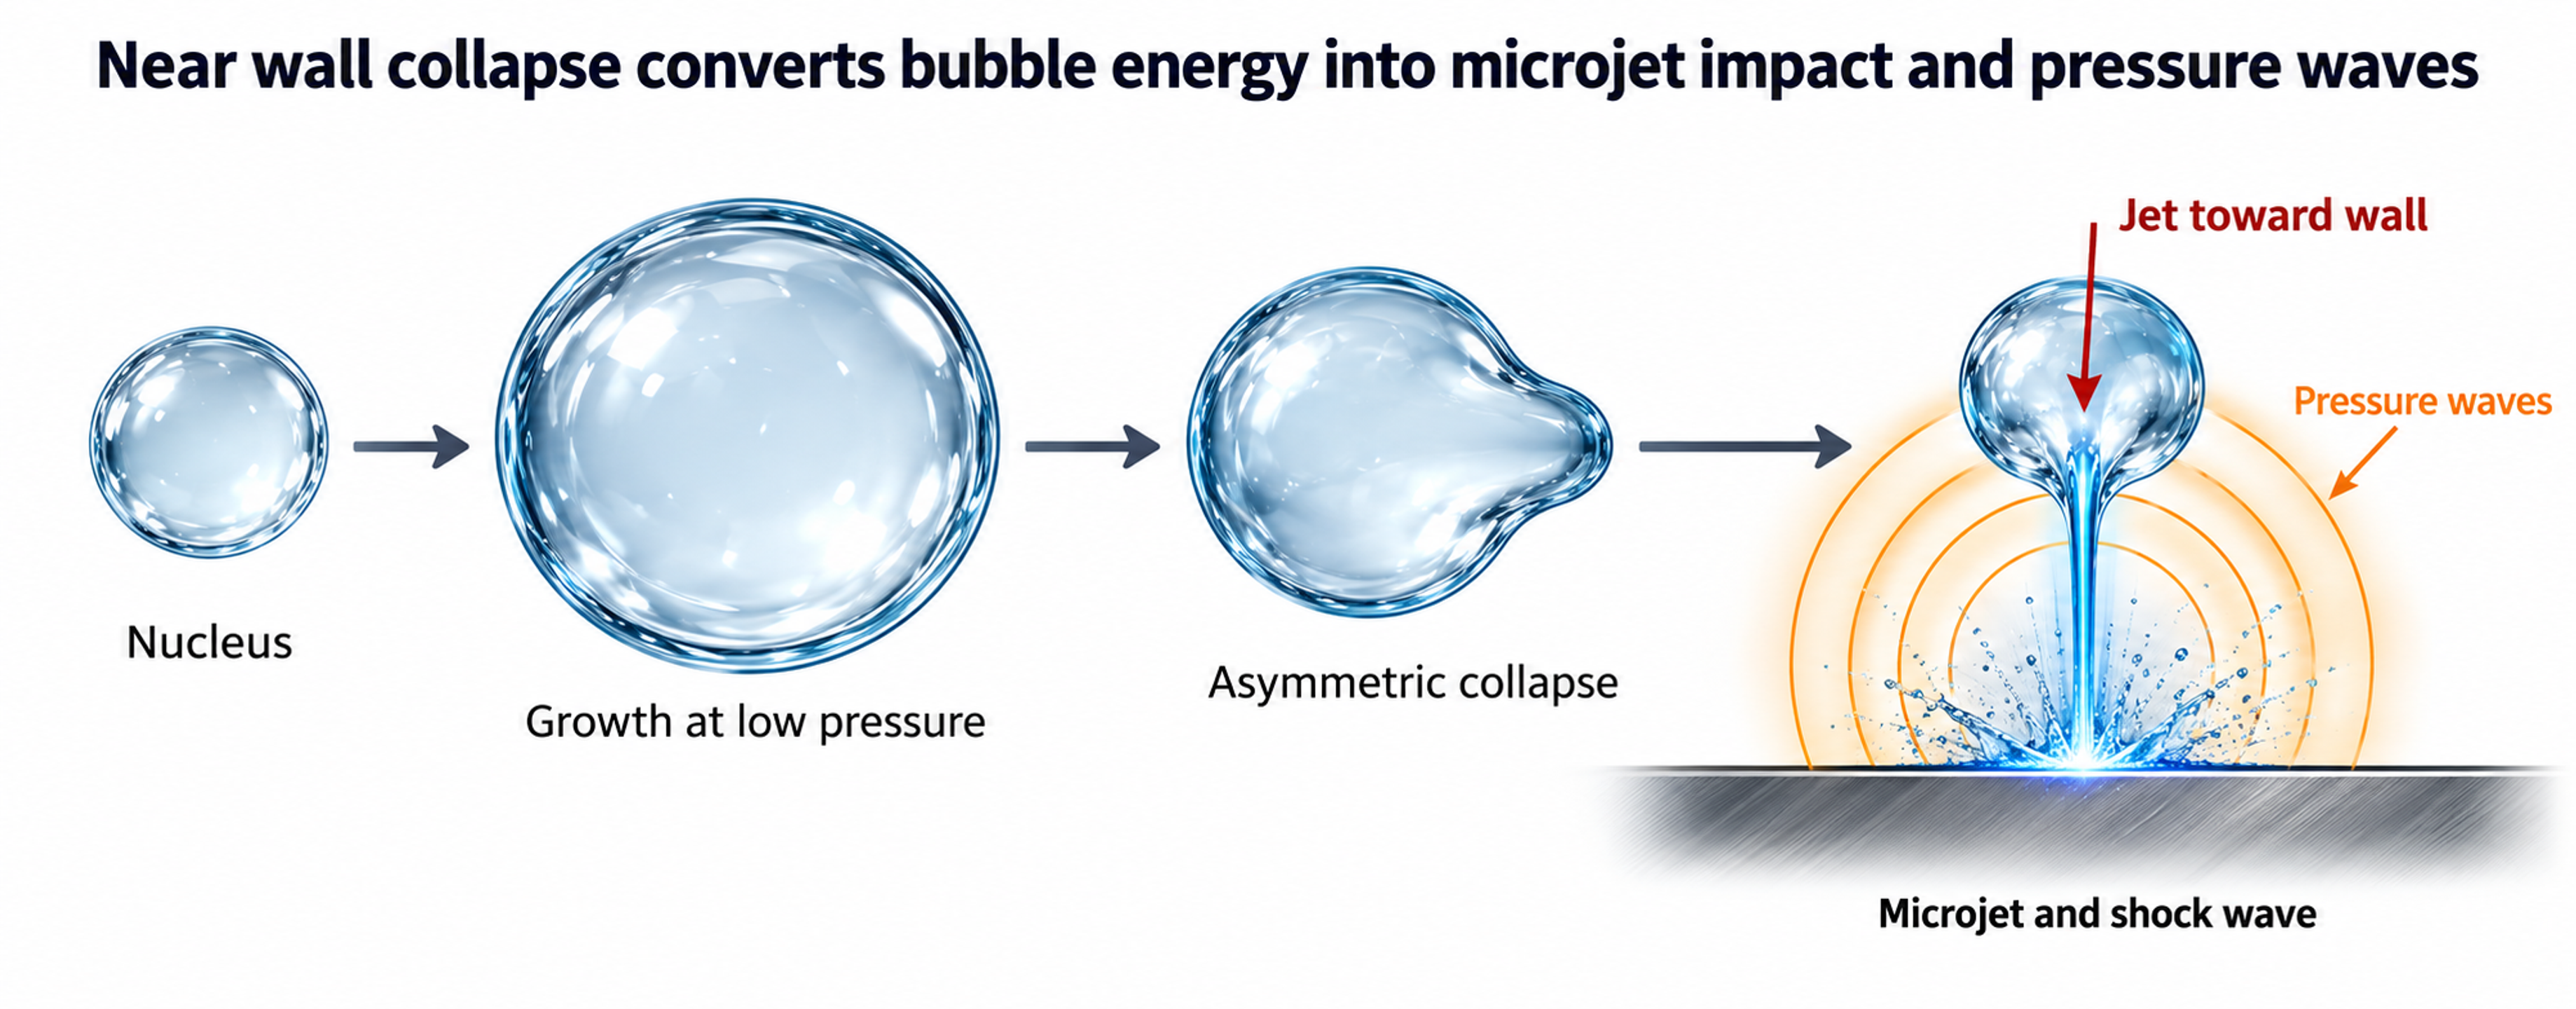
Figure 5. Stages of near-wall bubble growth and collapse.
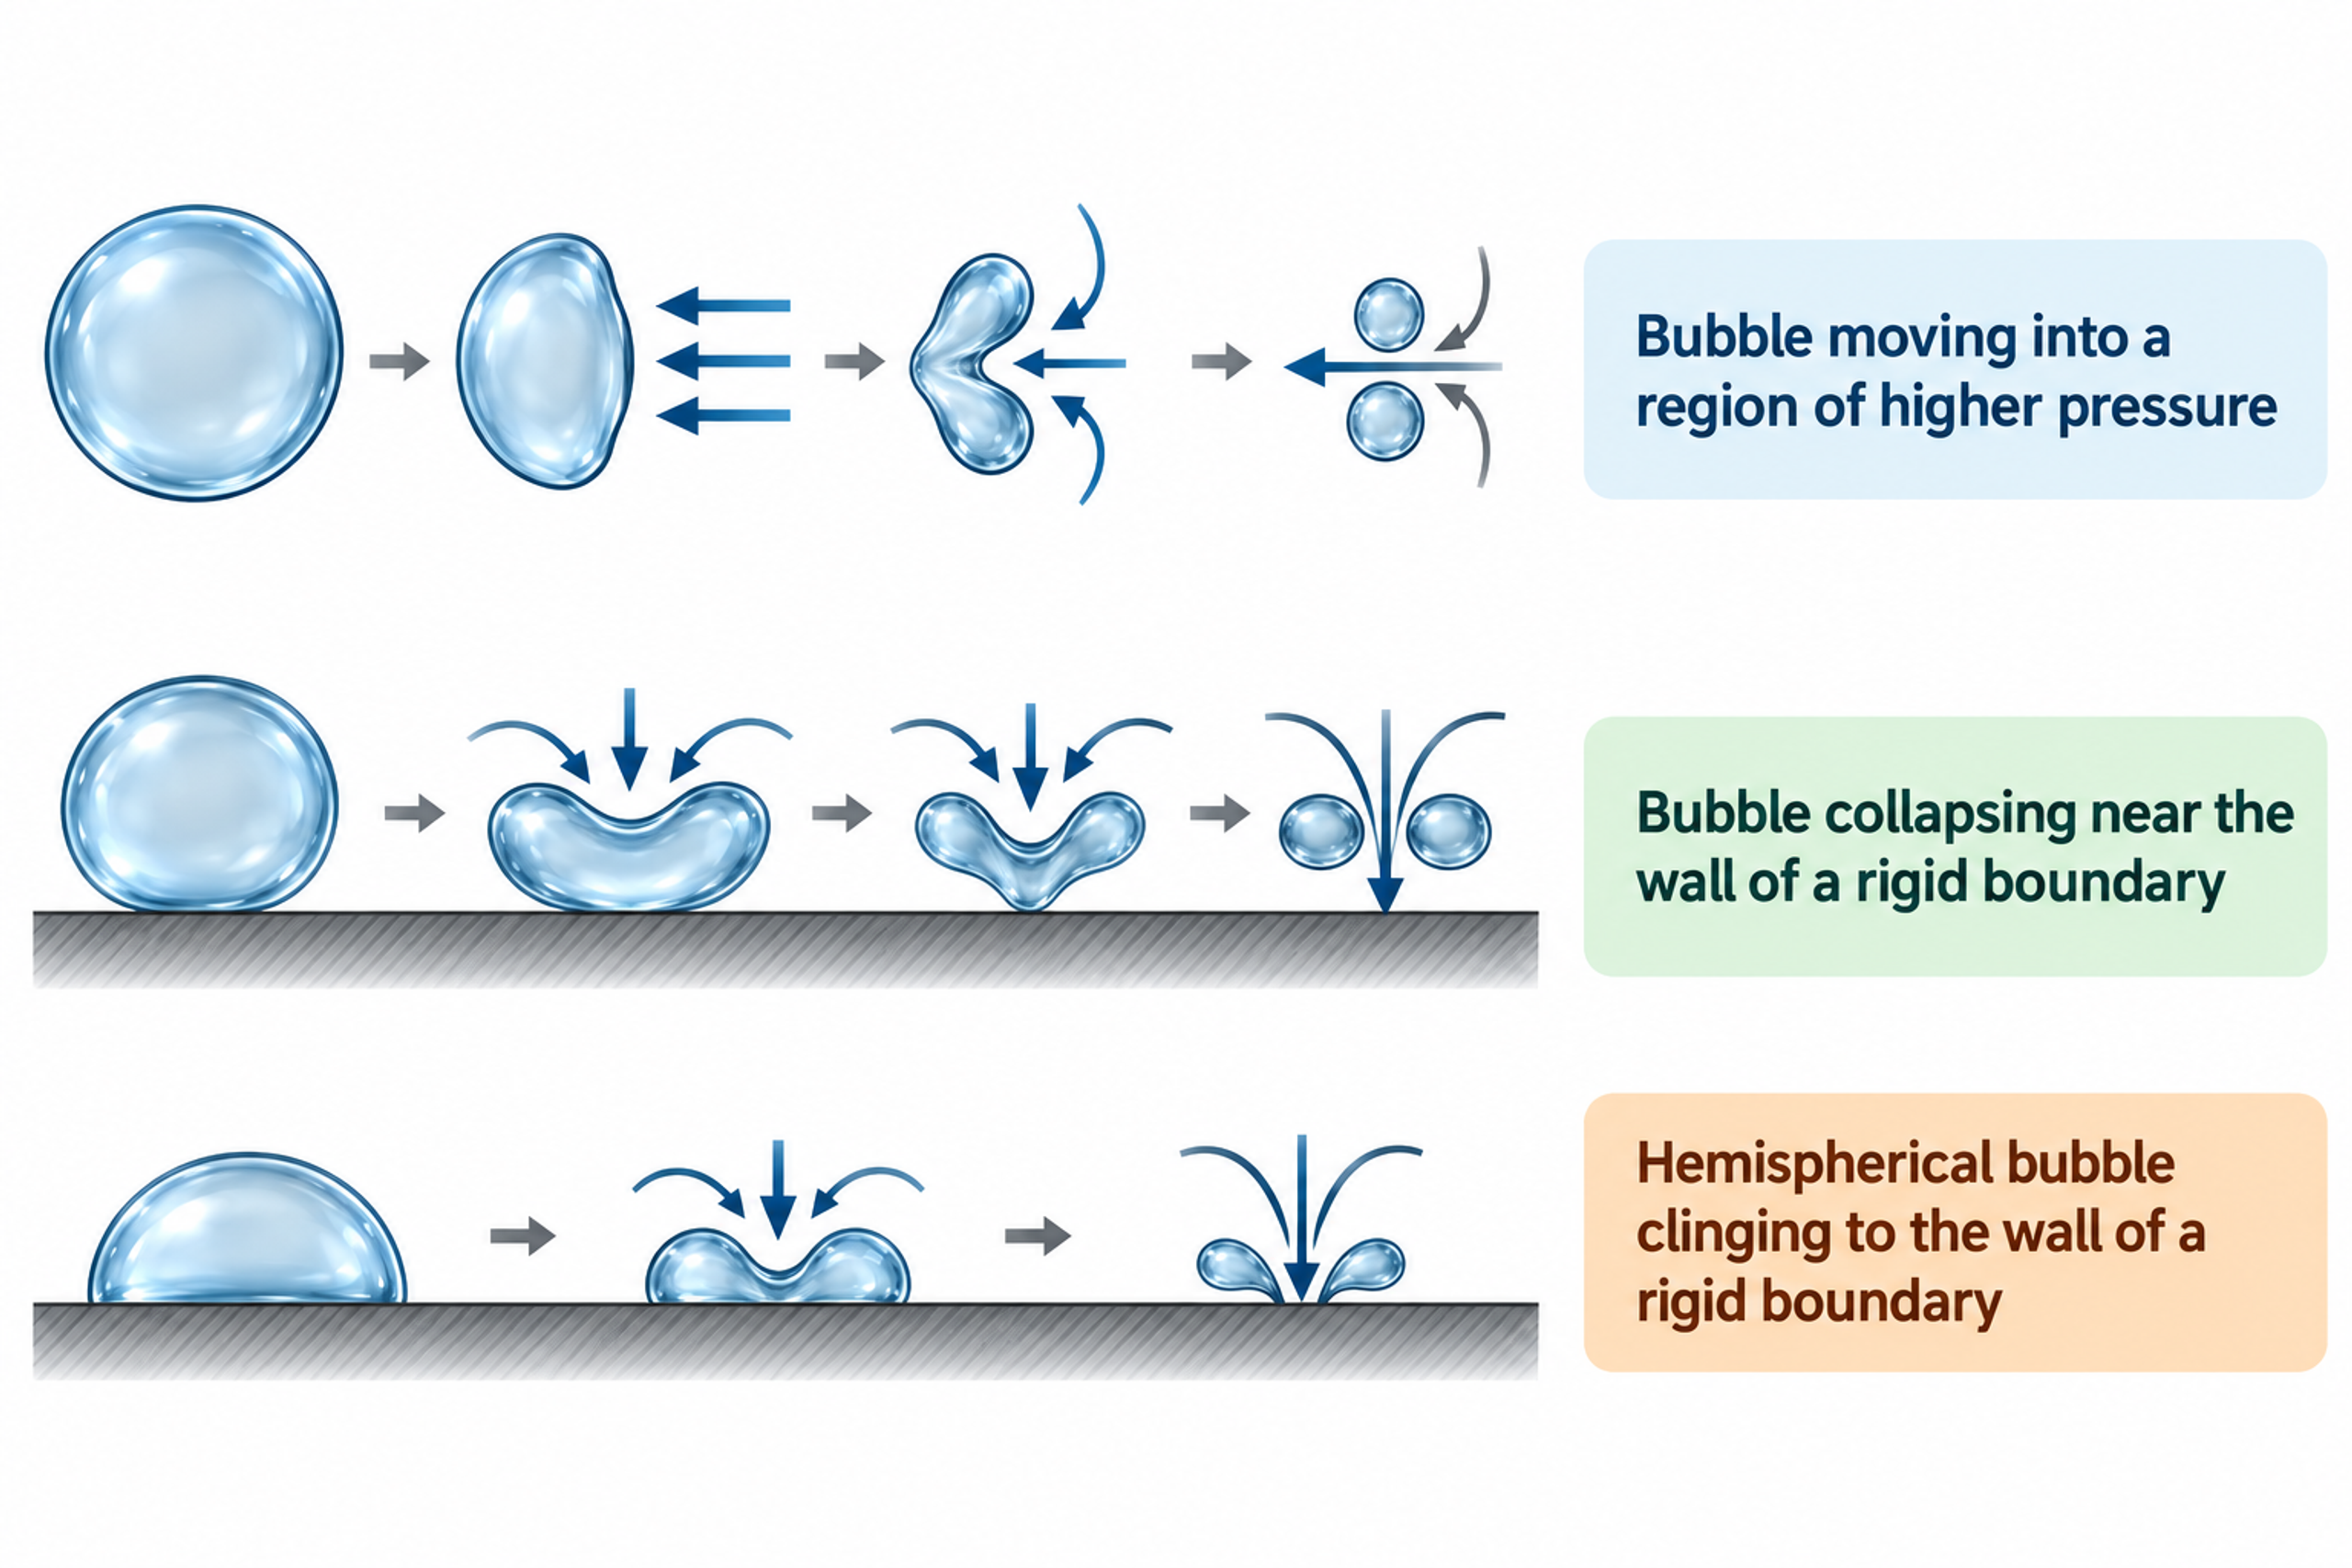
Figure 6. Bubble collapse near free and solid boundaries, with the associated jet velocity relation.
2.4 Cavitation zone, residence time, and damage location
The cavity field is a distributed, time-dependent structure rather than a single bubble at a fixed location. Vapor structures form in shear layers and vortex cores, convect downstream, grow while local pressure remains low, and collapse as pressure recovery intensifies. The highest damage rate often occurs near the downstream end of the visible cavity region, where a fraction of bubbles collapse sufficiently close to a solid surface to transfer high impact energy. [3, 15, 21]
The location of bubble collapse is therefore an important design variable. Opposed jets and perforated plugs can move the collapse region toward the liquid core. Staged trims can suppress vapor formation by limiting the pressure drop imposed by each stage. Expanded outlet bodies and larger valve galleries increase separation between the cavity field and the pressure boundary, while protected seats keep the highest-velocity region away from shutoff surfaces. [1, 2, 9-12, 14, 15]
2.5 Noise, vibration, and unsteady force
Each bubble-collapse event generates a broadband pressure pulse. A developed cavity field contains many such events, with a spectrum governed by bubble size, pressure ratio, valve opening, trim geometry, pipe transmission, and the acoustic response of the system. As the cavity region expands, cavitation noise often shifts toward lower frequencies, while structural vibration can excite stems, plugs, cages, actuators, and pipe supports. [3, 10, 15, 20]
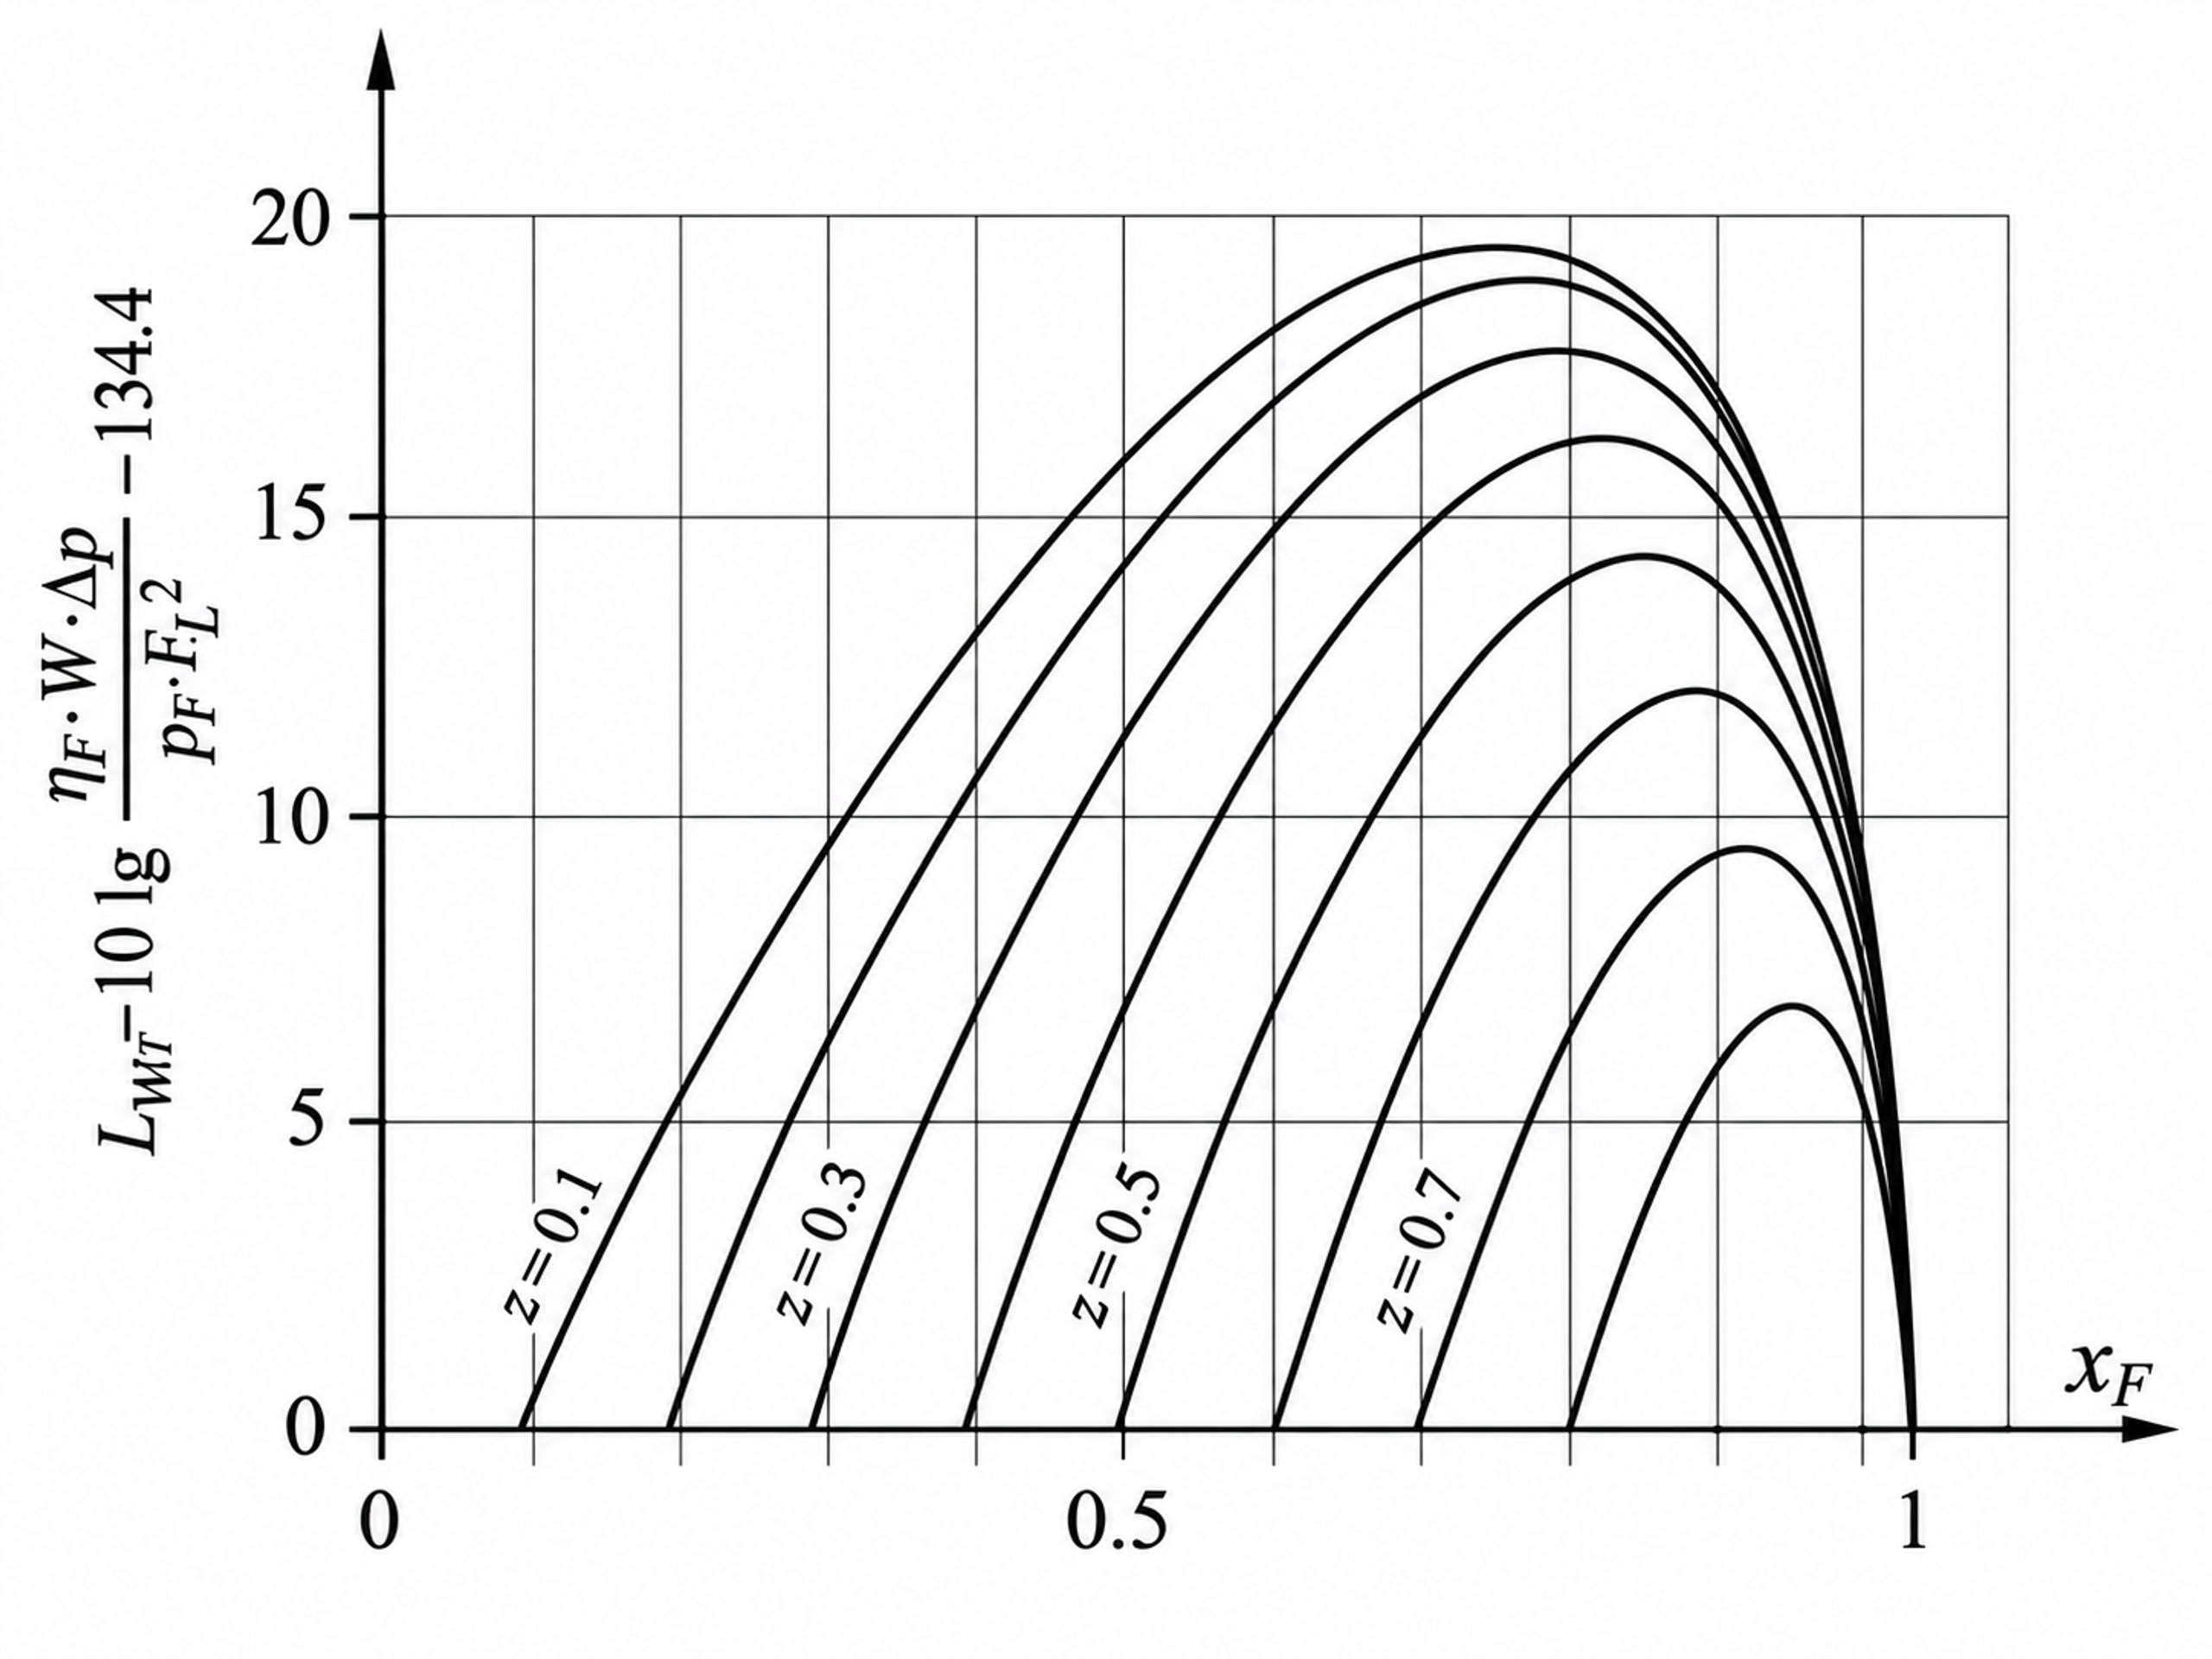
Figure 7. Sound power for standard valves with a parabolic plug (ΔLF = 0).
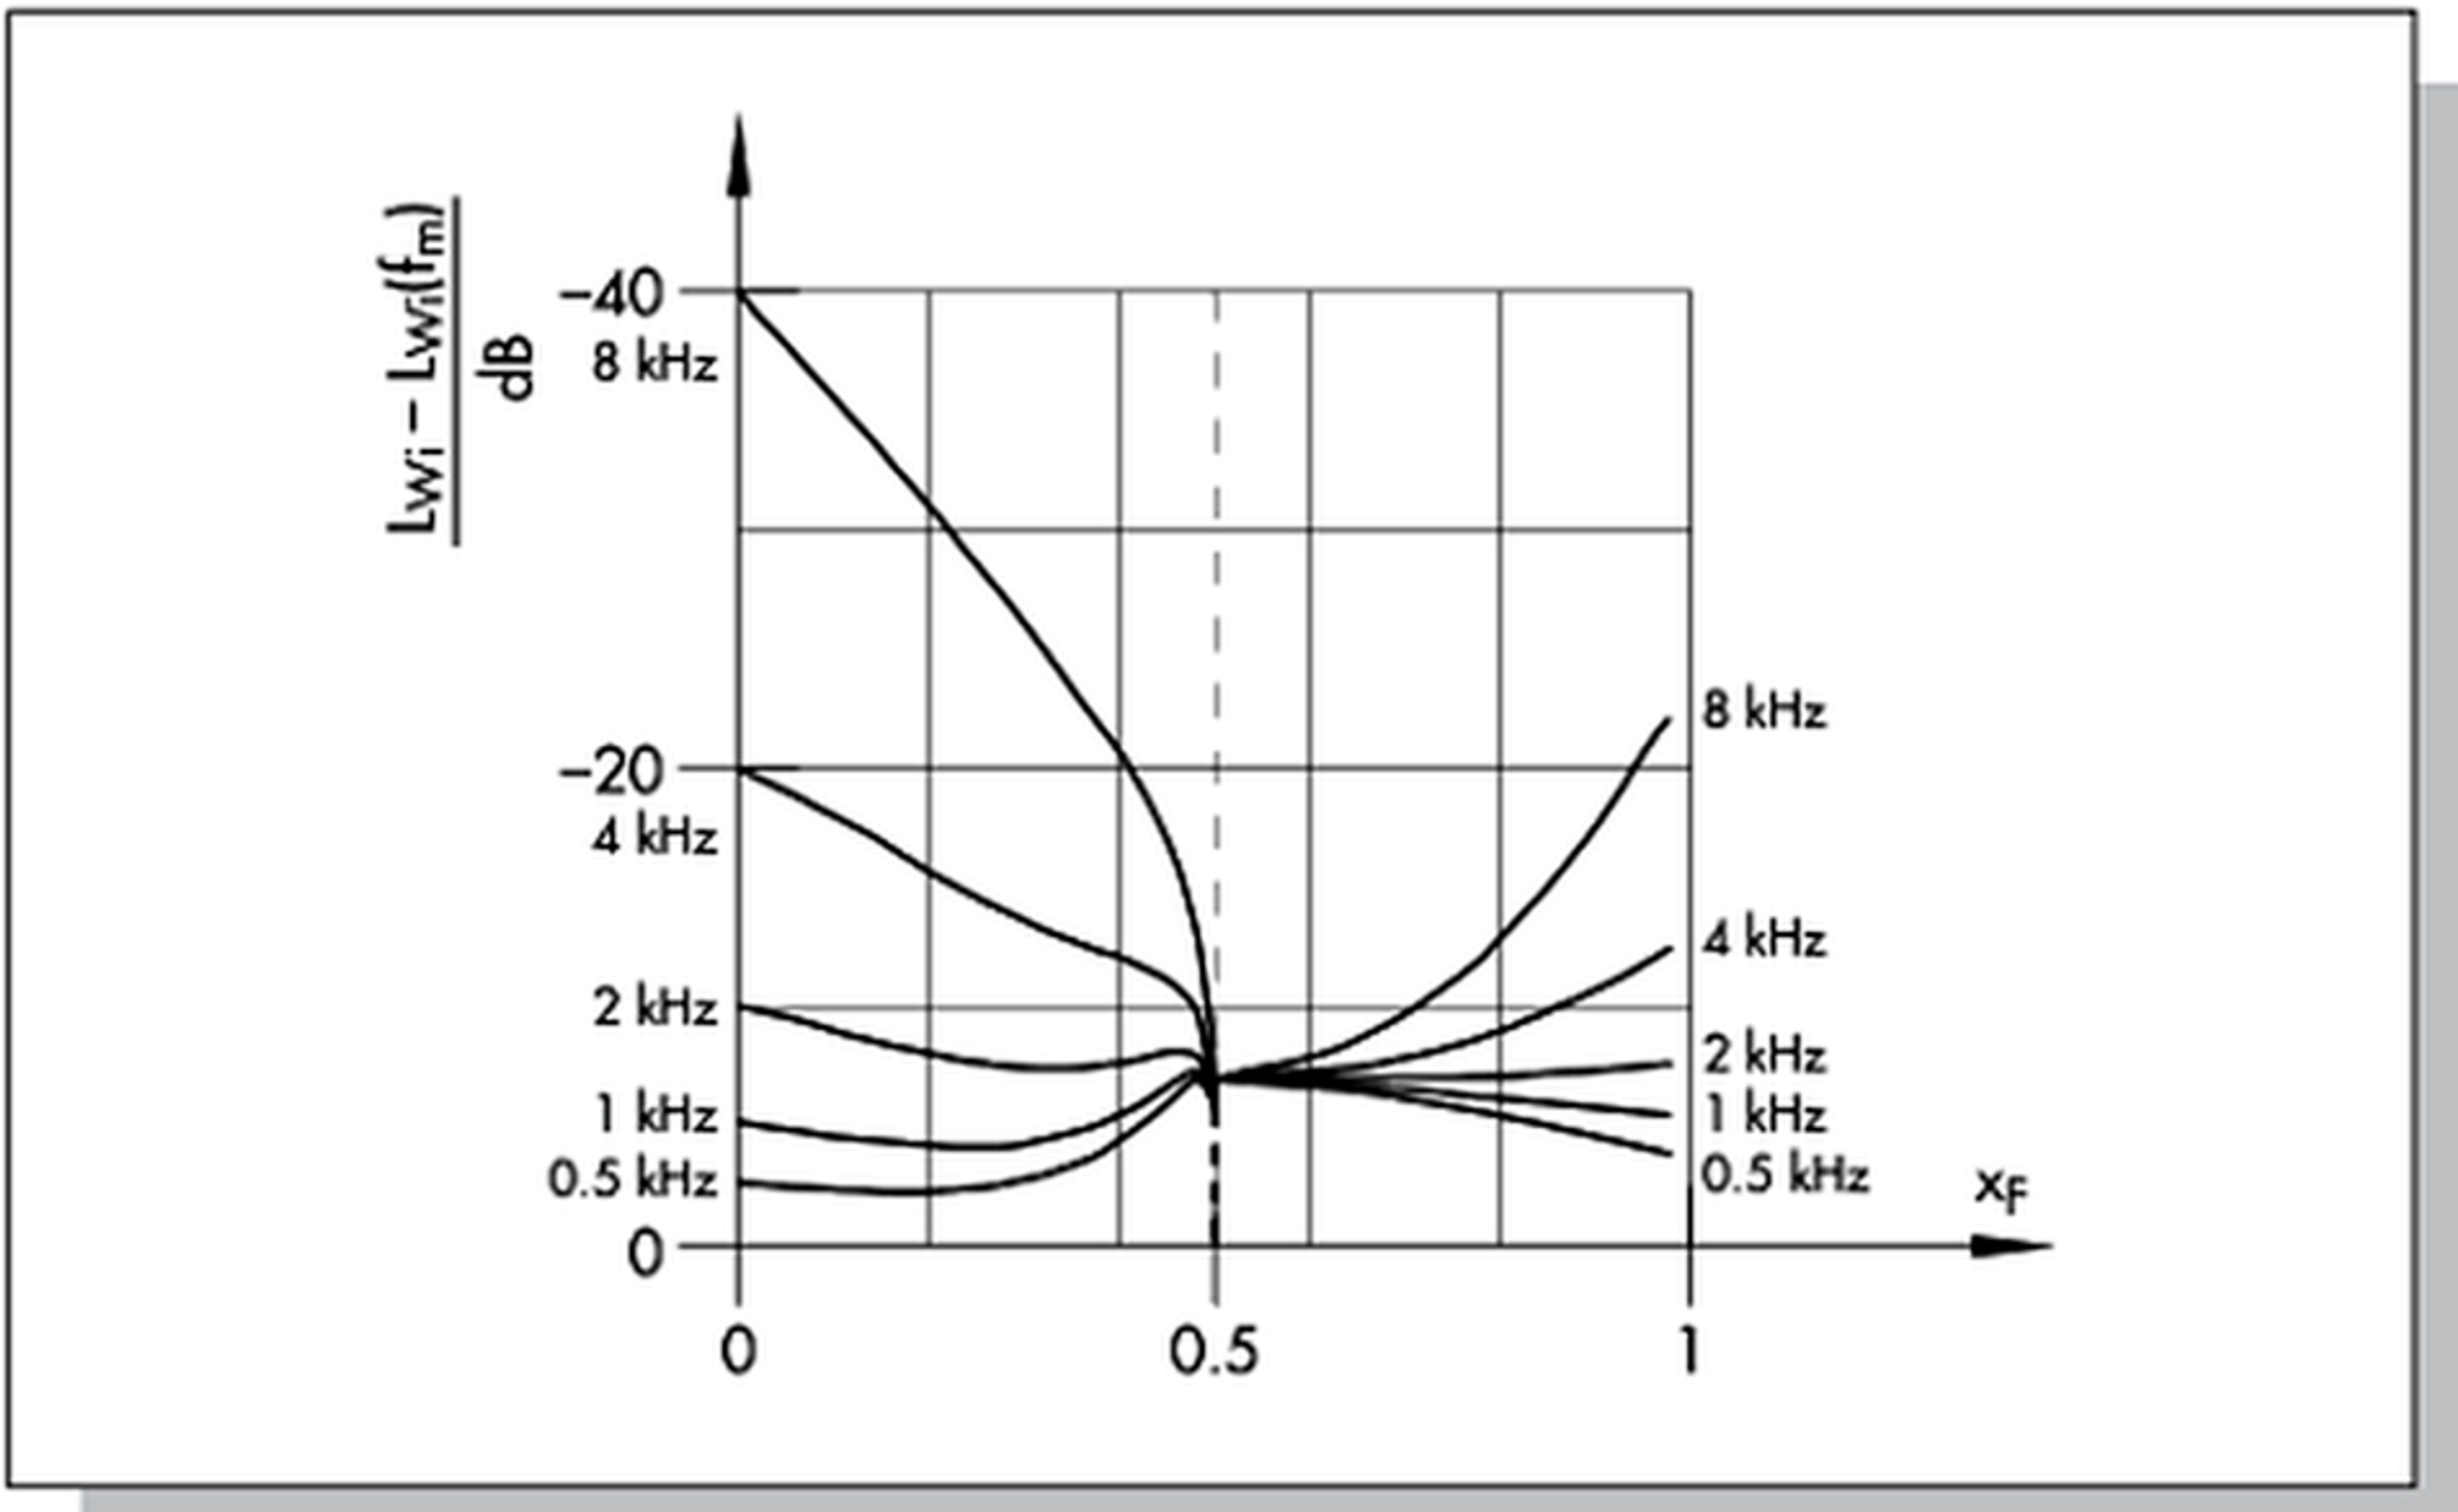
Figure 8. Measured sound-power spectrum.
IEC 60534-8-2 specifies laboratory methods for measuring hydrodynamic noise and identifying the characteristic noise increase associated with cavitation onset. IEC 60534-8-4 provides a method for predicting liquid-flow noise from normal turbulence and cavitation. Field diagnosis should combine acoustic observations with process conditions, valve position, vibration, and inspection because damaging cavitation does not necessarily coincide with the highest airborne noise level. [19, 20]