
Technical publication
Back to publications
Industrial applications
Vegetable Oil Refining, Biodiesel, and Oleochemical Conversion
okozyuk.com
Published
Updated
Read complete publication for whole-document Find and printing. Browser Find and native printing on this reader include only loaded content.
8 Process Design, Energy, and Scale Up
8.1 Design basis
The design basis should state the minimum, normal, and maximum feed flow; oil composition; temperature; density; viscosity; vapor pressure estimate; water; free fatty acids; phosphorus; calcium; magnesium; soap; solids; reagent concentration; required product quality; available upstream and downstream pressure; utilities; separator capacity; operating hours; cleaning plan; and allowable temperature rise. A device should not be sized only by tonnes per day. Two feeds at the same mass flow can require different throat area, pump head, backpressure, and residence history.
Table 8.1. Minimum process design basis.
| Category | Required variables | Reason |
|---|---|---|
| Feed envelope | Flow, composition, viscosity, density, temperature, gas, solids | Defines hydraulic and fouling limits |
| Reagents | Concentration, density, ratio, injection pressure, temperature | Prevents dosing error and local overconcentration |
| Hydraulics | Inlet pressure, outlet pressure, pressure drop, flow, NPSH margin | Defines device and pump operating window |
| Thermal | Inlet and outlet temperature, heat capacity, cooling duty | Controls viscosity, enzymes, methanol, oxidation, and separation |
| Downstream equipment | Hold volume, residence distribution, separator capacity, filtration | Prevents contact improvement from becoming a separation failure |
| Product endpoints | Phosphorus, soap, FFA, yield, FAME, glycerides, stability | Defines acceptance rather than maximum intensity |
8.2 Worked hydraulic energy example
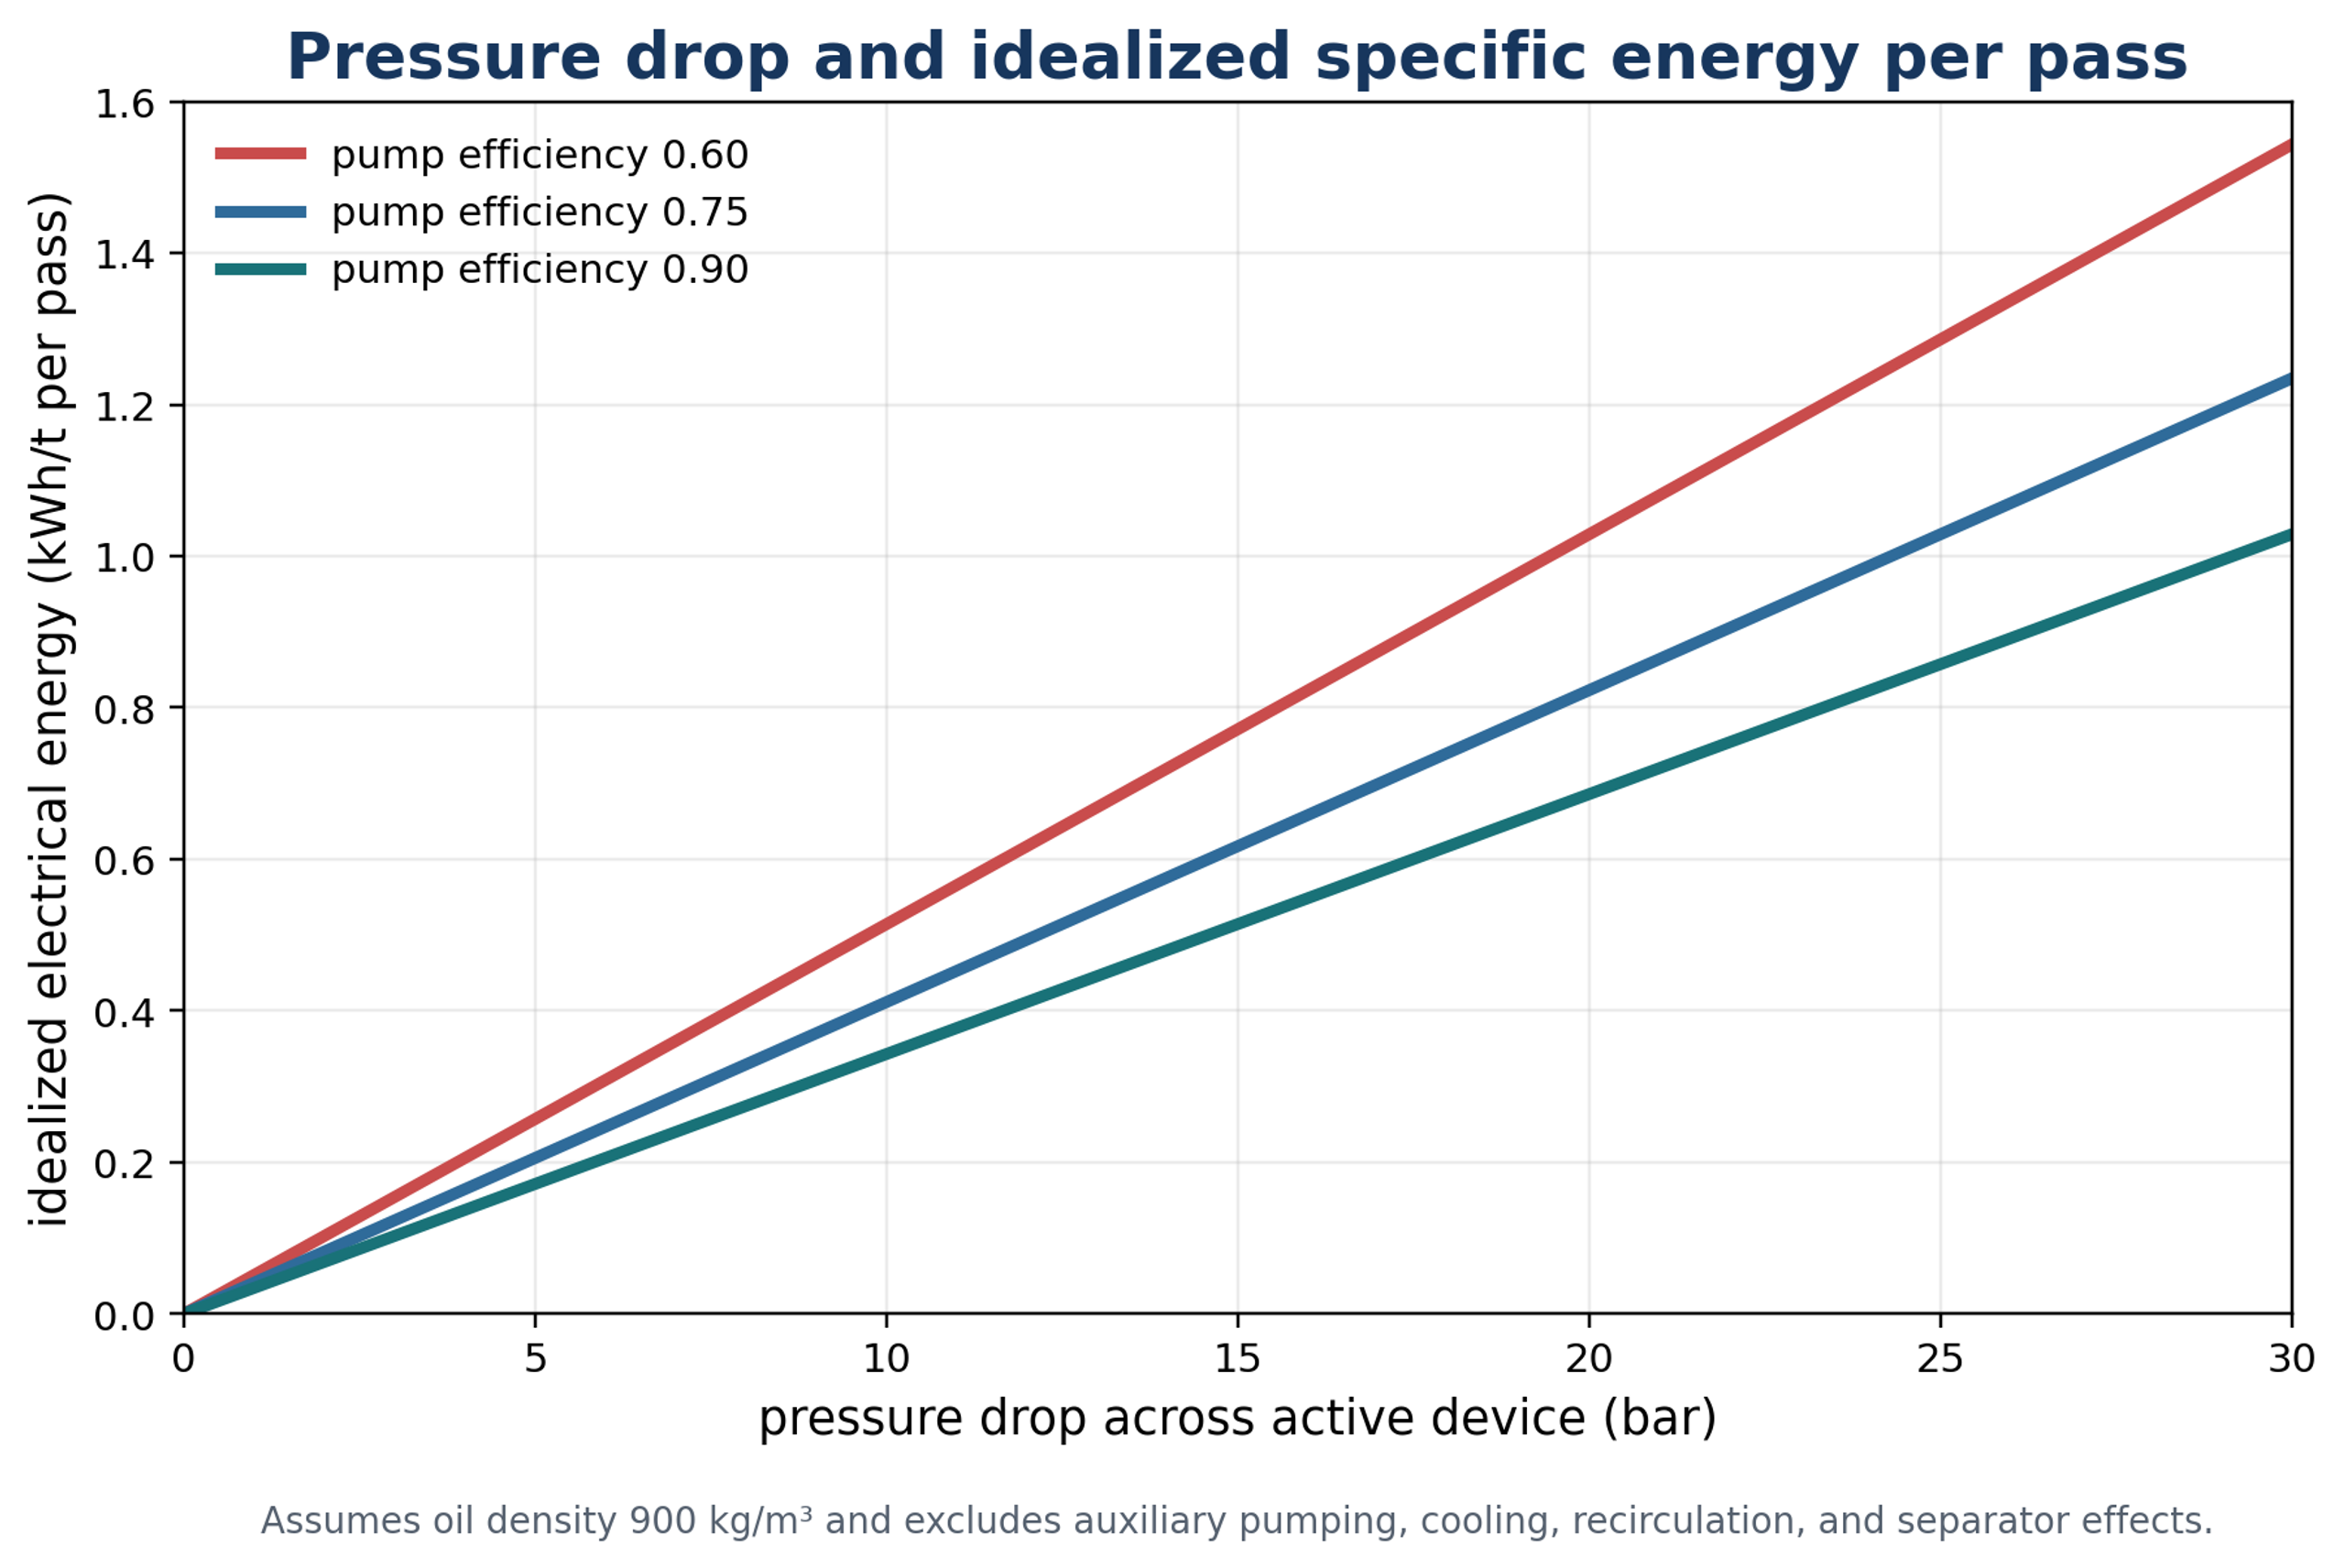
Consider 100 metric tons per hour of oil with density 900 kg per cubic meter, a device pressure drop of 15 bar, and pump efficiency 0.75. The volumetric flow is:
Hydraulic power is:
Estimated electrical power is:
The idealized specific electrical energy for one pass is:
Three equivalent passes would require about 1.85 kWh per ton before auxiliary pumps, cooling, controls, and downstream changes. This calculation does not predict process performance. It quantifies the cost of a selected pressure drop and pass count.
8.3 Scale up criteria
Exact geometric similarity is rarely practical because one very large throat would require extreme velocity and would not preserve turbulence structure or residence history. Industrial systems use numbering up, parallel channels, larger devices, or multiple stages. Scale up should preserve a product relevant operating window through several criteria: cavitation number, Reynolds number, pressure recovery, specific energy, temperature, residence distribution, droplet response, chemical Damkohler behavior, and separator loading [5,9].
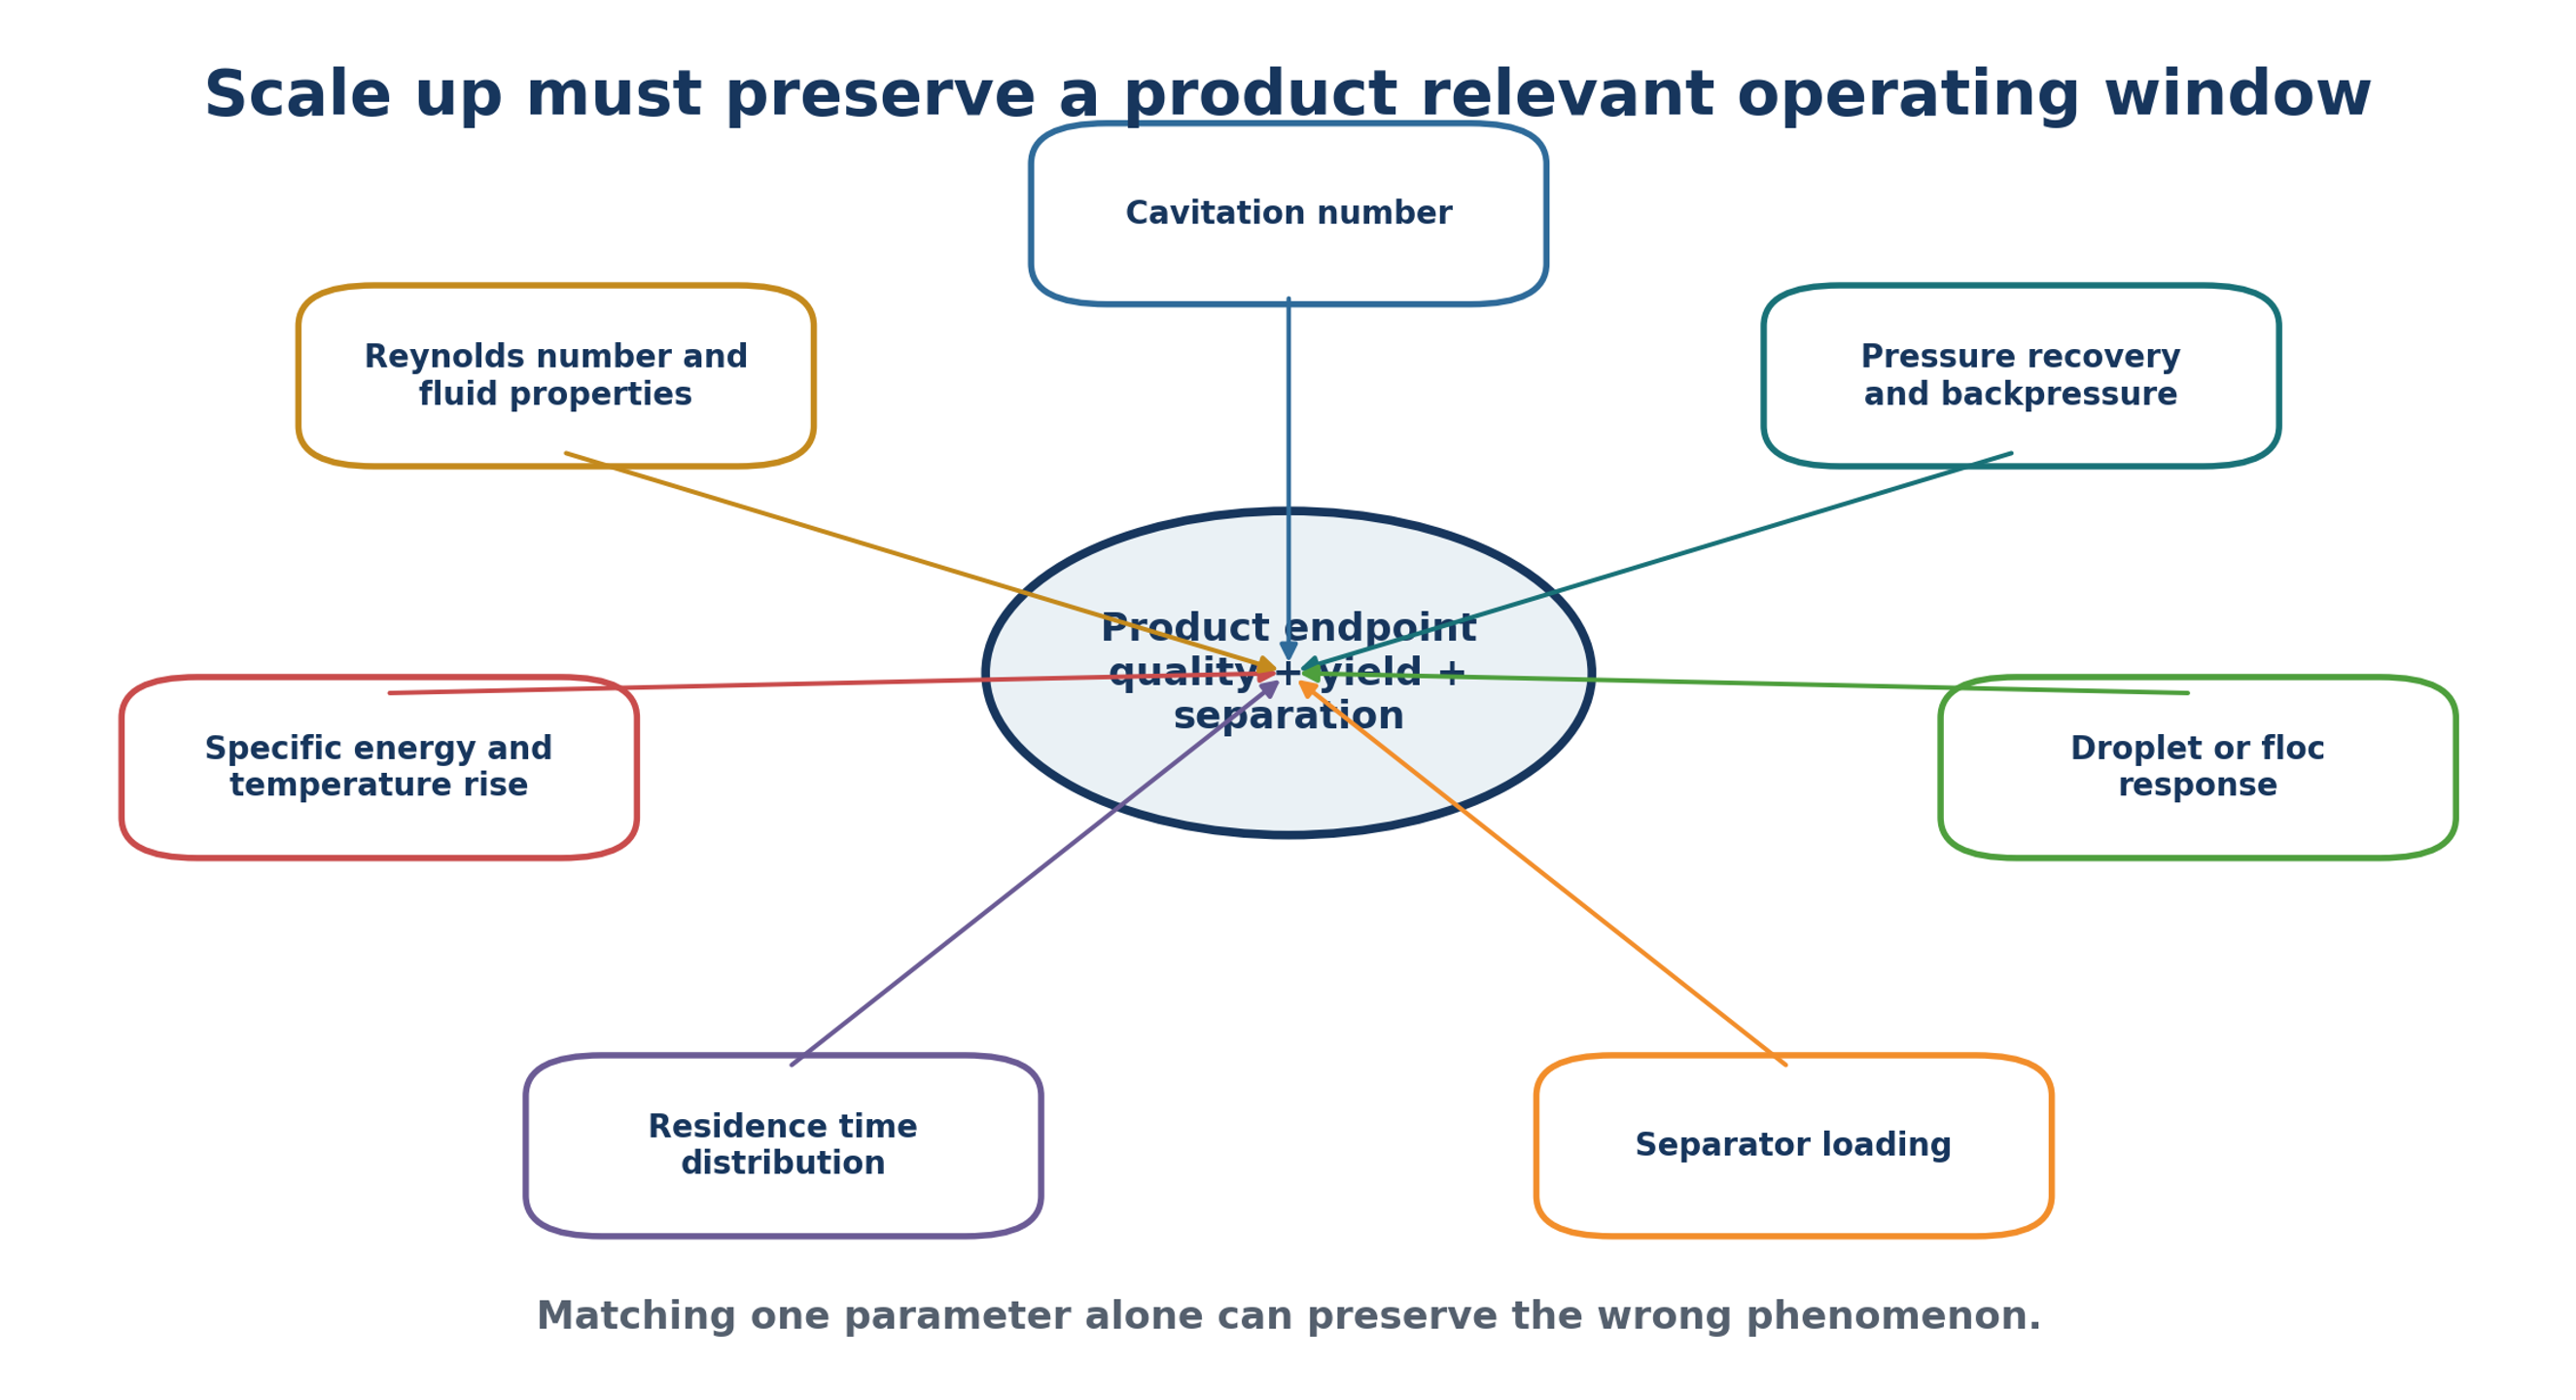
Table 8.2. Scale up criteria and verification methods.
| Criterion | What should be preserved | Verification |
|---|---|---|
| Cavitation number | Comparable pressure and velocity relationship with same definition | Pressure and velocity at defined locations |
| Reynolds number | Comparable flow regime | Properties at operating temperature |
| Pressure recovery | Collapse location and backpressure | Axial pressure map or calibrated CFD |
| Specific energy | Minimum dose that reaches endpoint | Motor power per ton of on specification product |
| Residence distribution | Number and distribution of intense contacts and holds | Tracer testing and pass accounting |
| Interfacial response | Droplet or particle distribution | Laser diffraction, microscopy, or focused beam measurement |
| Reaction behavior | Adequate post contact reaction time | Conversion versus time and temperature |
| Separator load | Heavy phase flow and droplet size within capacity | Centrifuge loss, torque, and phase quality |
8.4 Computational modeling
Computational fluid dynamics can compare pressure minima, vapor fraction, velocity gradients, recirculation, and likely erosion locations. Common models couple turbulence with a vapor transport equation derived from simplified bubble dynamics. The results are sensitive to nuclei assumptions, mass transfer coefficients, turbulence closure, wall roughness, and boundary pressure. A model should be calibrated against measured pressure drop, flow, temperature, vibration or acoustic response, and visualization where possible. Oil properties and dispersed phase must be represented at operating temperature. A water model can rank geometries qualitatively but can misstate absolute behavior in oil.