
Technical publication
Back to publications
Industrial applications
Hydrodynamic Cavitation in Pharmaceutical Particle Engineering, Crystallization, and Drug Delivery
okozyuk.com
Published
Read complete publication for whole-document Find and printing. Browser Find and native printing on this reader include only loaded content.
4 Top Down Particle Size Reduction and Nanosuspension Processing
4.1 Breakage, Deagglomeration, and Limiting Size
Solid particles can be reduced by brittle fracture, fatigue, abrasion, interparticle collision, impact with equipment surfaces, and cavitation induced pressure pulses or microjets. Weak agglomerates usually break before primary crystals. Once the agglomerates are removed, further reduction depends on crystal mechanical properties and defect structure. Needle and plate crystals may break anisotropically, so D50 can decrease while aspect ratio or one dimension remains relatively unchanged. Modern hydrodynamic cavitation work on pharmaceutical crystals has reported a rapid initial breakage regime followed by a slower regime and a limiting size, reinforcing the need to model pass count rather than assume linear reduction [40,41].
For suspensions, surface coverage by stabilizer is a kinetic constraint. A newly fractured surface that is not rapidly wetted and protected can reagglomerate. Stabilizer concentration should therefore be related to created surface area, not only to bulk solids concentration. Temperature and ionic strength can change adsorption and electrostatic screening. When organic solvents are present, solvent quality can alter both cavitation behavior and surface stabilization [1,17–28].
4.2 Florfenicol Example from the Supplied Cavitation Material
The supplied hydrodynamic cavitation article presents florfenicol as a particle size reduction example. The starting commercial material had a broad distribution with a reported mean near 100 µm. Processing at a reported working pressure of 70 MPa and a crystal concentration of 12 wt% reduced the mean to approximately 10 µm and narrowed the distribution [1].
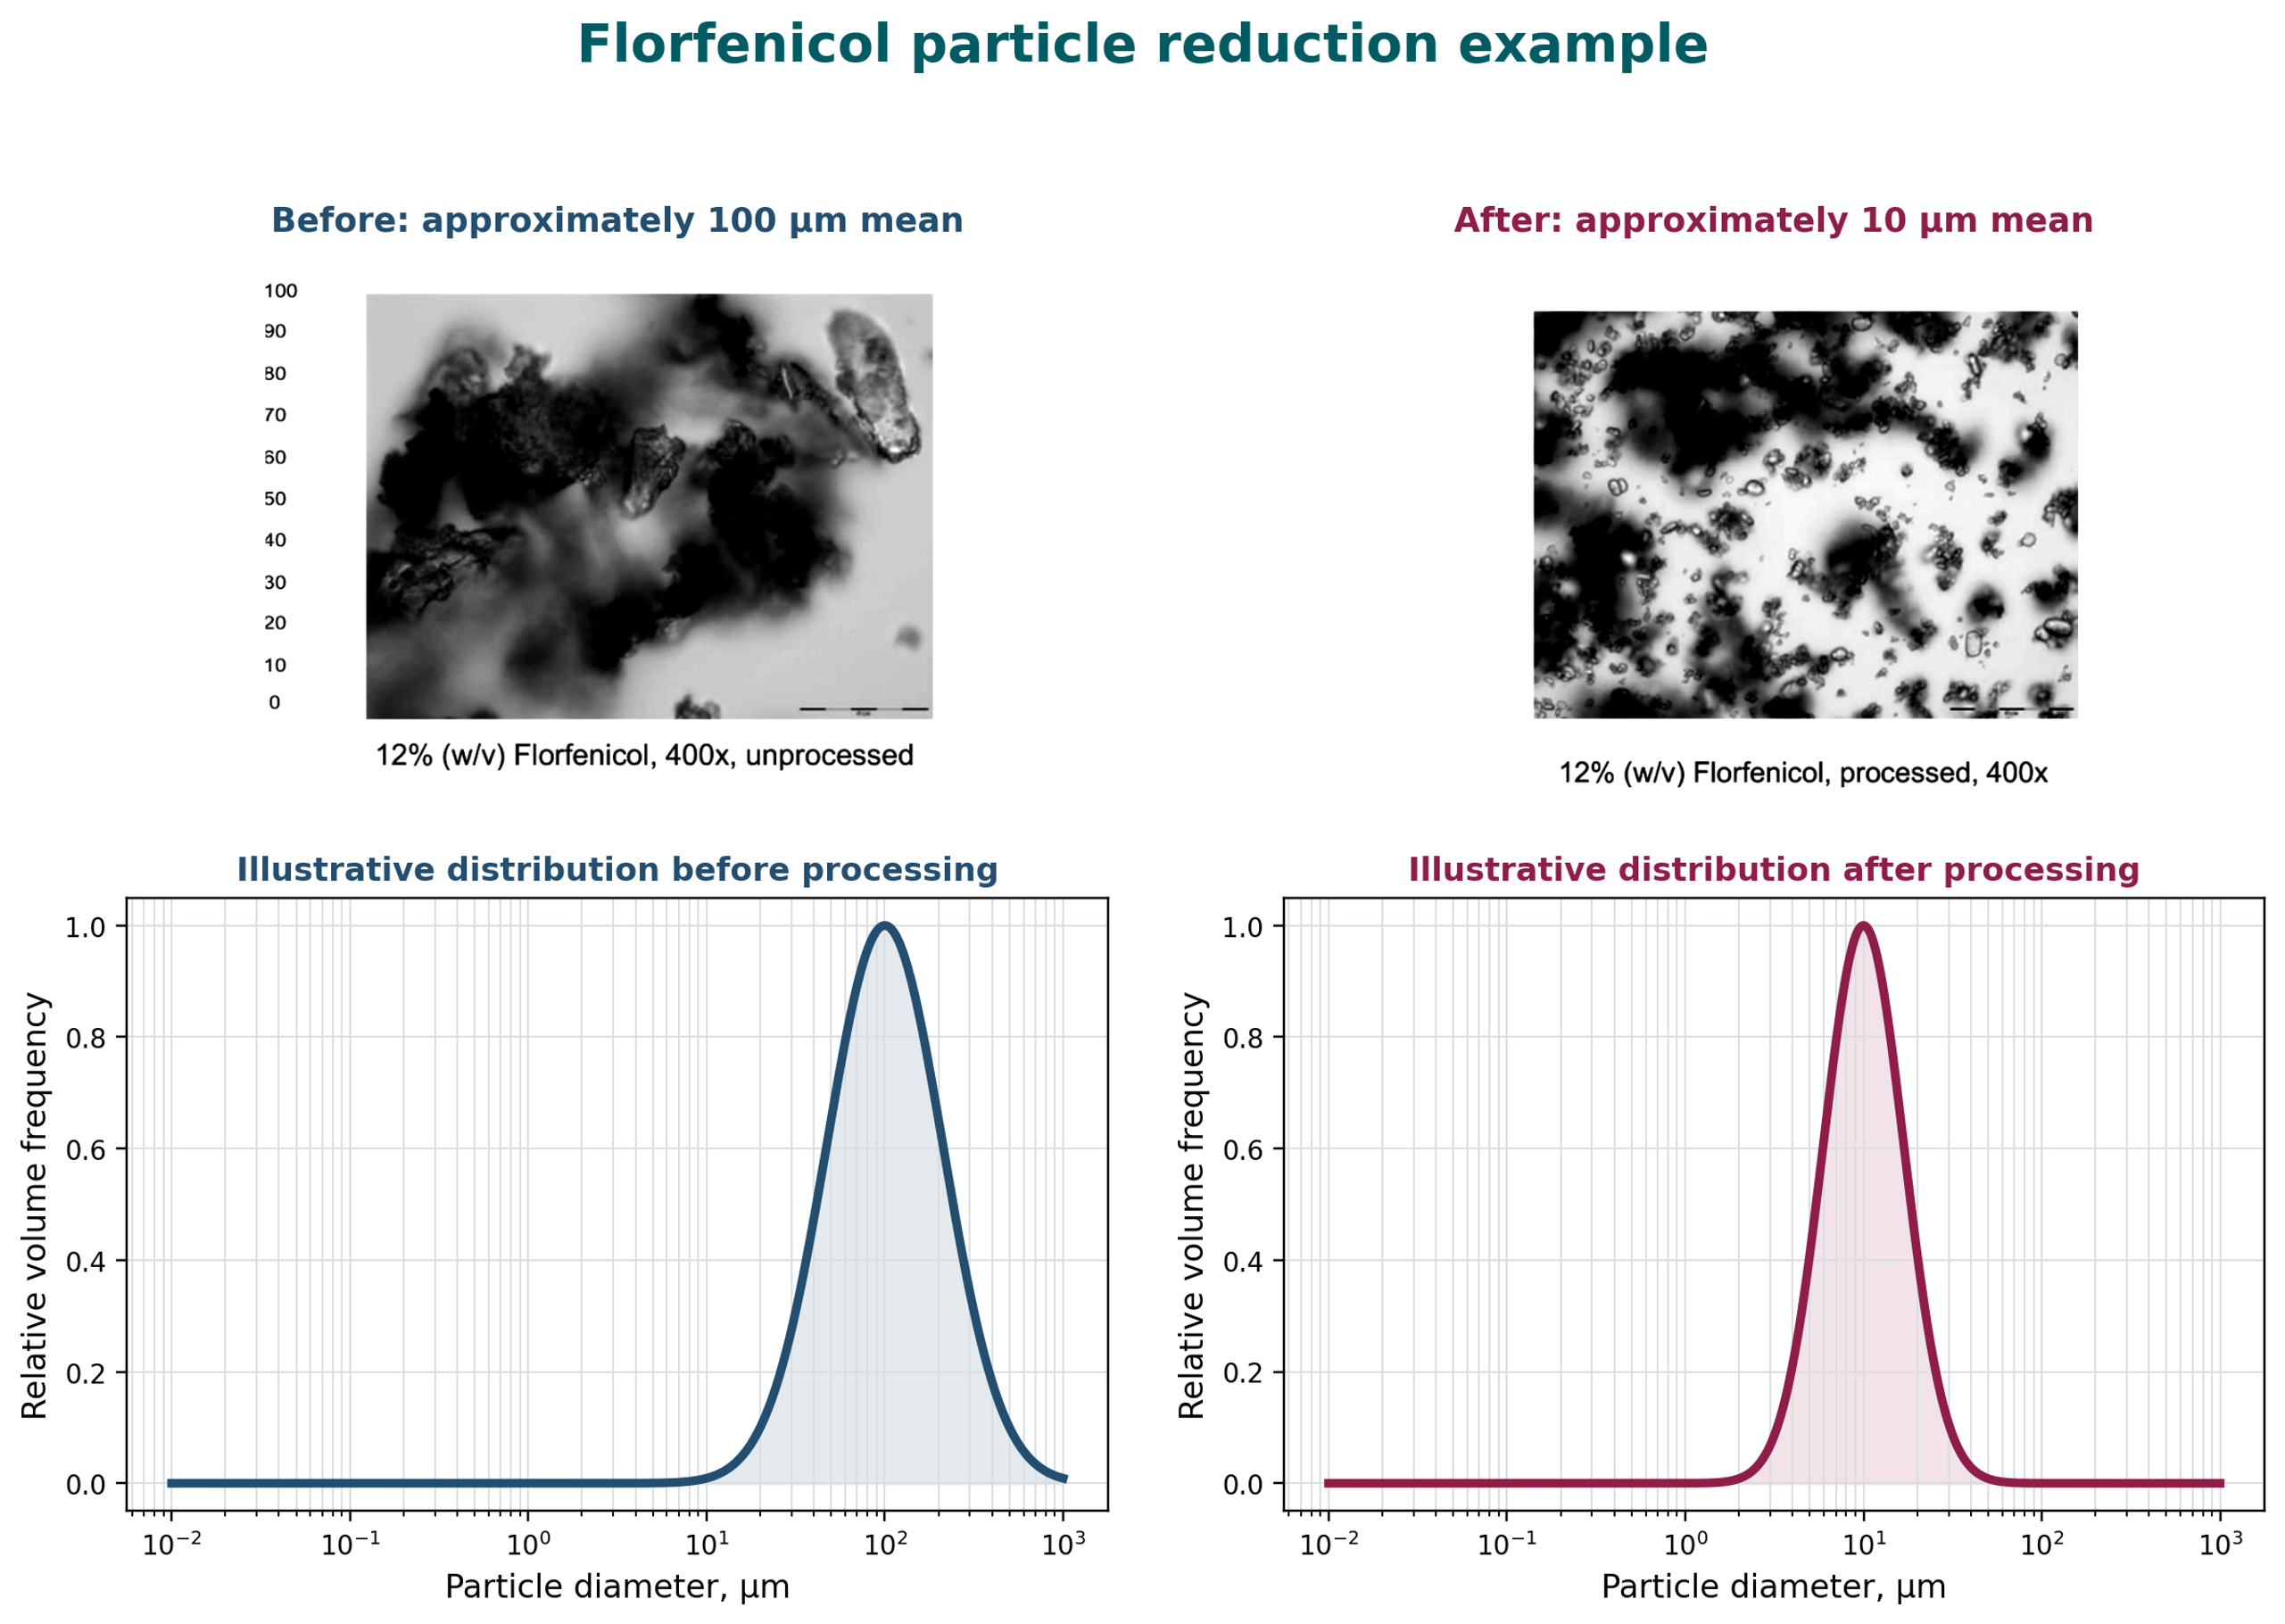
Figure 4.1. Florfenicol before and after cavitation processing, with illustrative particle size distributions. [1].
4.3 Pressure, Pass Count, and Liquid Phase Effects
The data indicate that higher operating pressure can reduce the mean particle size of selected active pharmaceutical ingredients. In one example, material with an unmilled mean size of approximately 109 µm was compared with material processed at 0.7 MPa and 10.3 MPa. The higher pressure condition produced a reported mean particle size of approximately 6.3 µm [28].
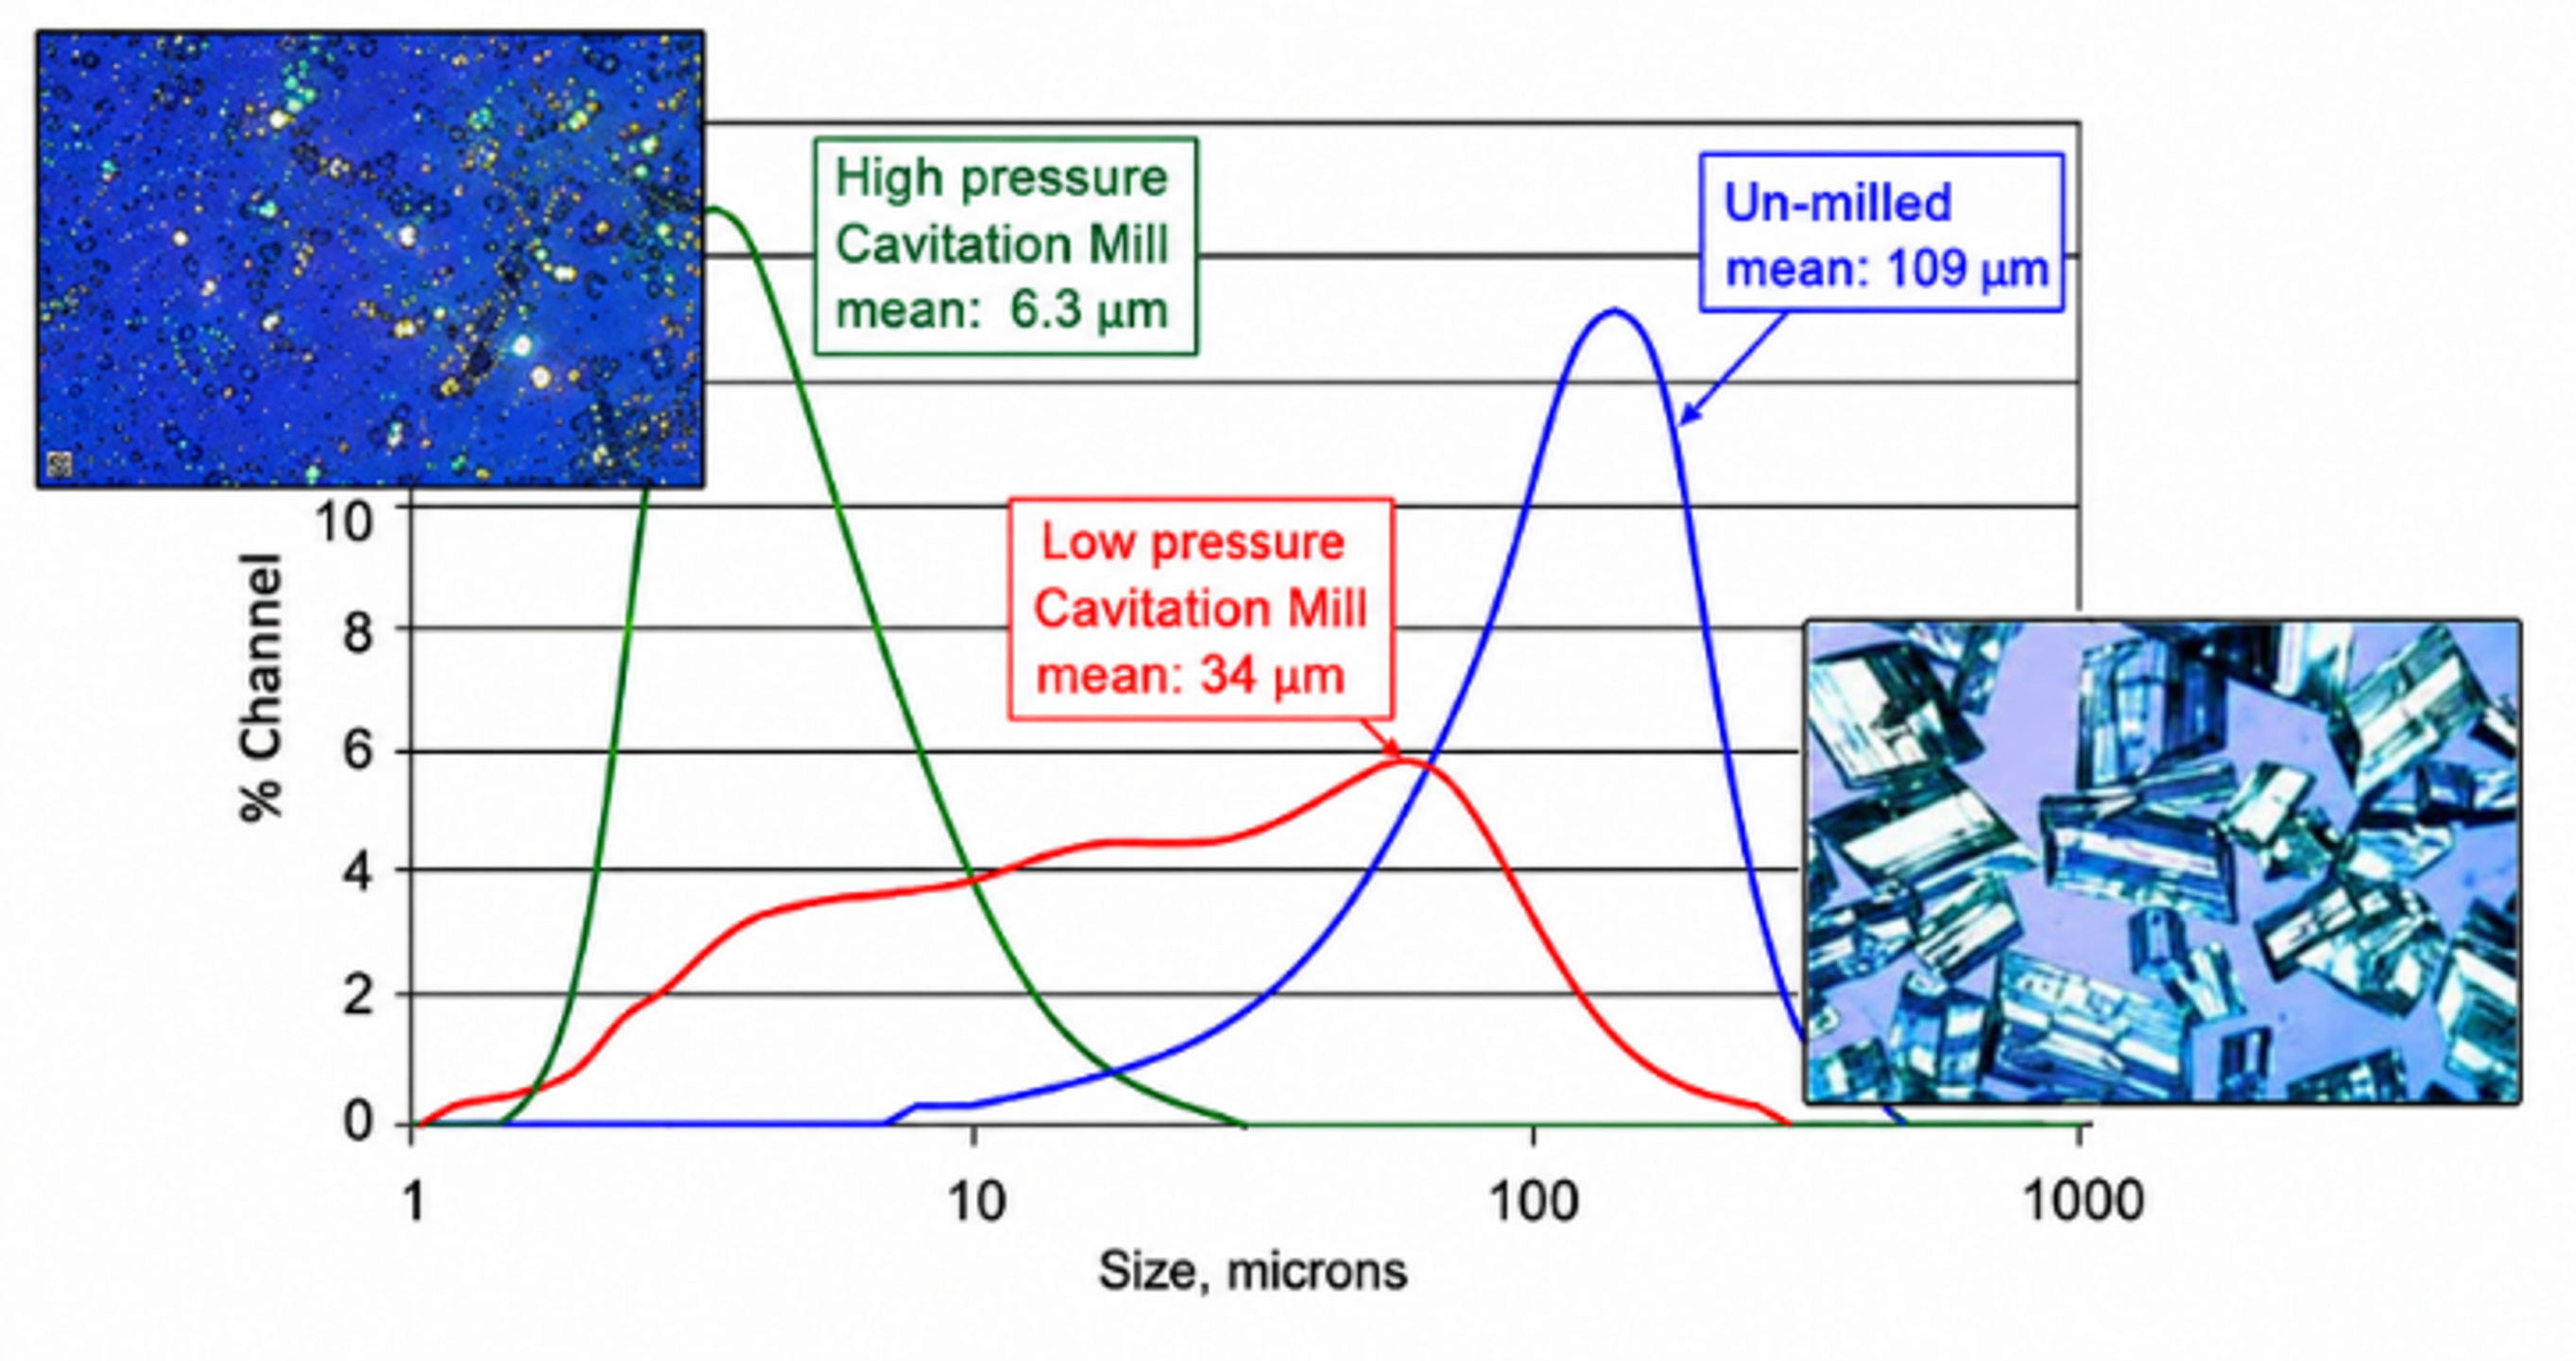
Figure 4.2. Comparison of unmilled, low pressure, and high pressure cavitation milled active ingredient particle size distributions. [28].
A related pressure plot shows a decrease in mean volume diameter as pressure increases. This trend is physically plausible because pressure drop and pressure recovery influence bubble formation and collapse intensity. In pharmaceutical development, this relationship should be evaluated together with temperature rise, equipment wear, impurity formation, and potential changes in particle form [2–5,17].
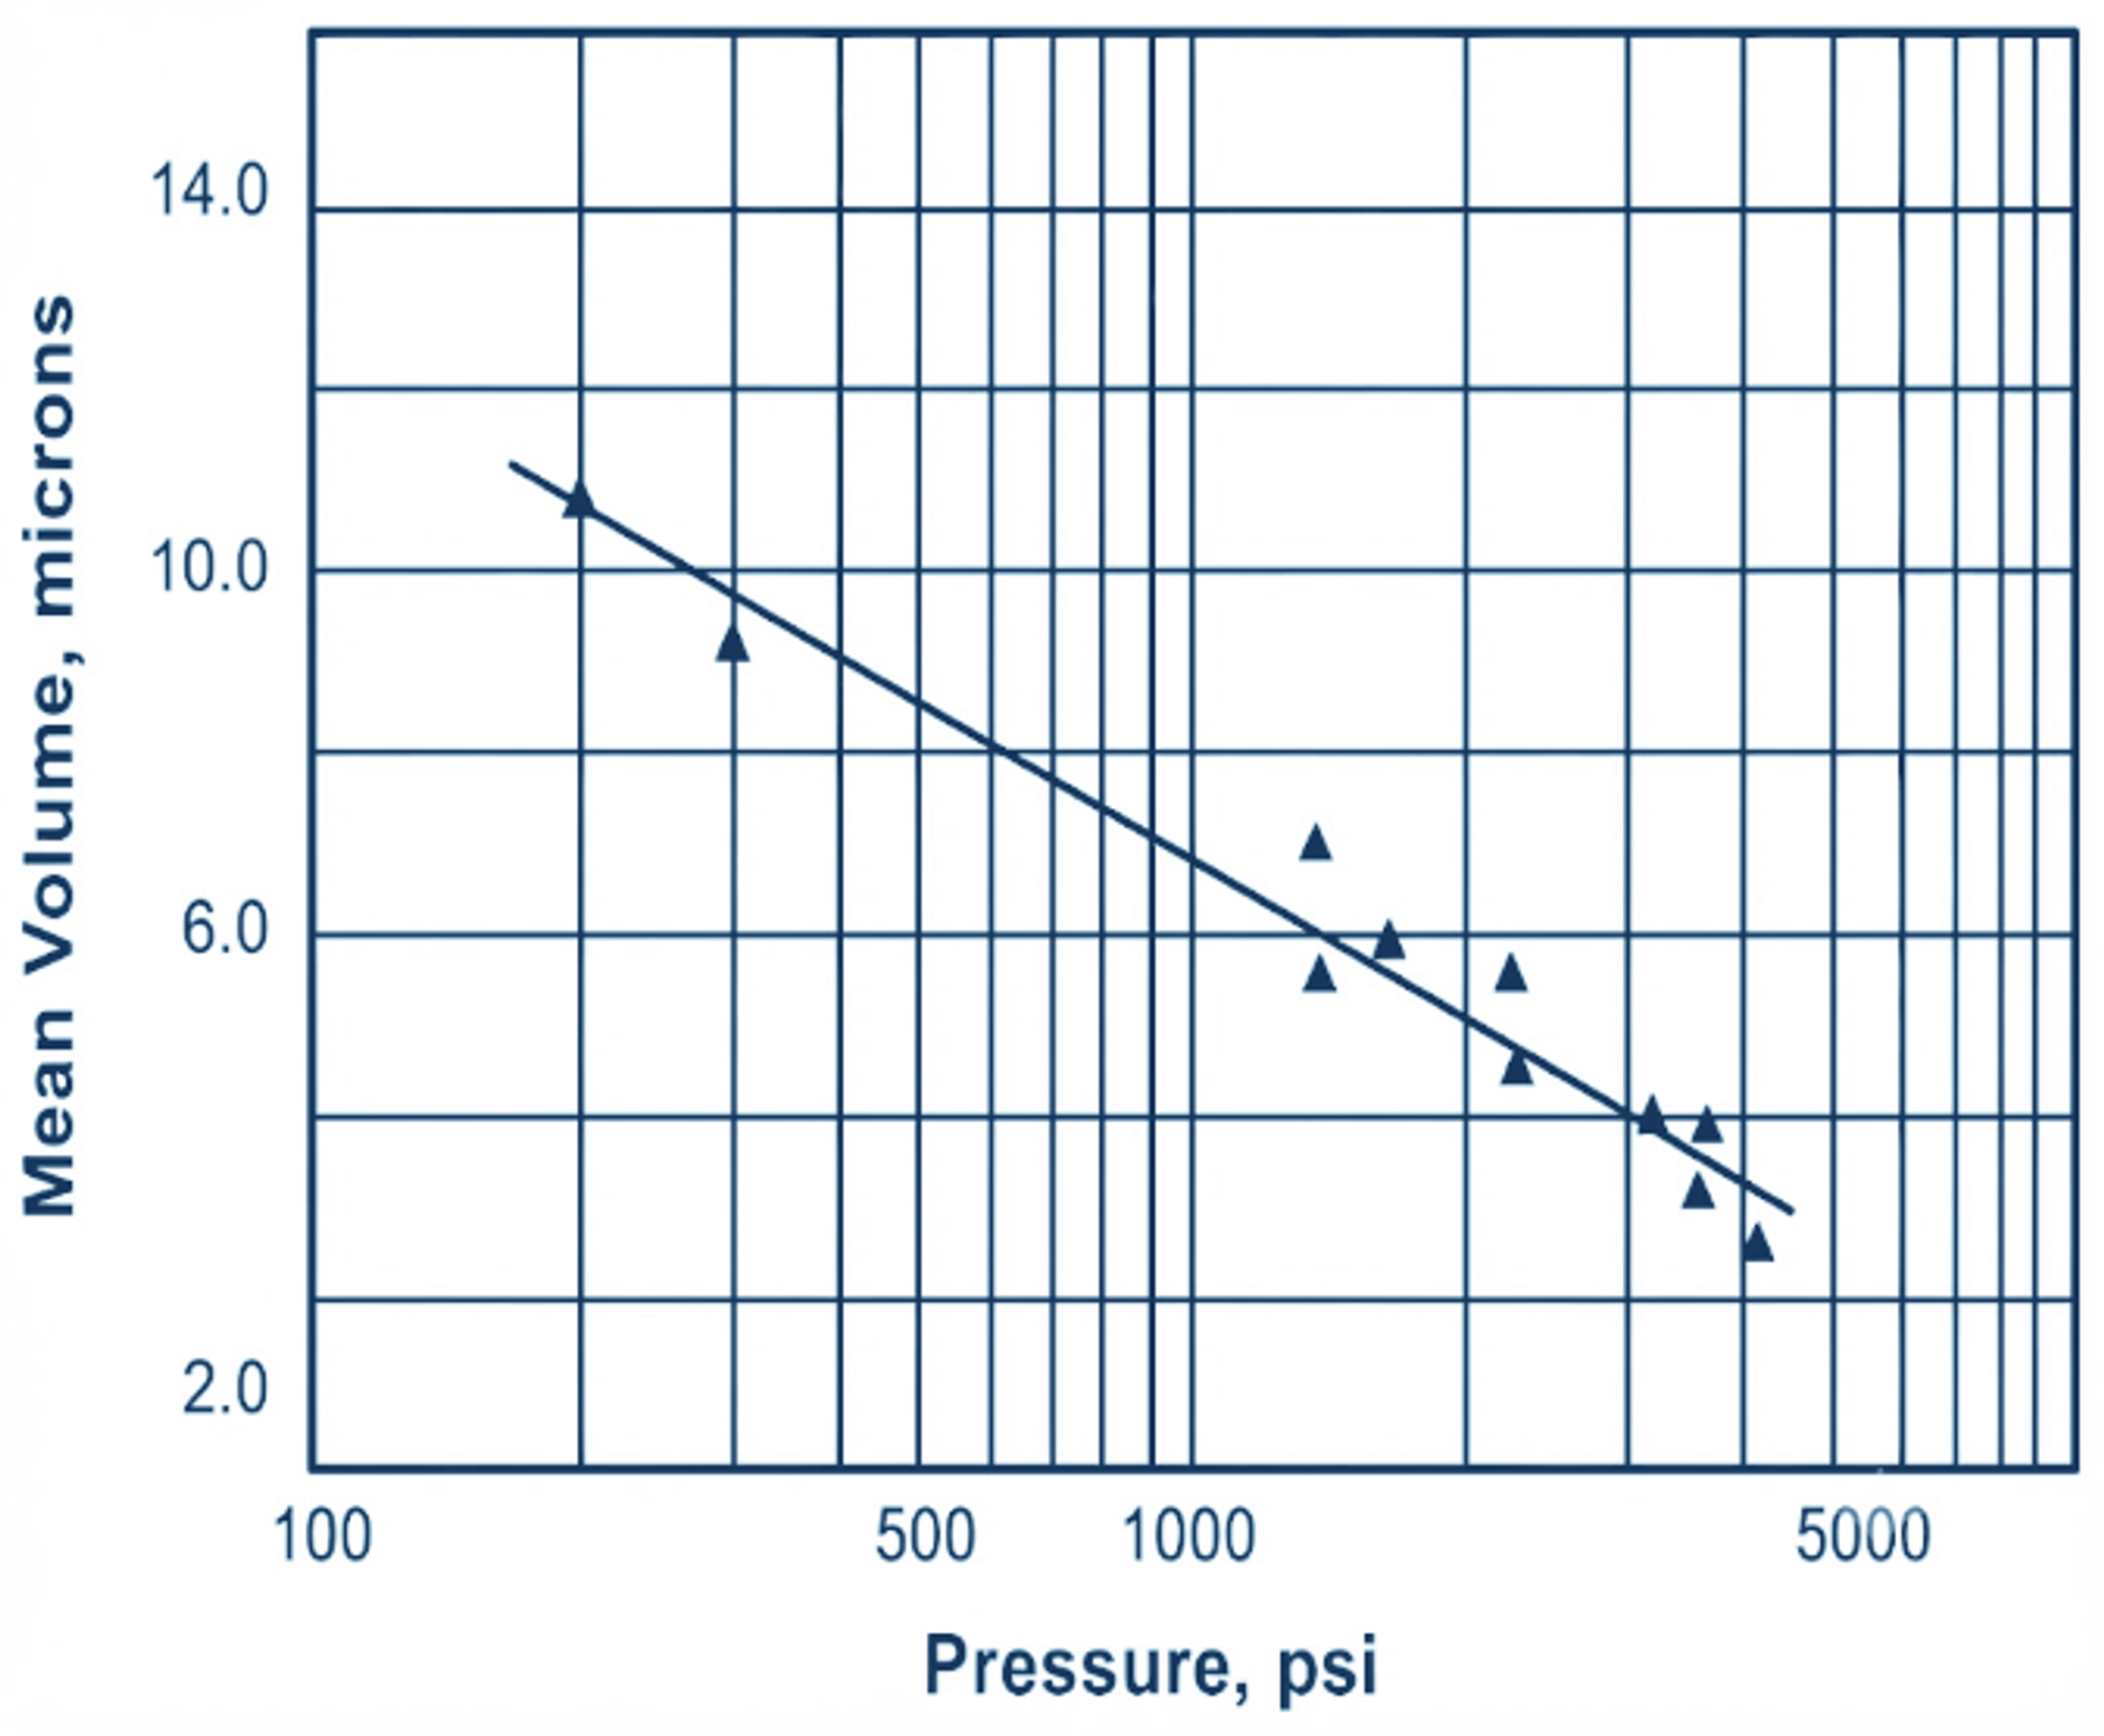
Figure 4.3. Mean active ingredient particle size as a function of cavitation processing pressure. [1]
Pass count controls cumulative exposure to the cavitation zone. Multiple cycles can reduce particle size and narrow the distribution until the system approaches a limiting condition, after which additional processing provides little benefit. Figure 4.4 compares feed material, a single pass, and continuous cavitation milling. In the reported experiments, near steady conditions were reached after approximately 60 to 90 cycles at 0.7 to 7 MPa, 15 to 30 cycles at 34.4 MPa, and 2 to 10 cycles at 70 to 100 MPa. The required cycle number depends on material properties, concentration, formulation, and device design. The cited experiments were conducted without the surfactants and dispersants commonly used to assist particle size reduction [28].
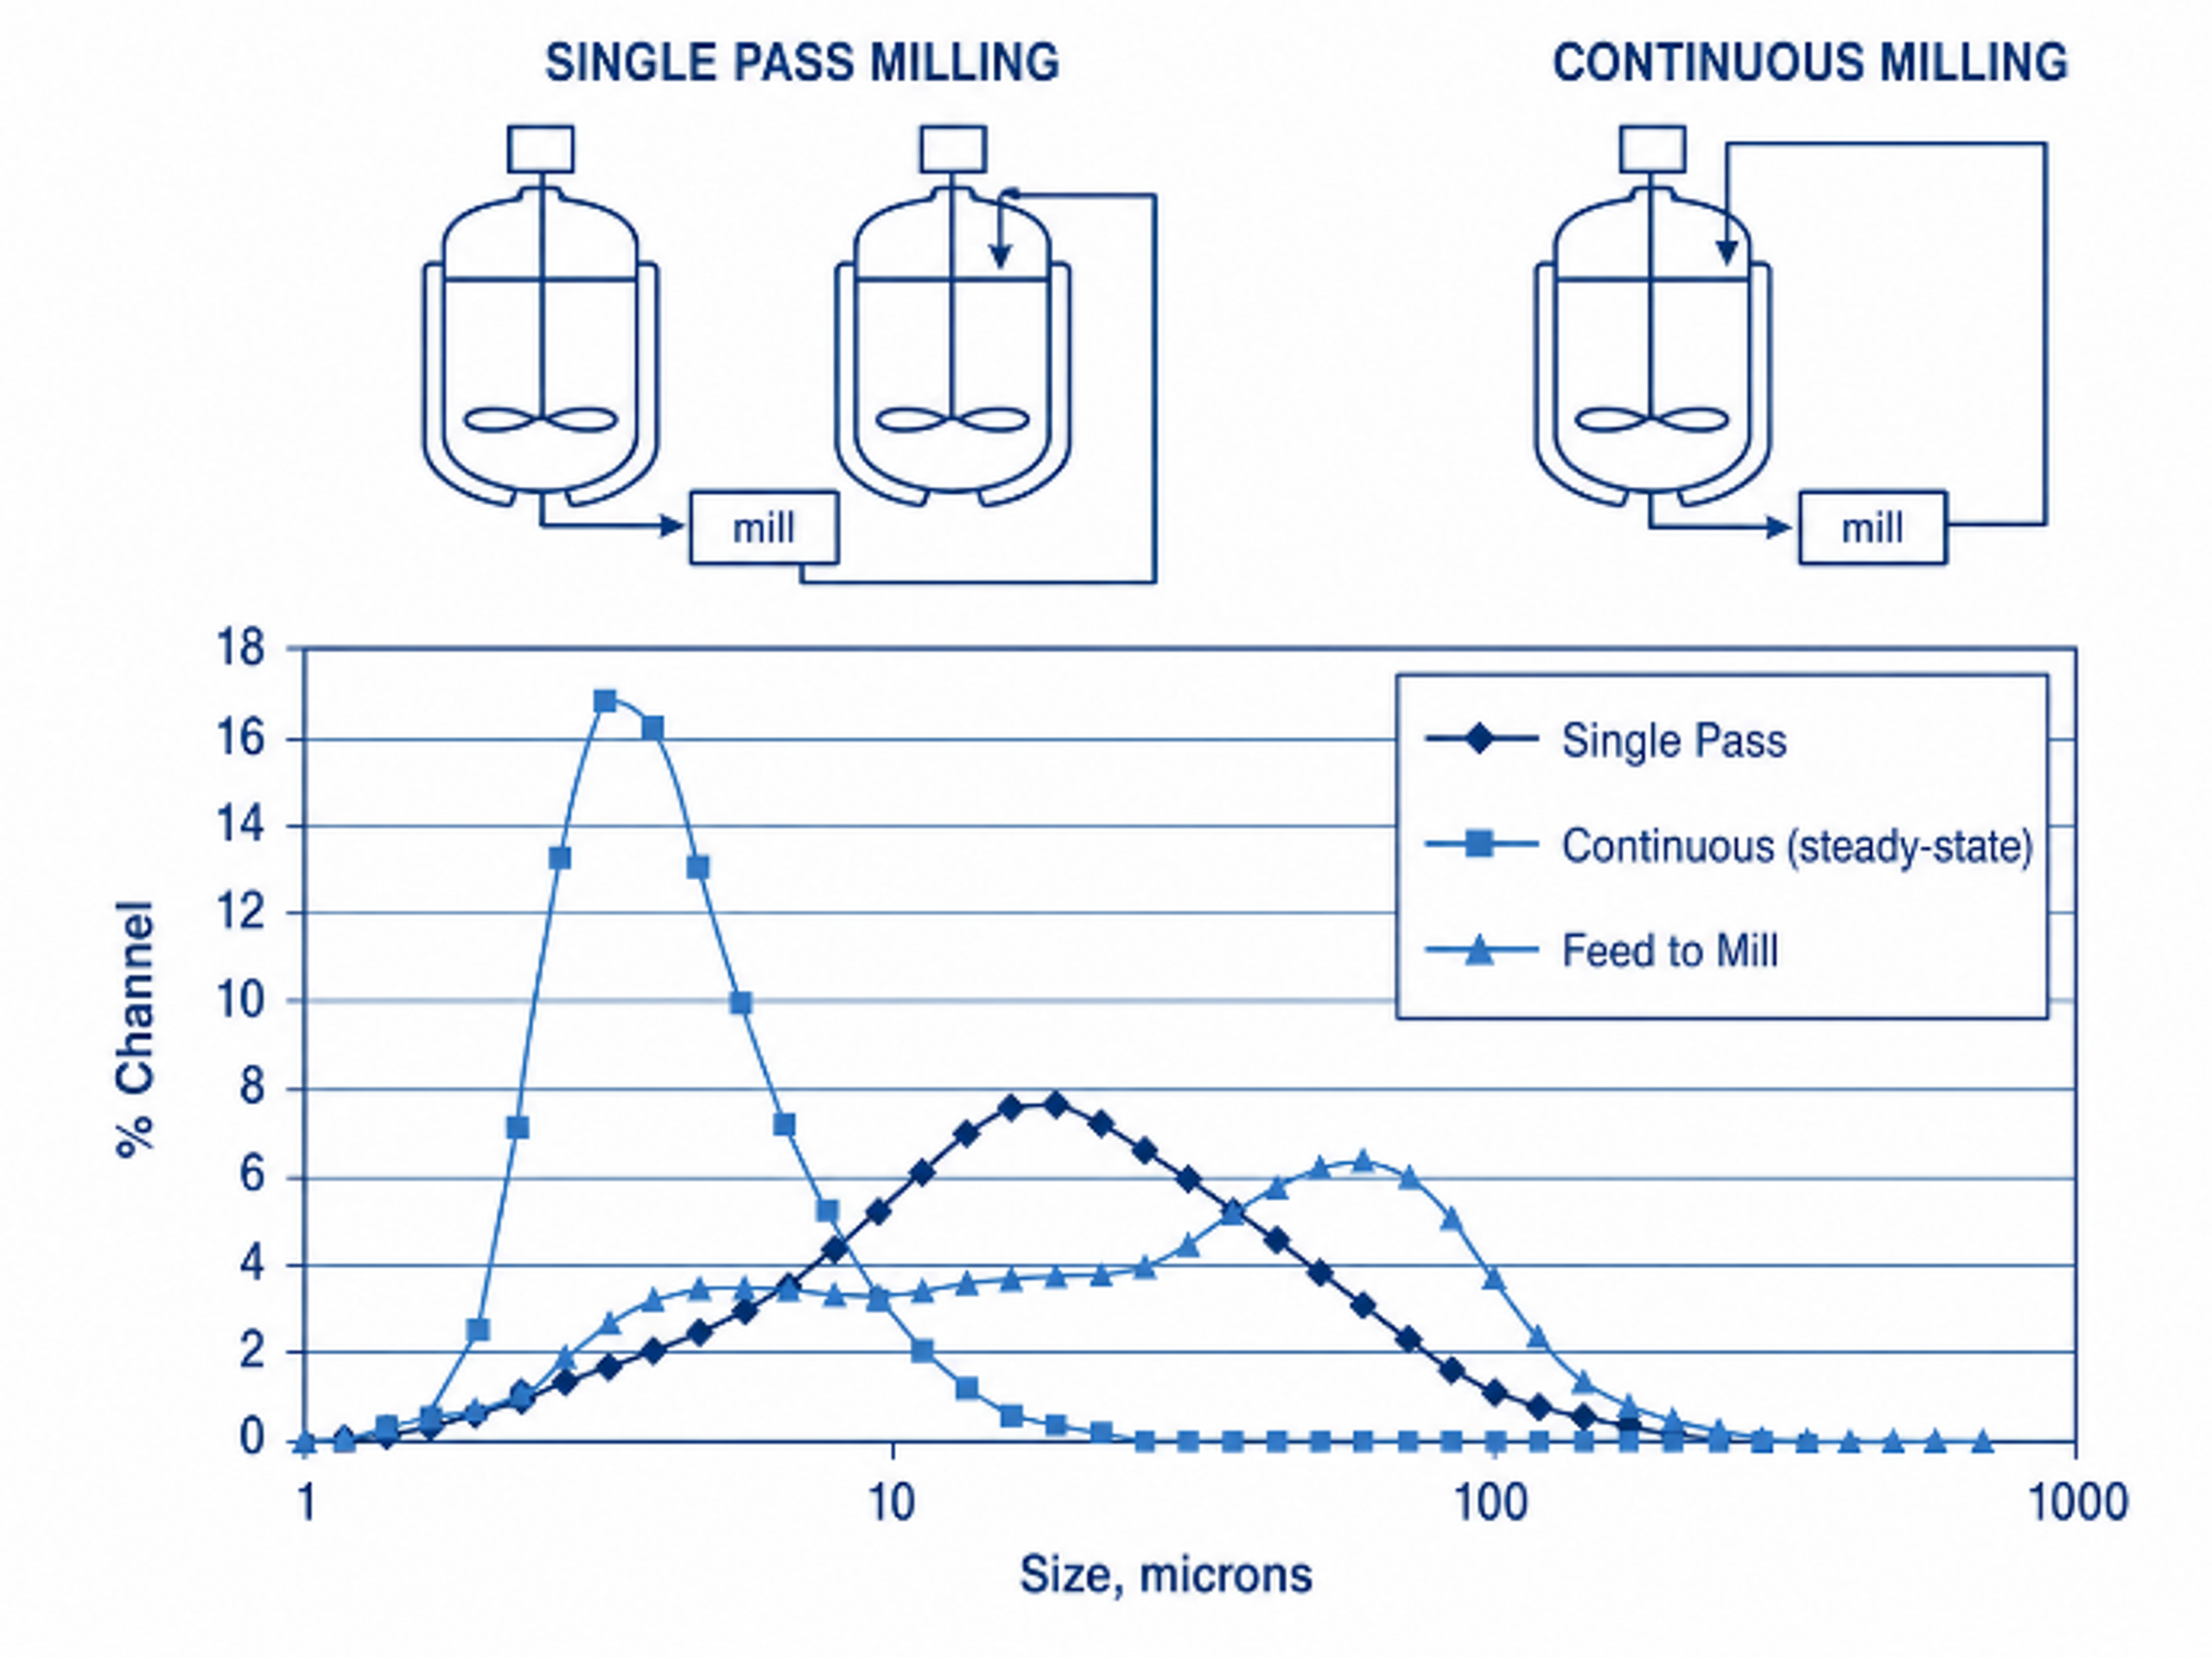
Figure 4.4. Particle size distributions for feed, single pass, and continuous cavitation milling. [28]
The solvent or liquid phase can influence cavitation because viscosity, vapor pressure, surface tension, and dissolved gas content affect bubble behavior. In one API experiment, two organic solvents produced similar particle size trends.
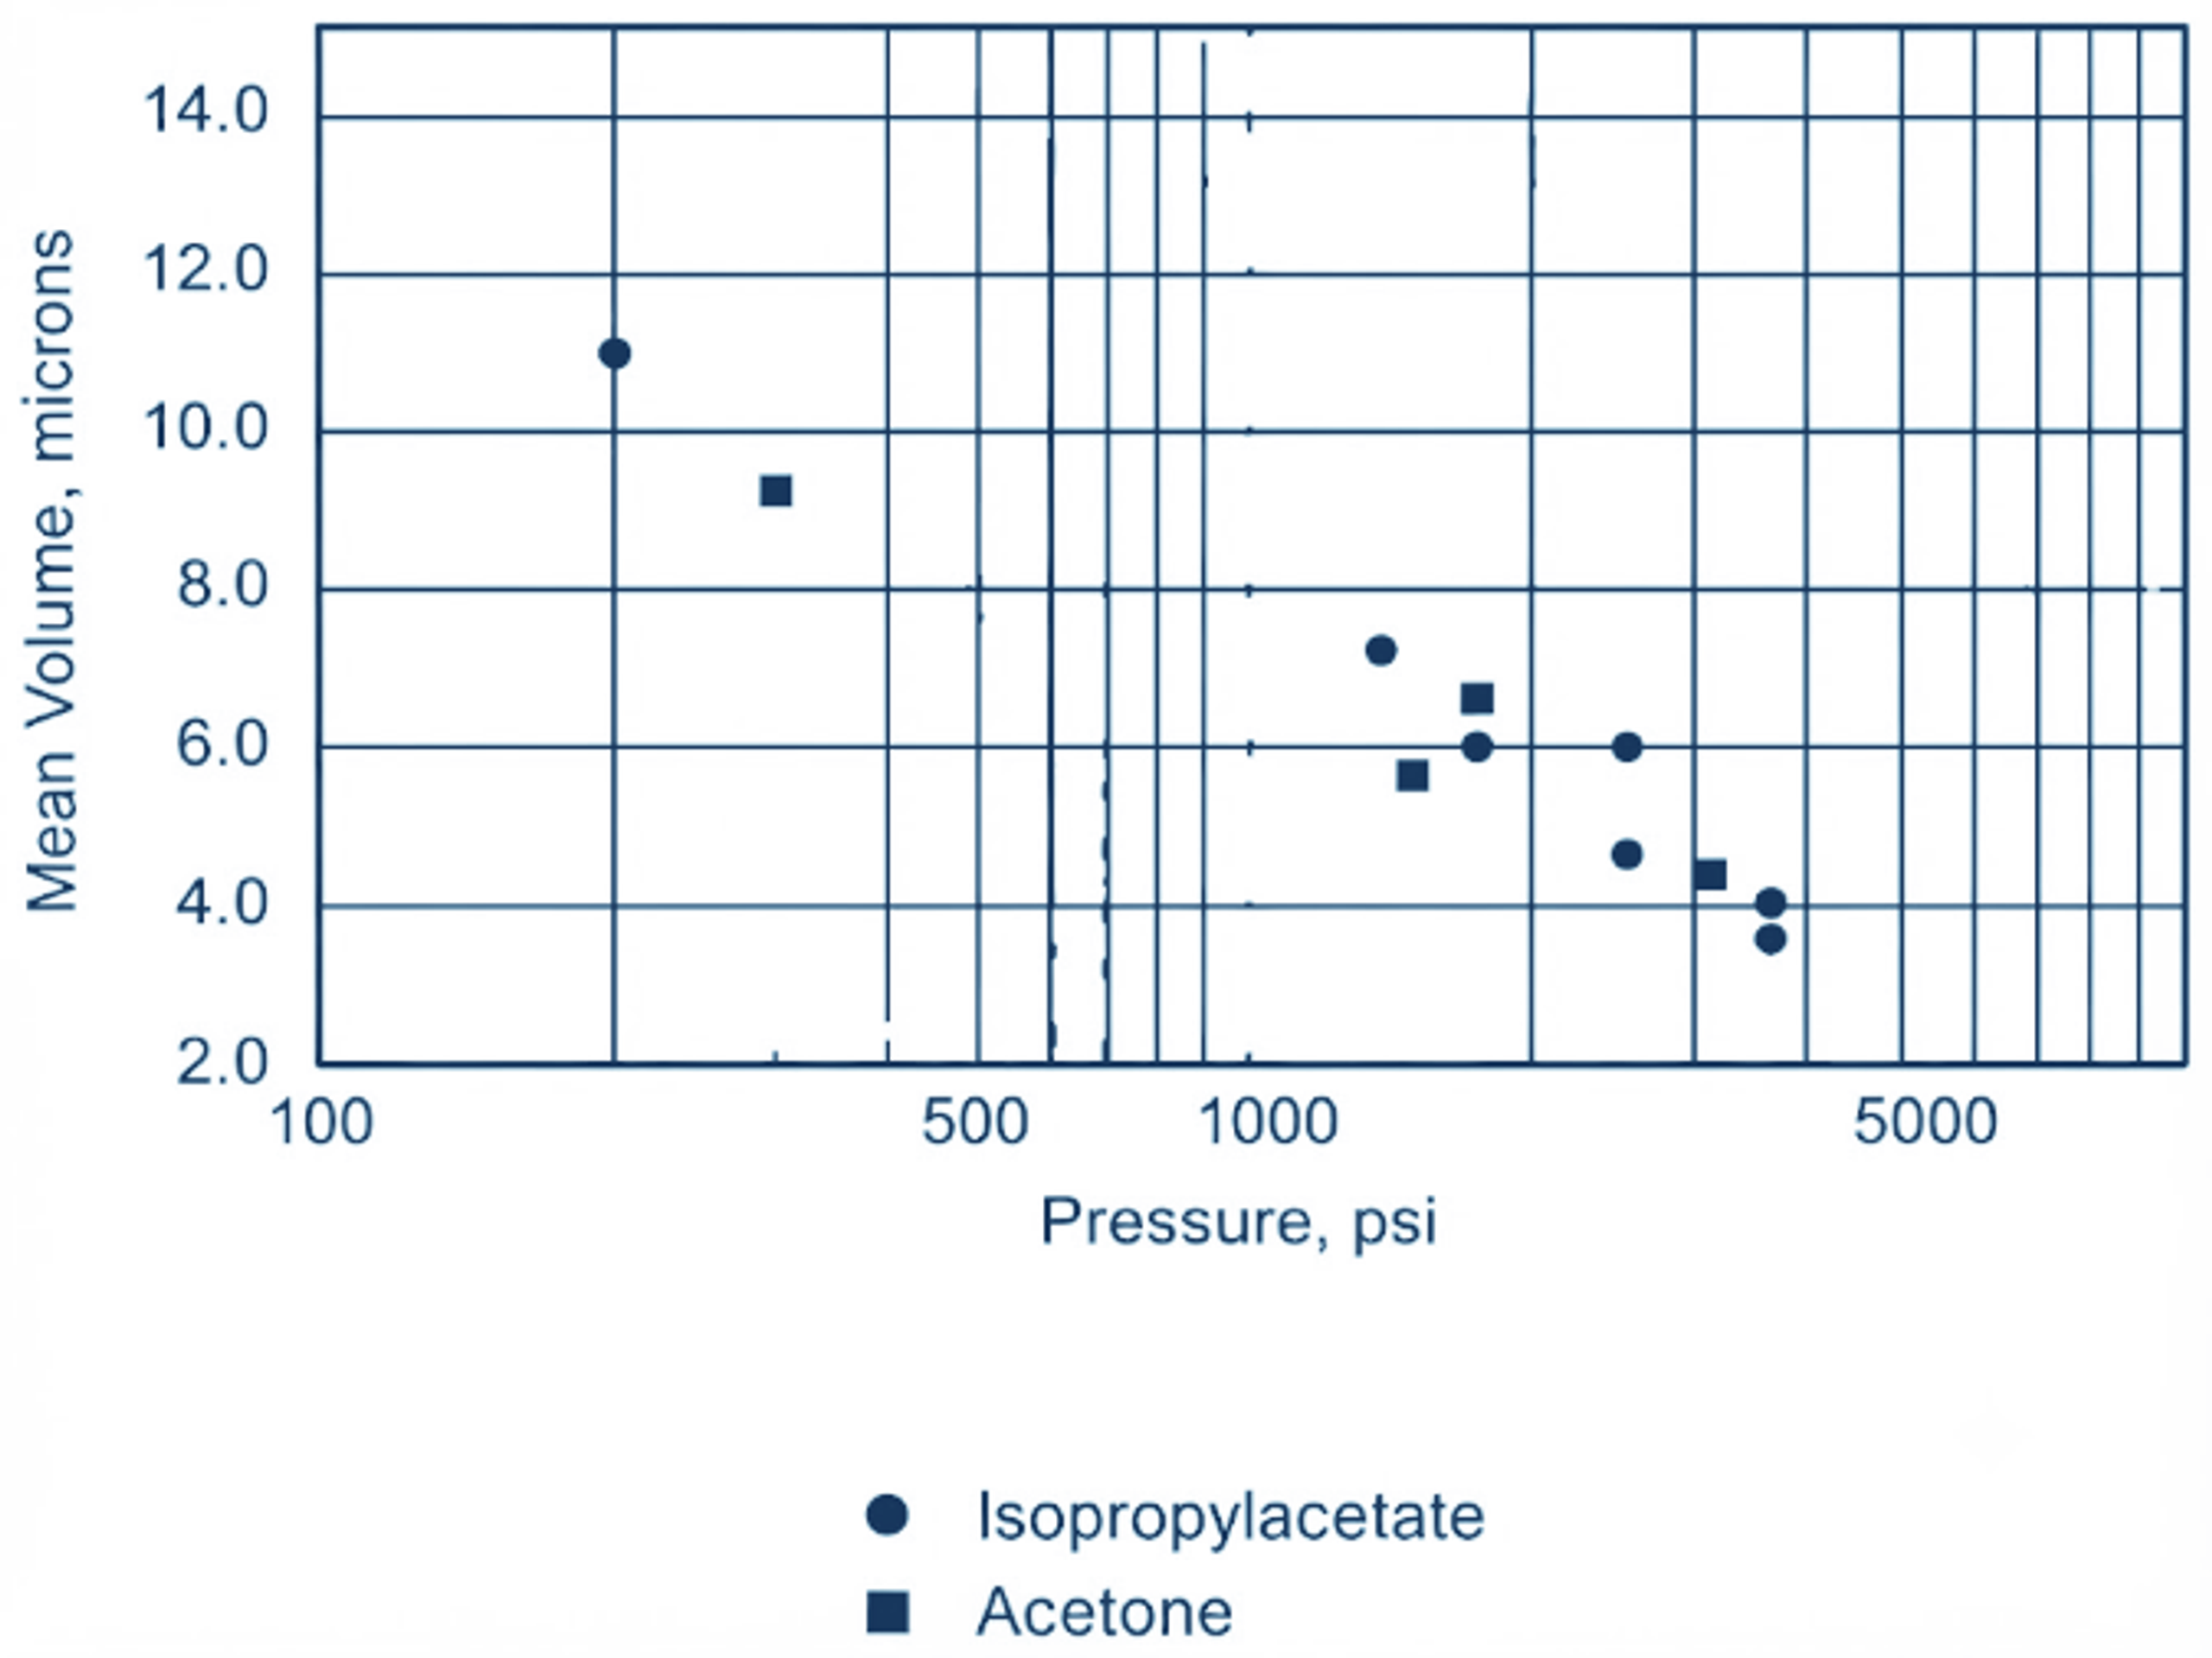
Figure 4.5. Influence of solvent on active ingredient crystal size as a function of processing pressure. [1]
Solids concentration is an important variable in particle reduction because each milling or dispersion method has a practical concentration range. In high pressure homogenization, solids concentration is often limited by the viscosity increase that accompanies higher solids loading, which can reduce turbulence and impair dispersion.
The concentration study indicates that increasing solids loading improved dispersion within the investigated range.
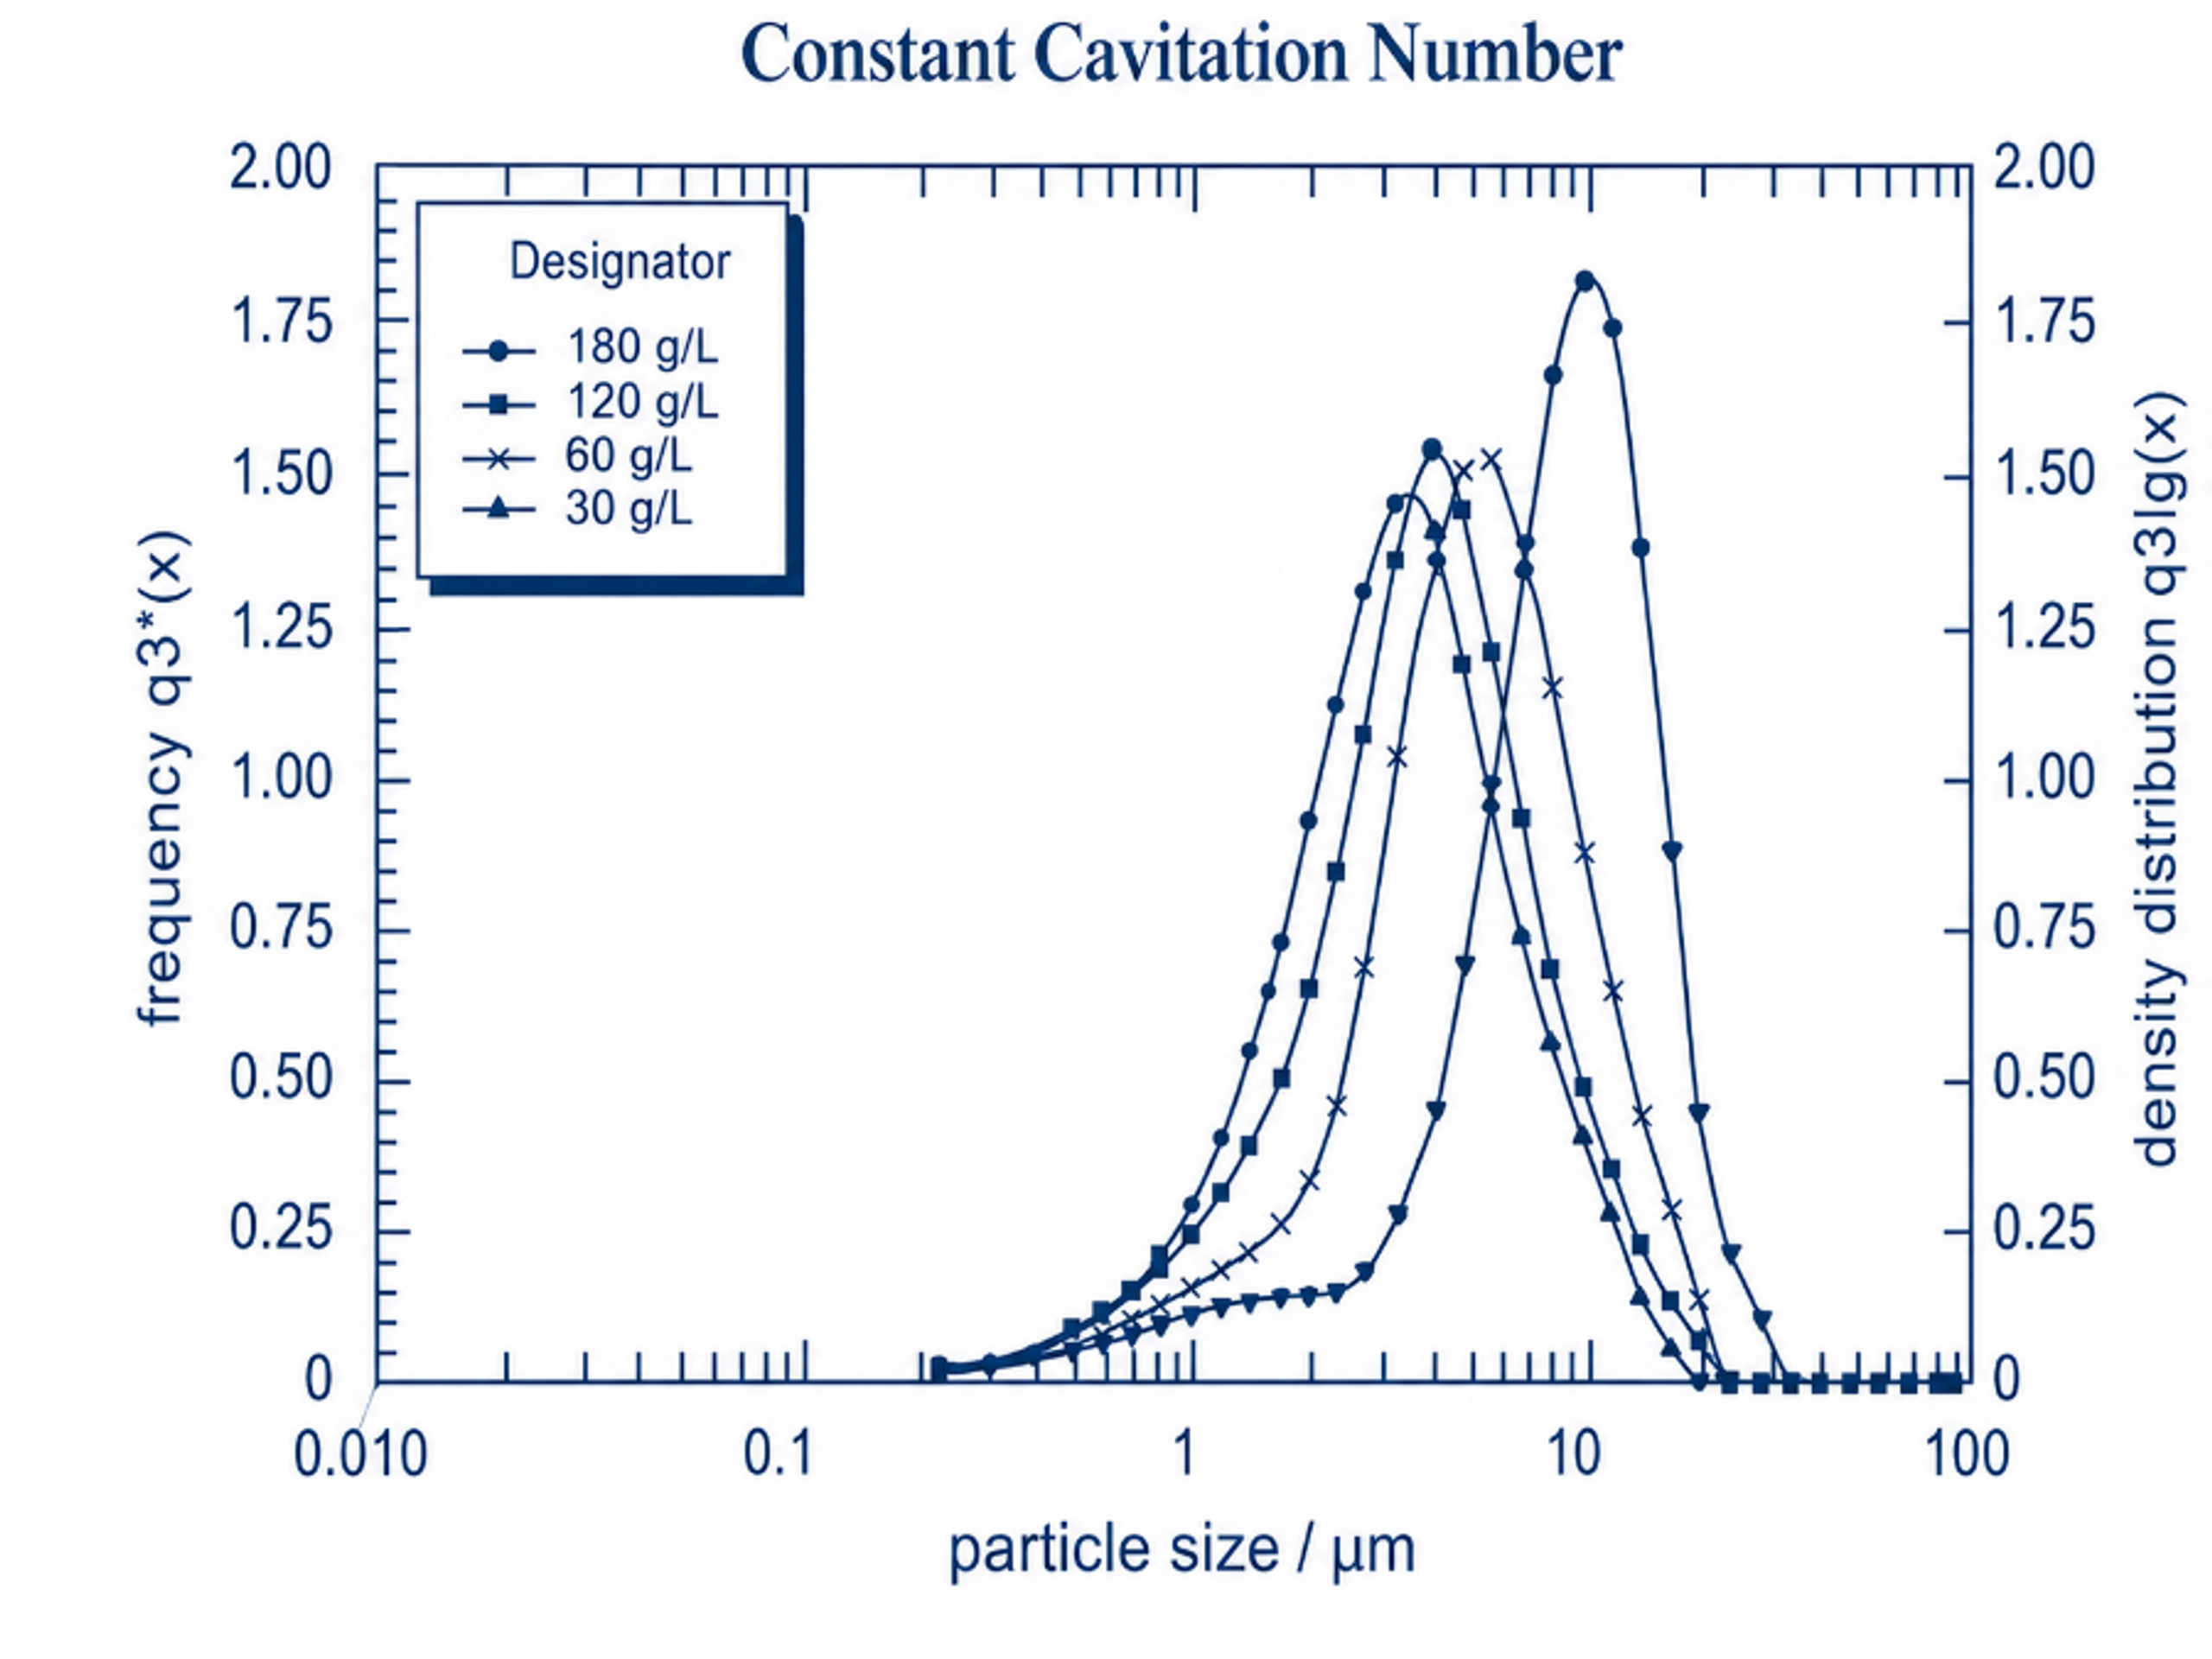
Figure 4.6. Influence of crystal concentration on particle size distribution at constant cavitation number. [28]
4.4 Reproducibility and Scaling
For production use, cavitation processing must be reproducible between batches and transferable from laboratory to pilot and commercial scales. Particle size variability can affect product performance and may create batch rejection, regulatory, and economic risk.
Three pilot scale batches processed at 11.3 L/min produced closely overlapping particle size distributions. The supplied scale comparison also shows similar distributions at two flow rates under 1000 and 2000 psi conditions [28].
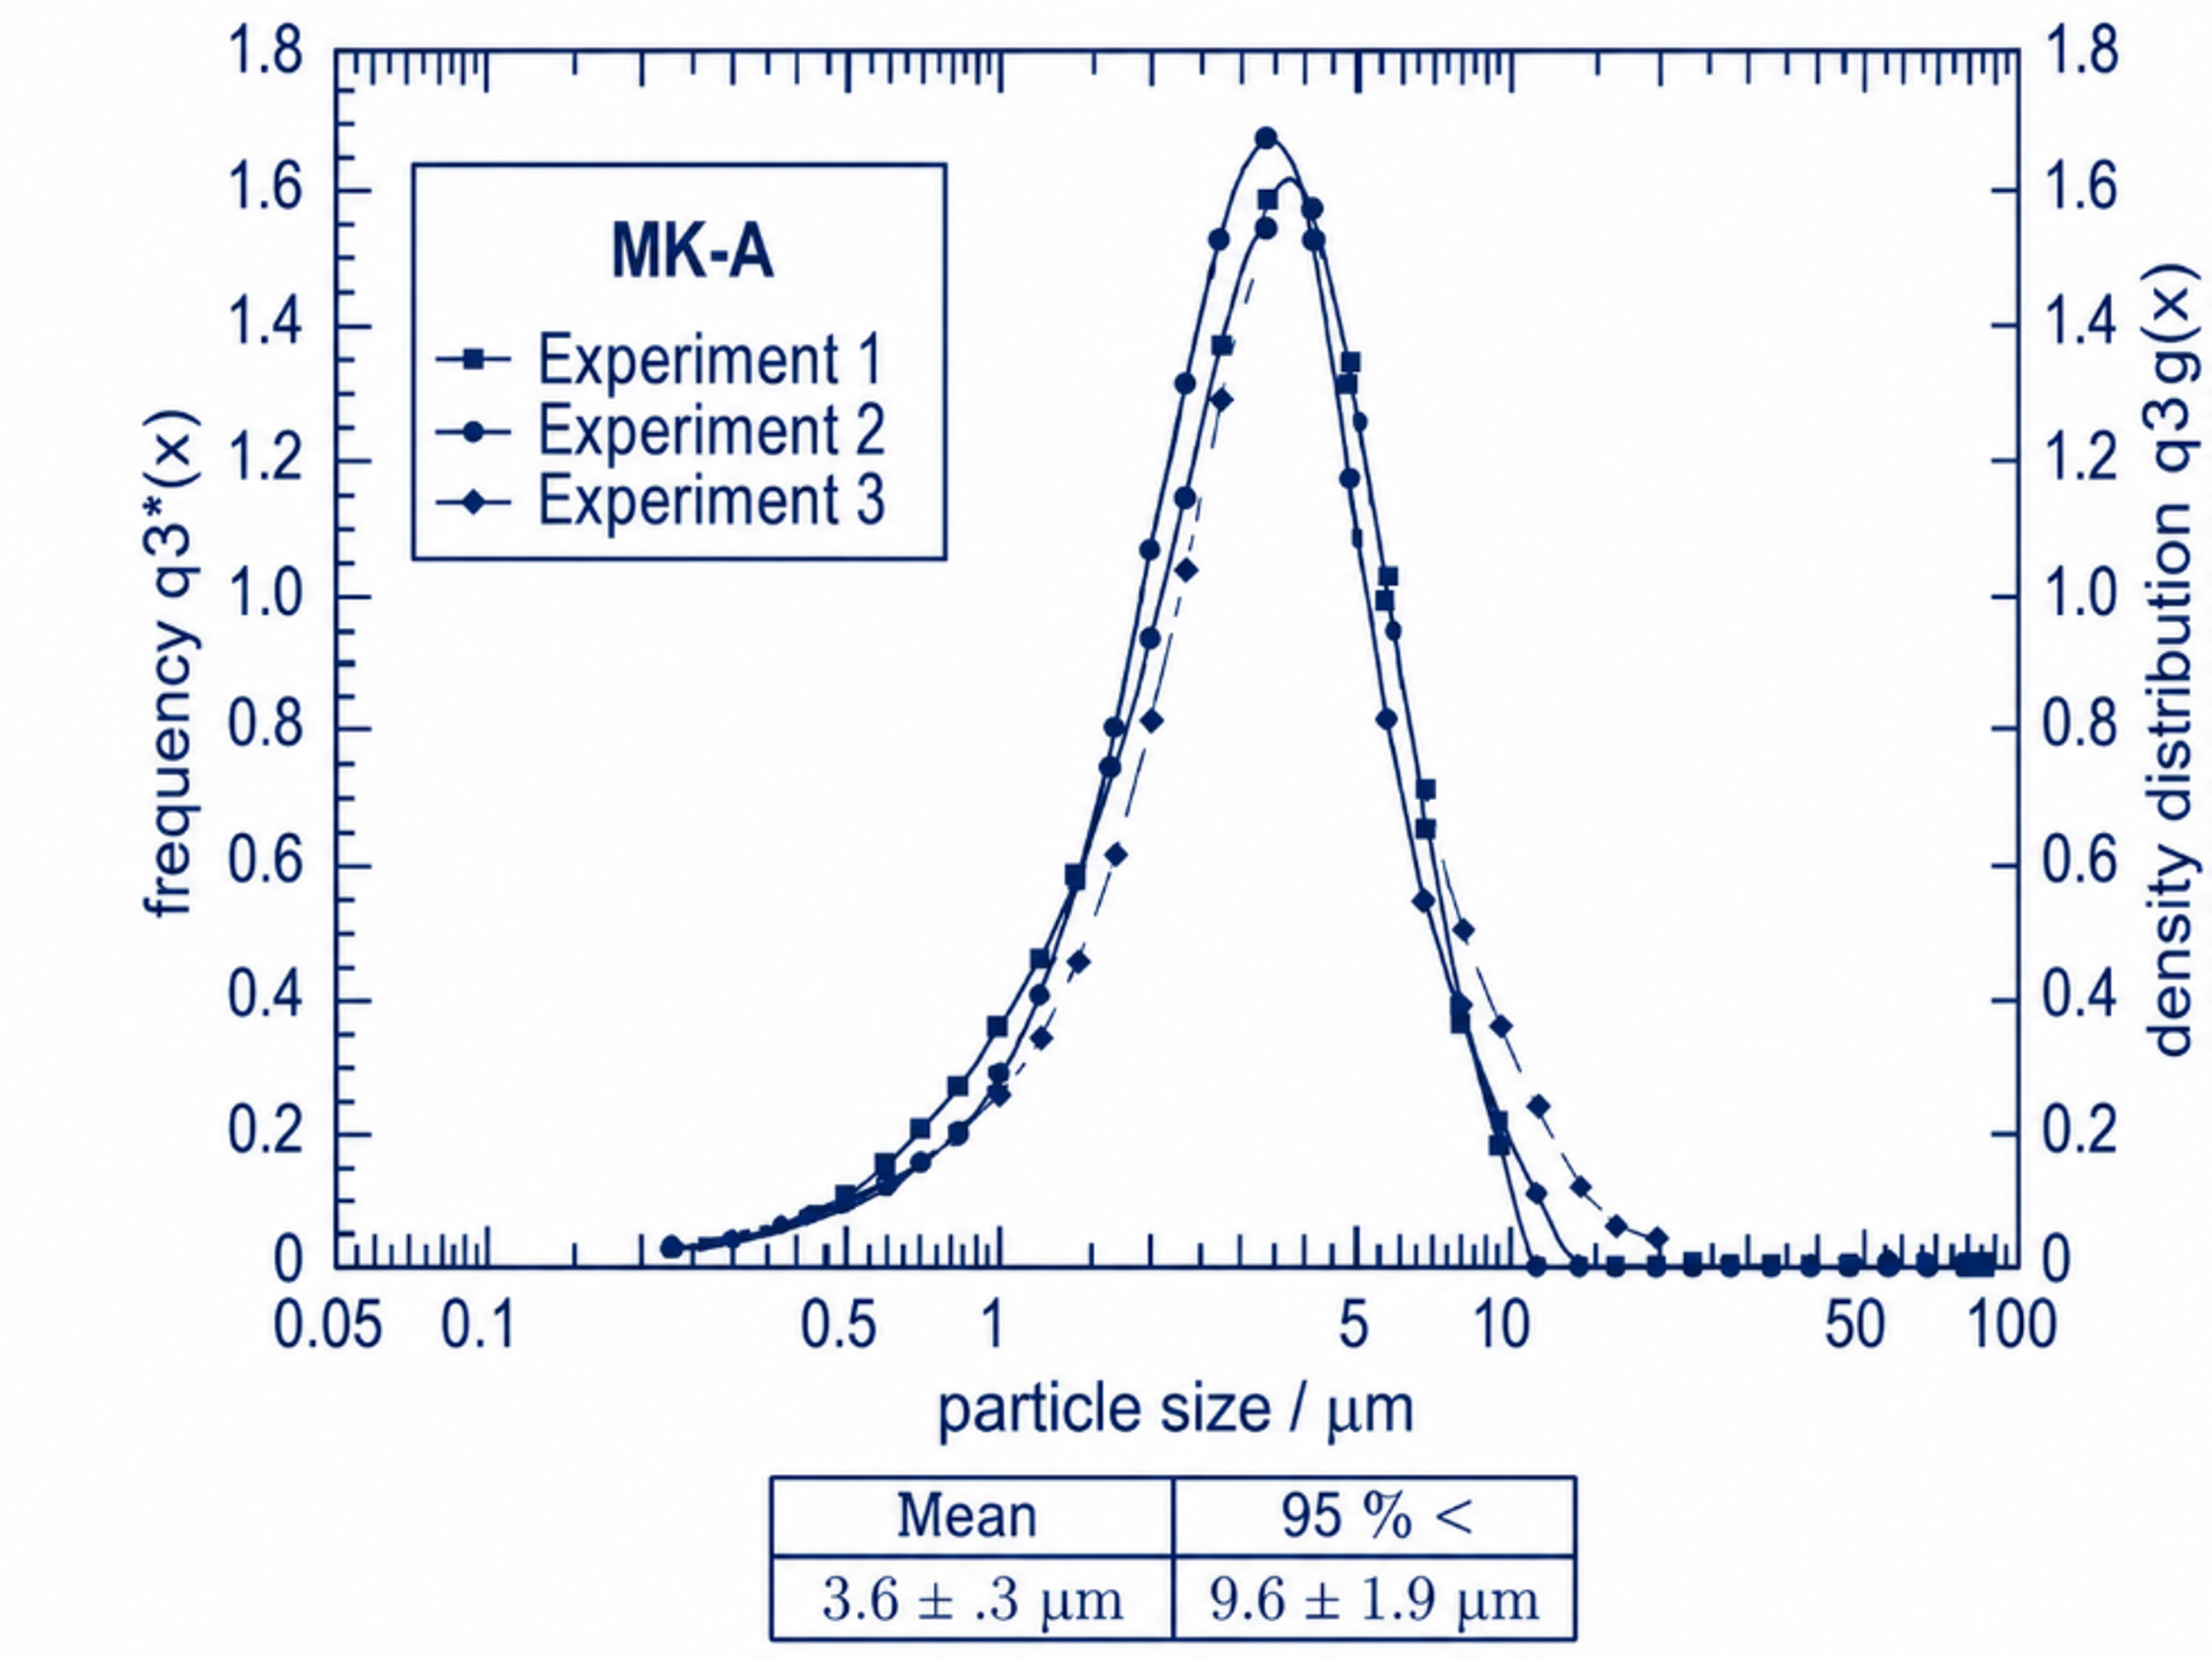
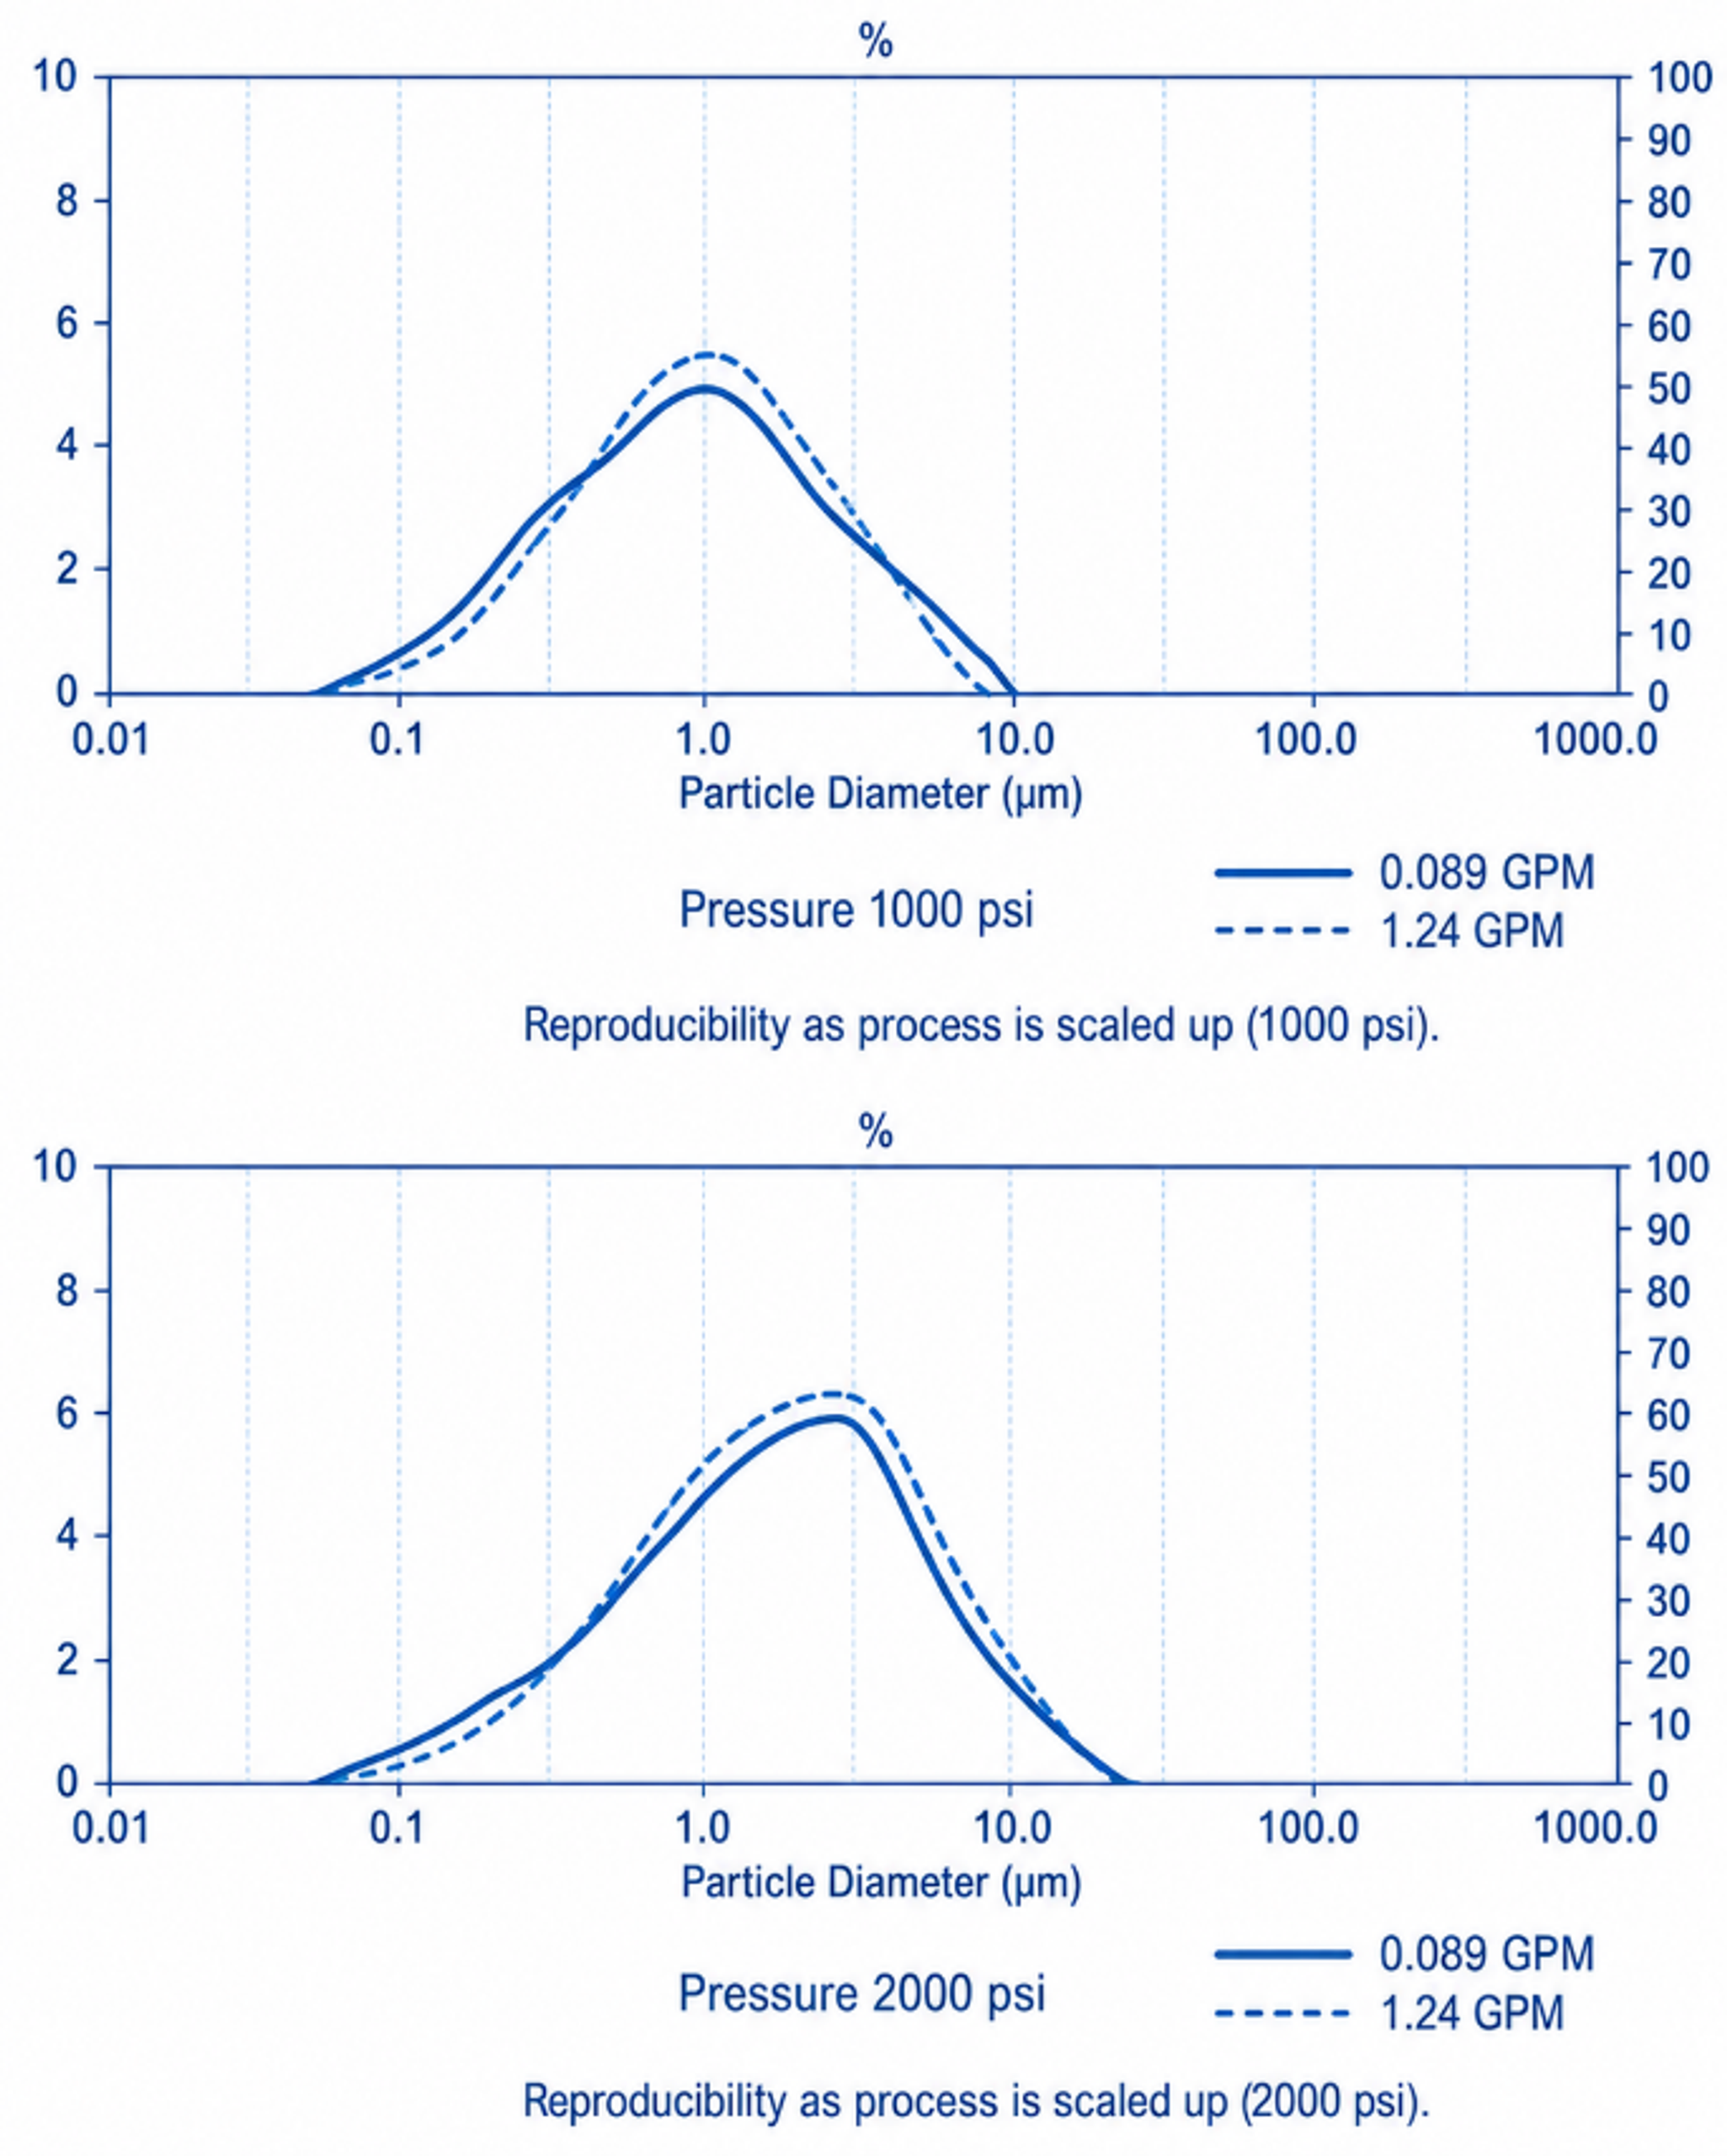
Figure 4.7. Reproducibility of three pilot scale cavitation milling batches and comparison of particle size distributions at two flow rates under 1,000 and 2,000 psi conditions. [1], [28]
4.5 Impinging Cavitating Jet Examples for Pharmaceutical Suspensions
The Microfluidics data provide several useful examples of how pressure, chamber geometry, and pass count were applied to pharmaceutical suspensions. A penicillin suspension processed in an M-210B at 18,000 psi used an upstream H230Z auxiliary module and downstream J210Z interaction chamber. One pass reduced the reported mean size from 53 µm to 12.1 µm [19]. An ophthalmic suspension processed in an M-110EH at 25,000 psi with H30Z and H10Z chambers was reduced from a reported 5 µm mean diameter to 0.75 µm after 35 continuous passes [20]. A 25% oral drug slurry processed in an M-110Y at 18,000 psi with H30Z and H10Z chambers was reduced from 28.407 µm to 0.831 µm after ten passes [21].
The BioPharmaceutical Formulations brochure provides additional laboratory cases. A drug nanosuspension for irritable bowel syndrome decreased from a reported 9.089 µm to 0.385 µm after 25 passes at 22,000 psi. A crystalline general anesthetic dispersion decreased from 29.141 µm to 0.142 µm after two passes at 18,000 psi. A crystalline organic salt decreased from 18.003 µm to 0.573 µm after 20 passes at 20,000 psi [24]. These examples demonstrate strong formulation dependence in pass efficiency.
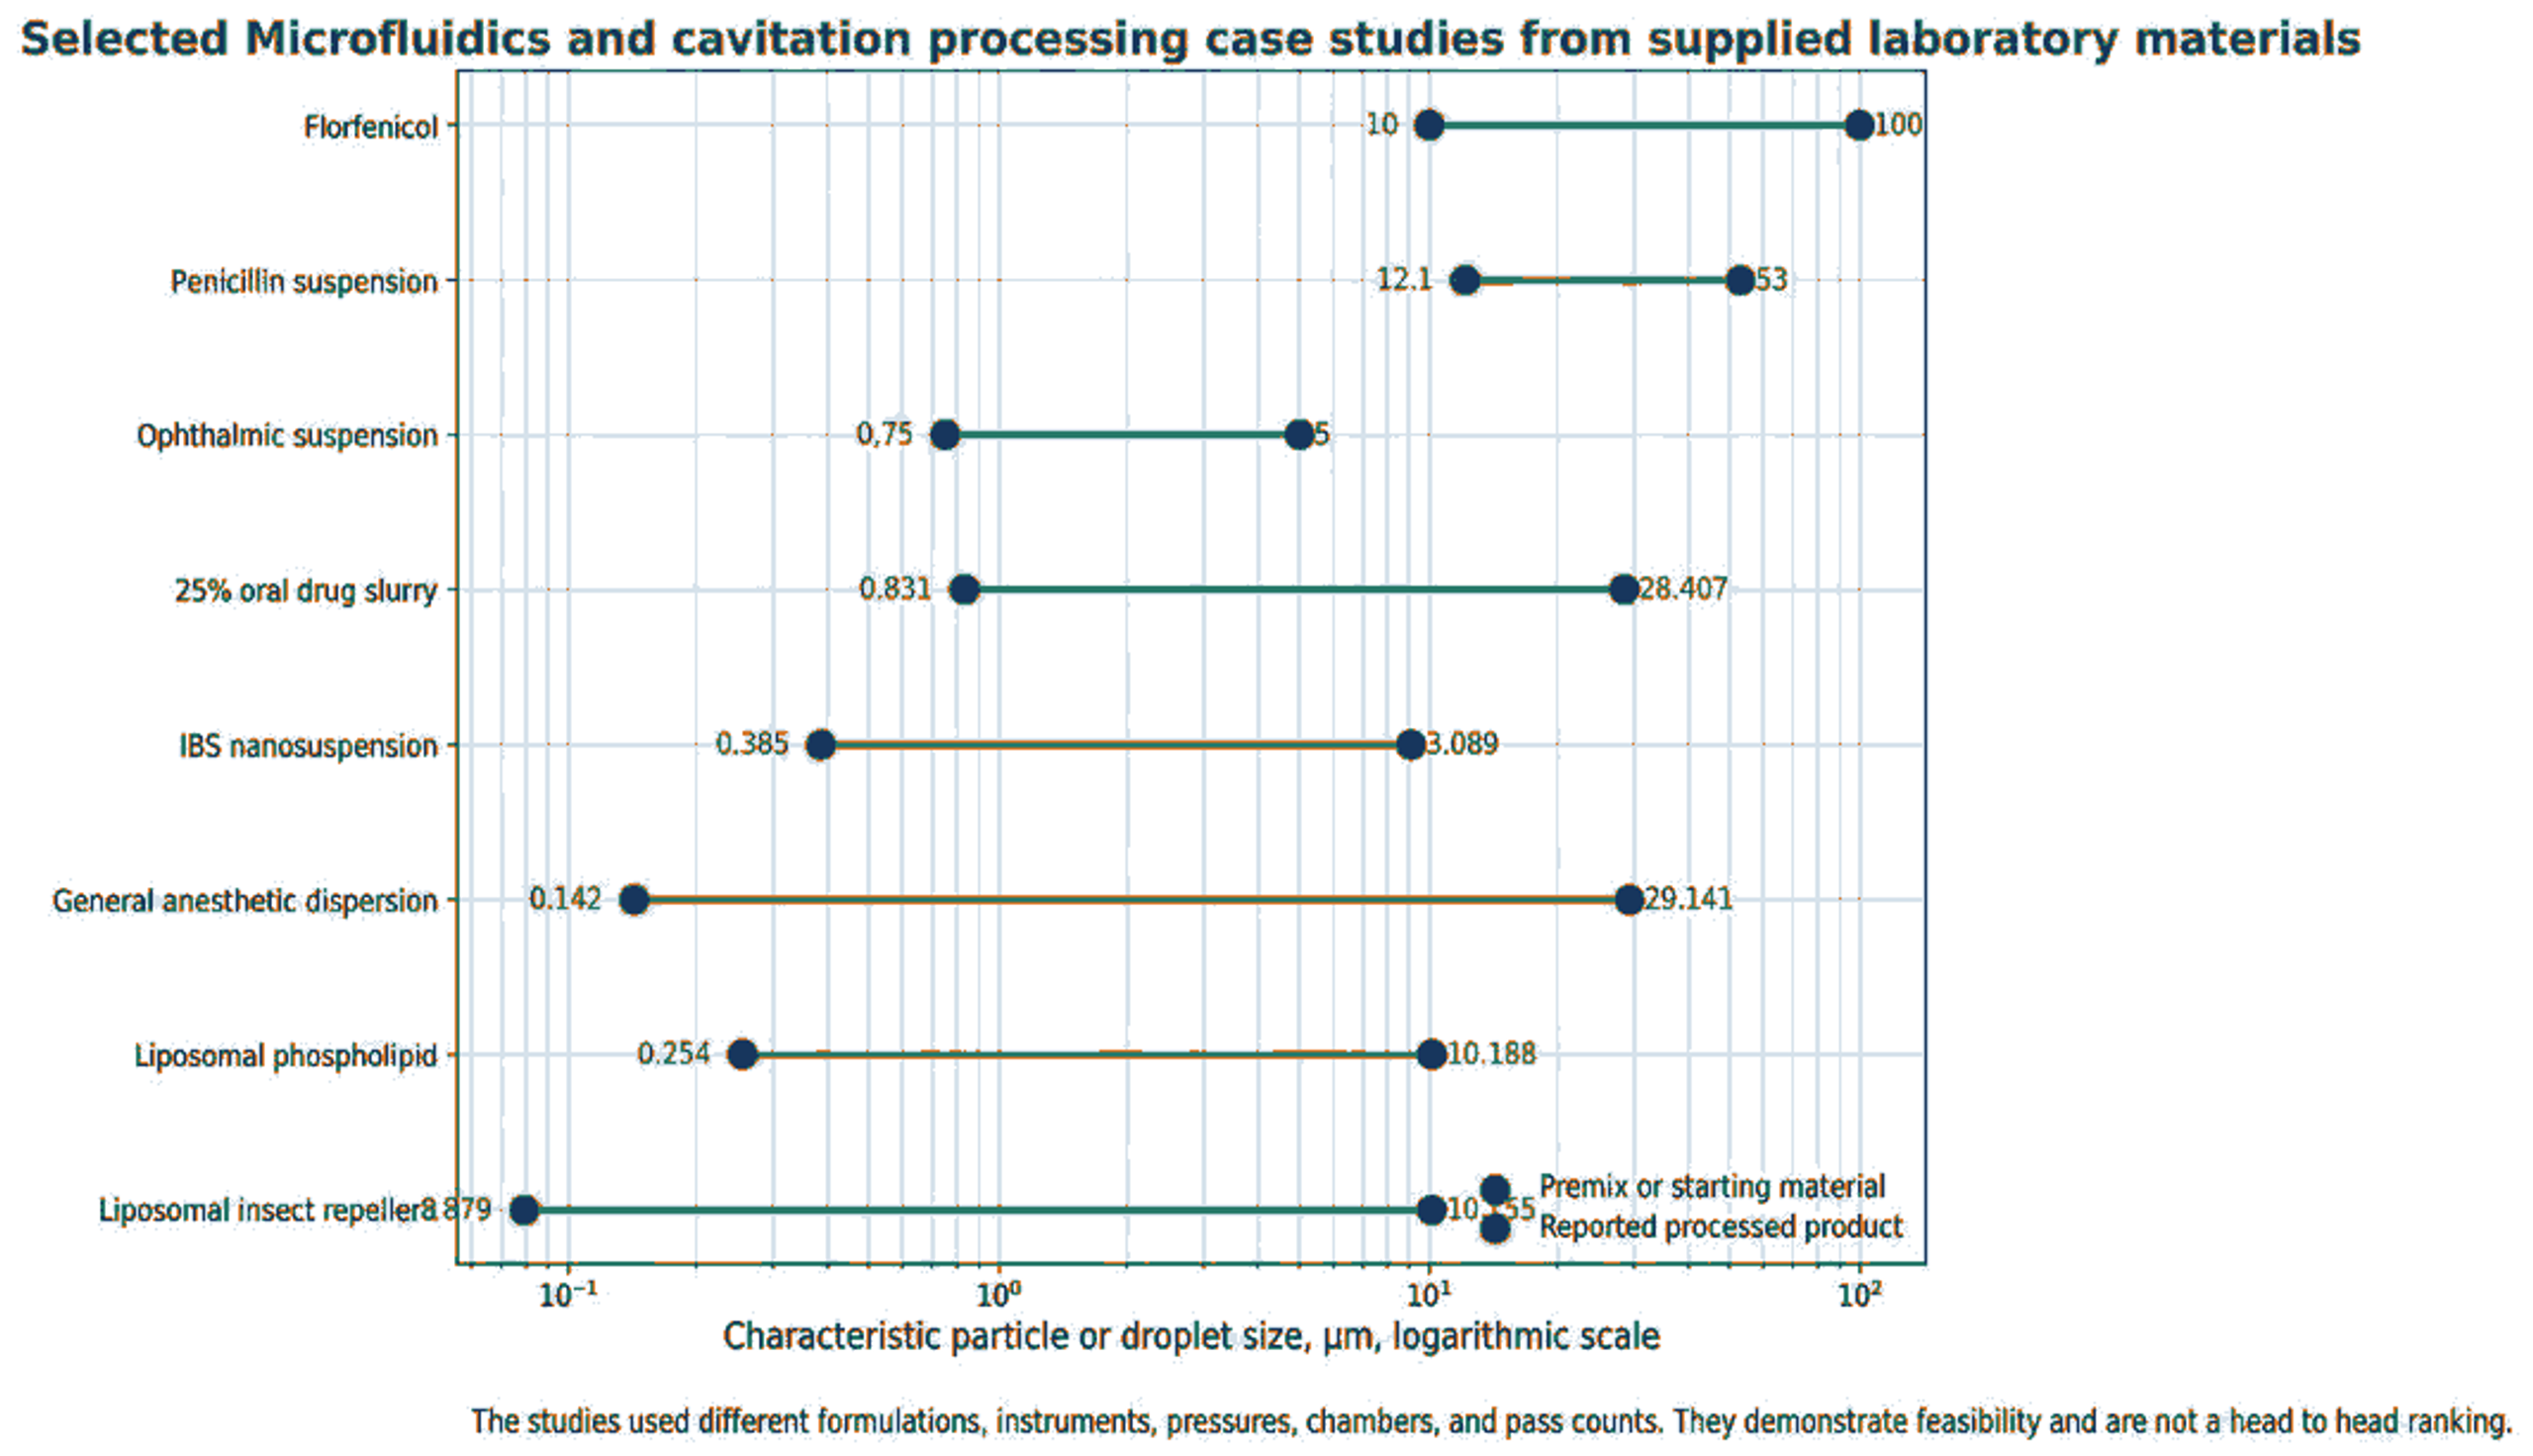
Figure 4.8. Selected particle and vesicle size changes in the supplied laboratory examples [42].
Table 4.1. Selected pharmaceutical particle size reduction cases. [19–21,24].
| Product | Processor and conditions | Starting size | Processed size | Interpretation |
|---|---|---|---|---|
| Penicillin suspension | M-210B; 18,000 psi; H230Z plus J210Z; 1 pass | 53 µm mean | 12.1 µm mean | Large one pass reduction, but final product remains in the low micrometer range. |
| Ophthalmic suspension | M-110EH; 25,000 psi; H30Z plus H10Z; 35 continuous passes | 5 µm mean | 0.75 µm mean | Submicron target required high cumulative exposure. |
| 25% oral drug slurry | M-110Y; 18,000 psi; H30Z plus H10Z; 10 passes | 28.407 µm mean | 0.831 µm mean | High solids loading was processed to submicron mean size. |
| IBS drug nanosuspension | 22,000 psi; 25 passes | 9.089 µm | 0.385 µm | Progressive reduction with diminishing returns. |
| General anesthetic dispersion | 18,000 psi; 2 passes | 29.141 µm | 0.142 µm | Rapid reduction in the supplied laboratory case. |
| Crystalline organic salt | 20,000 psi; 20 passes | 18.003 µm | 0.573 µm | Strong early reduction, followed by slower approach to a limiting size. |
4.6 Pressure, Chamber Geometry, and Pass Count
Higher pressure generally increases fluid velocity and local stress for a fixed chamber, but pressure response is not universal. The same pressure can produce different results when chamber geometry, fluid viscosity, temperature, surface tension, vapor pressure, solids concentration, or stabilizer system changes. The supplied Microfluidics pharmaceutical emulsion chart shows a decline in mean particle size from approximately 268 nm at 10,000 psi to approximately 127 nm at 20,000 psi after one pass. The curve also flattens at higher pressure, which is consistent with a practical limiting size [25].
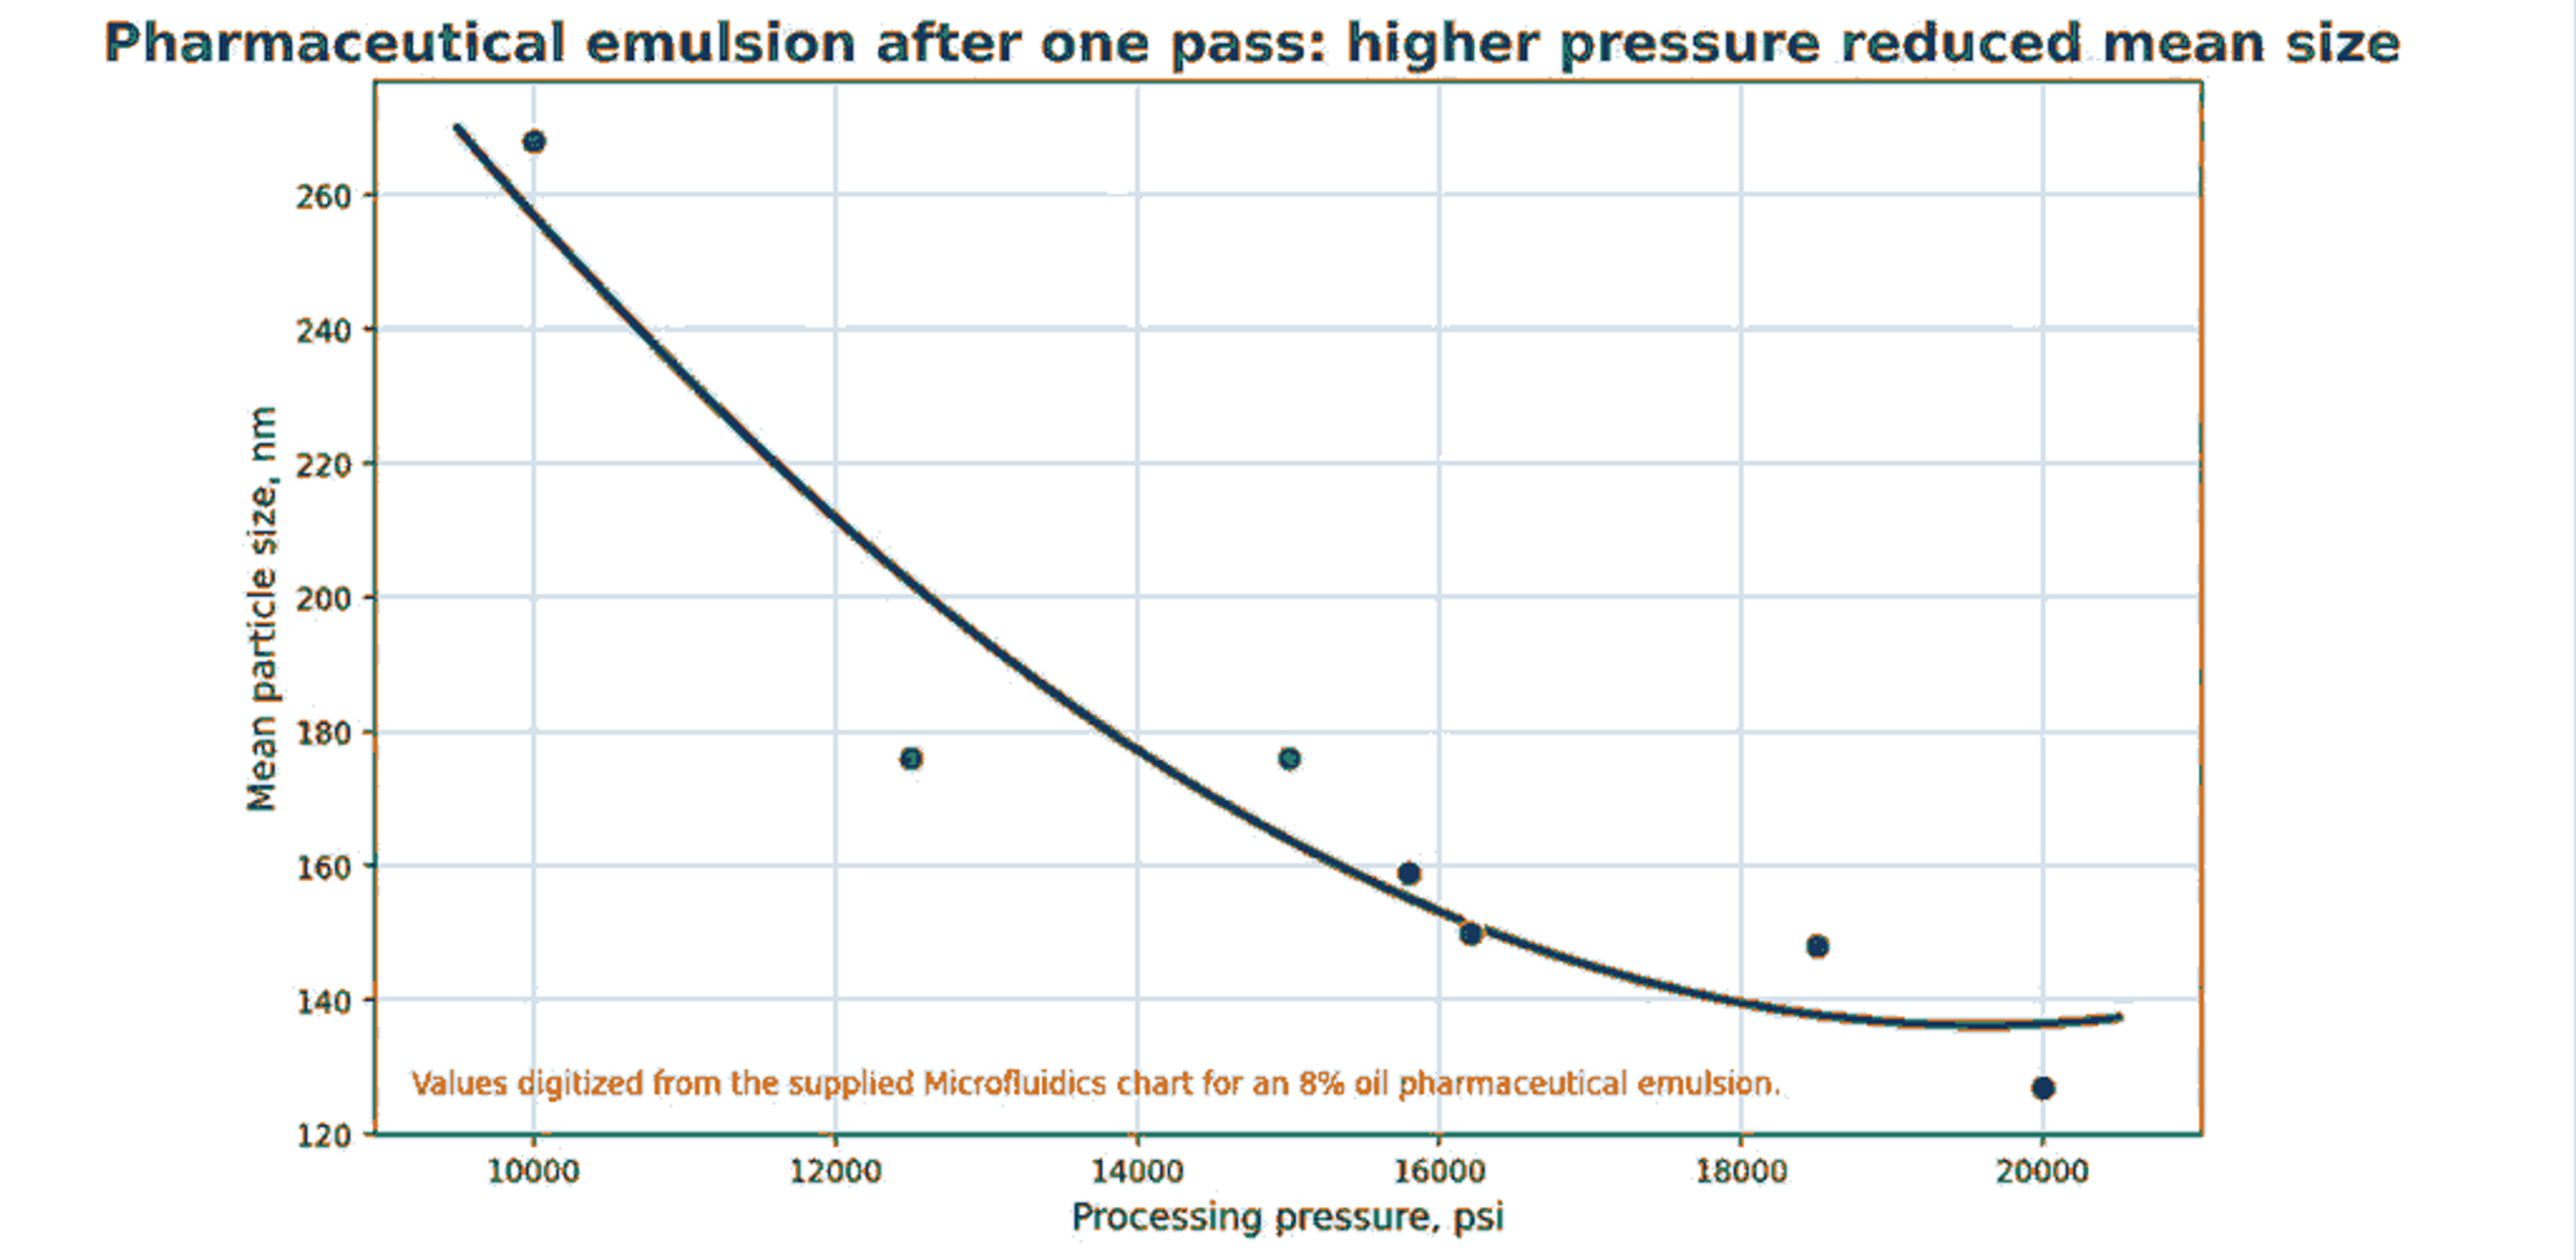
Figure 4.9. Effect of pressure on mean particle size for a pharmaceutical emulsion after one pass. [25].
Pass count and chamber geometry interact. The supplied three percent oil emulsion example shows that both 17,000 psi and 23,000 psi conditions decreased size with additional passes. The two chamber configurations approached similar final sizes after sufficient recirculation even though their early trajectories differed. This indicates that chamber choice can alter pass efficiency and that an apparently superior early pass may not produce a different steady condition [25].
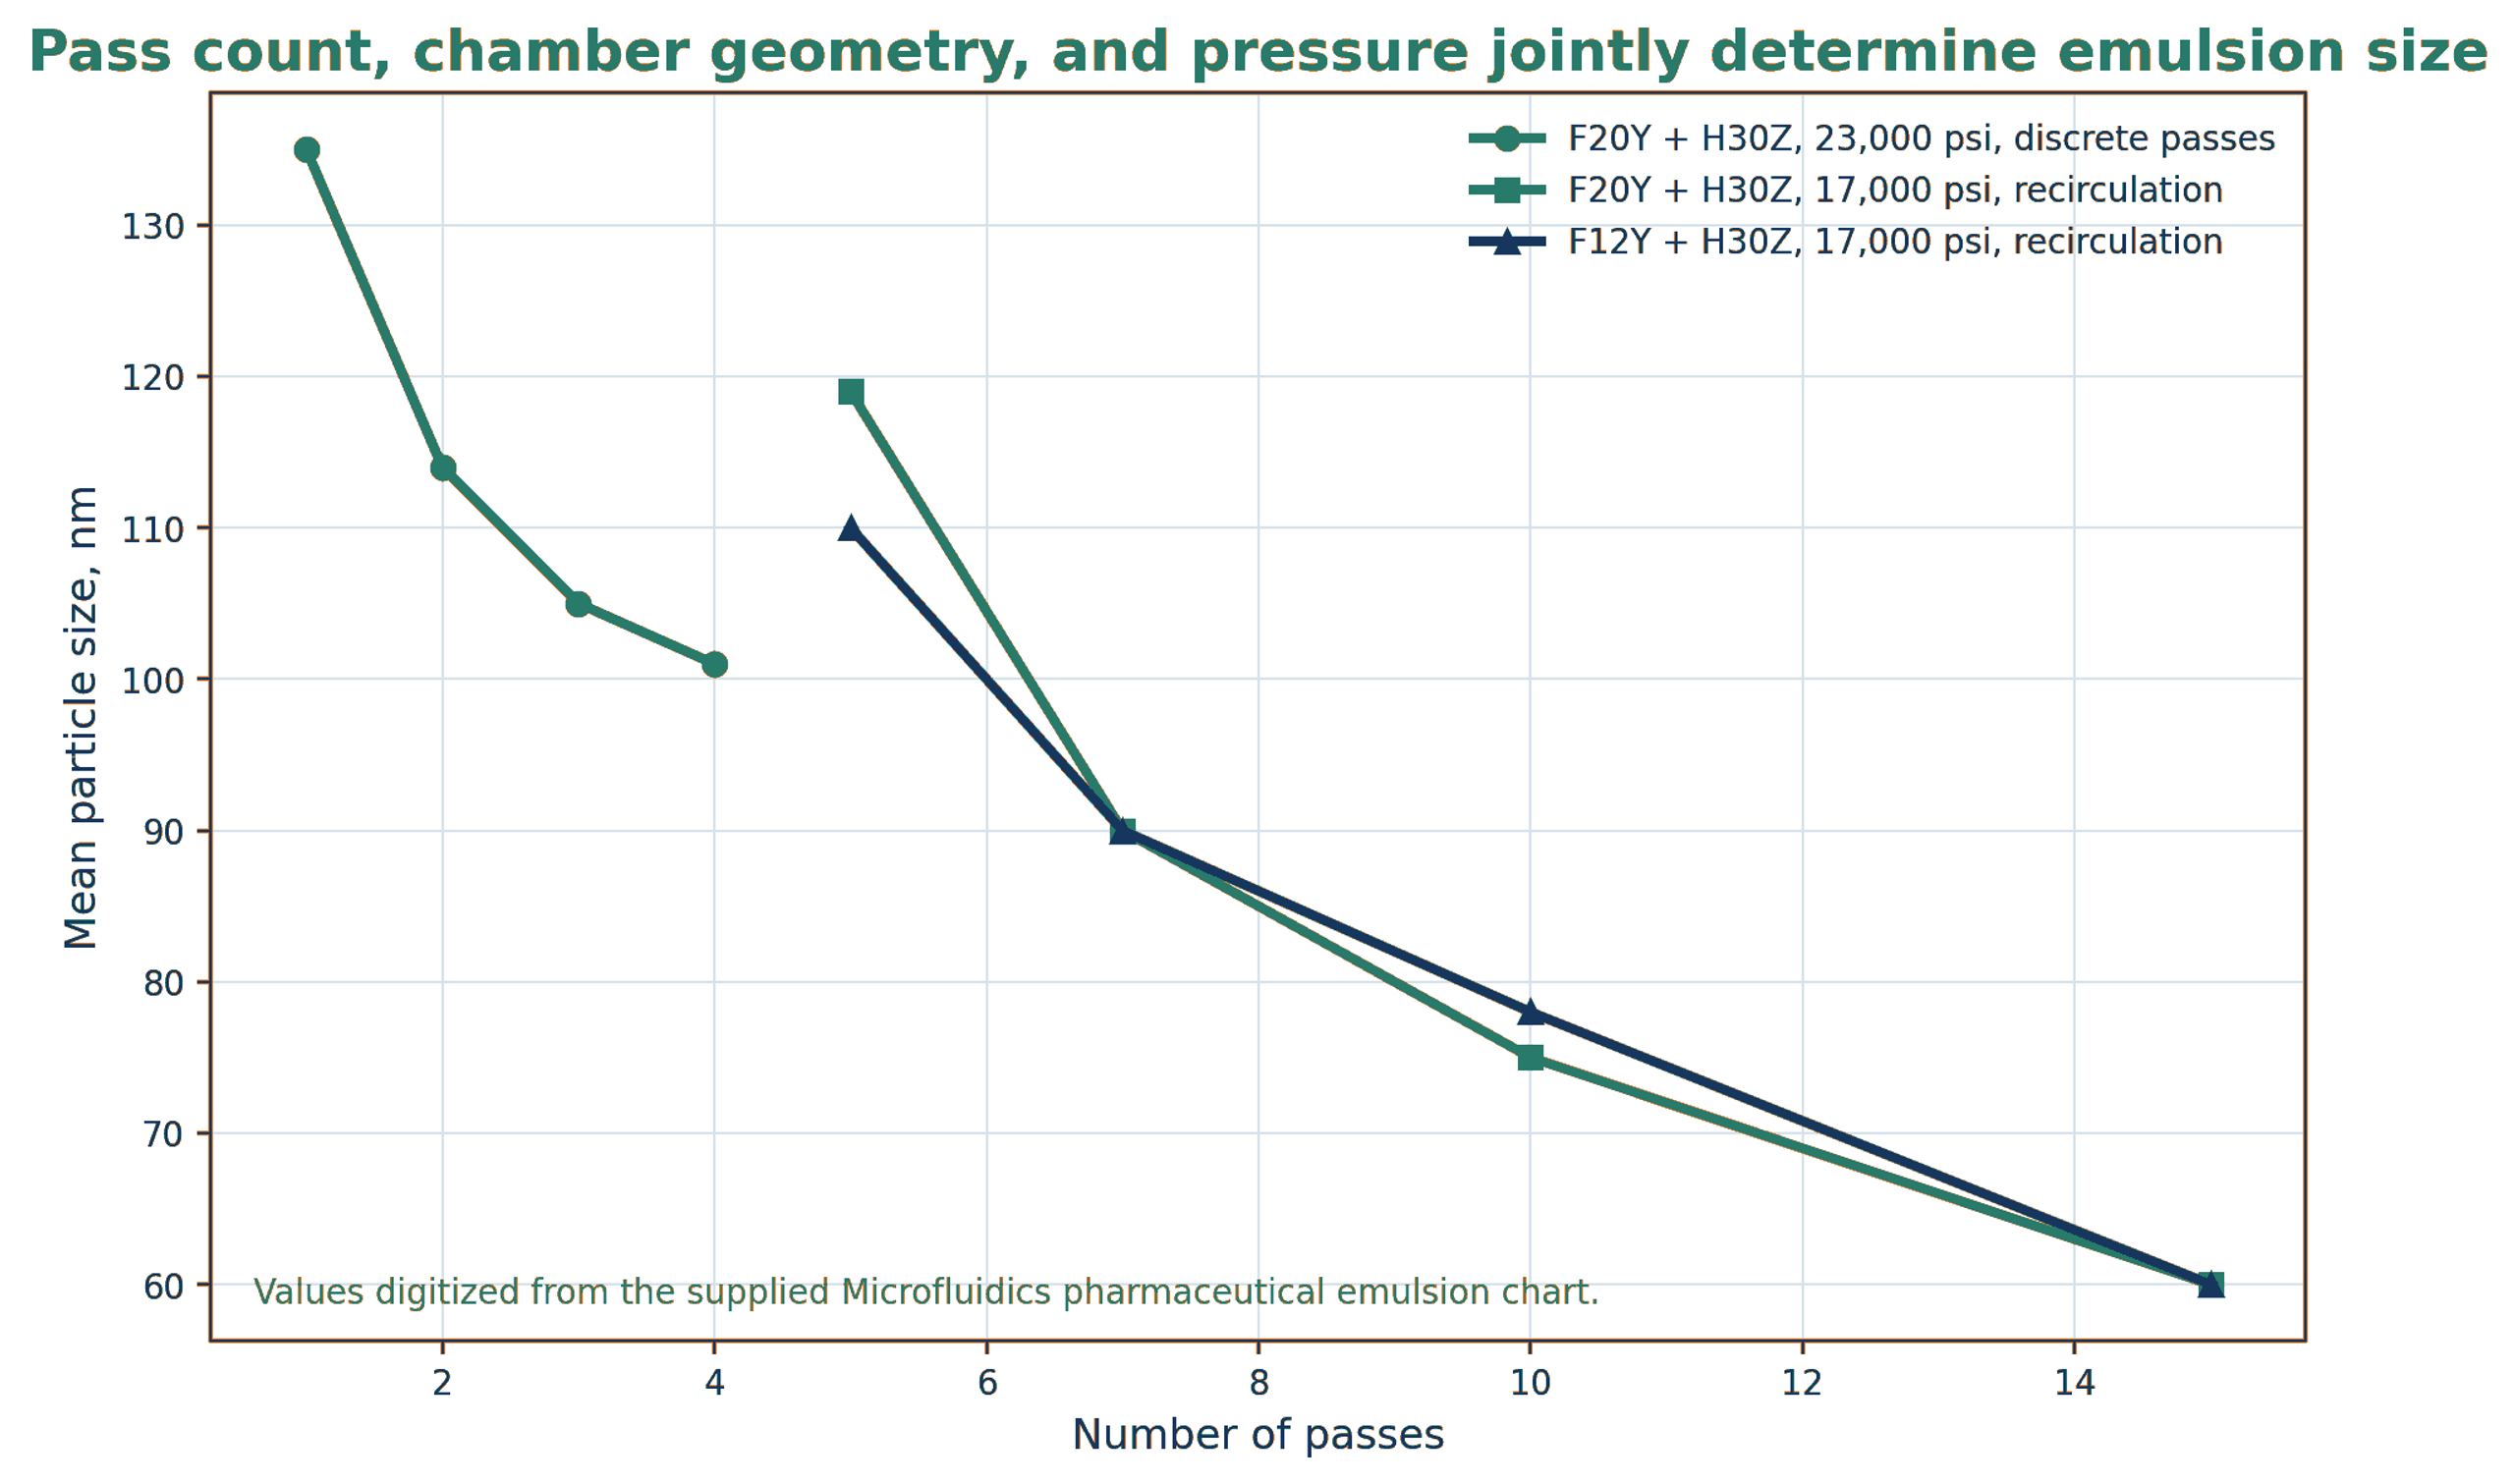
Figure 4.10. Combined influence of pass count, chamber geometry, and pressure in a pharmaceutical emulsion example. [25].
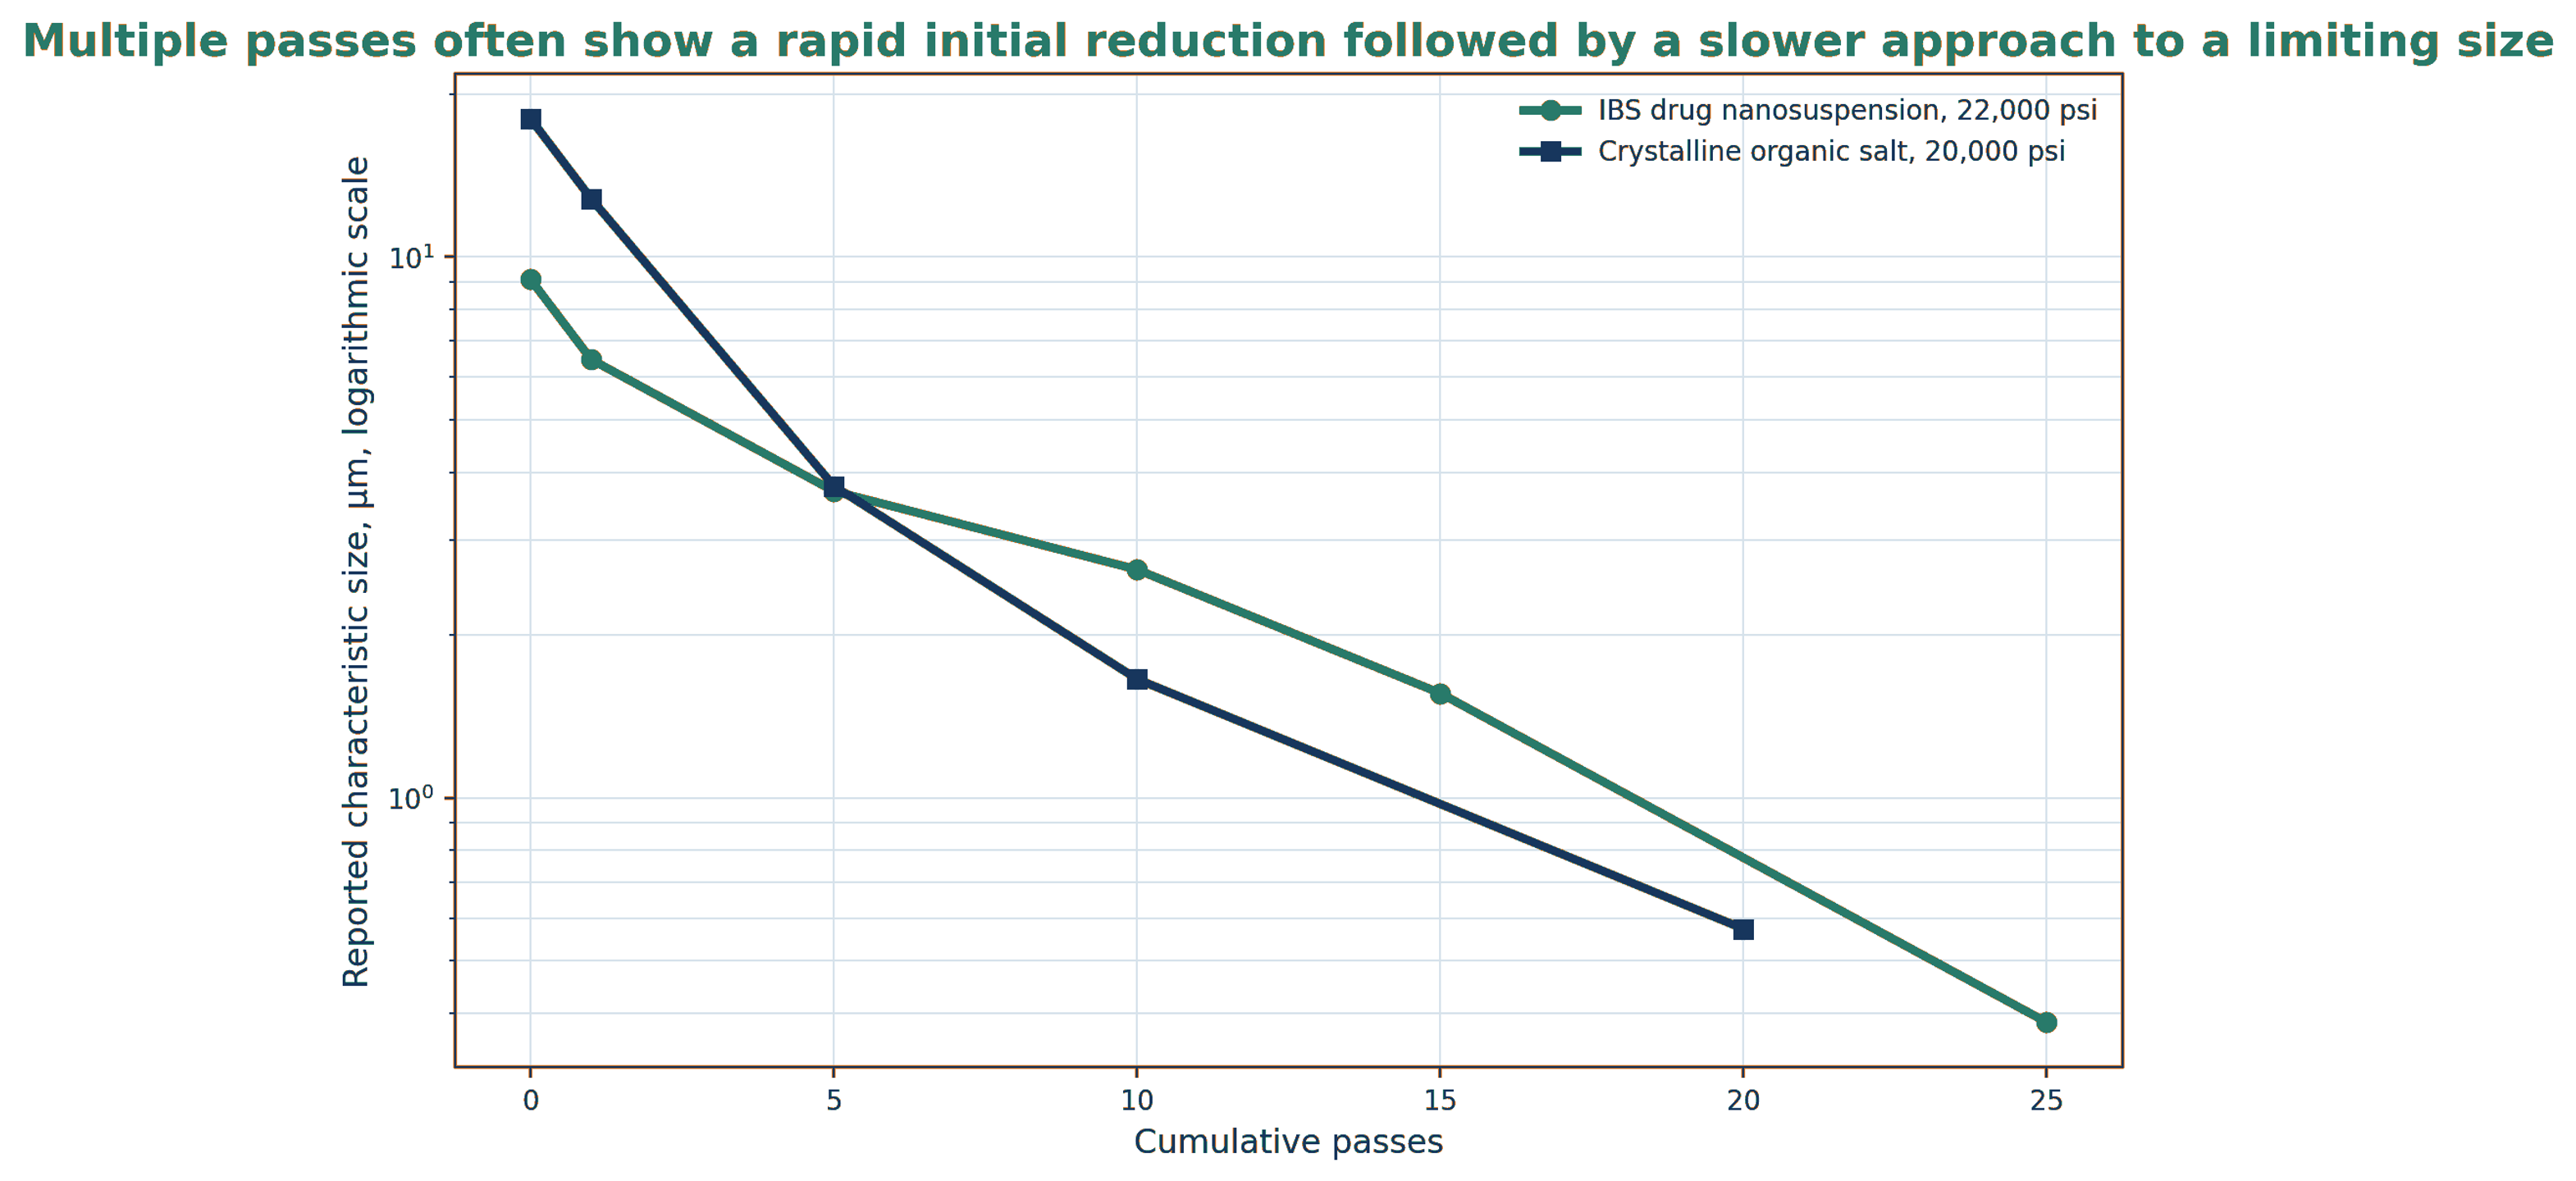
Figure 4.11. Diminishing returns with cumulative passes in two supplied pharmaceutical suspension examples. [24].
4.7 Naproxen Cavitation Milling Example
The supplied study reports cavitation processing of a 7 wt% naproxen suspension containing hydroxypropyl cellulose, sodium lauryl sulfate, and water. The control D50 was 8.27 µm. At 62.0 MPa and 102.3 cumulative passes, D50 decreased to 2.41 µm. At the same pressure and 204.7 passes, D50 decreased further to 2.10 µm. The additional reduction between 102.3 and 204.7 passes was substantially smaller than the initial reduction. At 172.4 MPa and 35 passes, D50 was 2.41 µm, showing that pressure and pass count cannot be optimized independently [1].
Table 4.2. Naproxen cavitation milling results. Source: supplied cavitation article.
| Pressure, MPa | Cumulative passes | D[3,4], µm | D10, µm | D50, µm | D90, µm |
|---|---|---|---|---|---|
| Control | Not applicable | 10.43 | 3.07 | 8.27 | 20.28 |
| 17.2 | 50.7 | 5.66 | 2.16 | 4.73 | 10.37 |
| 62.0 | 102.3 | 2.76 | 1.18 | 2.41 | 4.83 |
| 62.0 | 204.7 | 2.31 | 1.10 | 2.10 | 3.85 |
| 172.4 | 35.0 | 2.83 | 1.19 | 2.41 | 5.03 |
4.8 Comparison with Conventional Particle Reduction Technologies
Conventional pharmaceutical particle size reduction technologies include rotor stator wet milling, dry jet milling, wet media milling, and high pressure homogenization. Each method has valid applications in development and manufacturing. Selection depends on active ingredient properties, dosage form, target size distribution, sterility requirements, excipient and solvent systems, batch size, cleaning burden, and acceptable risks of degradation or contamination [9–15,18–25,28].
For the same active ingredient in the supplied comparison, cavitation milling produced the smallest mean particle size and a relatively narrow distribution compared with dry milling and rotor stator milling [28].
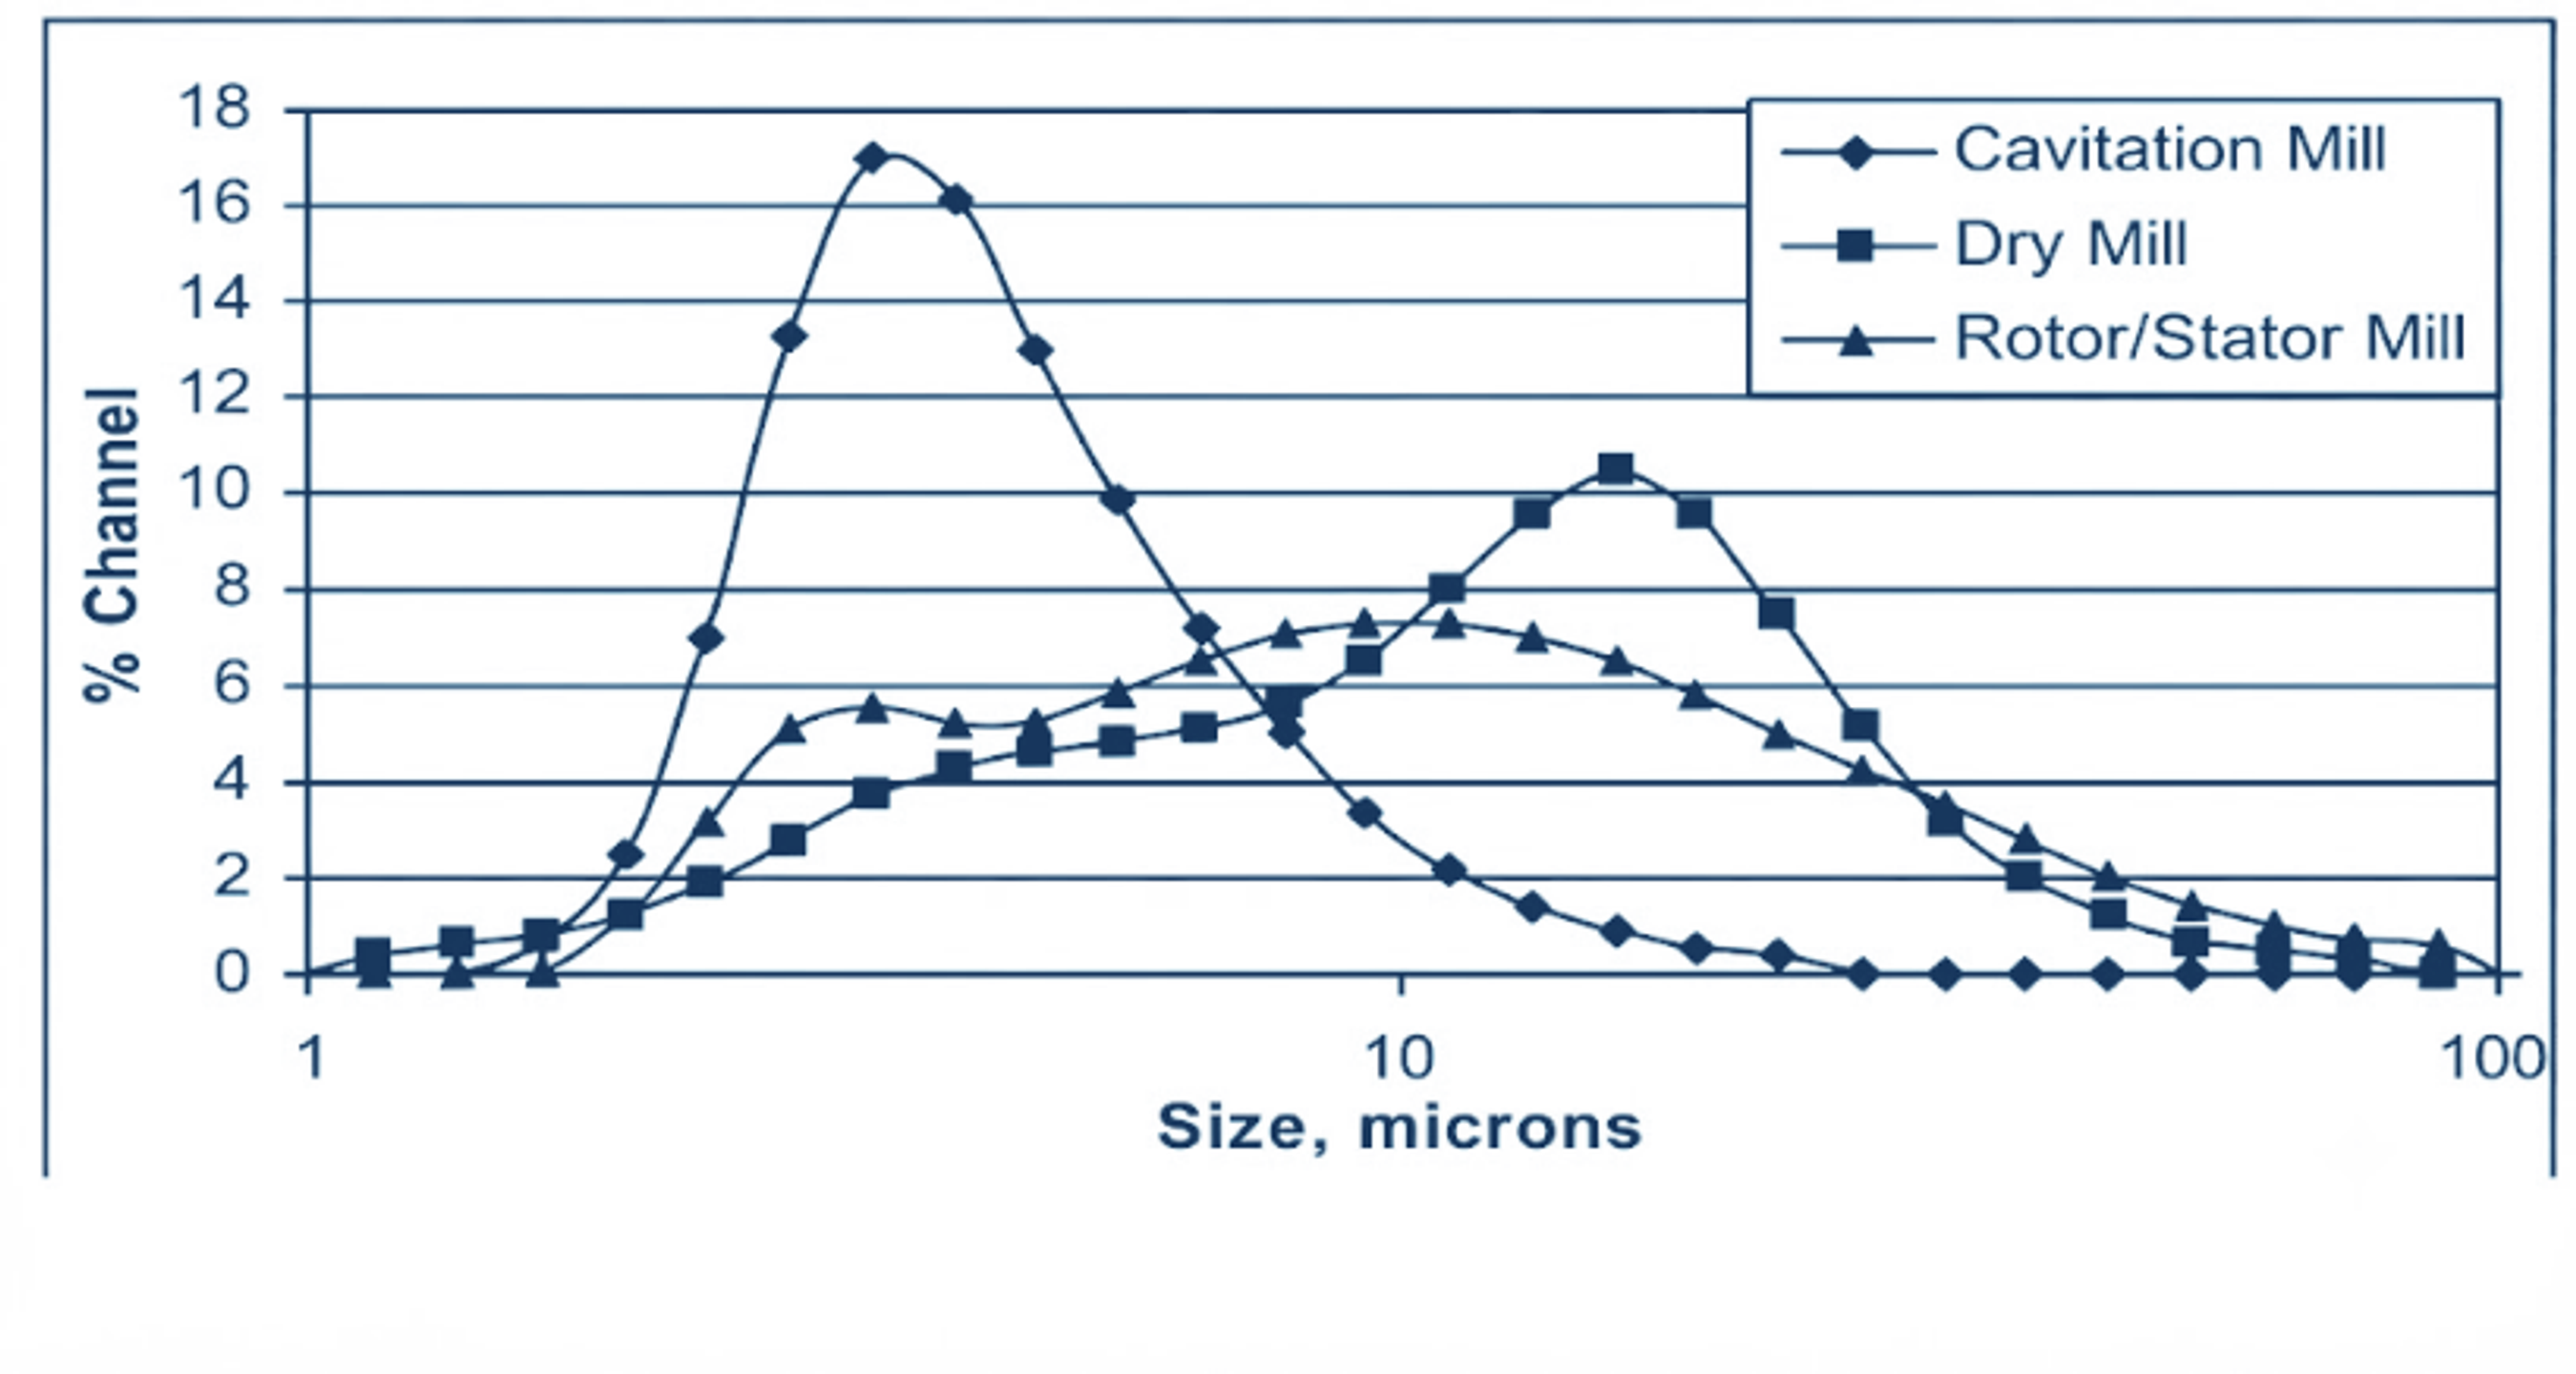
Figure 4.12. Comparison of cavitation, dry, and rotor stator milling for the same active ingredient. [28]
Media milling and cavitation processing without milling media should be compared with respect to contamination, degradation, scale up, cleaning, processing time, and particle size distribution. Eliminating milling media removes one potential source of particulate contamination and can simplify cleaning, but these advantages must be balanced against cavitation equipment wear, heat generation, pump requirements, and the need to demonstrate product performance with validated analytical methods [18–22].
Media milling may introduce contaminants from the milling media and may require long processing cycles, media separation, and extensive cleaning. A media free cavitation process removes that specific contamination source and may reduce processing time. However, cavitation systems still require control of equipment wear, heat removal, pressure history, and scale dependent hydraulic behavior. Claims of narrower distributions or easier scale up should be confirmed for the formulation and commercial equipment under study.
High pressure homogenizers are widely used for emulsions and nanosuspensions. In the selected propofol examples, the supplied cavitation data show narrower particle or droplet size distributions with fewer passes or at lower pressure than the reported gap homogenizer conditions [1]. These comparisons are illustrative development data, not a universal ranking of technologies. Commercial performance depends on the complete formulation, equipment configuration, and manufacturing process [9–15].
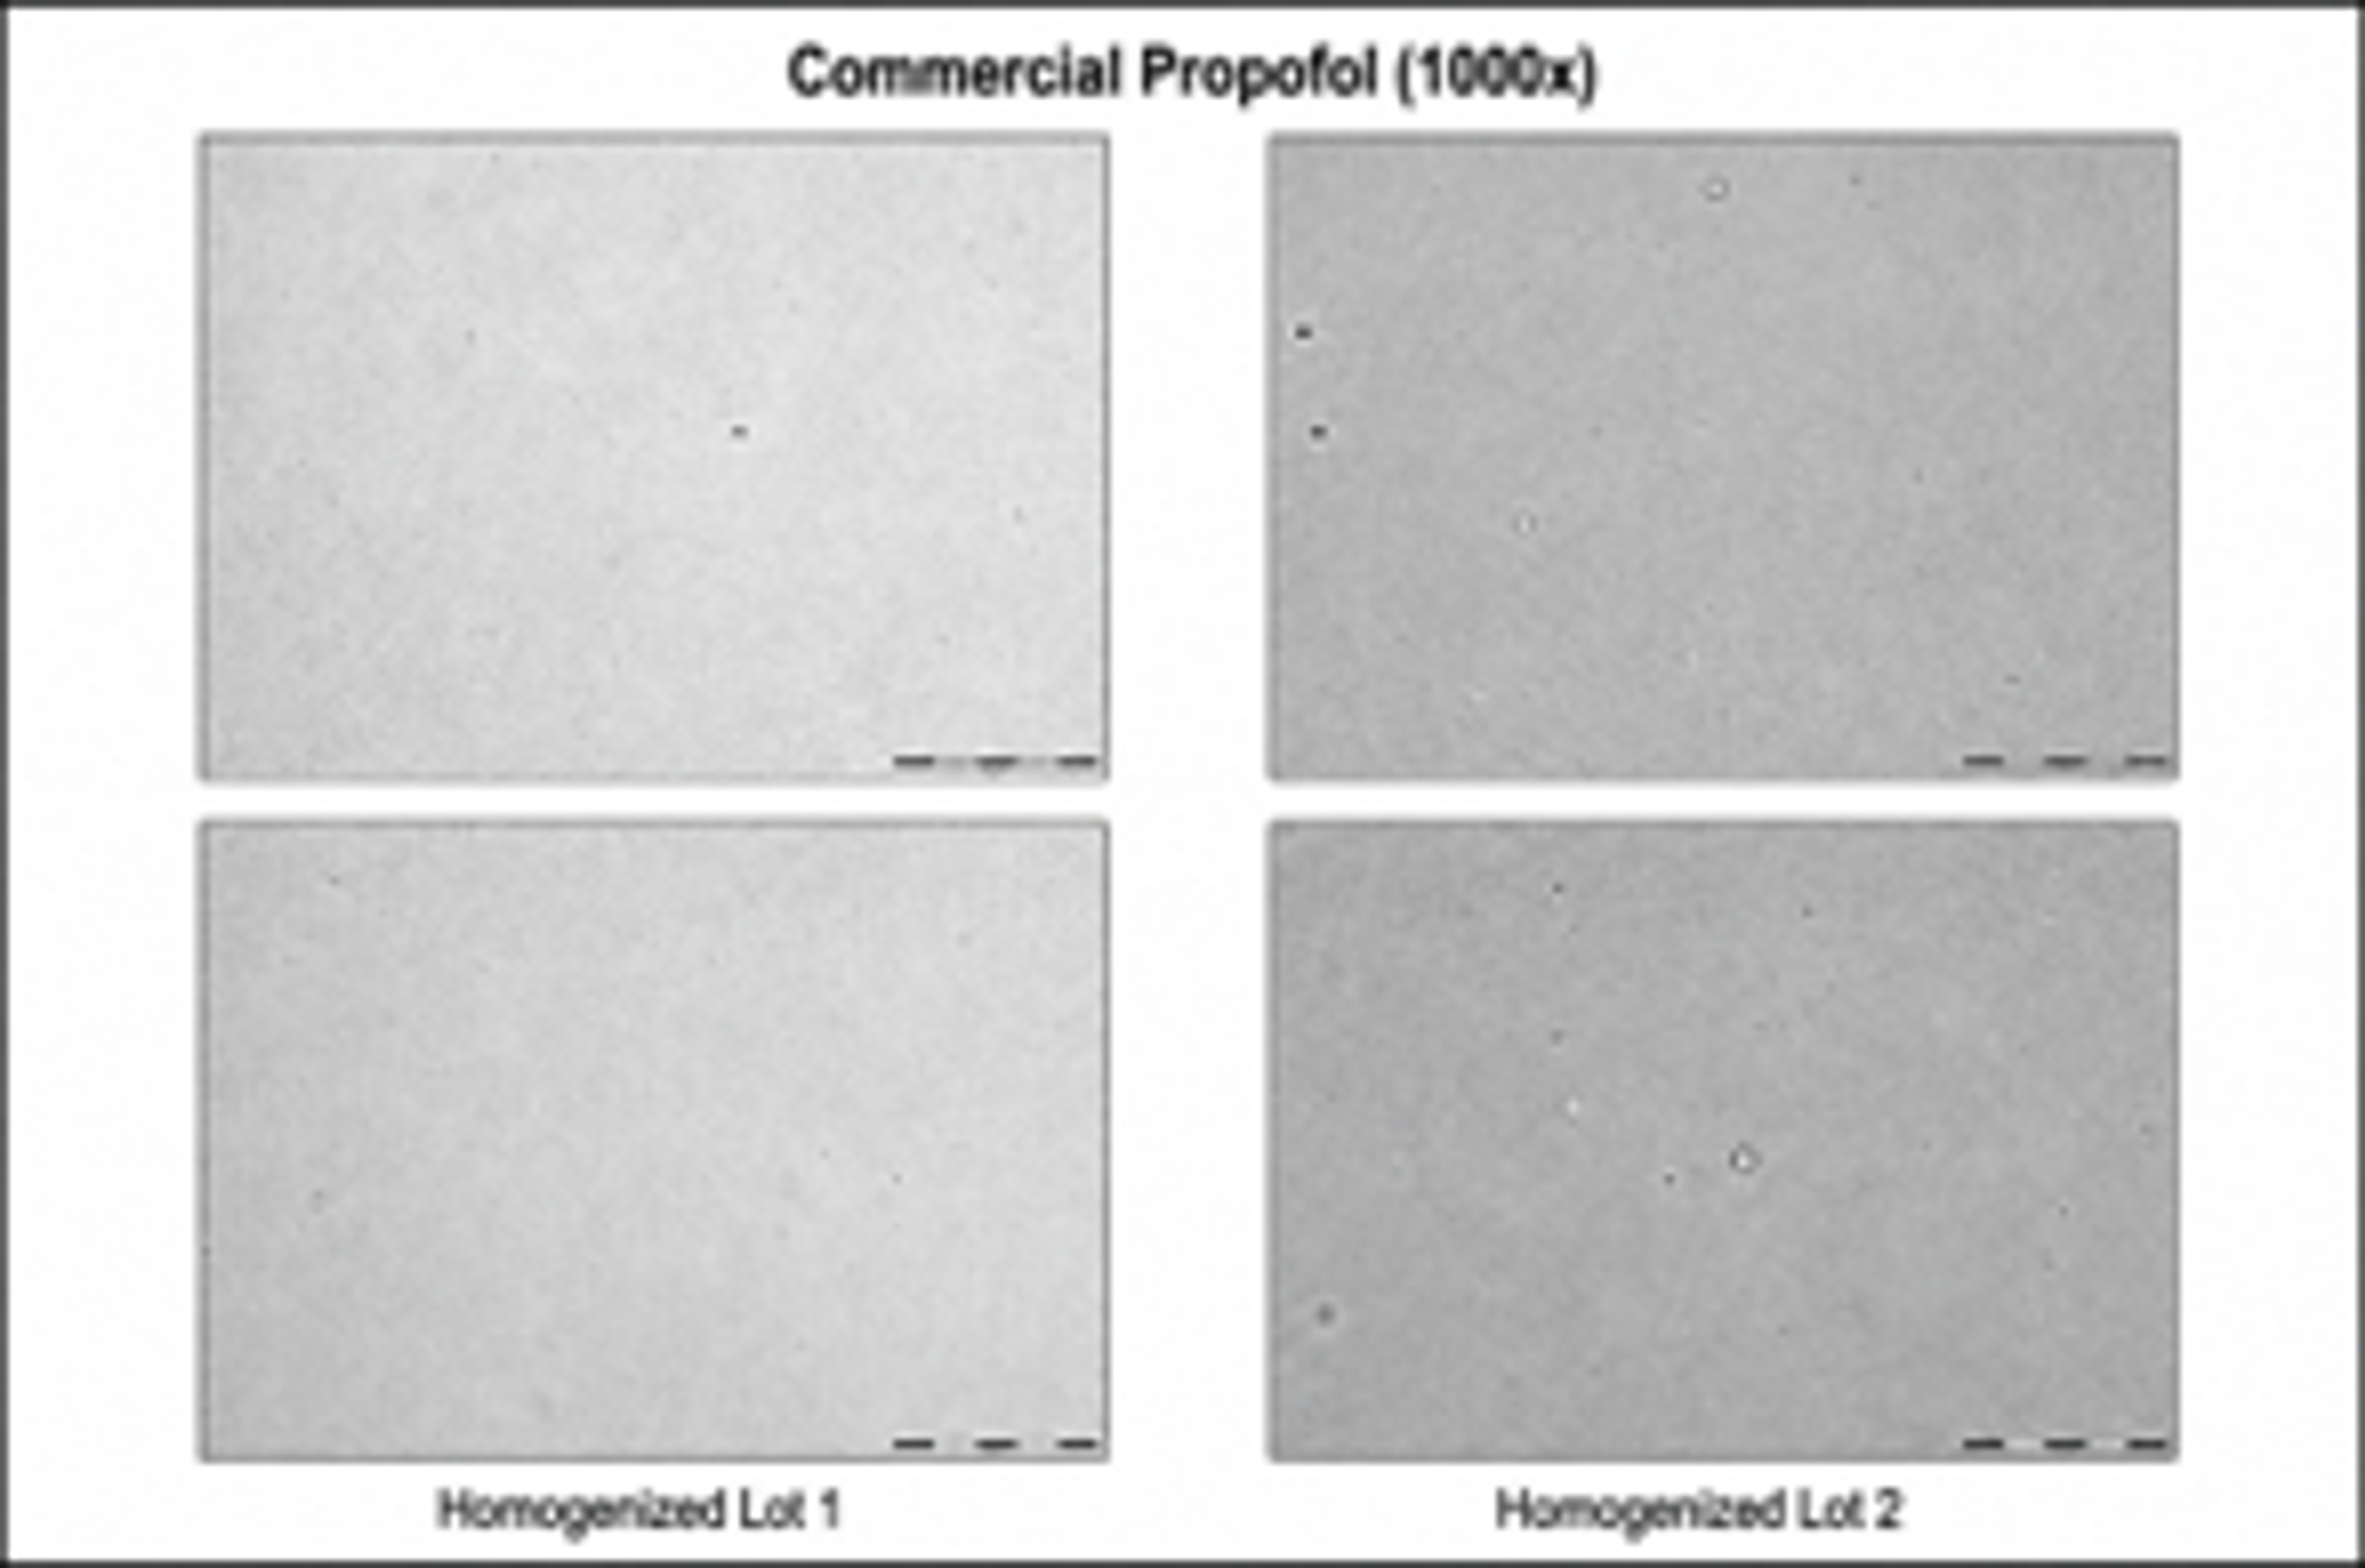
Figure 4.13. Micrographs of commercial propofol and high pressure gap homogenizer lots. [1].
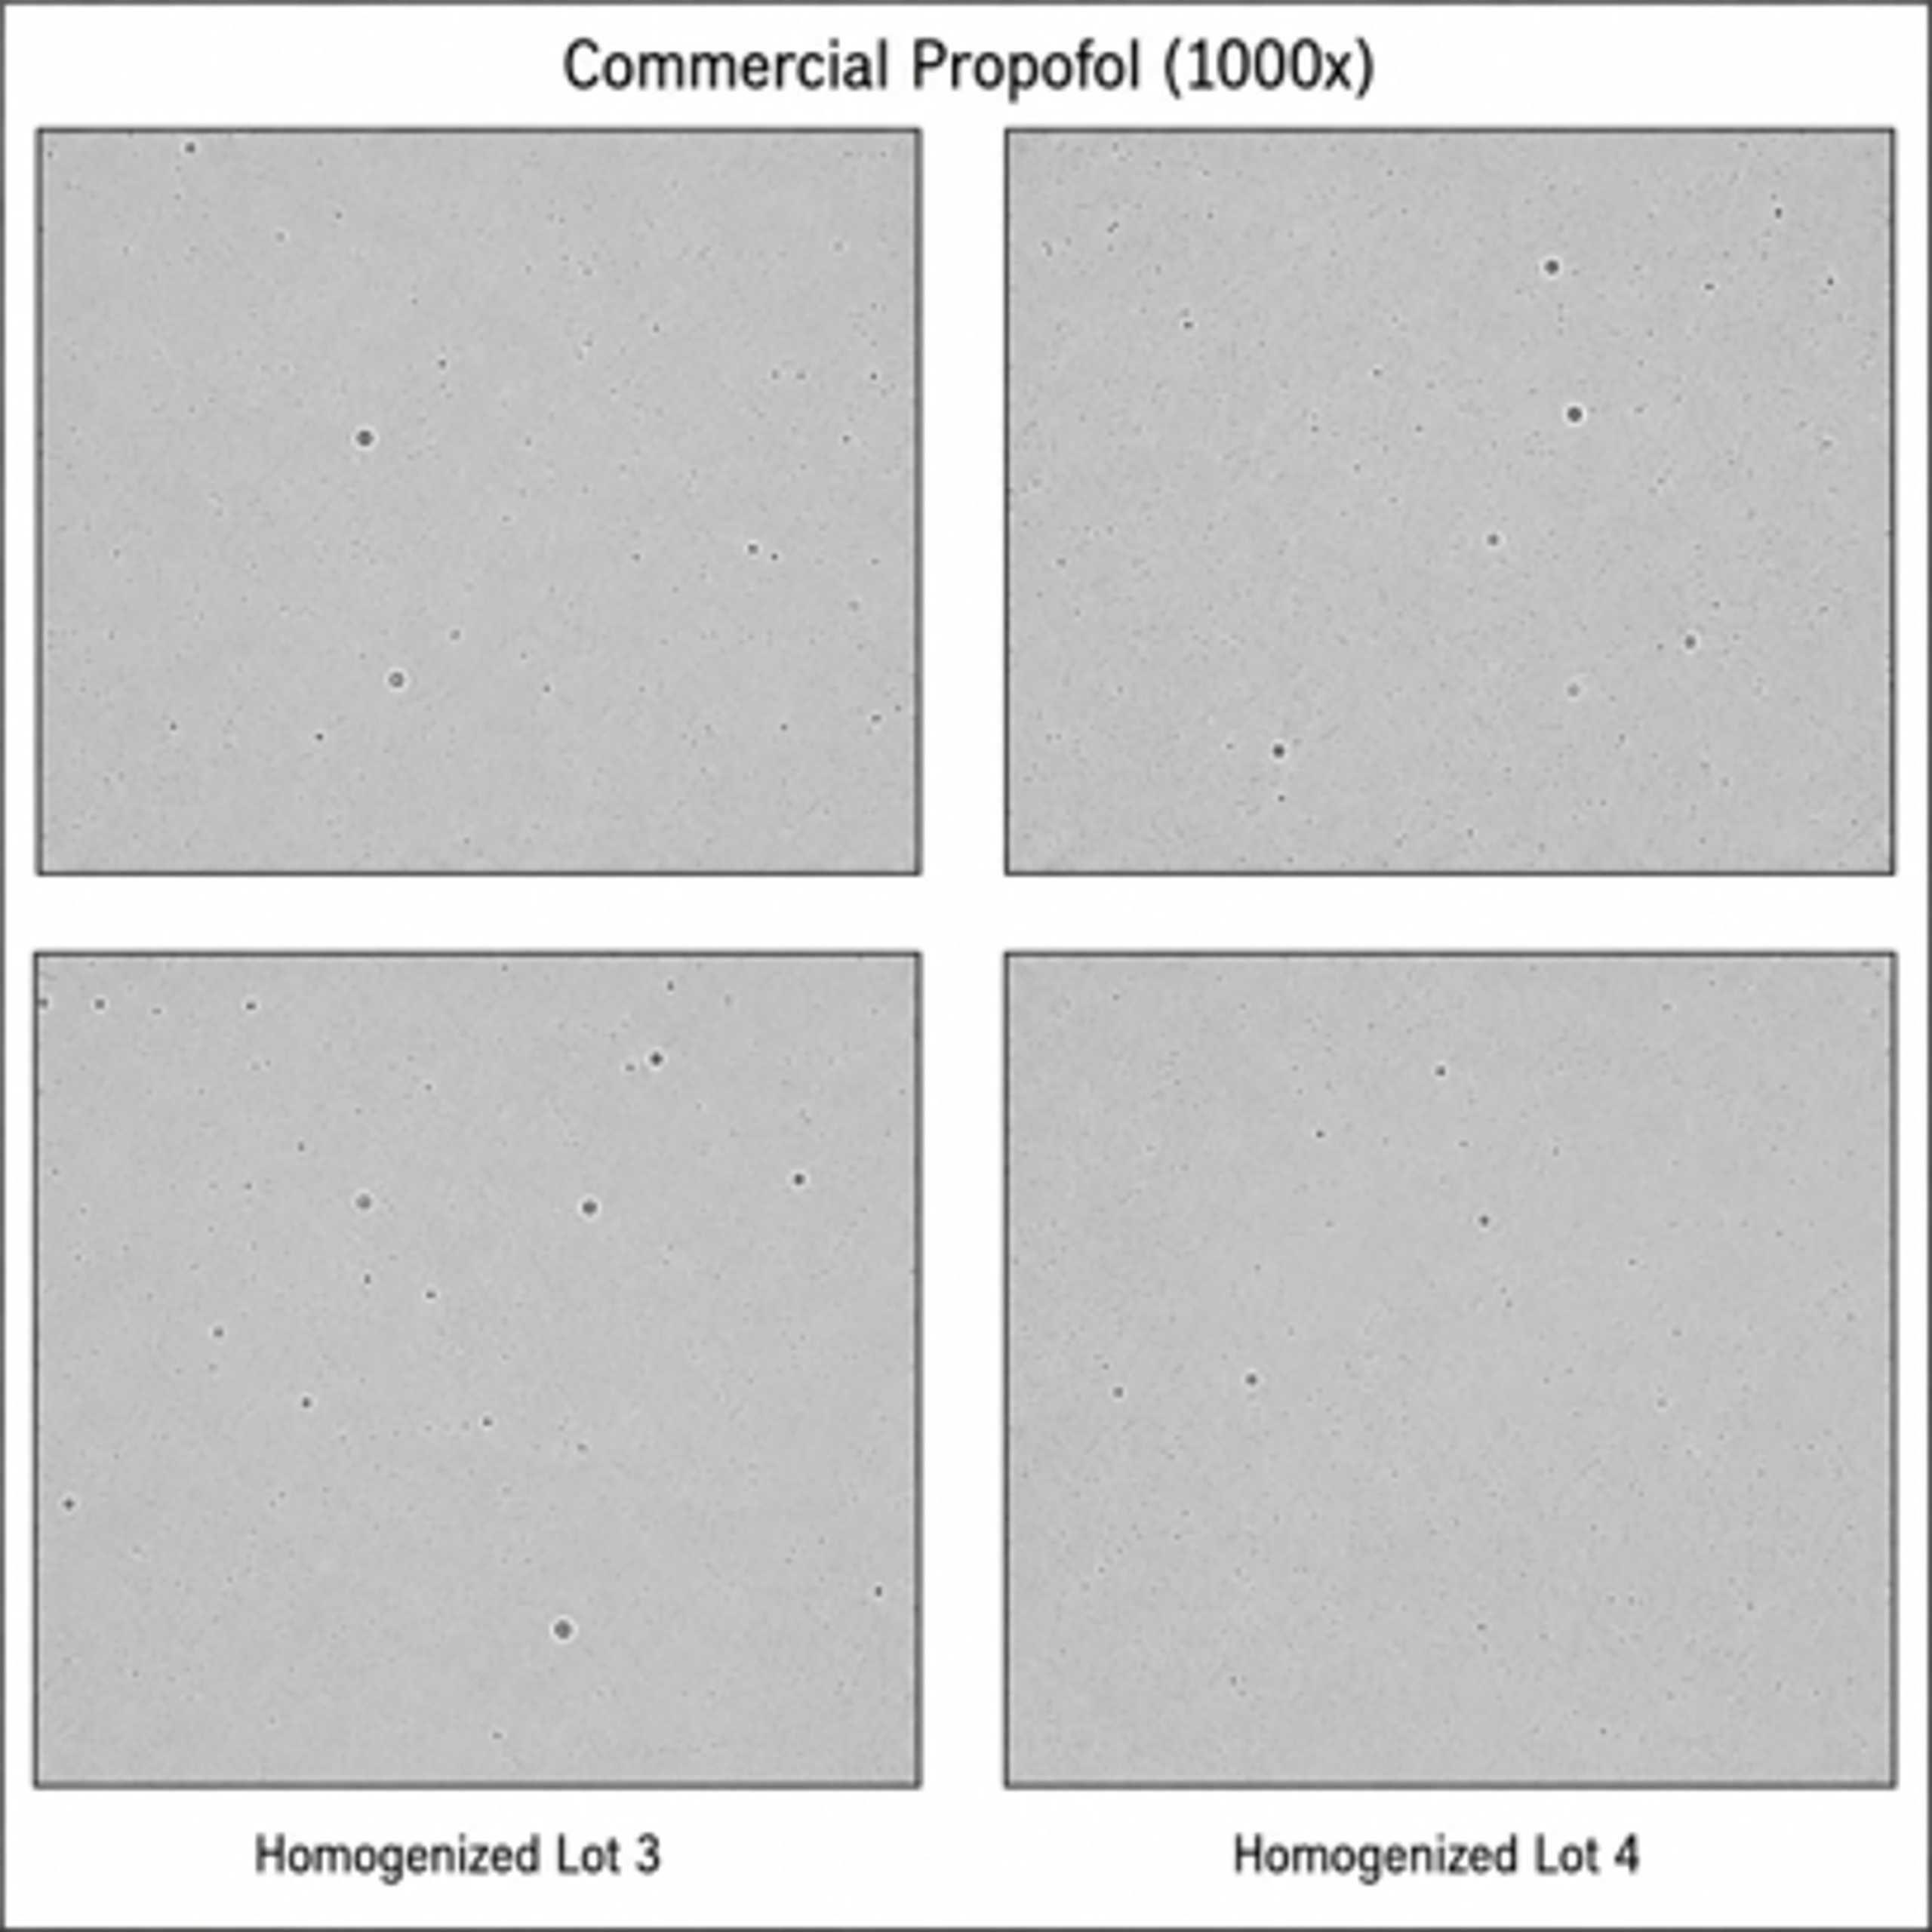
Figure 4.14. Micrographs of commercial propofol and additional homogenizer lots. [1].
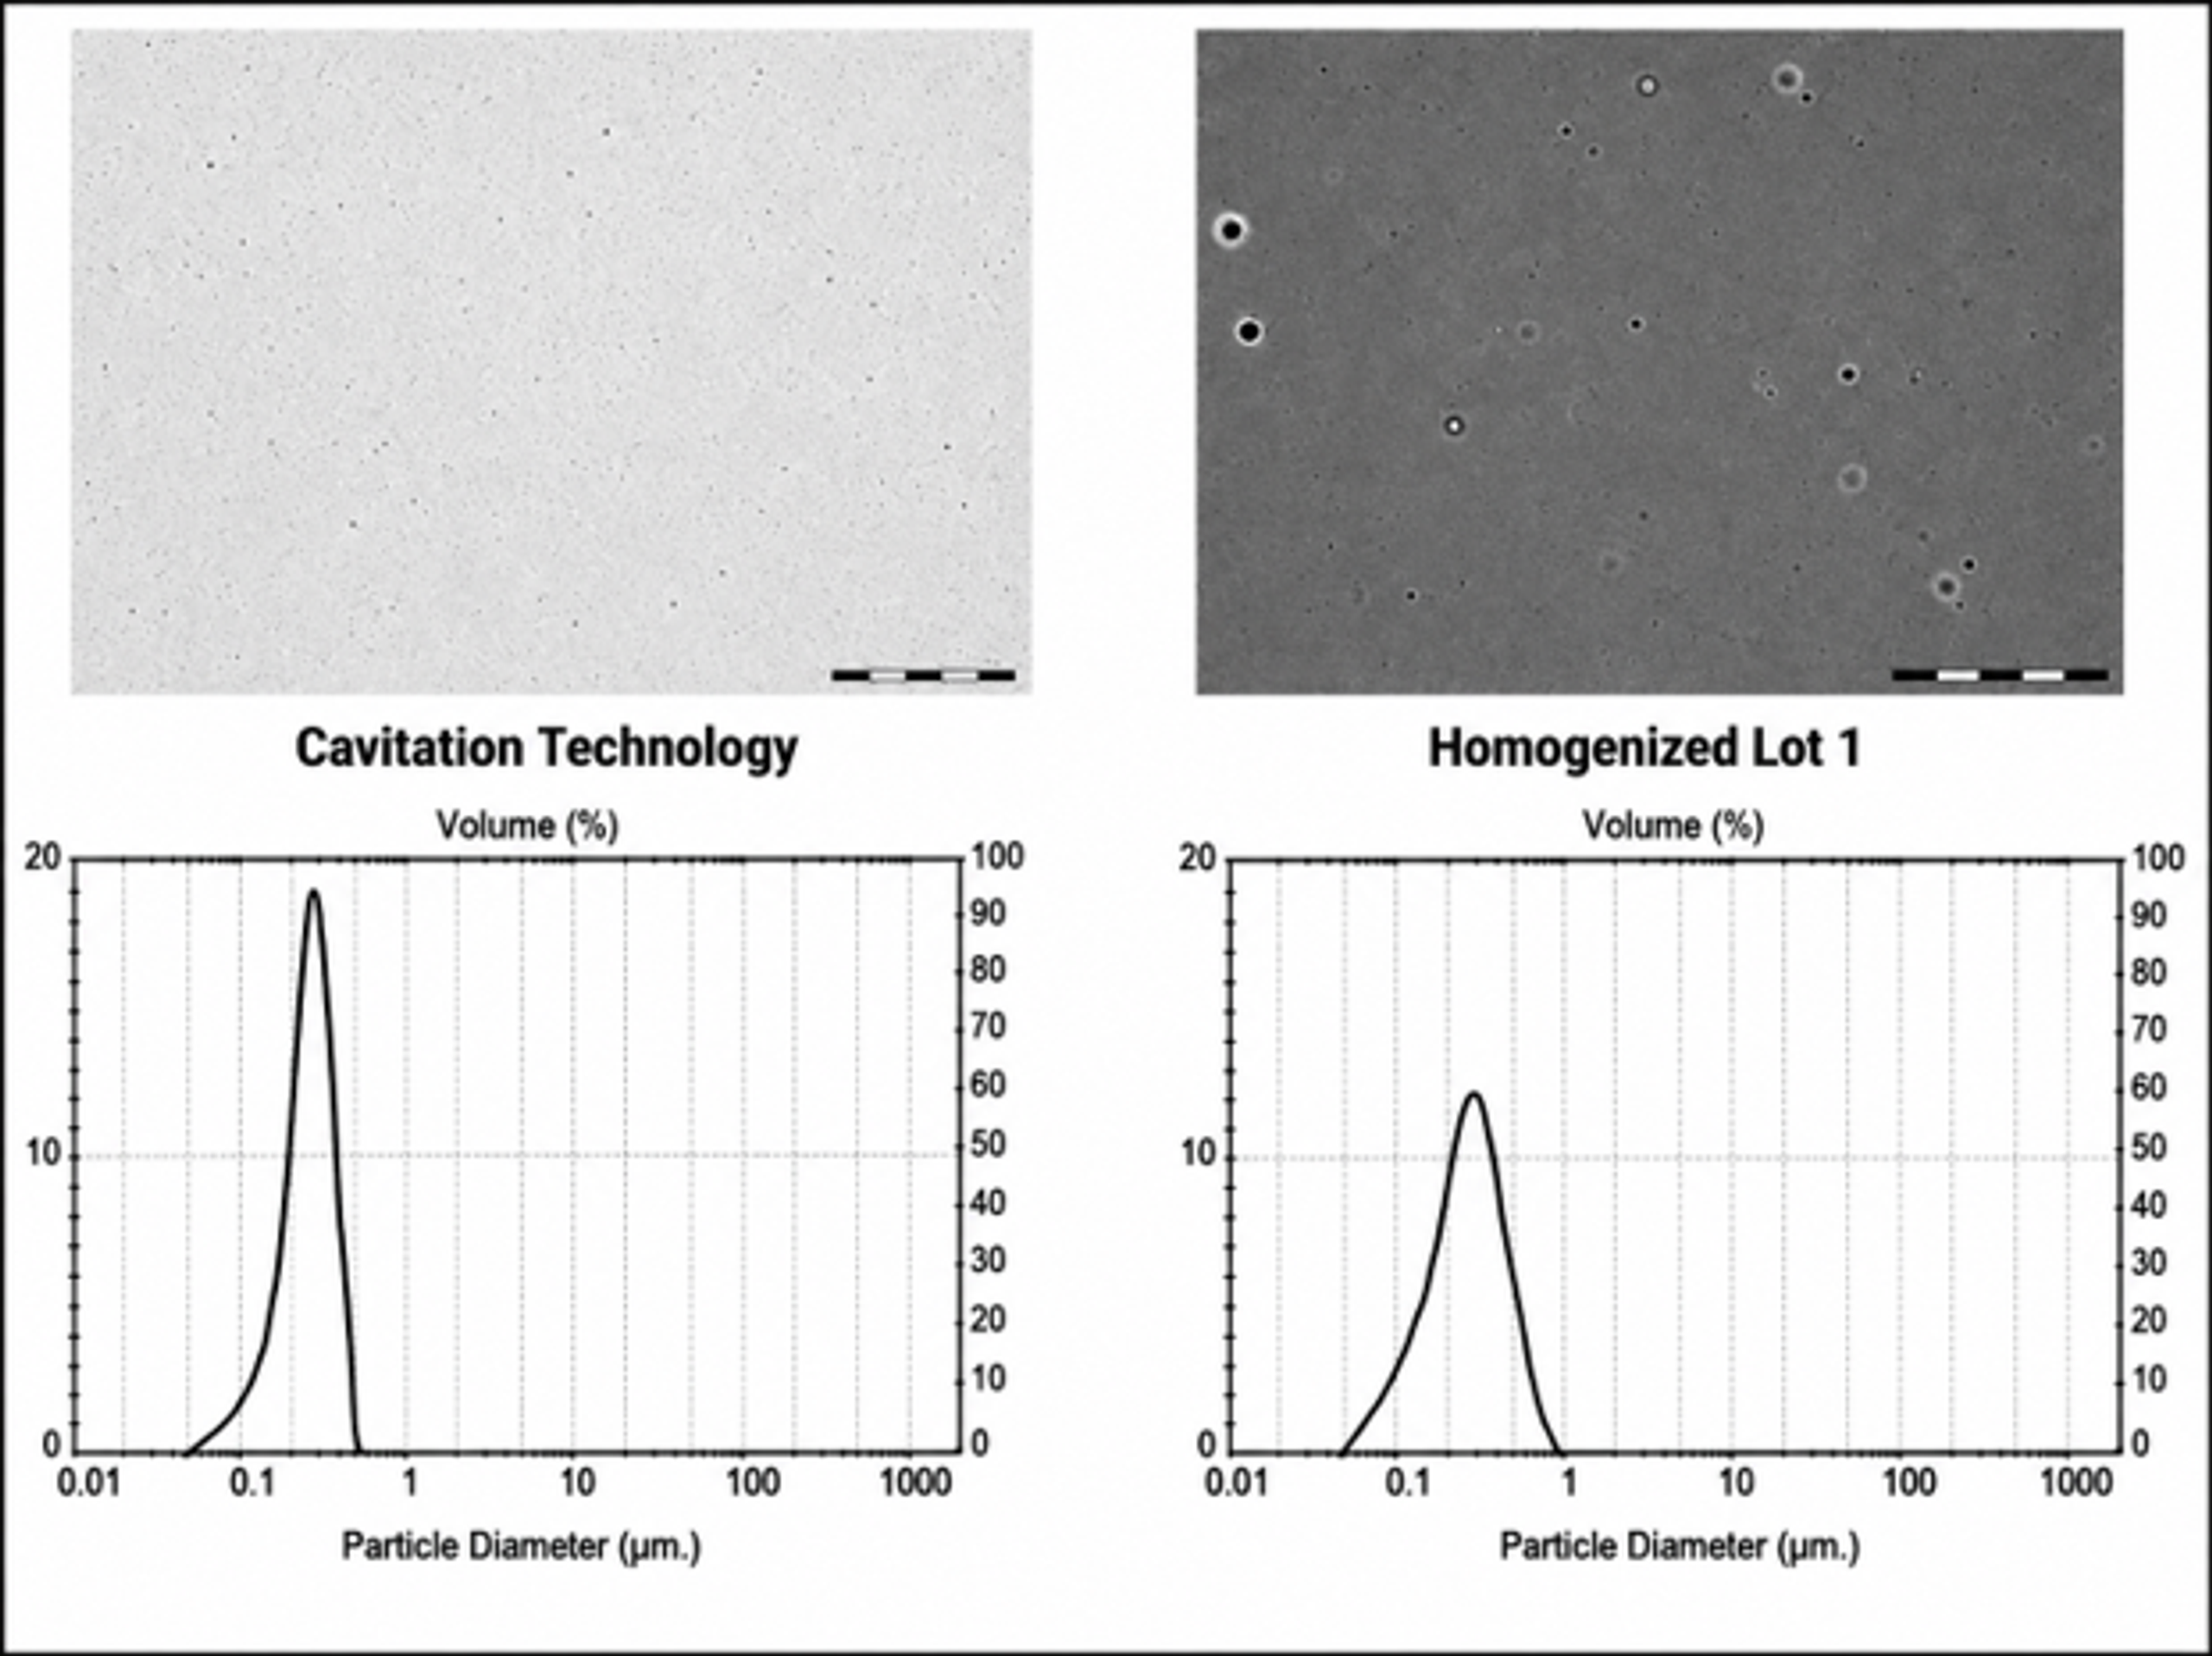
Figure 4.15. Particle size and micrograph comparison between cavitation emulsion technology and a gap homogenizer. [1].
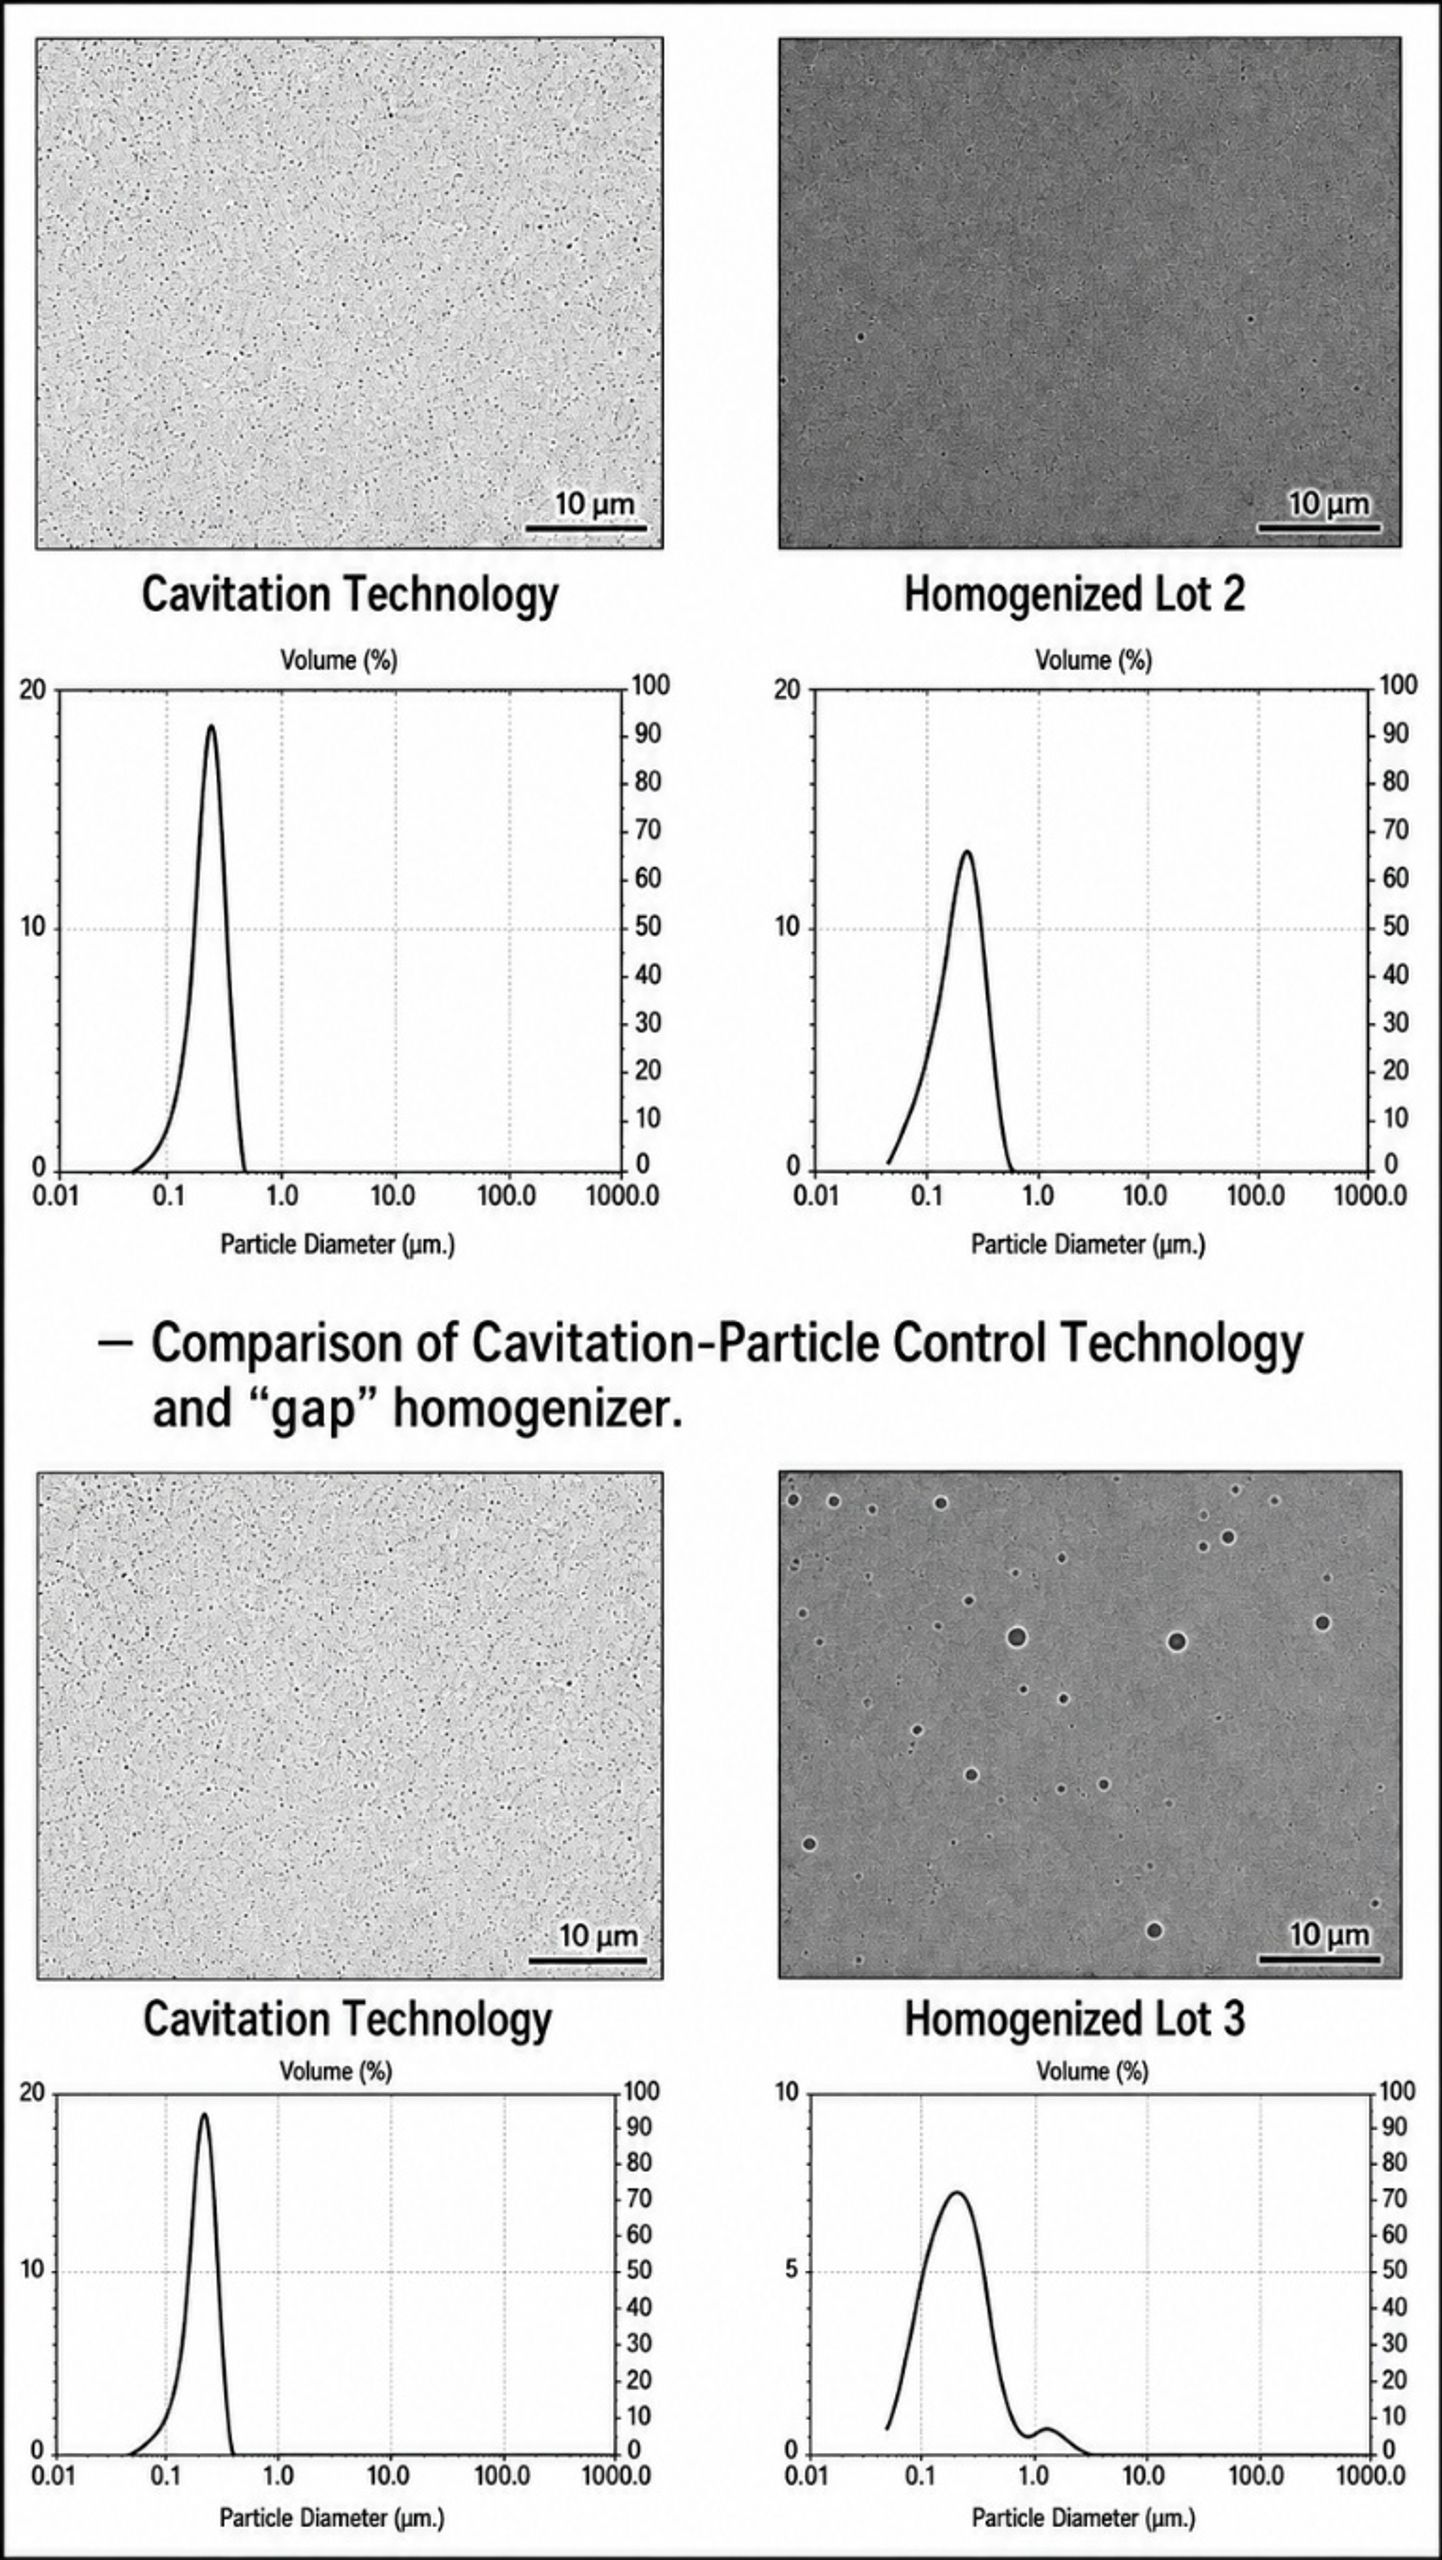
Figure 4.16. Additional comparison of cavitation and gap homogenizer particle and emulsion processing. [1].
4.9 Scale Up, Reproducibility, and Wear
Scale up should preserve the local mechanism that controls the product. For fixed geometry microchannel systems, scale up commonly uses parallel channels while maintaining channel dimensions, pressure, and formulation. For controlled hydrodynamic cavitation, scale up must preserve cavity inception, pressure recovery, active volume, and collapse field, not merely pump pressure. In both cases, flow distribution and heat removal can become limiting at higher throughput [1,17,18,33–35,39].
Equipment wear is a critical lifecycle variable. Chamber or orifice wear changes hydraulic resistance, flow rate, velocity, pressure drop, and possibly the product distribution. A validated process should include a wear indicator, flow acceptance range, pressure trace, preventive replacement criterion, and post maintenance equivalence check. For high value pharmaceutical products, metal or ceramic wear particles should be monitored using a risk based analytical strategy.
Modern hydrodynamic cavitation studies on pharmaceutical crystals have shown that crystal breakage can exhibit two regimes, with rapid reduction at low pass count and slow reduction after a threshold. This behavior supports the use of empirical limiting size models or population balance models during development rather than simple linear pass extrapolation [40,41].