
Technical publication
Back to publications
Other
Fabrication of High Performance Catalysts by Controlled Flow Cavitation
okozyuk.com
Published
Read complete publication for whole-document Find and printing. Browser Find and native printing on this reader include only loaded content.
7 Later Hydrodynamic Cavitation Demonstrations
Later studies broaden the evidence base beyond the original CFC equipment. These systems should not be treated as identical reactor platforms, but they demonstrate that restriction geometry, gas-liquid contact, solids loading, and multivariable optimization can control particle formation in larger and lower pressure loops [8-14].
7.1 Hydrodynamic Cavitation Assisted Nanocalcite
A closed loop orifice reactor was used to carbonate calcium hydroxide slurry with carbon dioxide. Without an orifice, the reported induction period was longer, reaction completion was slower, and average crystallite size was approximately 101 nm. A plate containing five 1 mm holes eliminated the observed induction period under the tested condition and produced an average crystallite size of approximately 37 nm. Single holes of 2 and 3 mm produced approximately 39 and 49 nm, respectively [9].
The study supports three engineering conclusions. First, total open area alone is insufficient to describe performance because a multihole plate changes the number of jets, interfacial renewal, and cloud distribution. Second, a shorter induction period can reflect enhanced gas dissolution, surface renewal, or primary nucleation. Third, pure calcite phase was retained while particle size and distribution changed, demonstrating that hydrodynamics can modify morphology without changing phase identity.
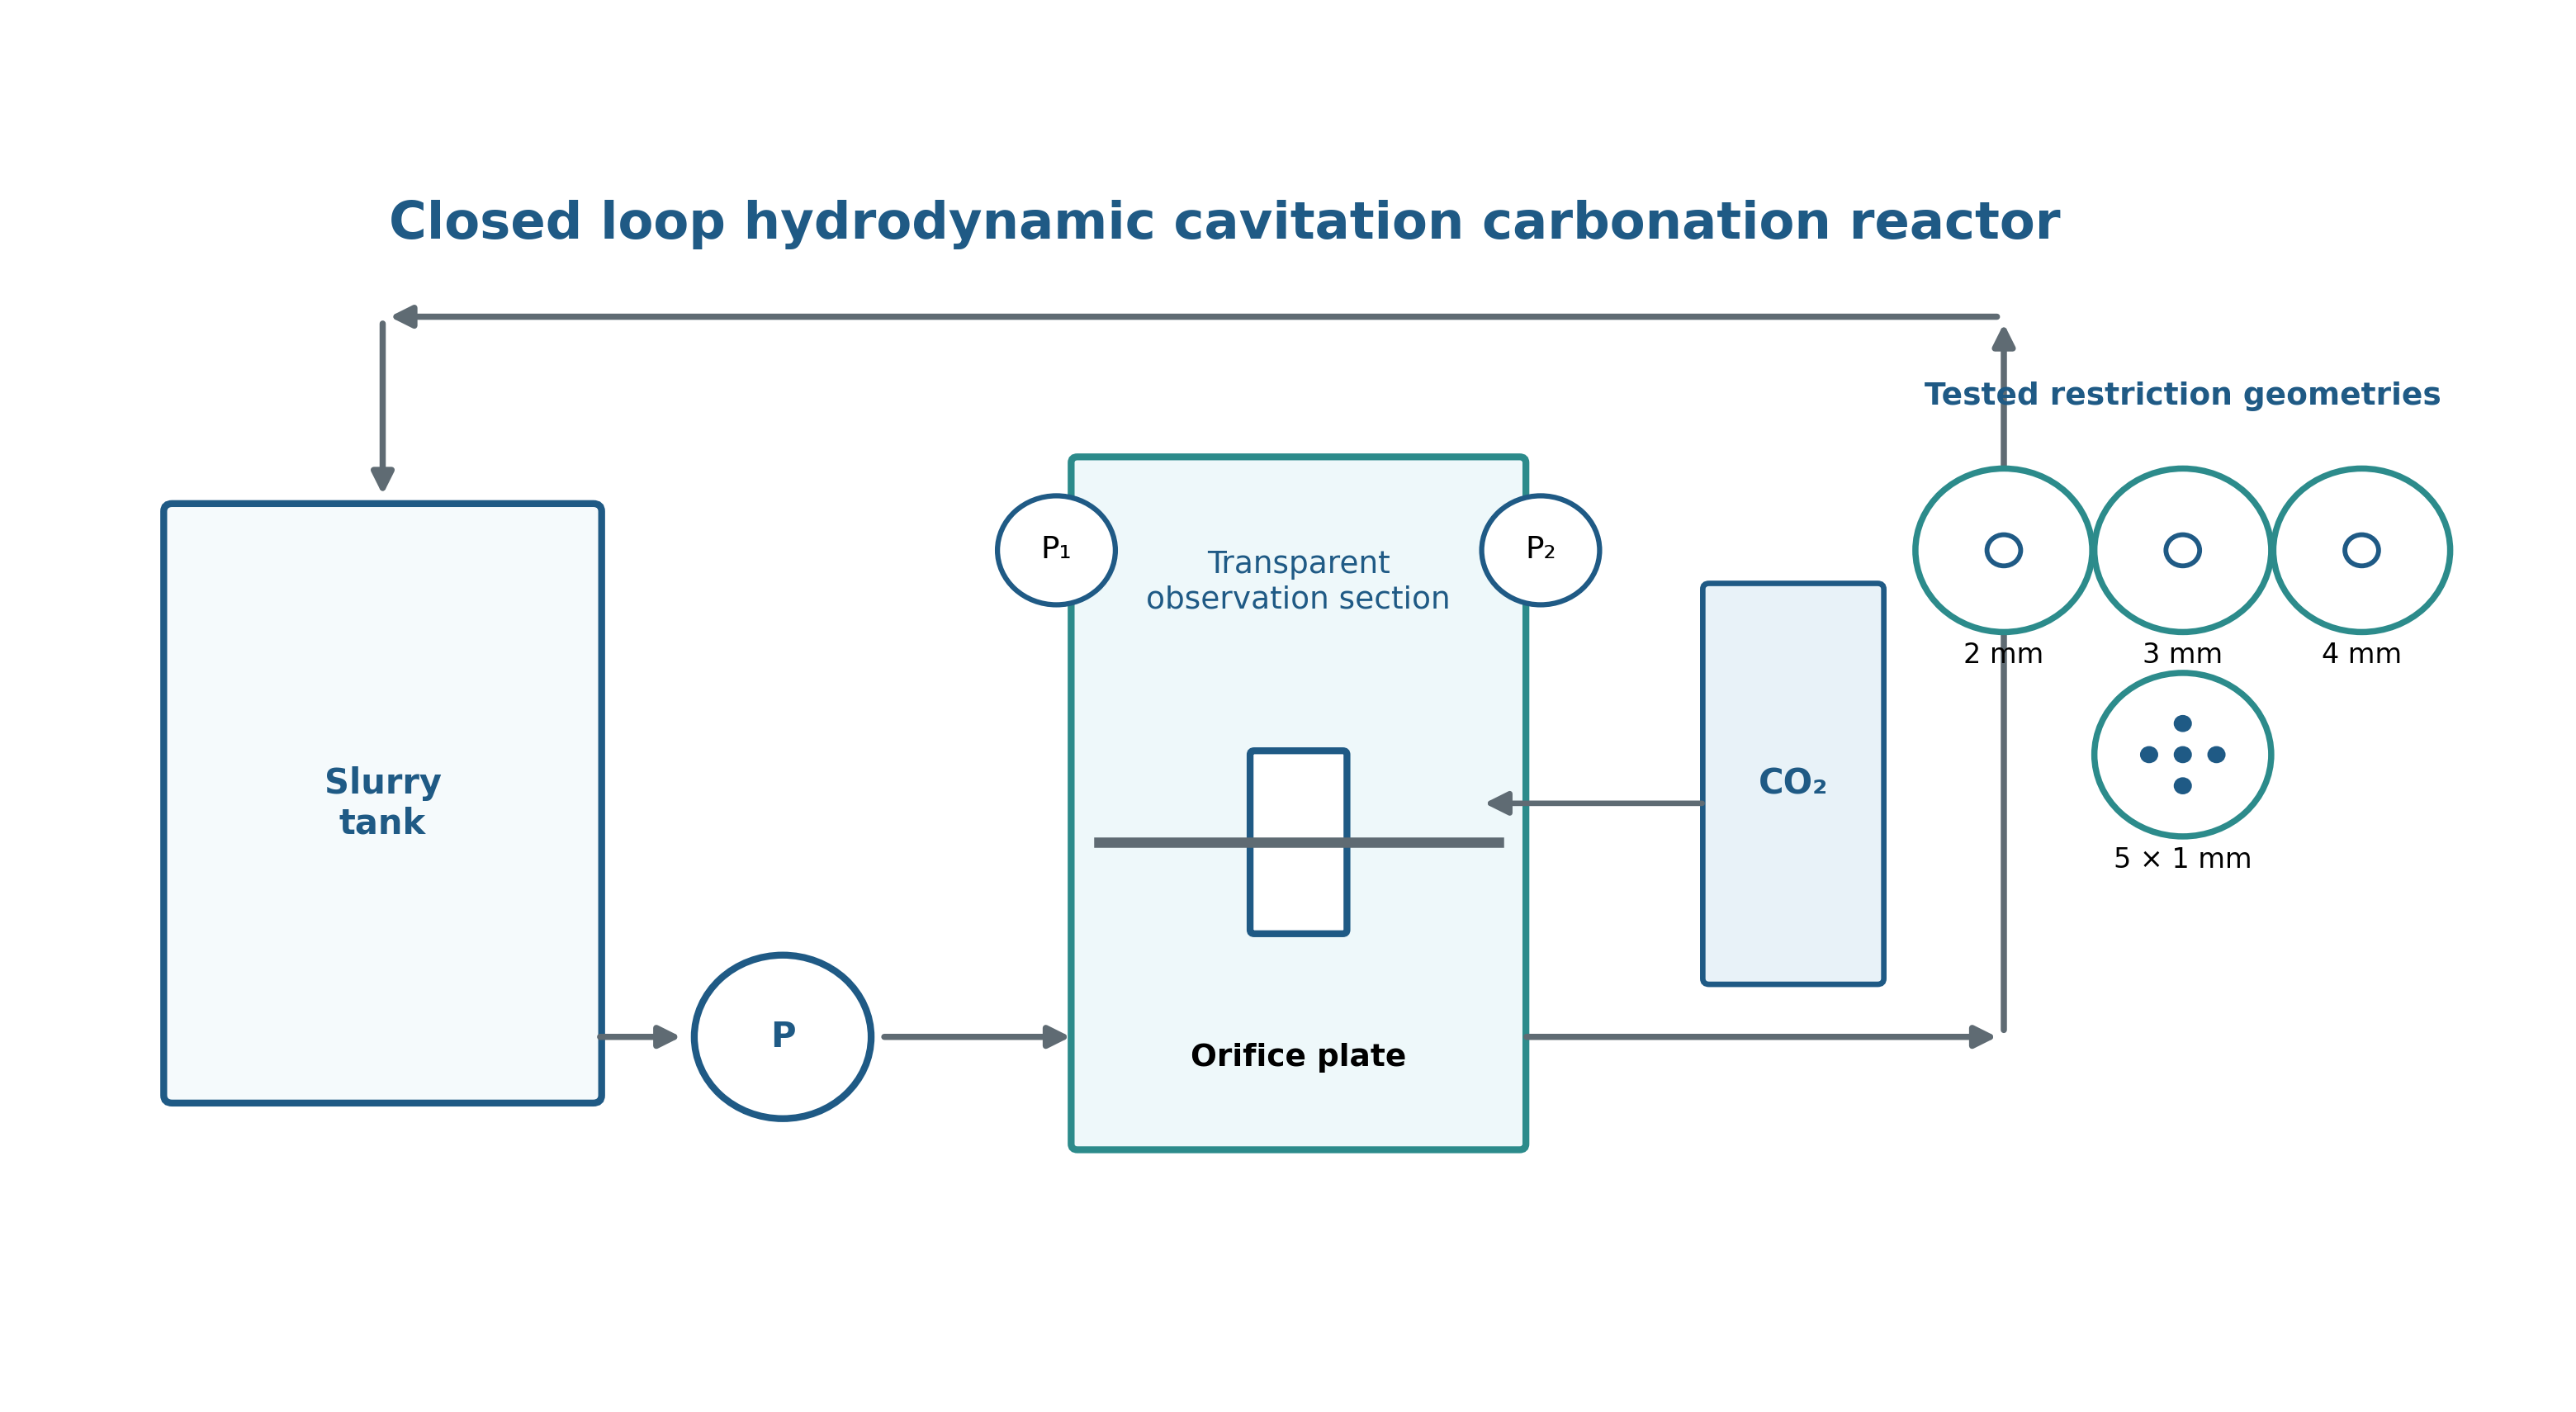
Figure 7.1. Closed loop hydrodynamic cavitation carbonation reactor and tested restriction geometries. [9].
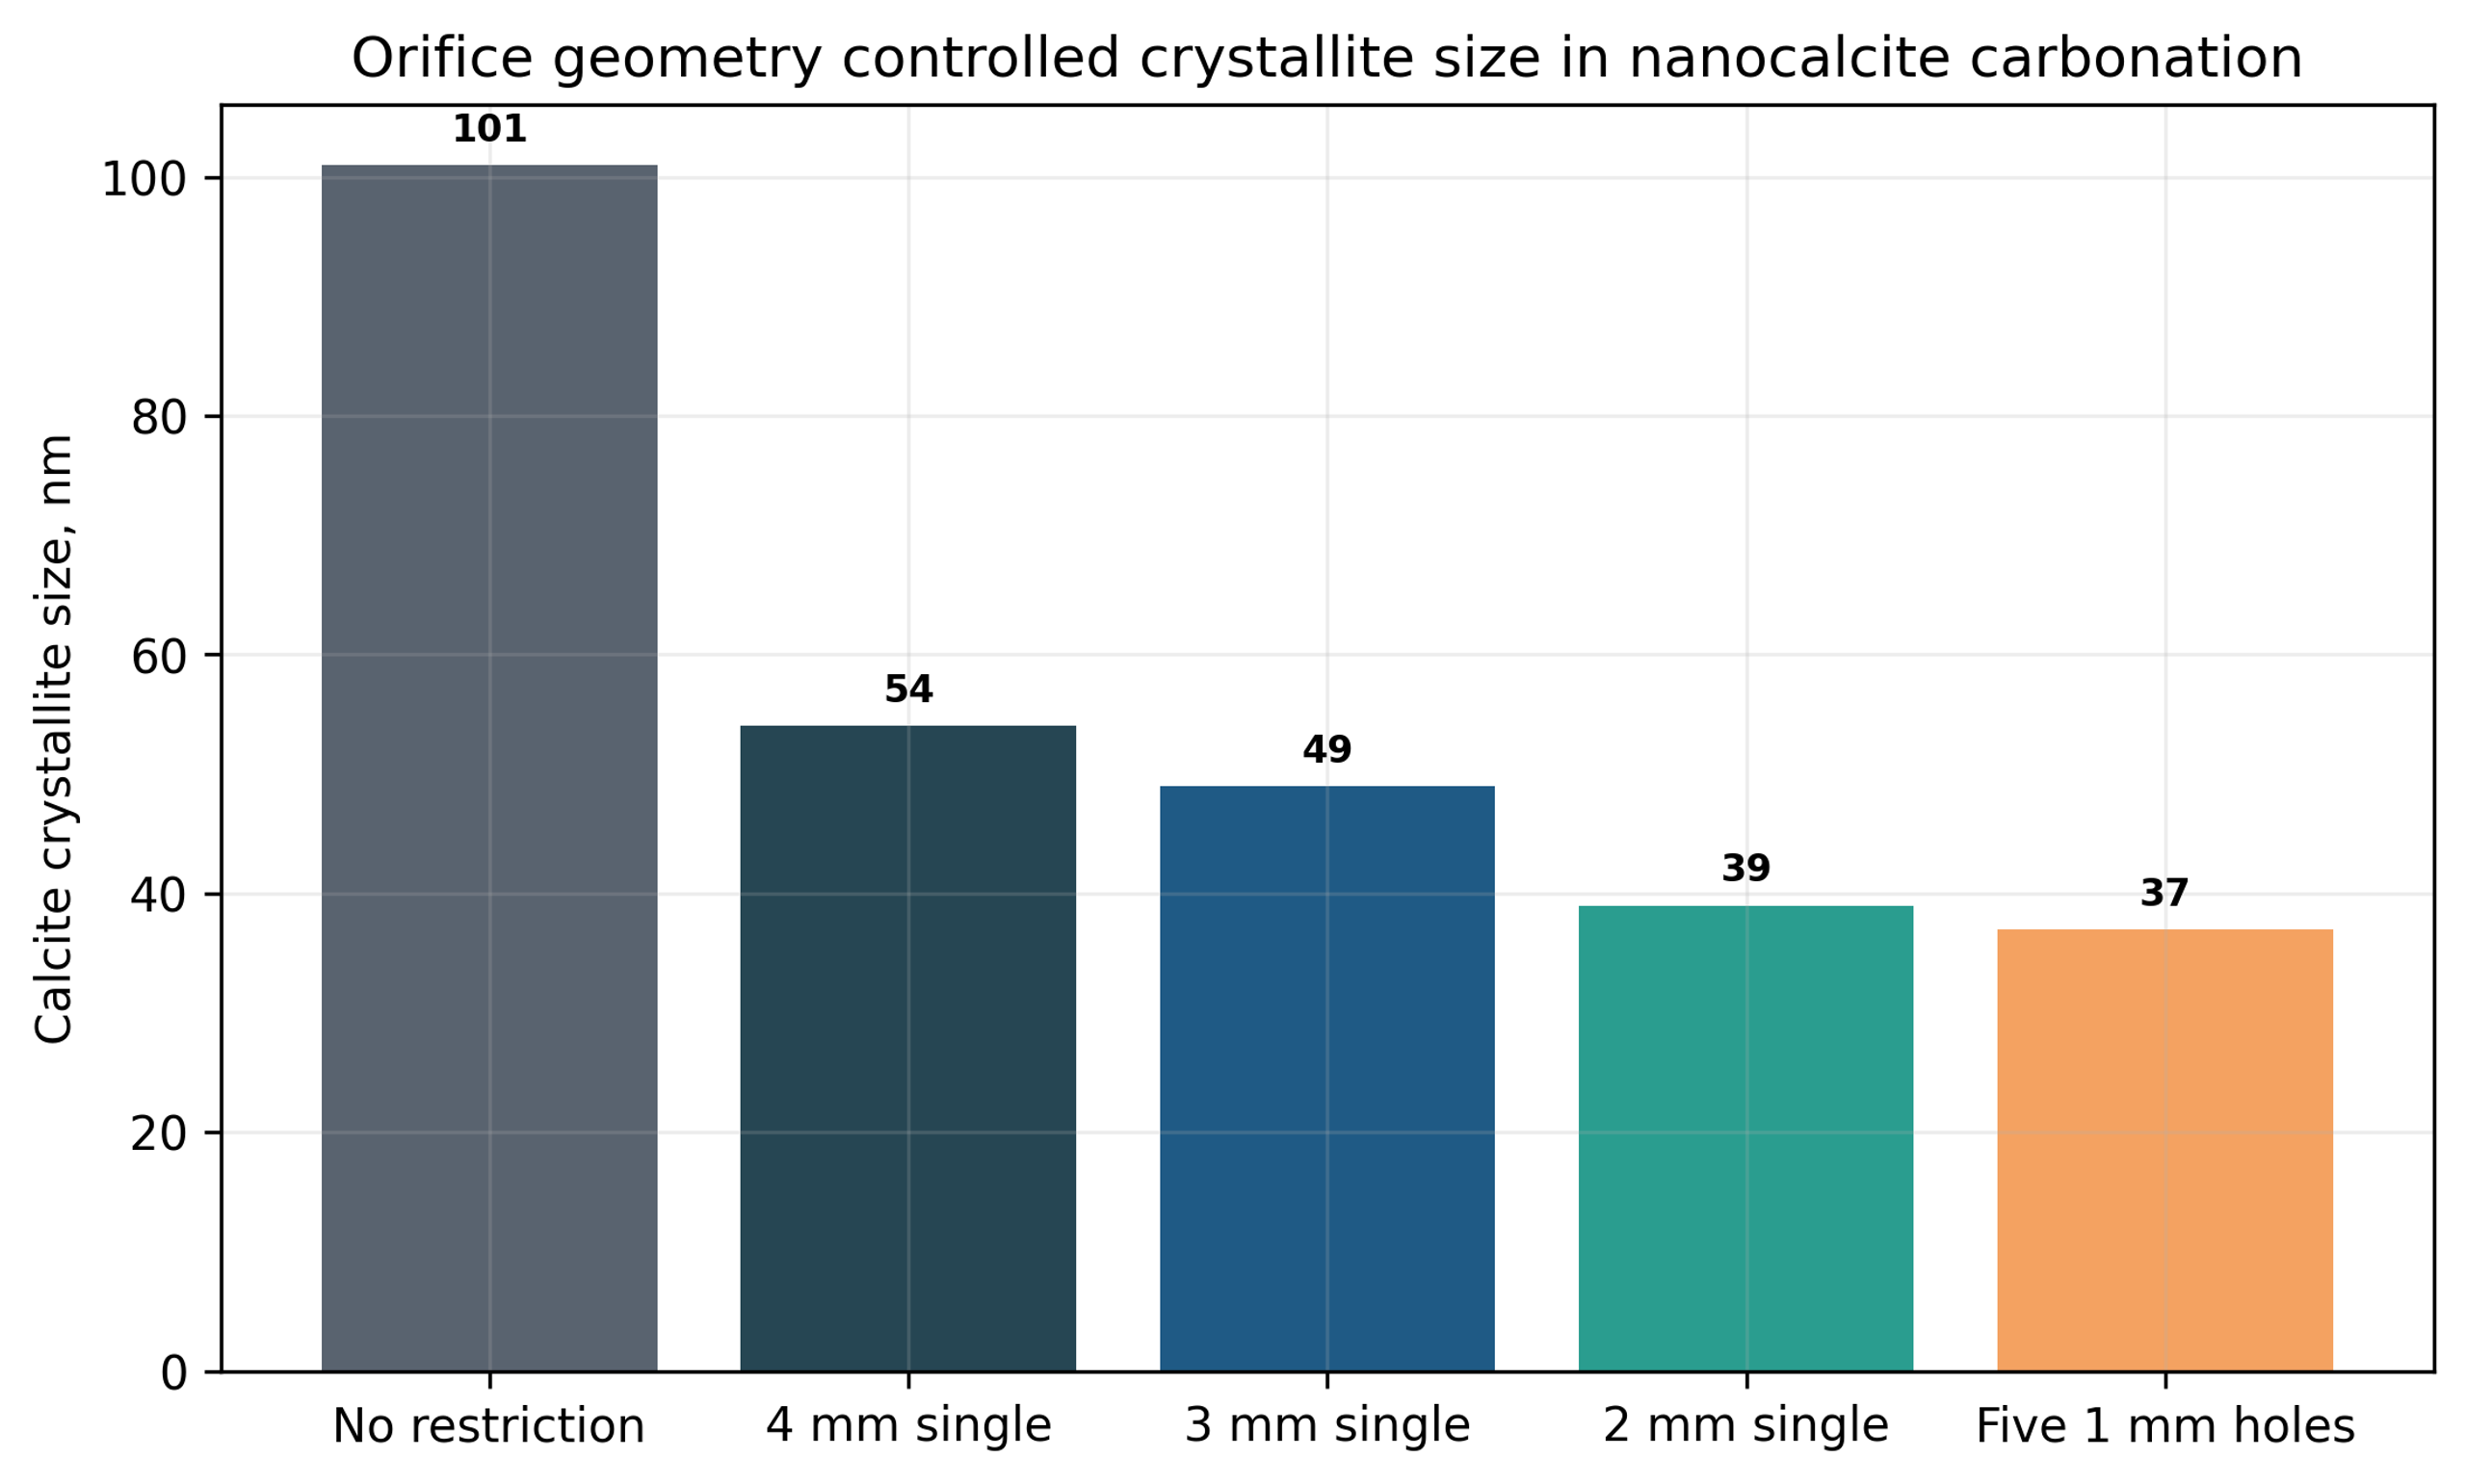
Figure 7.2. Nanocalcite crystallite size without a restriction and with the five hole 1 mm plate. [9].
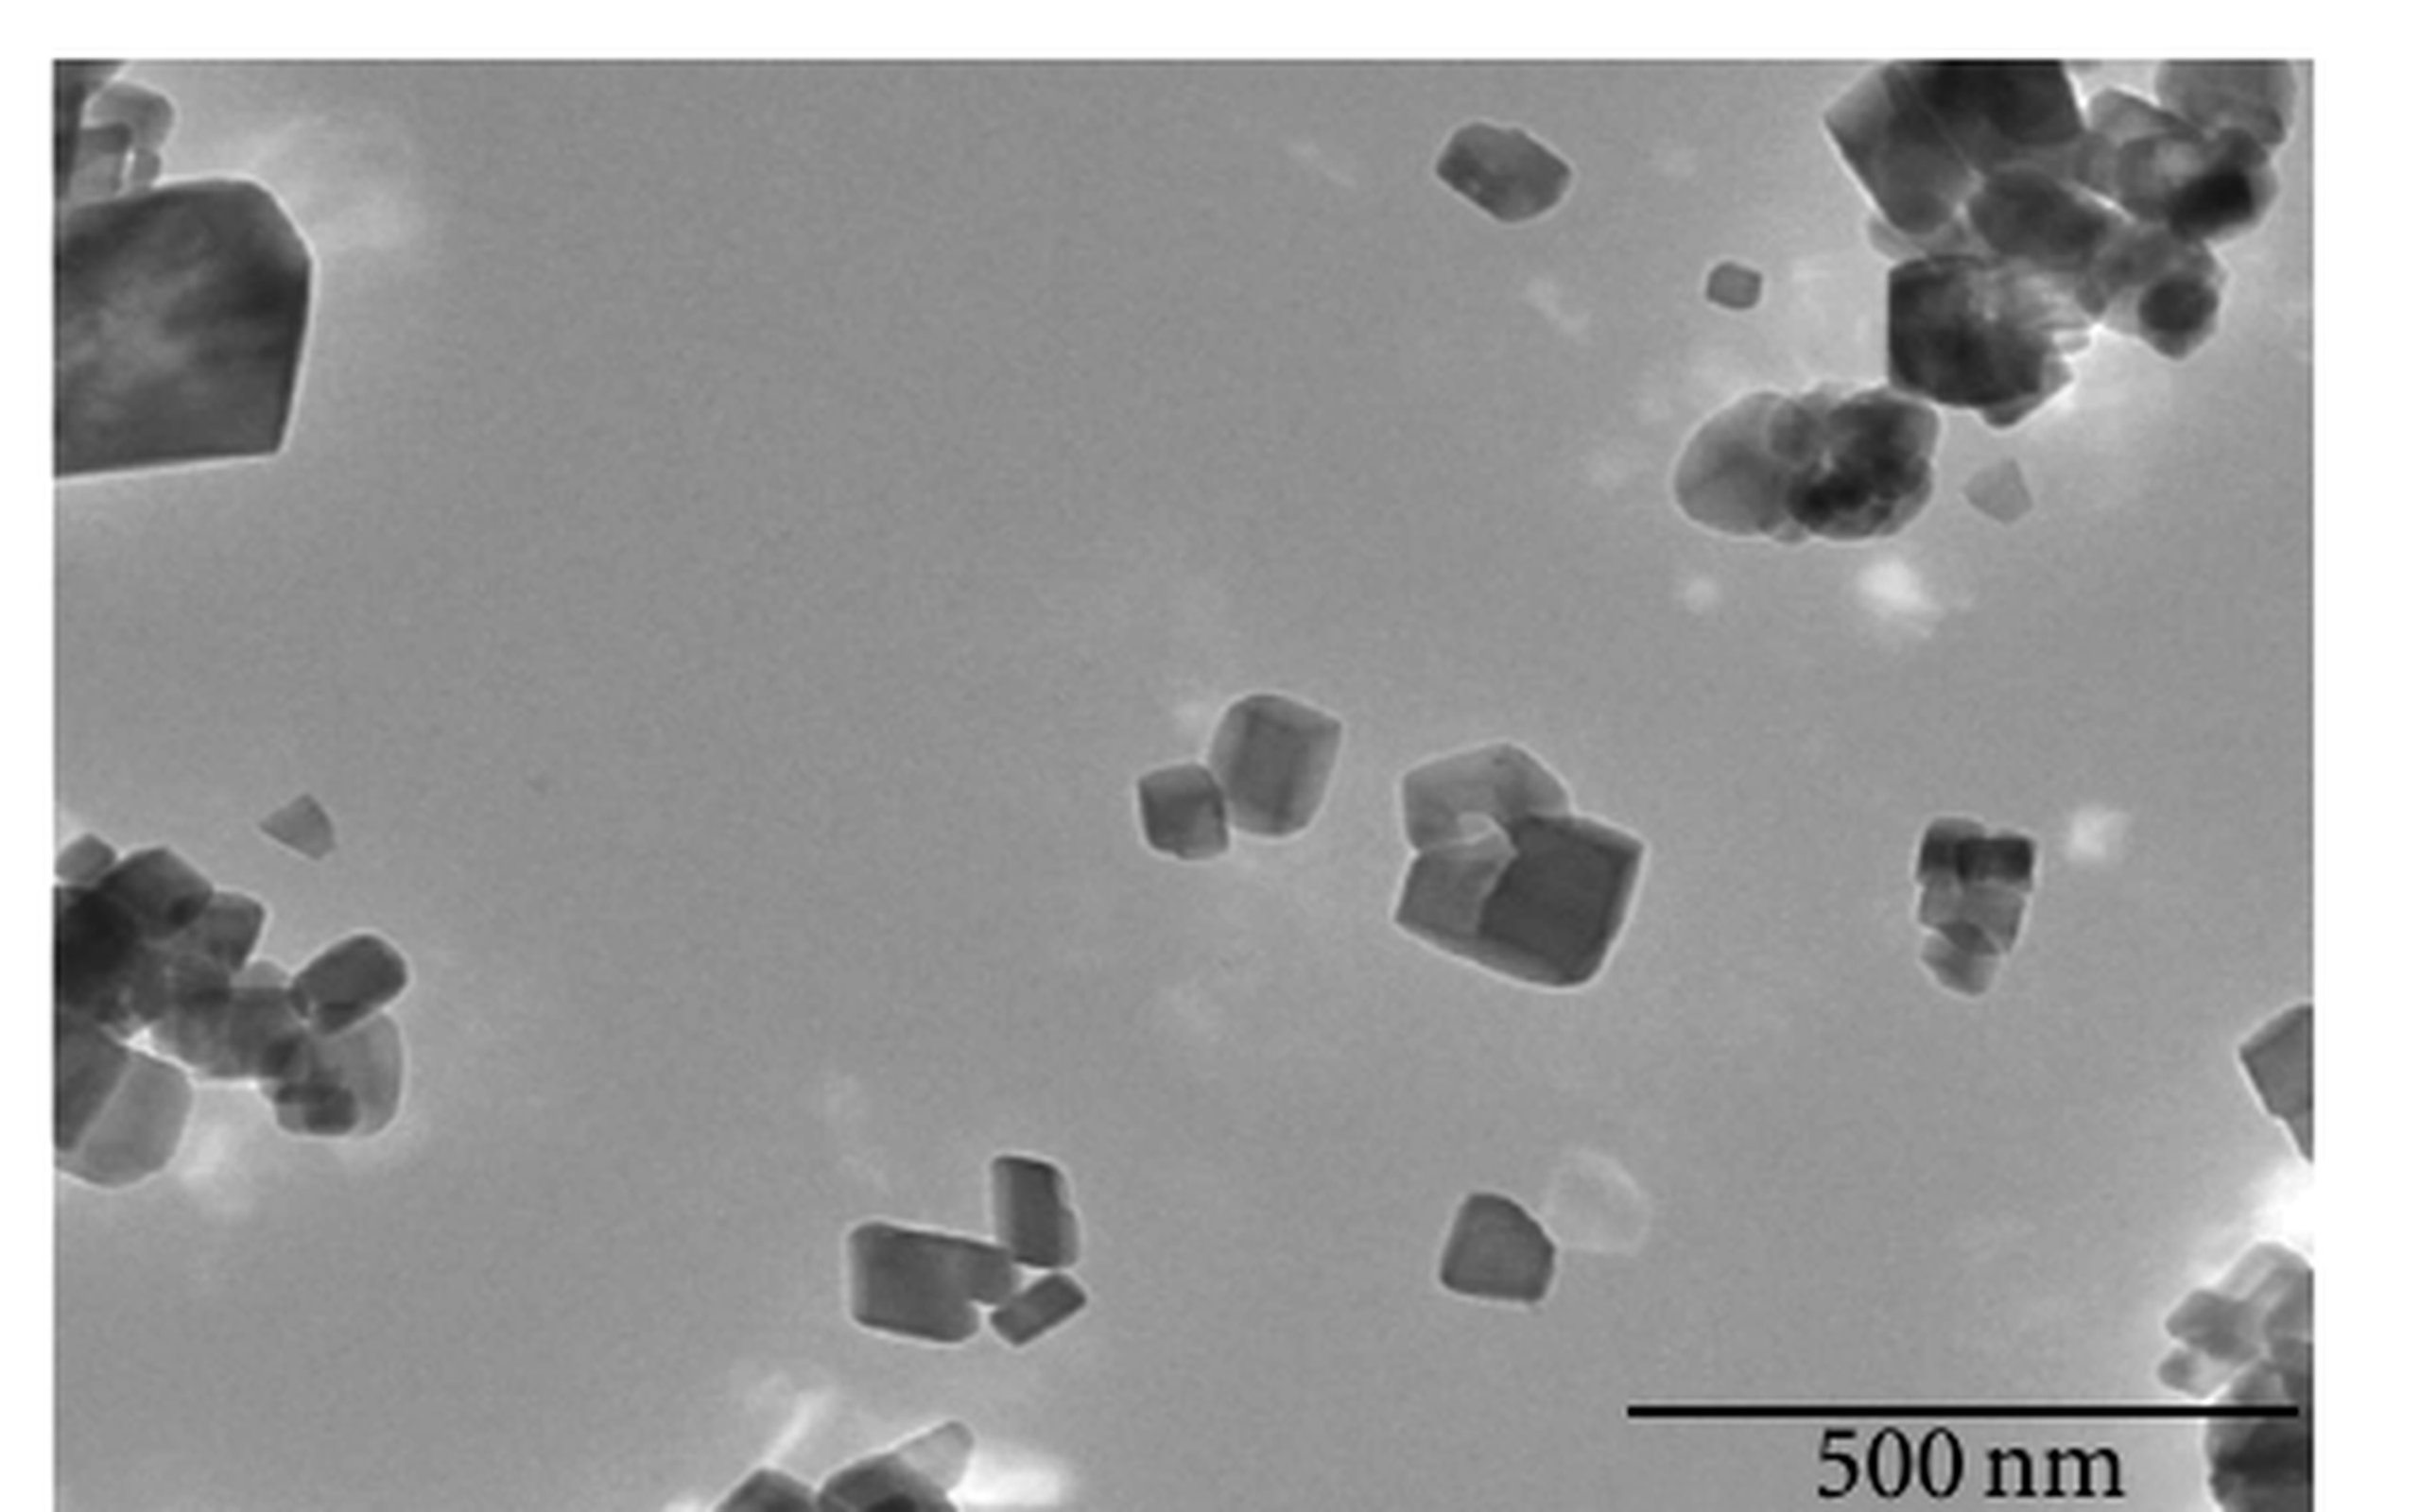
Figure 7.3. Transmission electron micrograph of nanocalcite prepared with hydrodynamic cavitation. [9].
7.2 Hydrodynamic Cavitation Enhanced Nano ZnO Carbonization
Guo et al. used a 40 L jacketed carbonation system with a hydraulic jet reactor to convert ZnO through a basic zinc carbonate intermediate. Optimized conditions included 80 °C, 120 min, a solid-liquid ratio near 5.011:100, calcination at 500 °C for 1 h, a 60° incident angle, a cavitation number near 0.366, and a jet position near 301 mm [10].
The regression model predicted a BET area of 63.190 m² g⁻¹ and a carbonization rate of 94.623%. Seven verification runs gave average values of 62.377 m² g⁻¹ and 93.937%, respectively. Relative to mechanical stirring and bubbling, the study reported approximately 1.5 times the specific surface area, a 10% increase in carbonization rate, and about half the particle size. Scanning electron microscopy showed dispersed sheetlike particles with a characteristic lateral dimension near 500 nm and thickness of approximately 25-35 nm [10].
The study also demonstrates a rigorous process development strategy. Reaction time, temperature, solids loading, calcination temperature, incident angle, cavitation number, and jet position were first screened. Response surface methodology was then used to quantify interactions among the most influential variables. The interaction between solid-liquid ratio and jet position was especially important. This approach is more informative than changing one restriction while holding an incompletely defined process nominally constant.
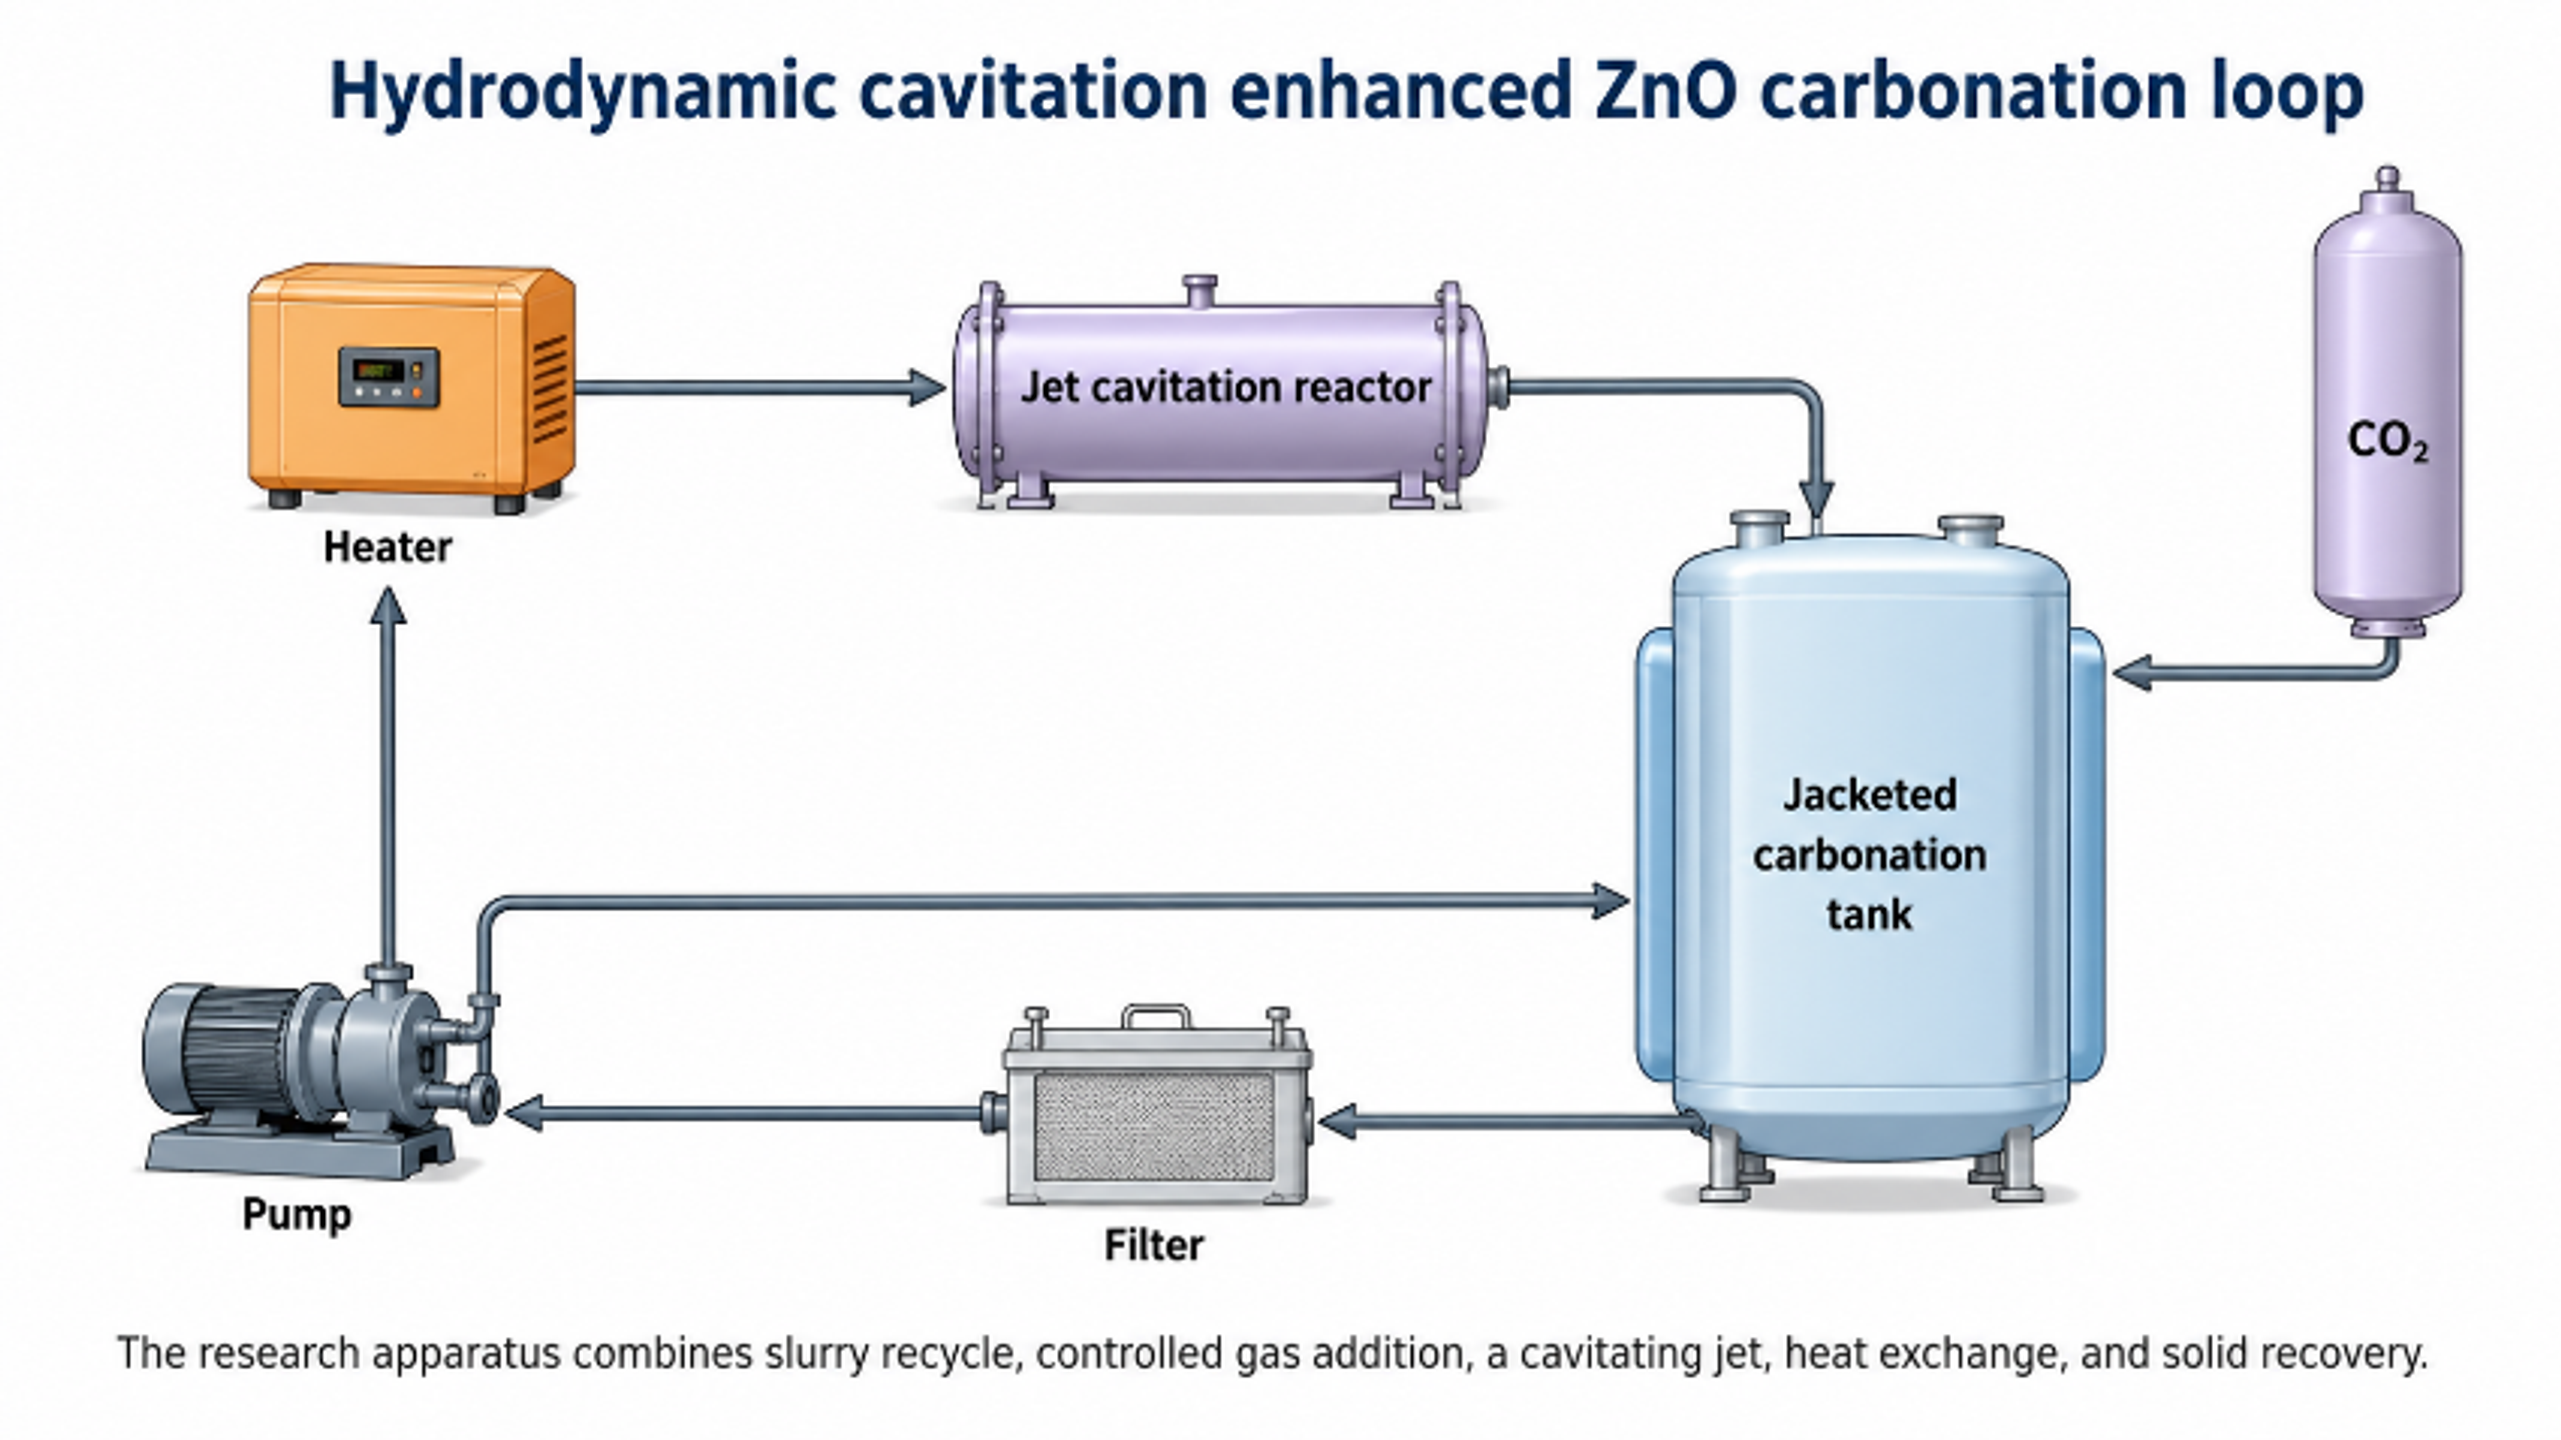
Figure 7.4. Hydrodynamic cavitation enhanced ZnO carbonation apparatus and gas injection reactor. [10].
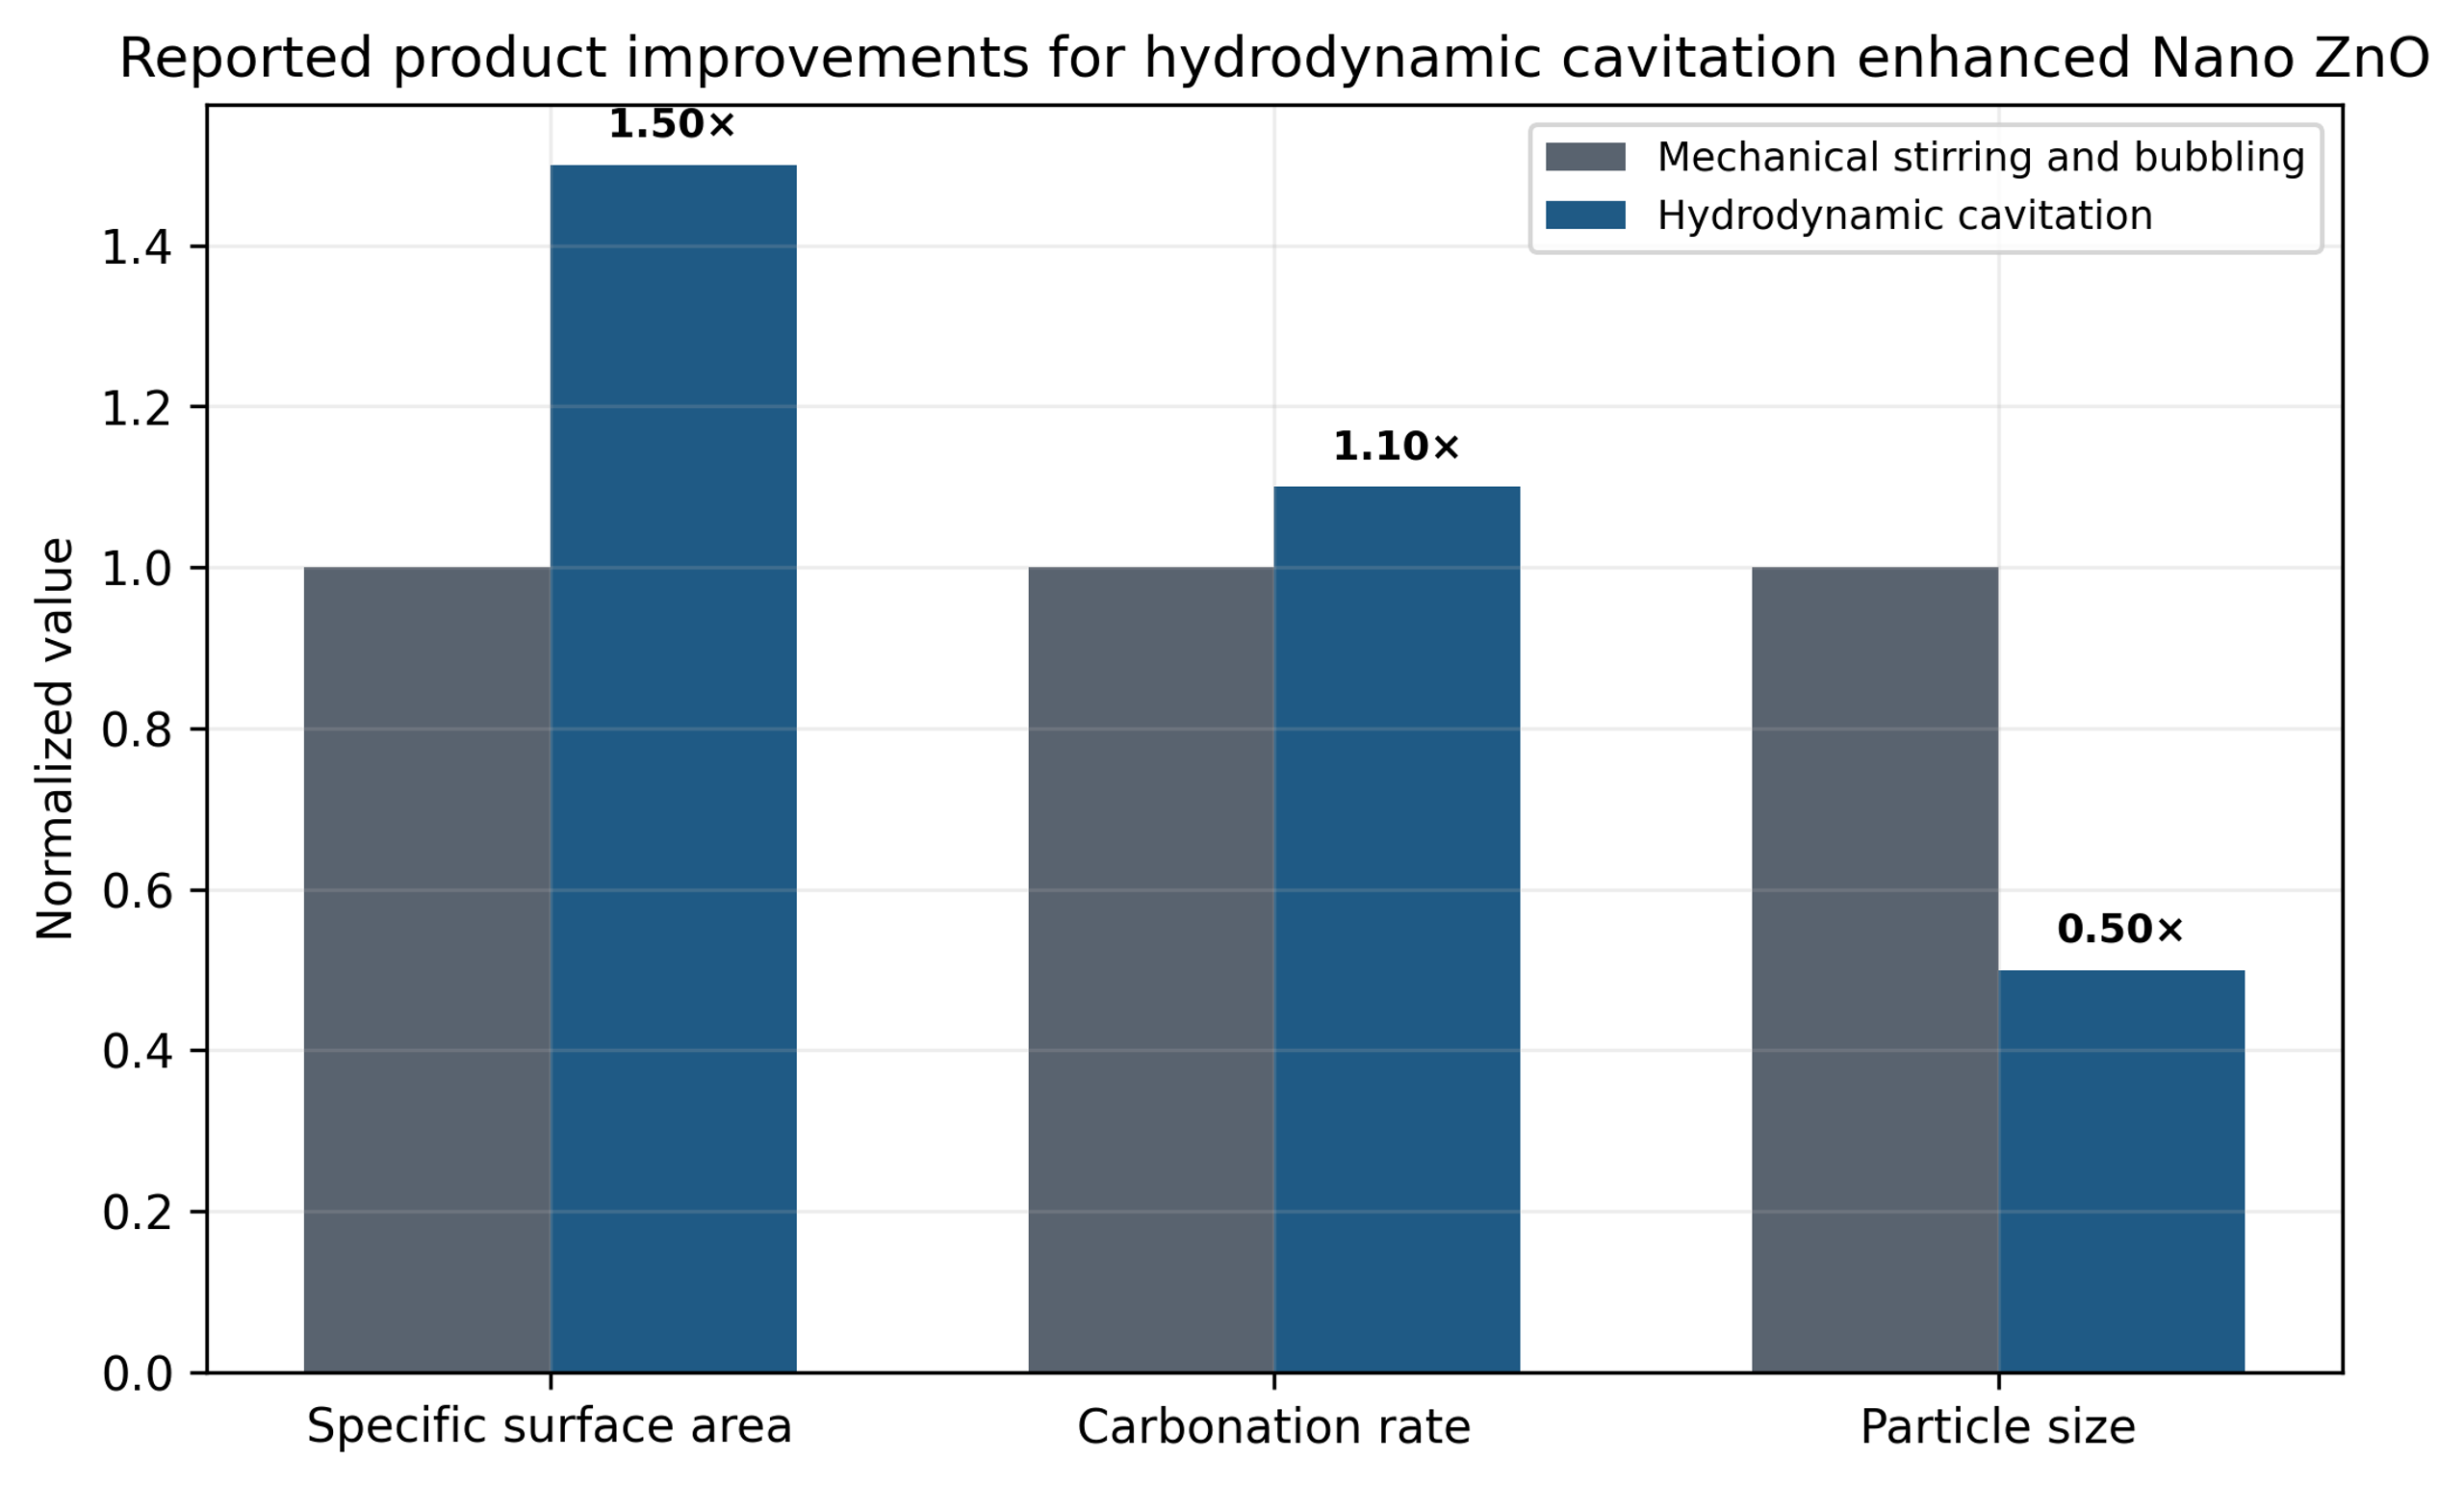
Figure 7.5. Normalized comparison of hydrodynamic cavitation with mechanical stirring and bubbling for nano ZnO preparation. [10].
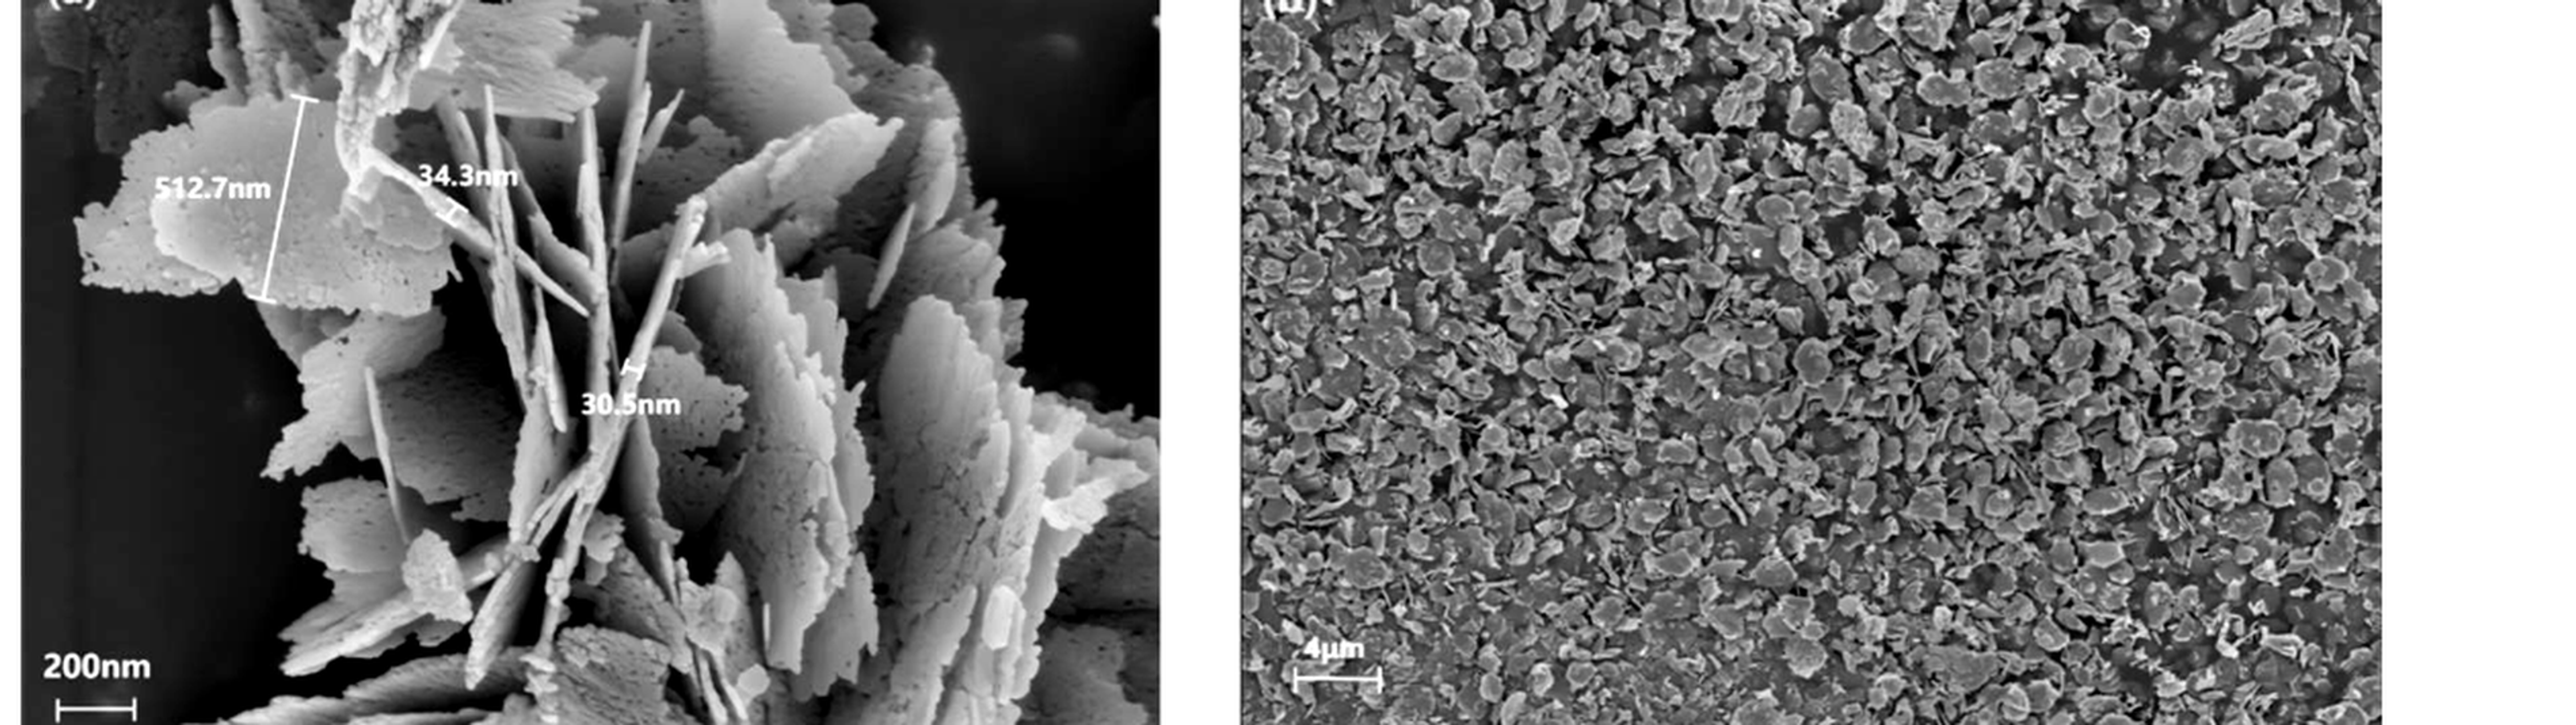
Figure 7.6. High and low magnification SEM images of sheetlike nano ZnO produced by hydrodynamic cavitation enhanced carbonization. [10].
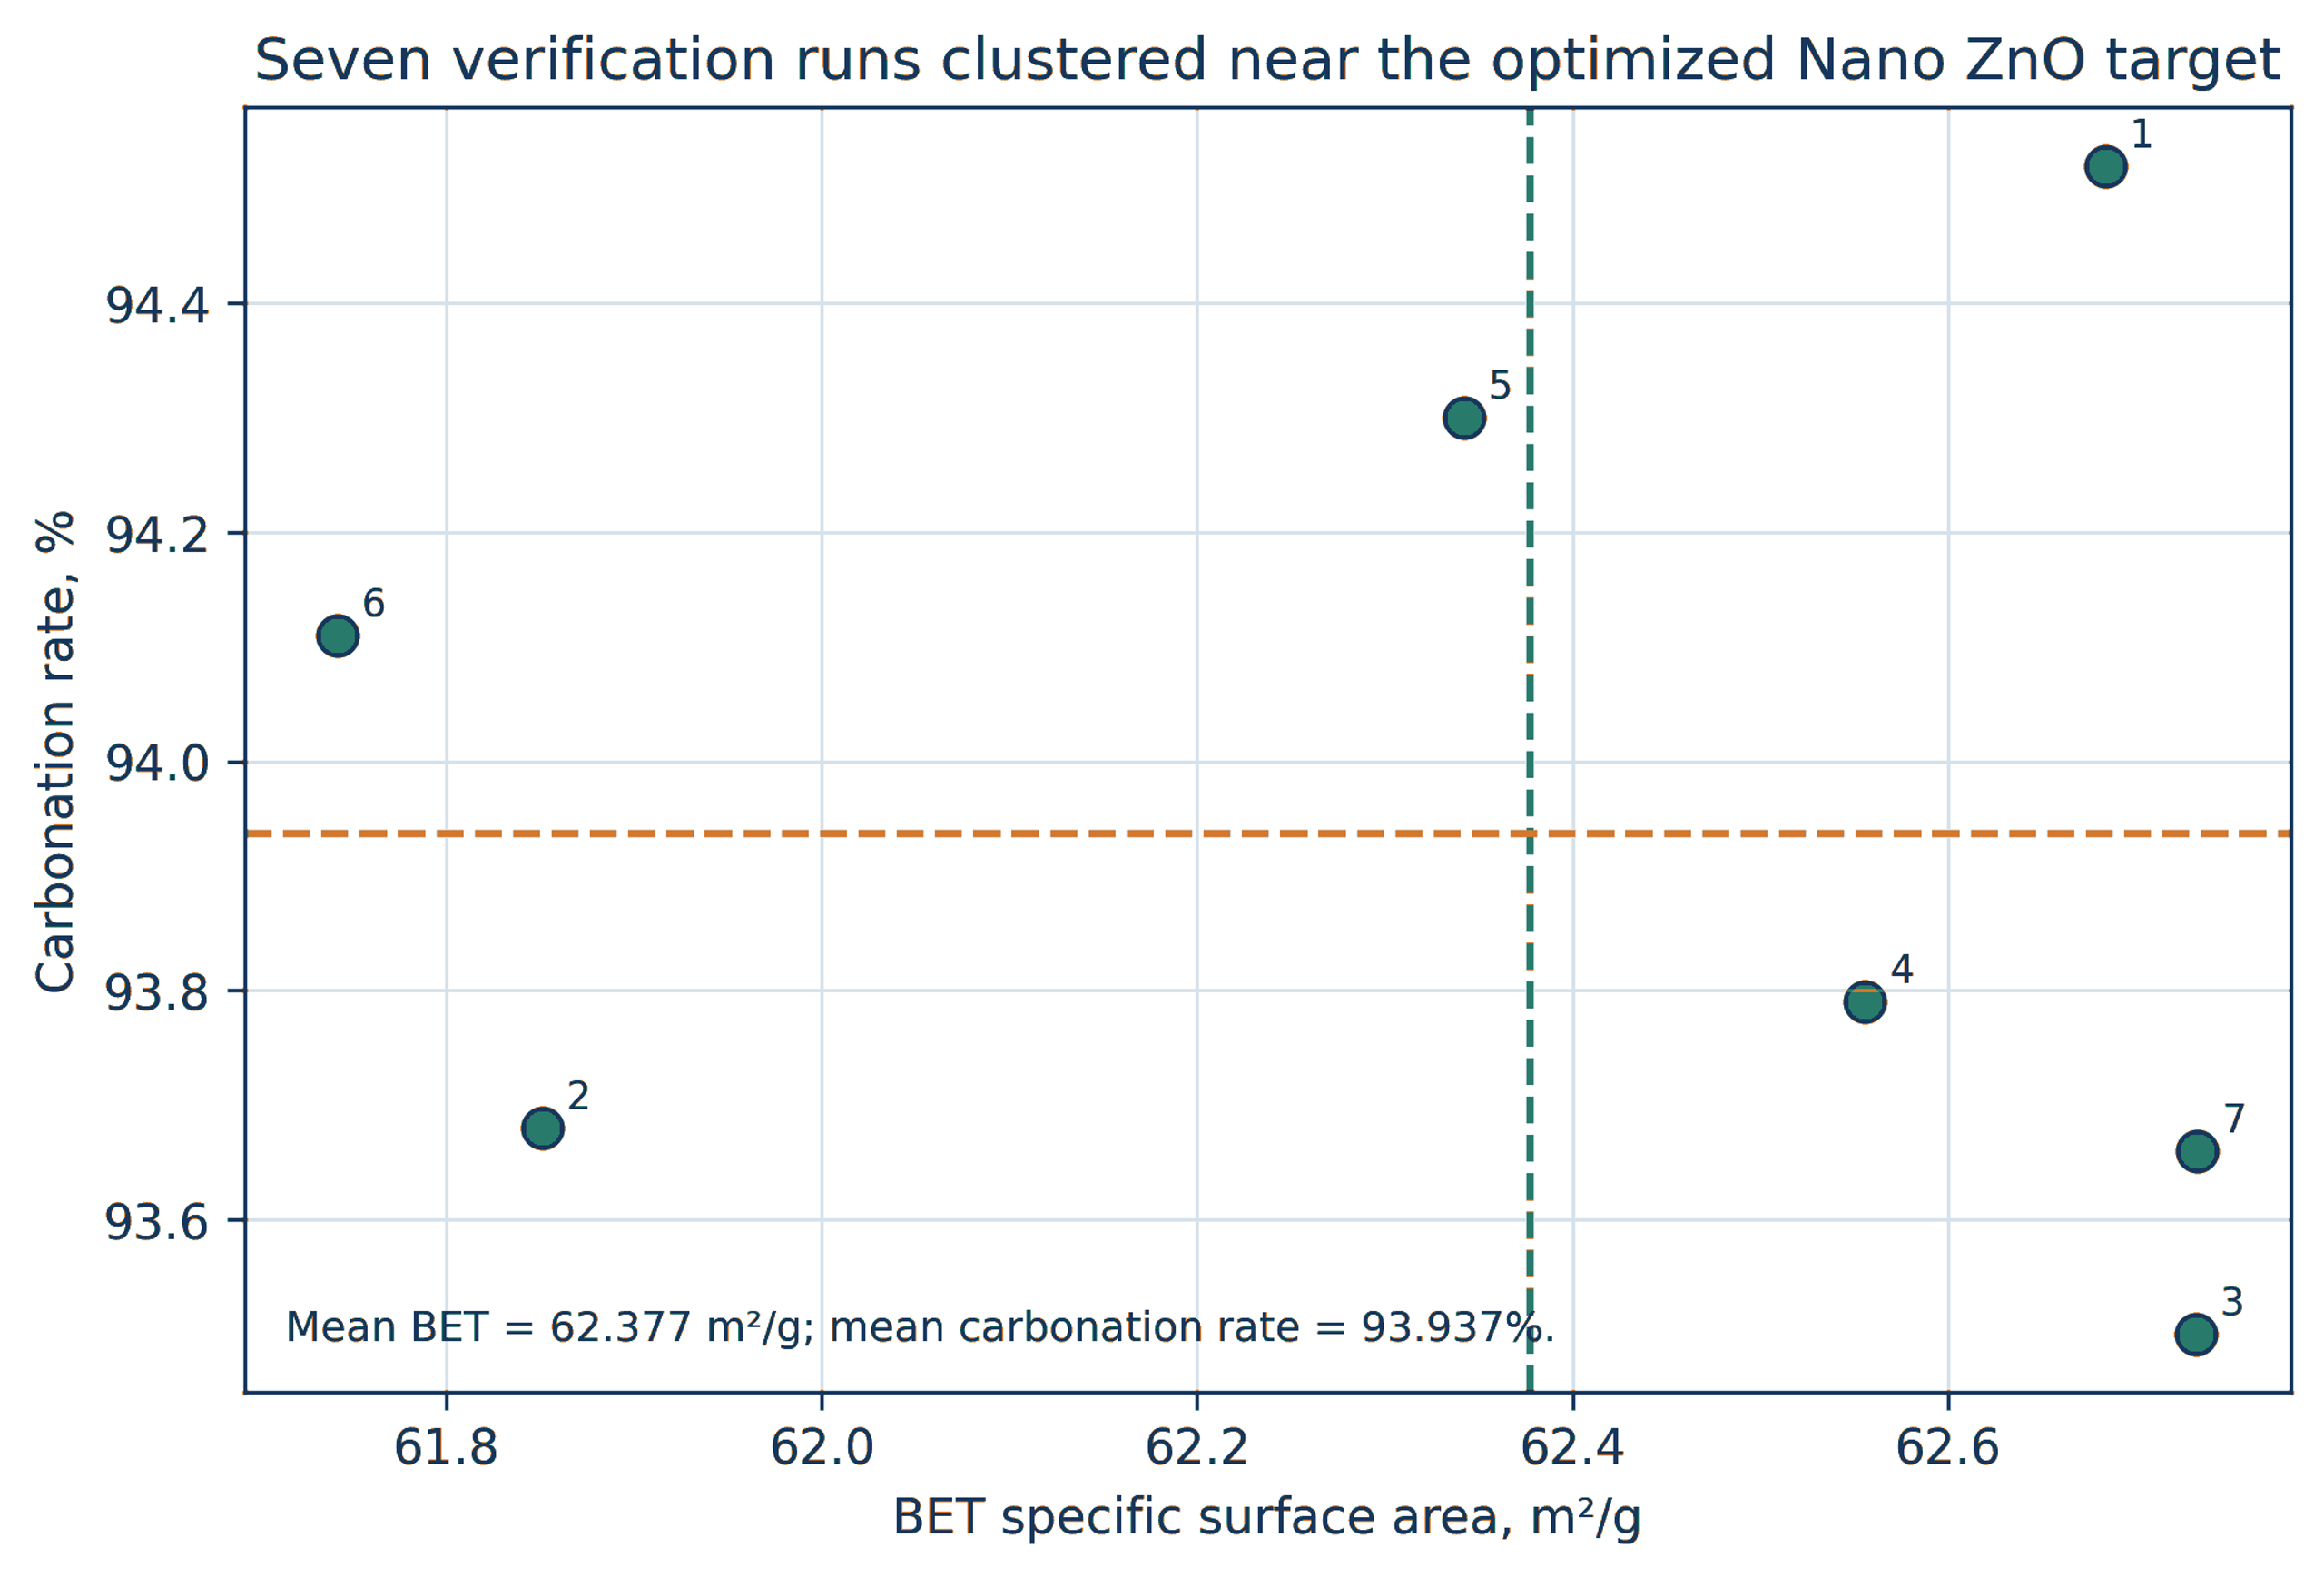
Figure 7.7. Predicted and measured BET area and carbonization rate for the optimized nano ZnO process. [10].
7.3 Ultrasonic Jet Coupling as a New Benchmark
Guo et al. coupled a 20 kHz ultrasonic unit with a hydraulic jet reactor and applied response surface experiments, machine learning, and genetic optimization [11]. The optimized ultrasonic jet route achieved a reaction yield of 94.923%, a BET area of 62.122 m² g⁻¹, and a crystallite size of 18.886 nm in 90 min.
The authors compared these values with the 2024 hydrodynamic route, which required 120 min and produced 93.937% carbonization, 62.377 m² g⁻¹ BET area, and an X-ray size metric of 28.679 nm. The coupled route reduced treatment time and crystallite size while maintaining comparable BET area, but it also added equipment complexity and a measured net ultrasonic calorimetric power of approximately 194.90 W, equivalent to about 1052 kJ over the optimized treatment. The comparison shows that an additional energy field should be evaluated by product benefit per total energy input, not by structural improvement alone.
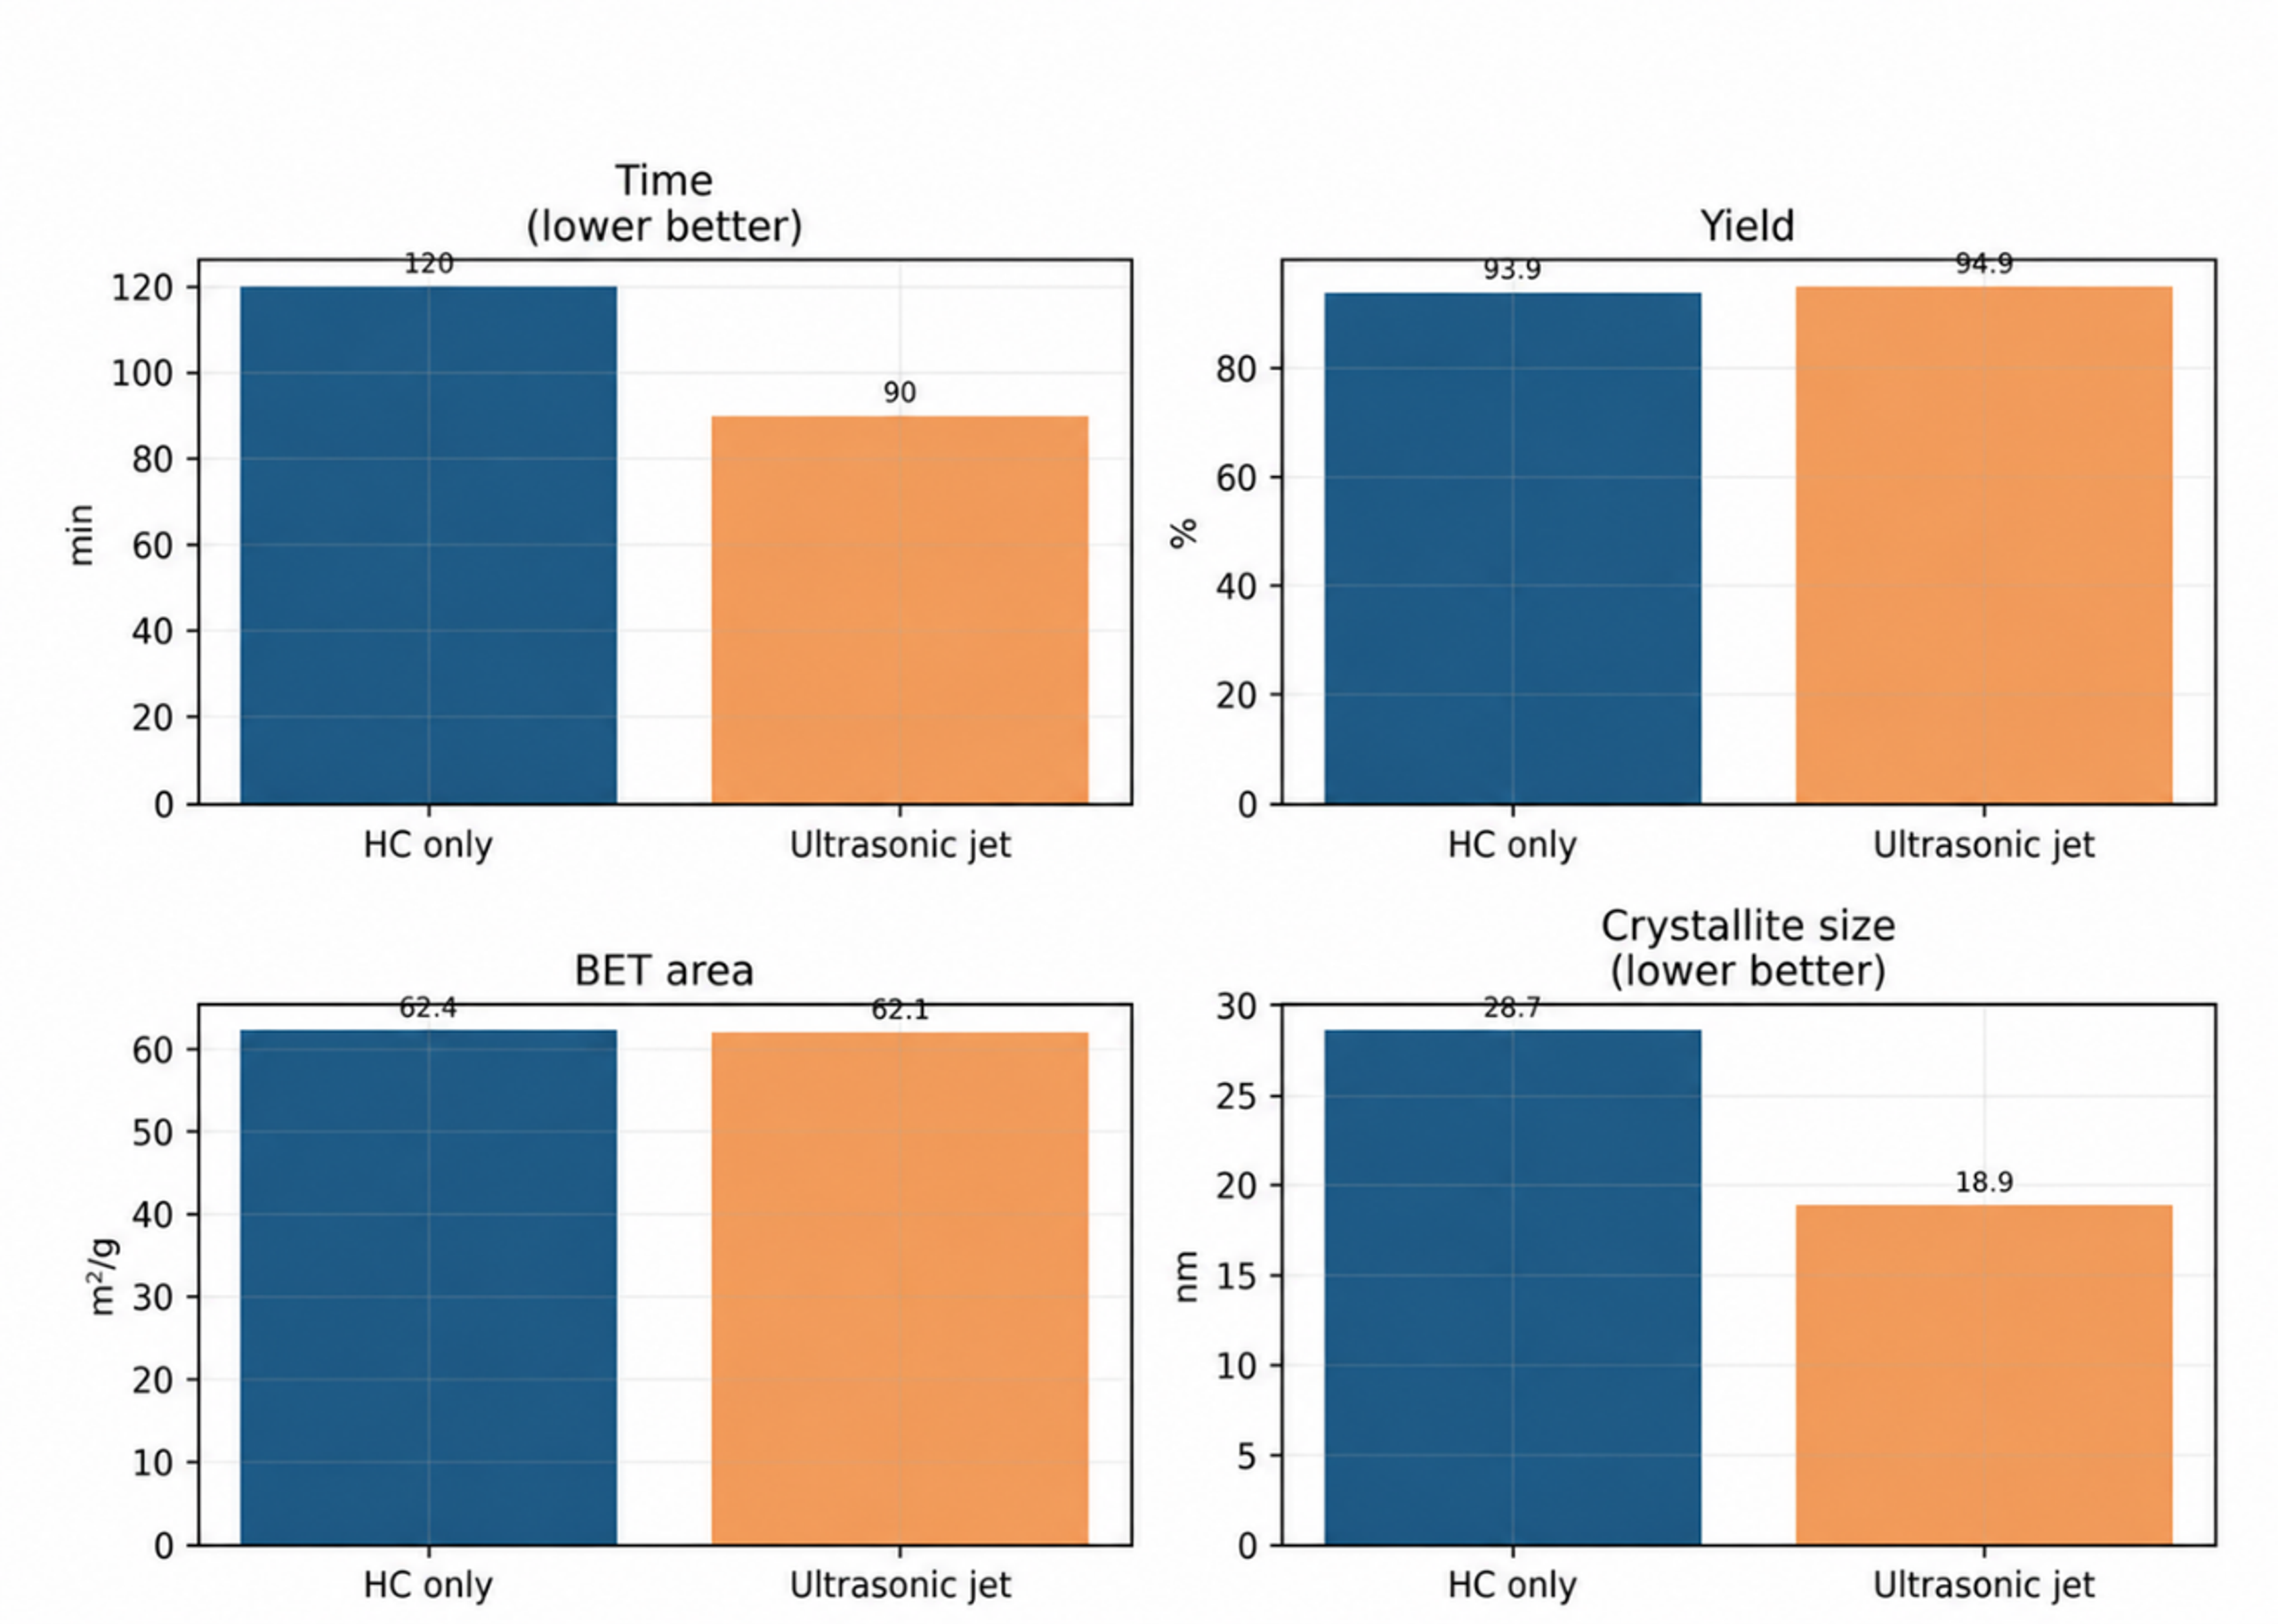
Figure 7.8. Comparison of the ultrasonic jet route with the published hydrodynamic cavitation route for nano ZnO. [11].
7.4 Iron Oxide and Catalyst Slurry Dispersion
Shaik et al. compared acoustic and hydrodynamic preparation of iron oxide nanoparticles. Reported average dimensions were approximately 81 by 17 nm for acoustic cavitation and 49 by 13 nm for hydrodynamic cavitation. The authors attributed the smaller hydrodynamic product to a shorter induction period and rapid supersaturation. The particles were subsequently used as nanocontainer cores for corrosion inhibitor release [13]. The study also demonstrates the importance of reporting both length and width for anisotropic particles.
Hydrodynamic cavitation has also been used to prepare catalyst ink or slurry for polymer electrolyte fuel cells. In this application, the principal objective is not precipitation but uniform dispersion of catalyst and ionomer while limiting damaging agglomerates [14]. This extends the role of cavitation from catalyst synthesis to catalyst formulation. Relevant quality attributes include rheology, aggregate distribution, ionomer coverage, electrode microstructure, and cell performance.
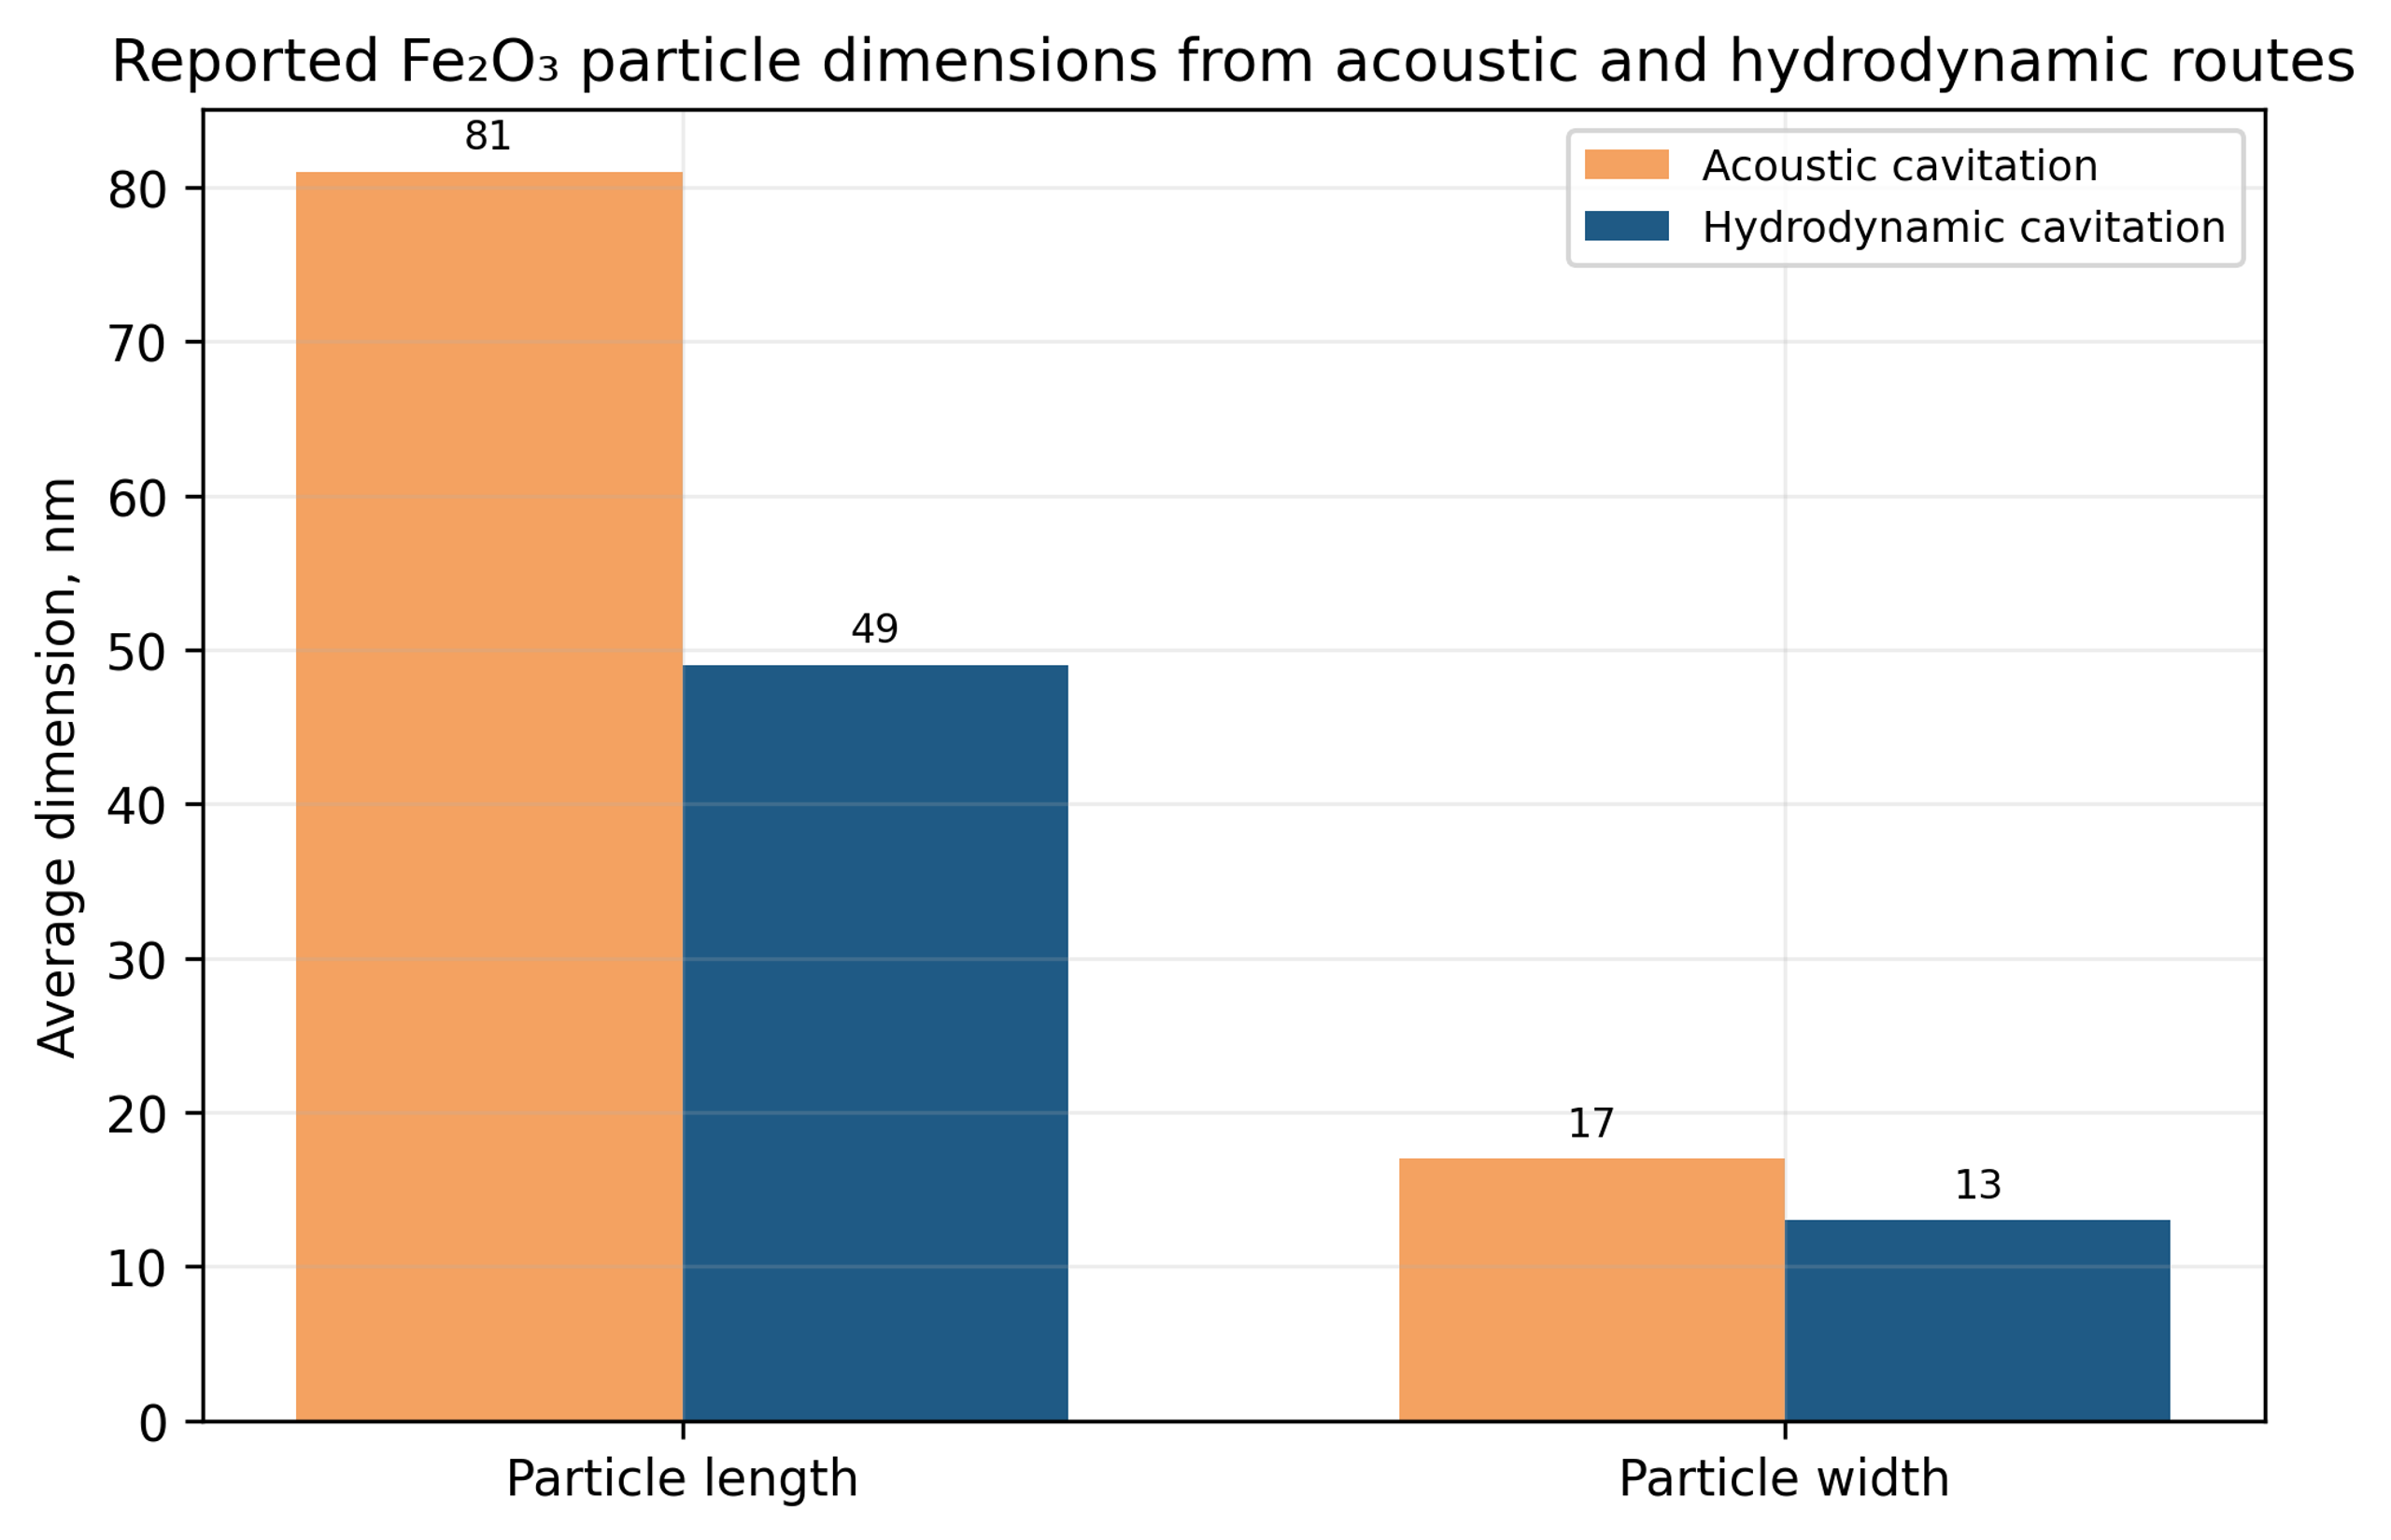
Figure 7.9. Reported Fe₂O₃ particle dimensions from acoustic and hydrodynamic preparation routes. [13].
Table 7.1. Later hydrodynamic cavitation particle formation studies
| System | Reactor and chemistry | Reported outcome | Development lesson |
|---|---|---|---|
| Nanocalcite | Closed loop orifice reactor with CO₂ carbonation | 101 nm without restriction and 37 nm with five 1 mm holes | Geometry affects induction, gas transfer, and size independently of phase |
| Nano ZnO, 2024 | 40 L hydraulic jet carbonation and response surface optimization | 62.377 square meters per gram and 93.937 percent verification averages | Optimize interactions among solid loading, cavitation number, and jet position |
| Nano ZnO, 2026 | Ultrasonic jet coupled carbonation with machine learning optimization | 90 minute route, 94.923 percent yield, 18.886 nm crystallite size | Compare added field complexity and energy with incremental product benefit |
| Fe₂O₃ | Orifice flow with air assisted oxidation | 49 by 13 nm hydrodynamic particles versus 81 by 17 nm acoustic particles | Report anisotropy and downstream functional performance |
| Fuel cell slurry | Hydrodynamic cavitation dispersion of catalyst and ionomer | Improved slurry preparation reported for electrode manufacture | Cavitation can formulate a catalyst after synthesis as well as create it |