
Technical publication
Back to publications
Reactors & equipment
Cavitation Driven Exfoliation of Graphene and Two Dimensional Materials
okozyuk.com
Published
Read complete publication for whole-document Find and printing. Browser Find and native printing on this reader include only loaded content.
6 Hydrodynamic Cavitation Exfoliation
6.1 Devices and Flow Regimes
Hydrodynamic cavitation can be generated by flow through a constriction, Venturi throat, orifice, nozzle, valve, rotor stator gap, interaction chamber, microchannel, or wet jet processor. The method is naturally compatible with continuous pumping and recycle. The active field can be described by pressure drop, flow rate, back pressure, geometry, cavitation number, residence time, and pass count. These variables are generally more directly scalable than nominal ultrasonic amplitude, although the flow remains complex and equipment wear can be substantial.
The hydraulic power made available across a pressure reduction element is:
Ph is pump shaft power required for the useful pressure drop, Δp is pressure difference, Q is volumetric flow rate, and ηp is overall pump efficiency. The actual system power also includes recirculation, cooling, mixing, and separation.
Ev is the ideal cumulative hydraulic energy density for Np identical passes when each pass dissipates approximately Δp joules per cubic meter. This relation is a first order accounting tool and does not identify the fraction coupled to exfoliation*.*
is specific process energy per mass of recovered product, t is processing time, and is recovered product mass. This metric exposes low usable yield that can be hidden by energy per liter.
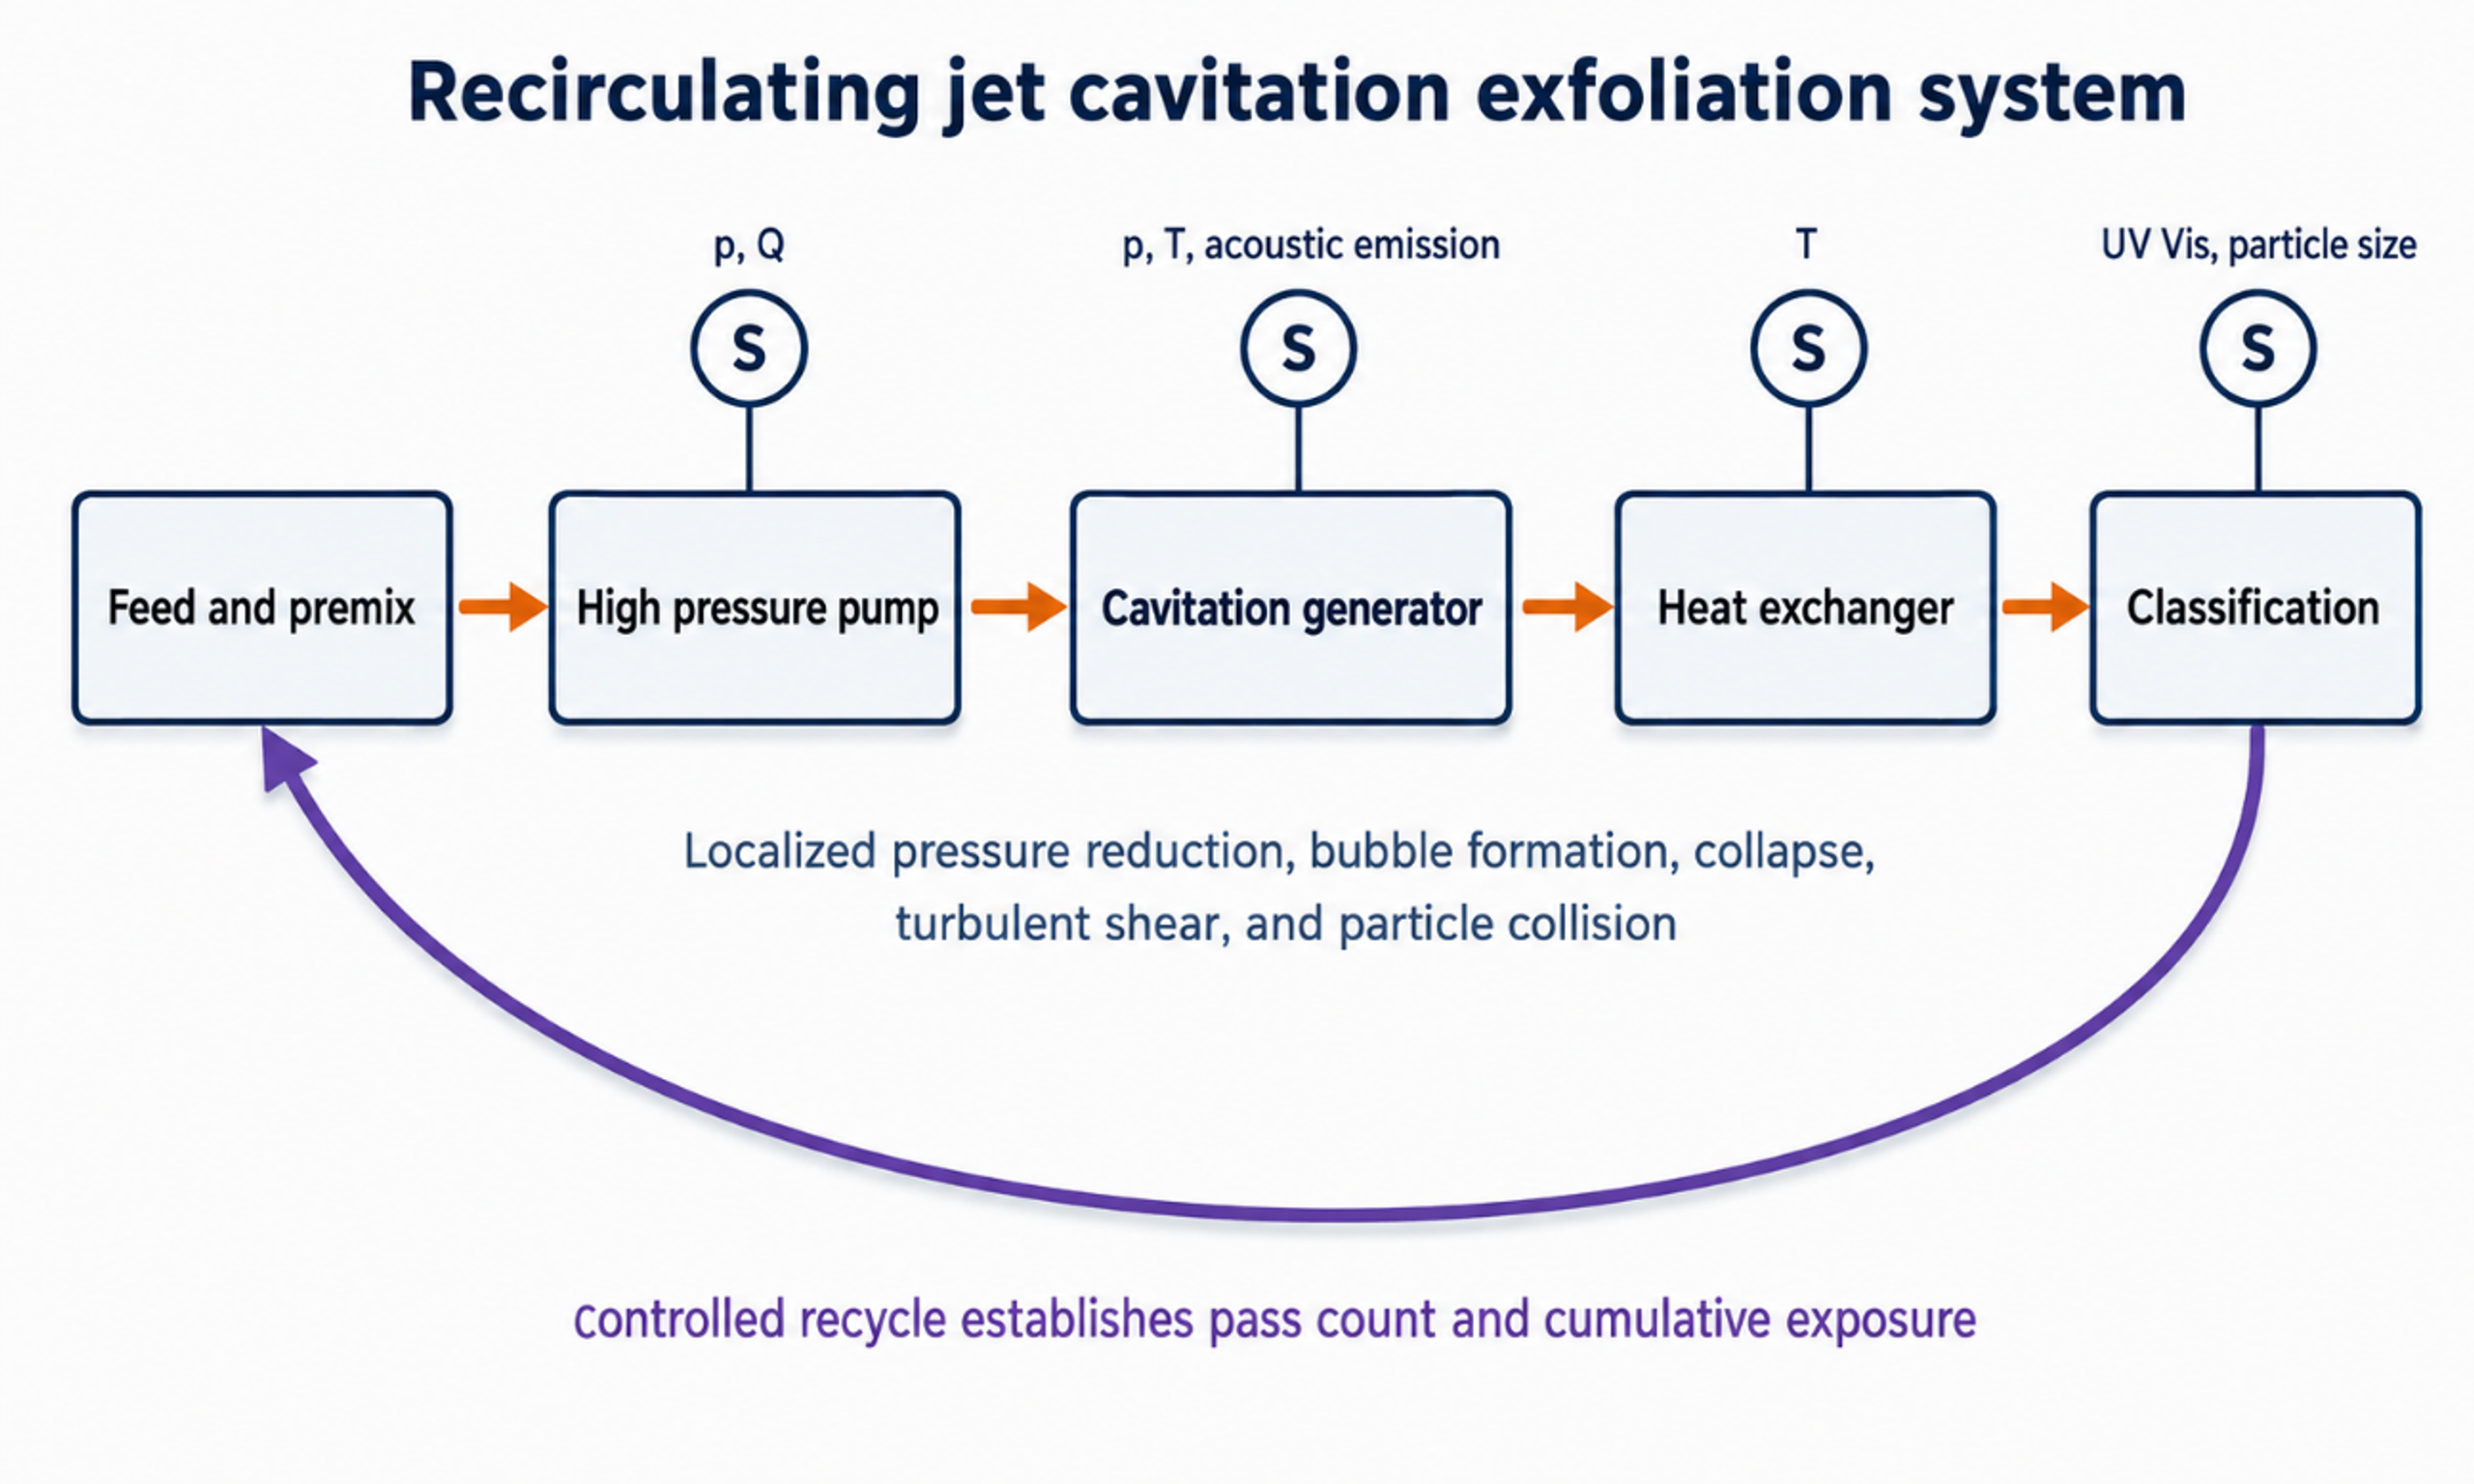
Figure 6.1. Recirculating jet cavitation system with pressure, flow, temperature, acoustic emission, and product sensors. Controlled recycle establishes cumulative exposure [37].
6.2 Jet Cavitation Evidence
One of the earliest jet cavitation demonstrations processed a 30 kg aqueous suspension containing 1.9 mass percent crystalline graphite, 0.1 mass percent carboxymethyl cellulose, and 98 mass percent water at 20 MPa for 30 min. AFM, TEM, and Raman analyses supported the presence of monolayer and few layer material, with an estimated total graphene yield near 4 mass percent [7,8]. The study established process feasibility and proposed a mechanical mechanism based on stress wave reflection at the graphite liquid interface.
A later parameter study used a 10 L graphite dispersion in an acetone water mixture. At an initial graphite concentration of 1 mg mL⁻¹, 20 MPa, and 8 h, the reported exfoliation fraction reached approximately 12 mass percent. At 15 MPa, the fraction of flakes thinner than 1.5 nm increased from 29 percent after 0.5 h to 63 percent after 4 h and 79 percent after 8 h. Increasing pressure to 20 MPa increased the thin flake fraction but also raised Raman ID/IG from approximately 0.251 to 0.277, consistent with greater edge generation [9].
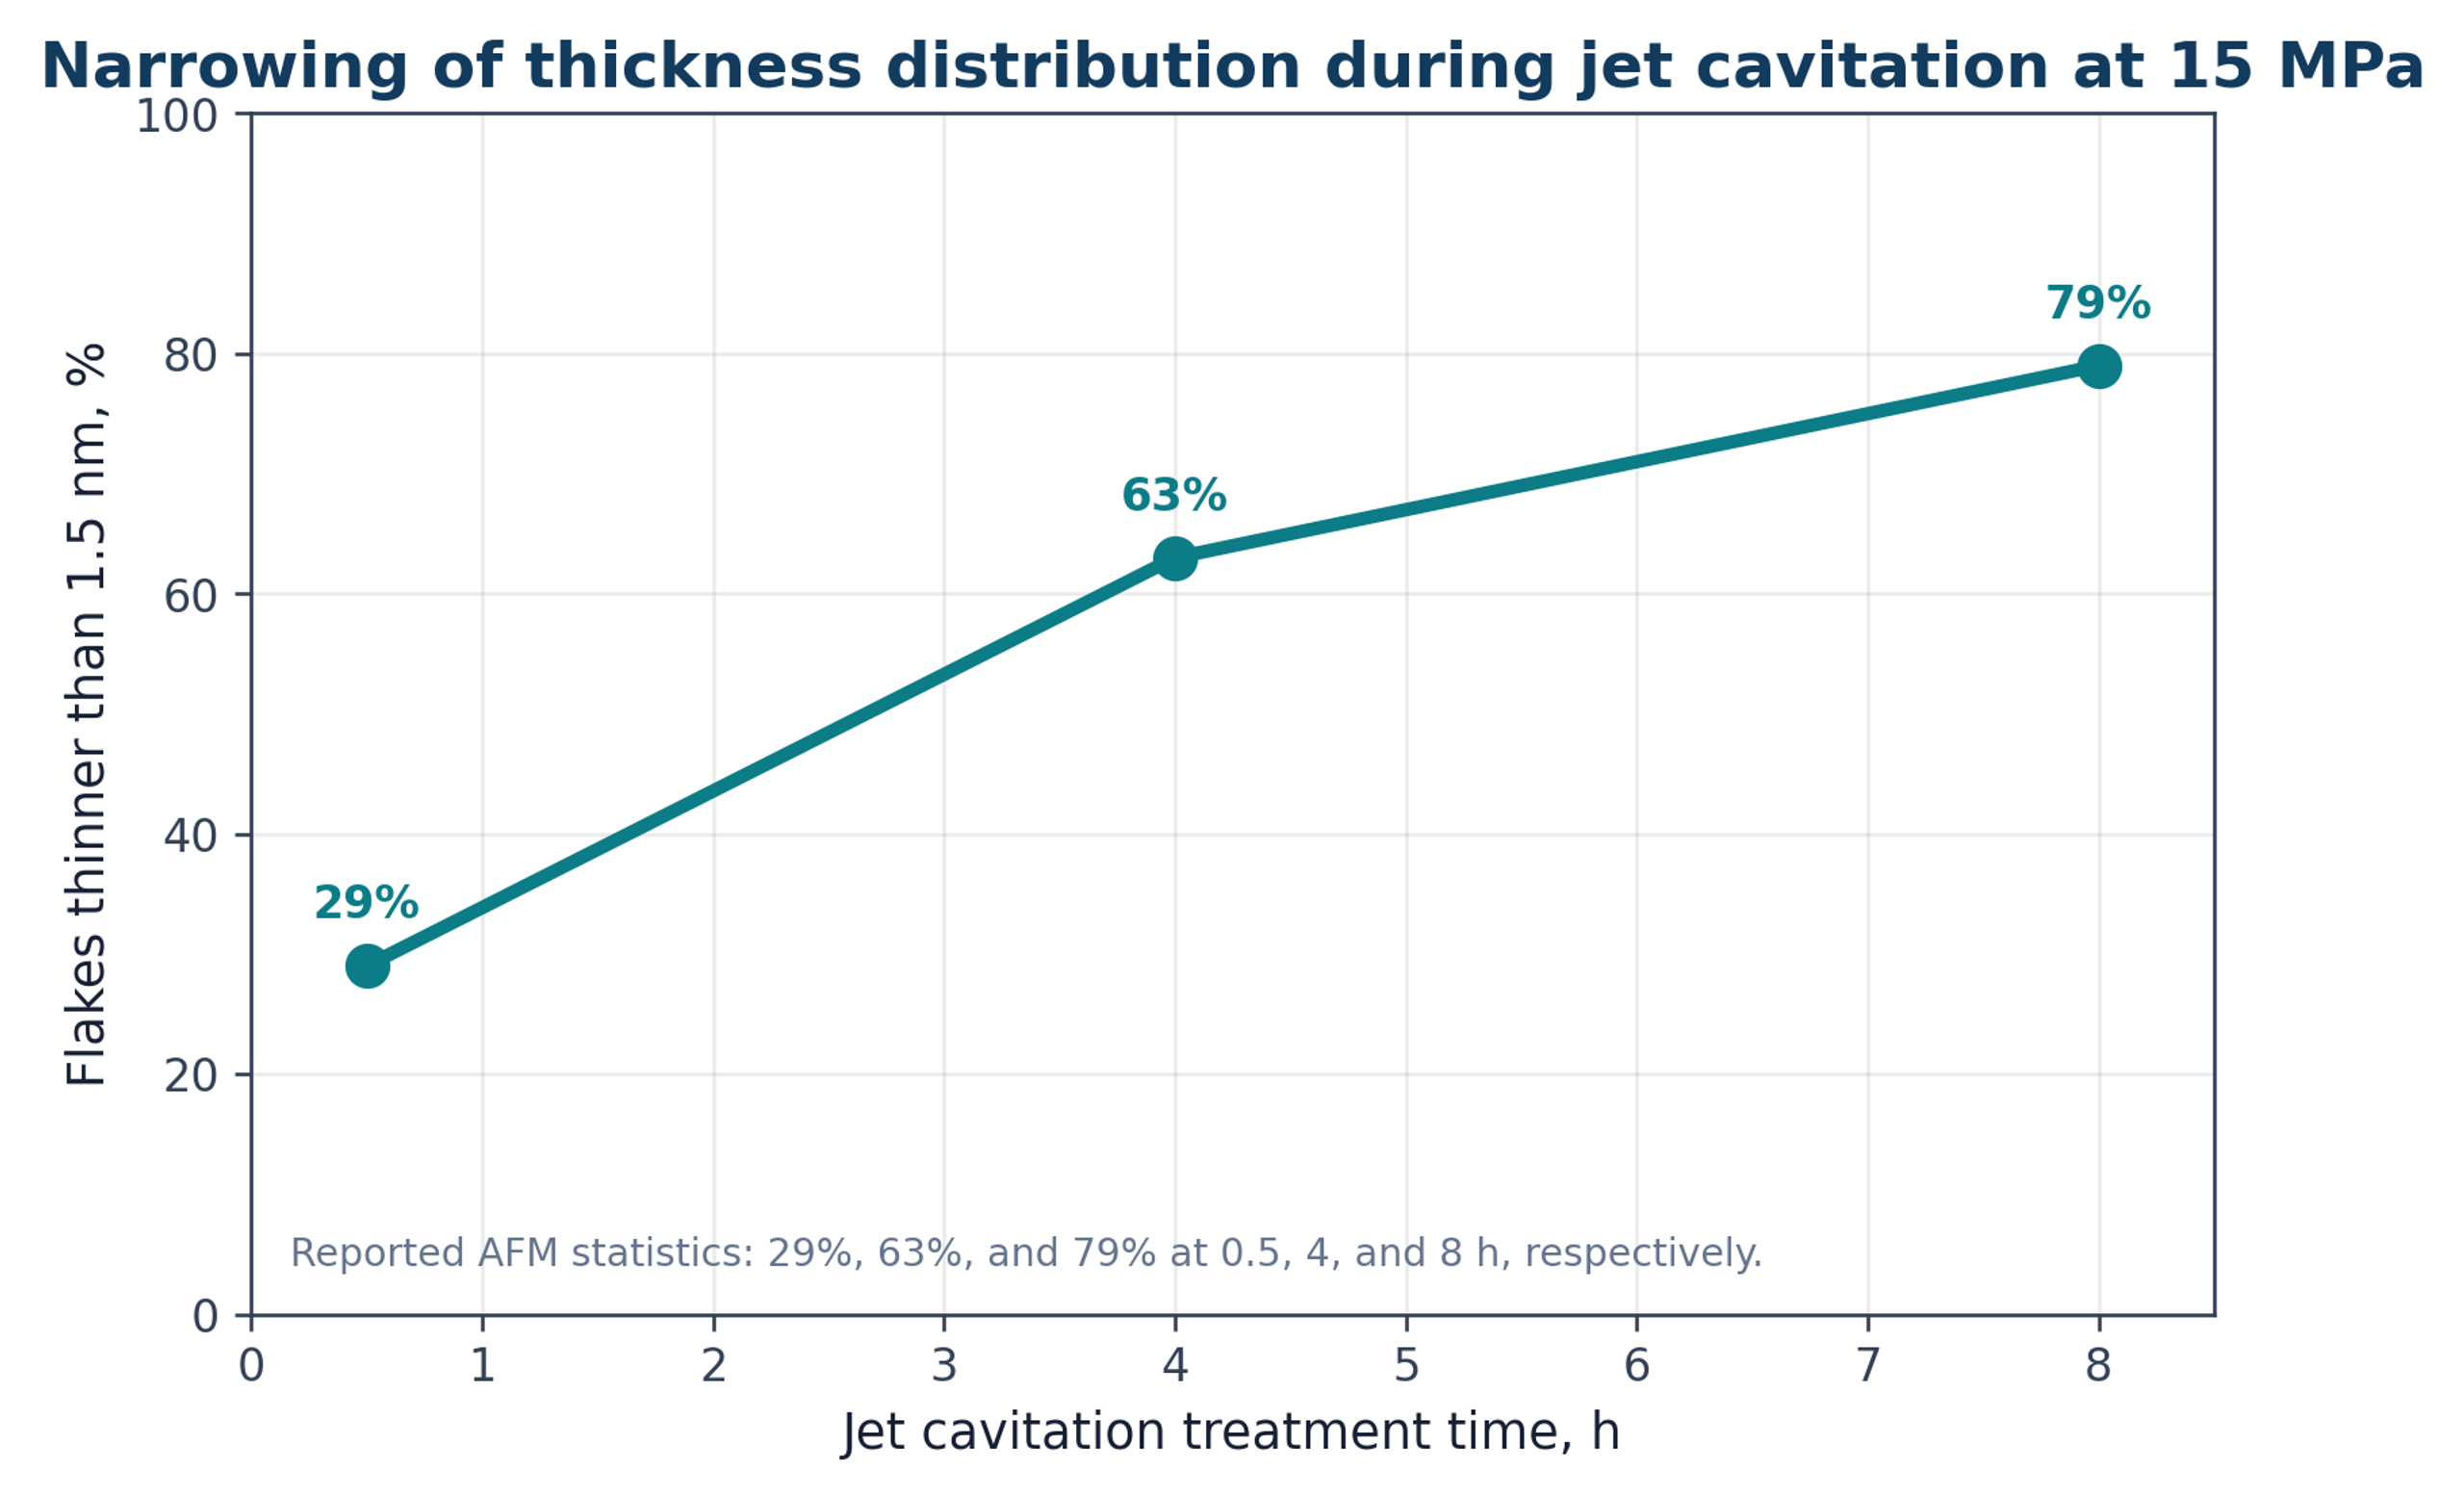
Figure 6.2. Reported increase in the fraction of flakes thinner than 1.5 nm with jet cavitation treatment time at 15 MPa [9].
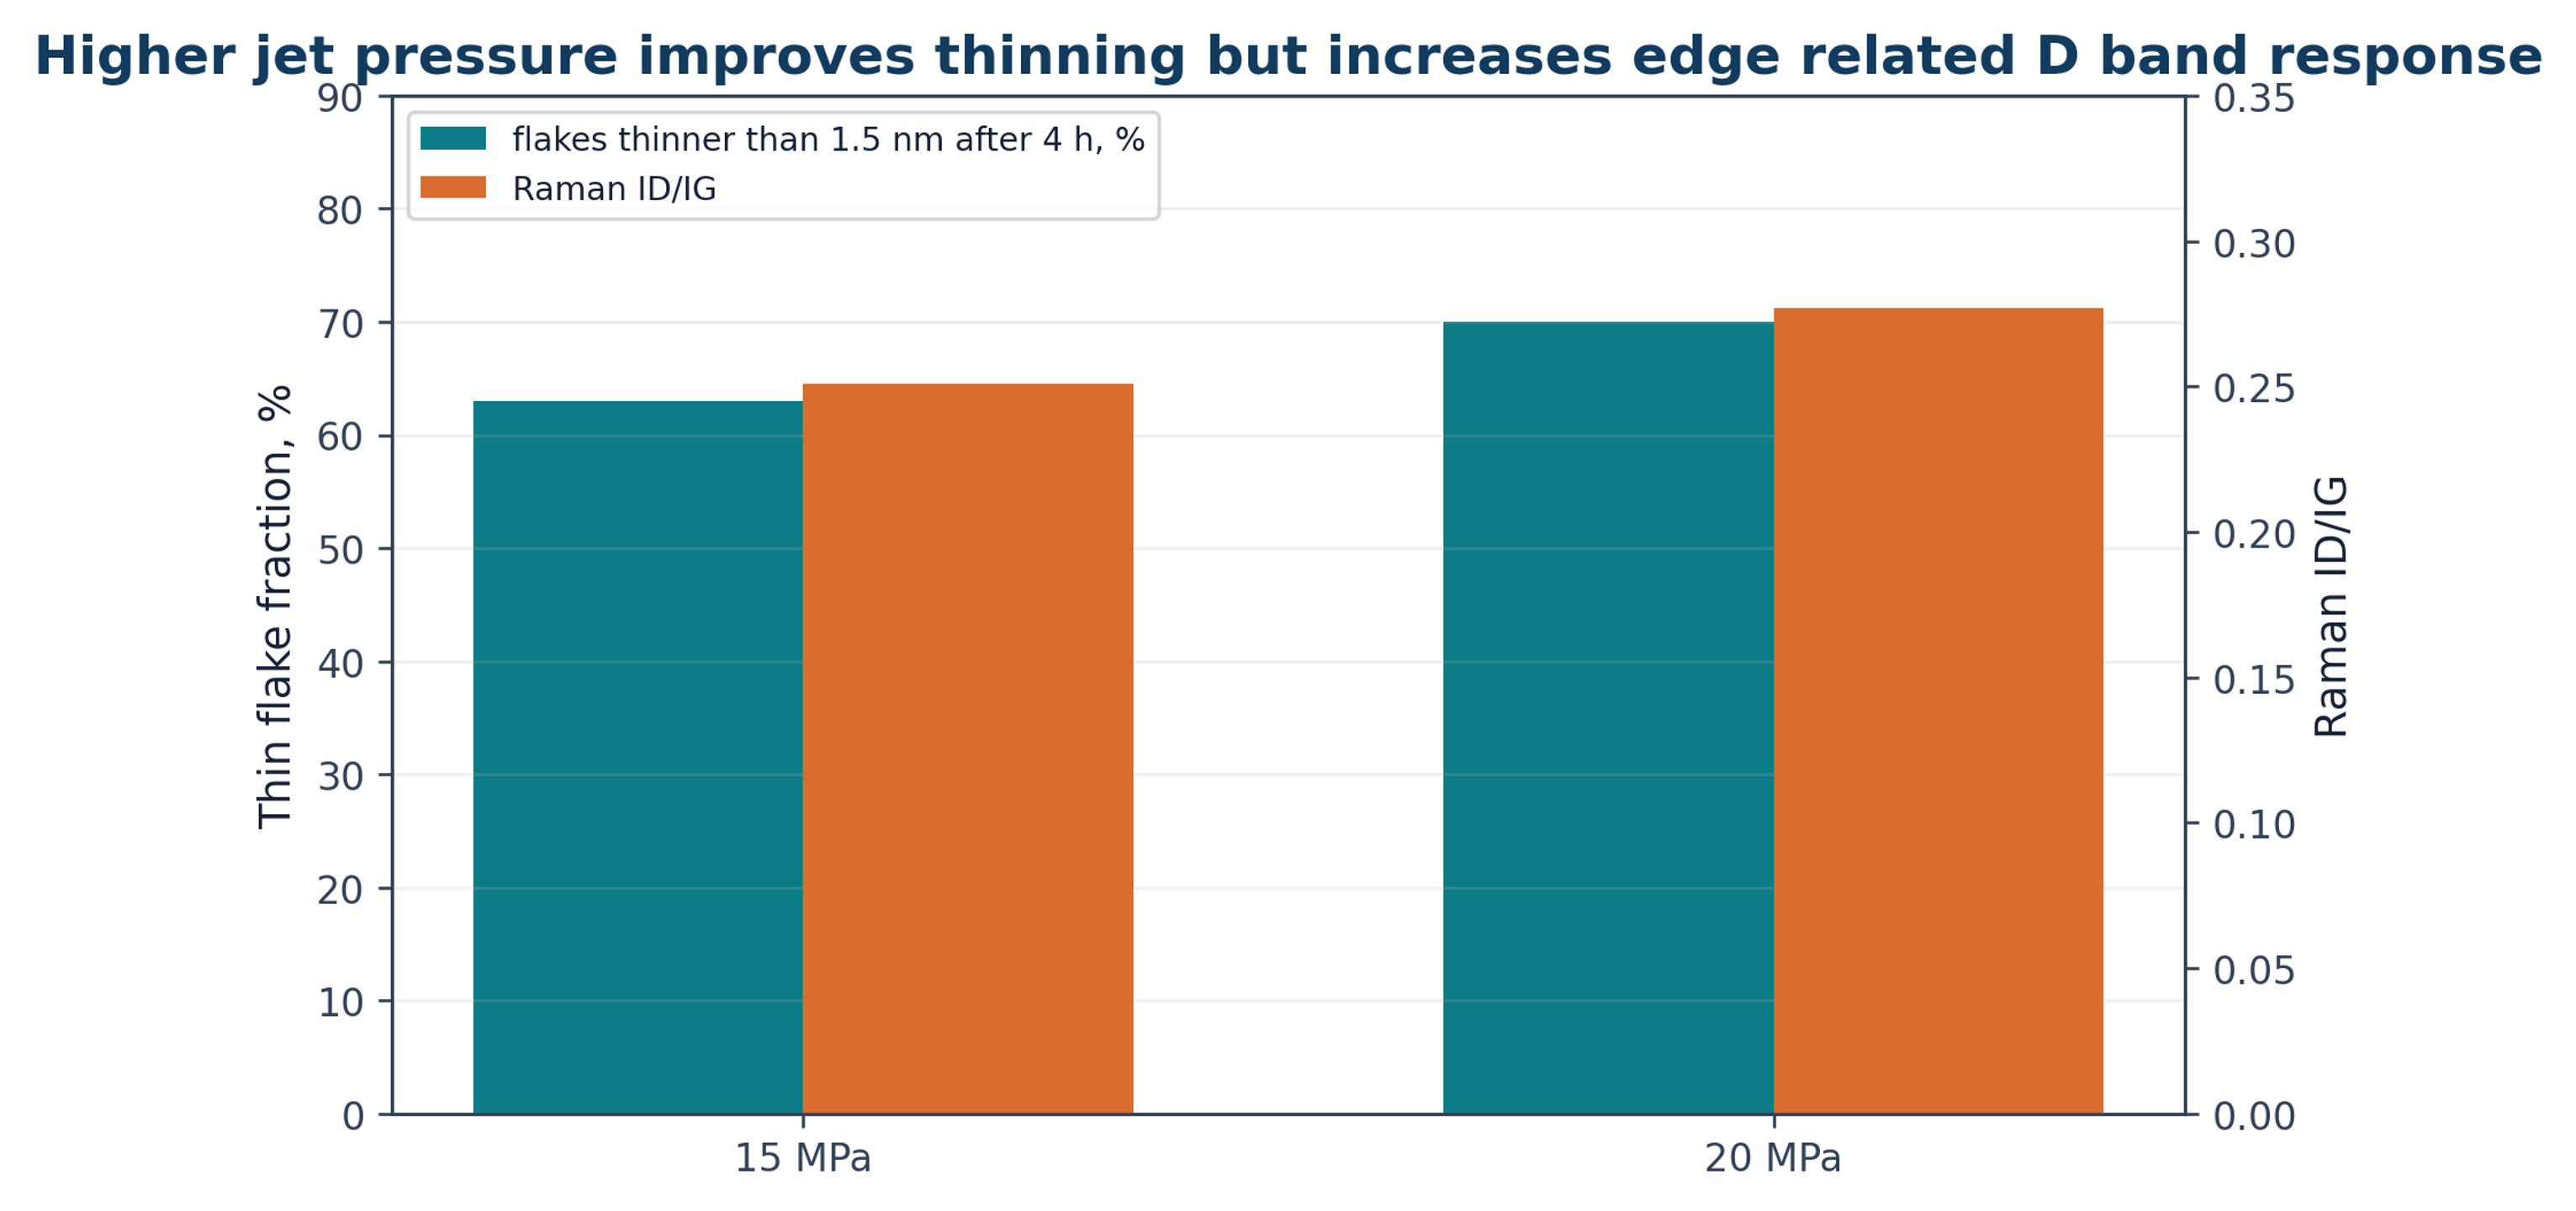
Figure 6.3. Pressure related tradeoff between thinning and Raman D band response. The 20 MPa condition produced a larger thin flake fraction and a slightly larger ID/IG ratio [9].
The concentration study also showed that increasing graphite loading does not necessarily increase graphene output. At high initial loading, the product concentration plateaued and could decrease. Particle loading changes turbulence, bubble nucleation, viscosity, collision frequency, and access to the active region. Scale up should therefore consider the coupled relationship among solids loading, active flow volume, pressure drop, residence time, and heat removal rather than feed concentration alone.
6.3 Hydrodynamic Cavitation on a Chip
Microfluidic cavitation devices provide well defined geometry and permit direct visualization of the flow field. Qiu and coauthors used a silicon and glass device with a 132 micrometer gap, a 10 bar pressure drop, and a flow rate of 16 L h⁻¹. A 50 g L⁻¹ graphite suspension stabilized with 1 g L⁻¹ sodium cholate received approximately 2000 passes. Characterization showed monolayer and few layer graphene with lateral dimensions of several hundred nanometers [10]. The device required modest hydraulic power, but throughput and clogging remain important scale up constraints.
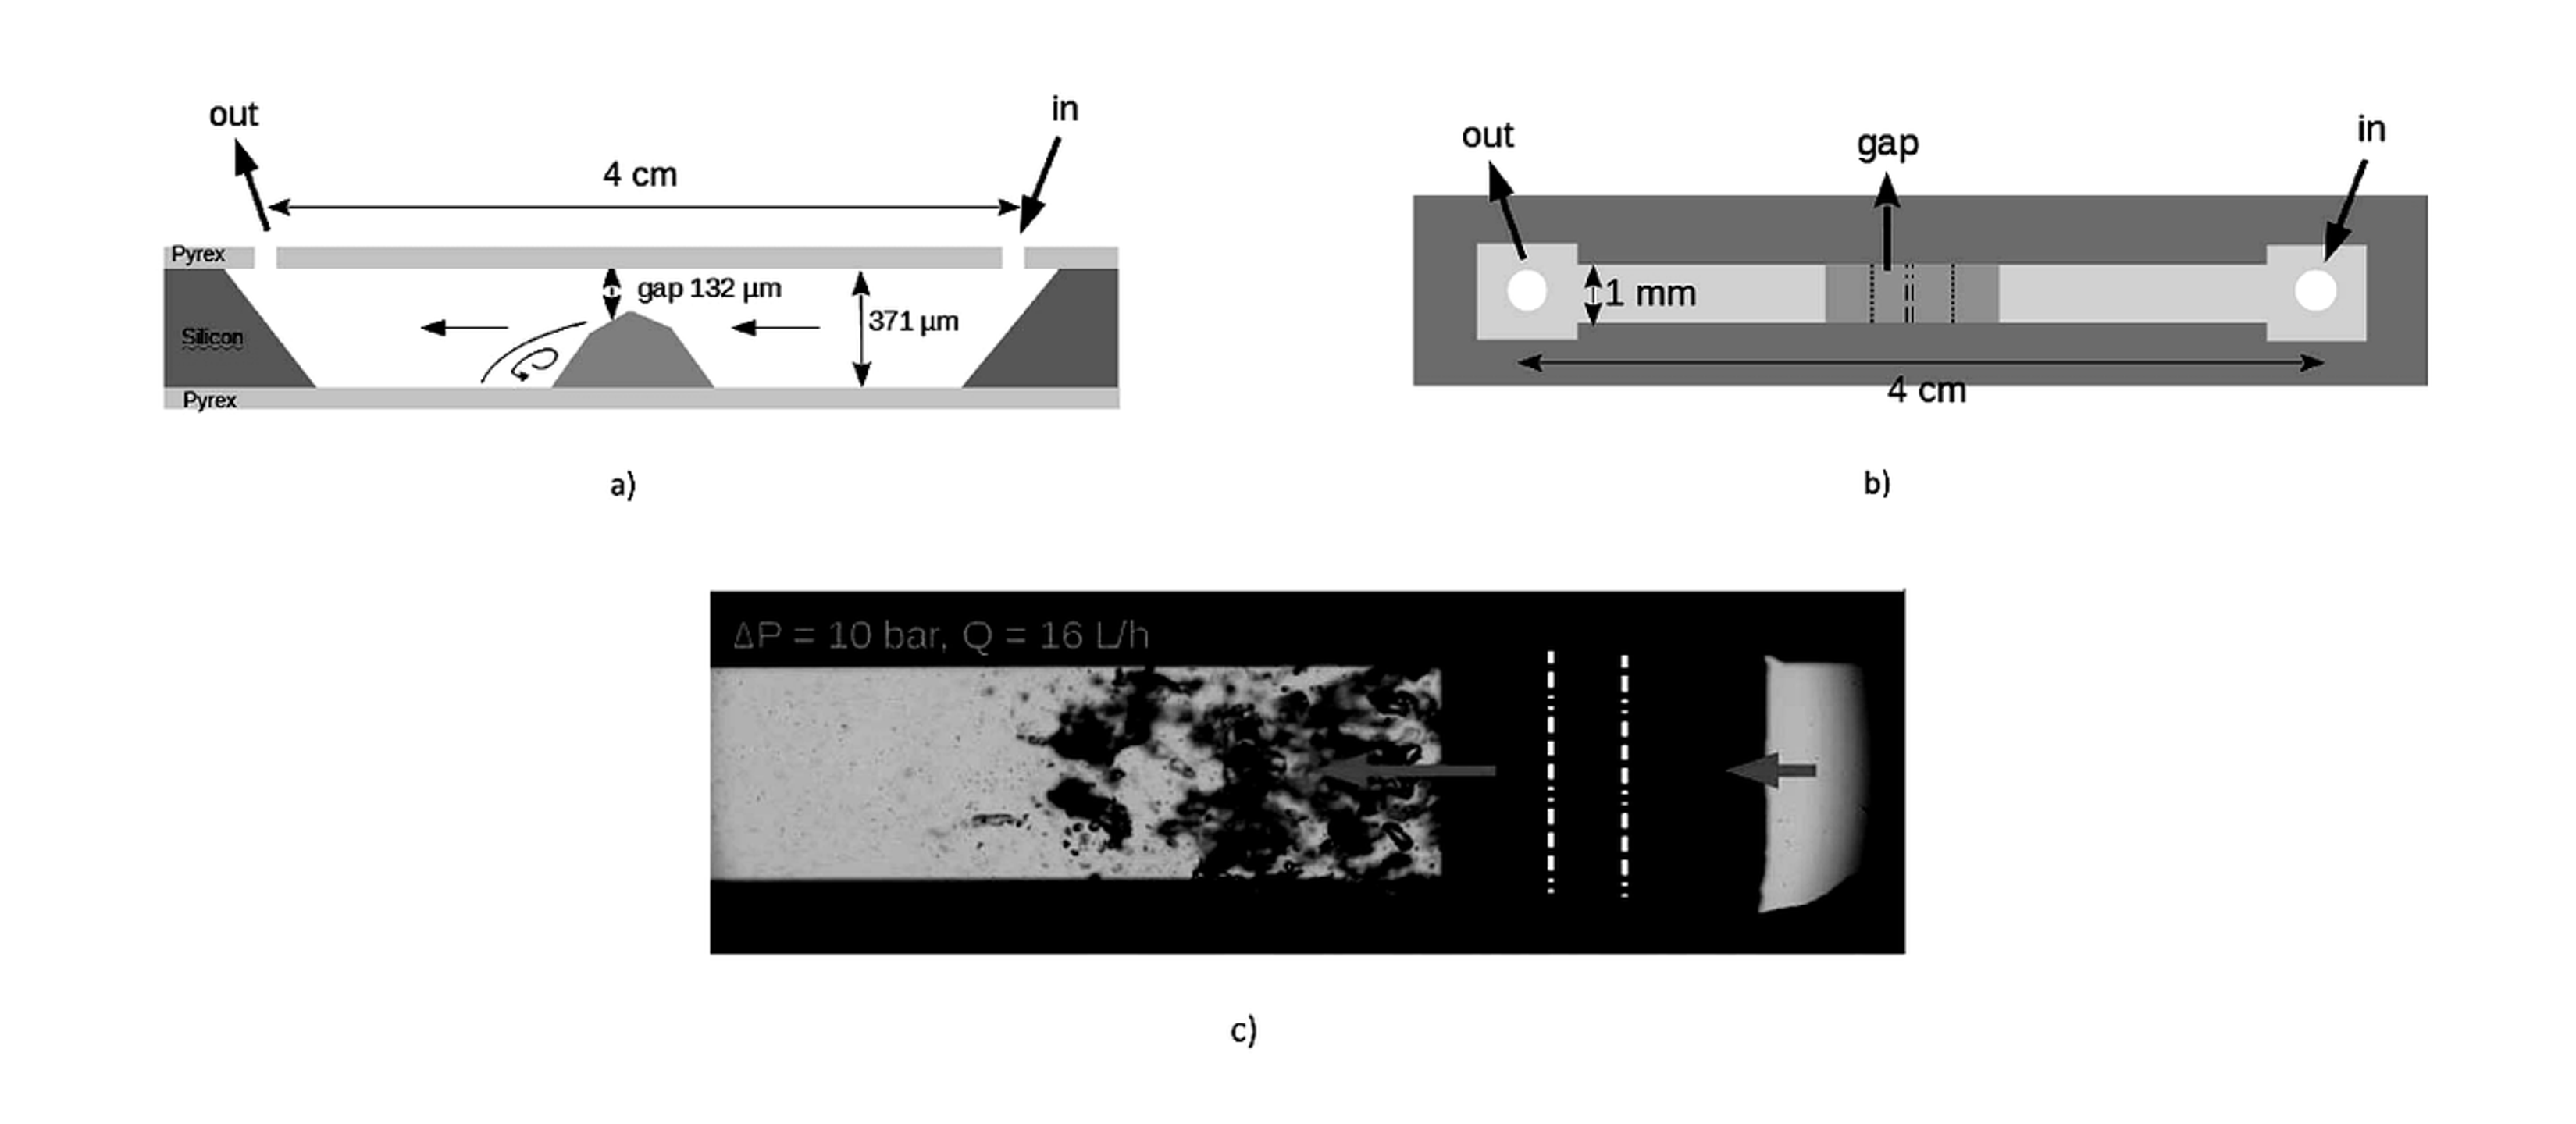
Figure 6.4. Profile view, top view, and cavitating flow image for the hydrocavitating lab on a chip used by Qiu and coauthors. The local step creates a low pressure recirculation region followed by bubble collapse [10].
Jafarpour and coauthors used a pressure resistant microreactor containing an inlet, nozzle, extension section, and engineered roughness. Natural graphite was processed in water without a surfactant, and 650 psi was selected for repeated treatment. Cavitation inception decreased from approximately 220 psi on the first cycle to about 140 psi after 80 cycles, while a fully developed pattern appeared near 300 psi after extensive cycling. The authors attributed this shift to an increasing population of heterogeneous nuclei as particles became smaller and more numerous [11].
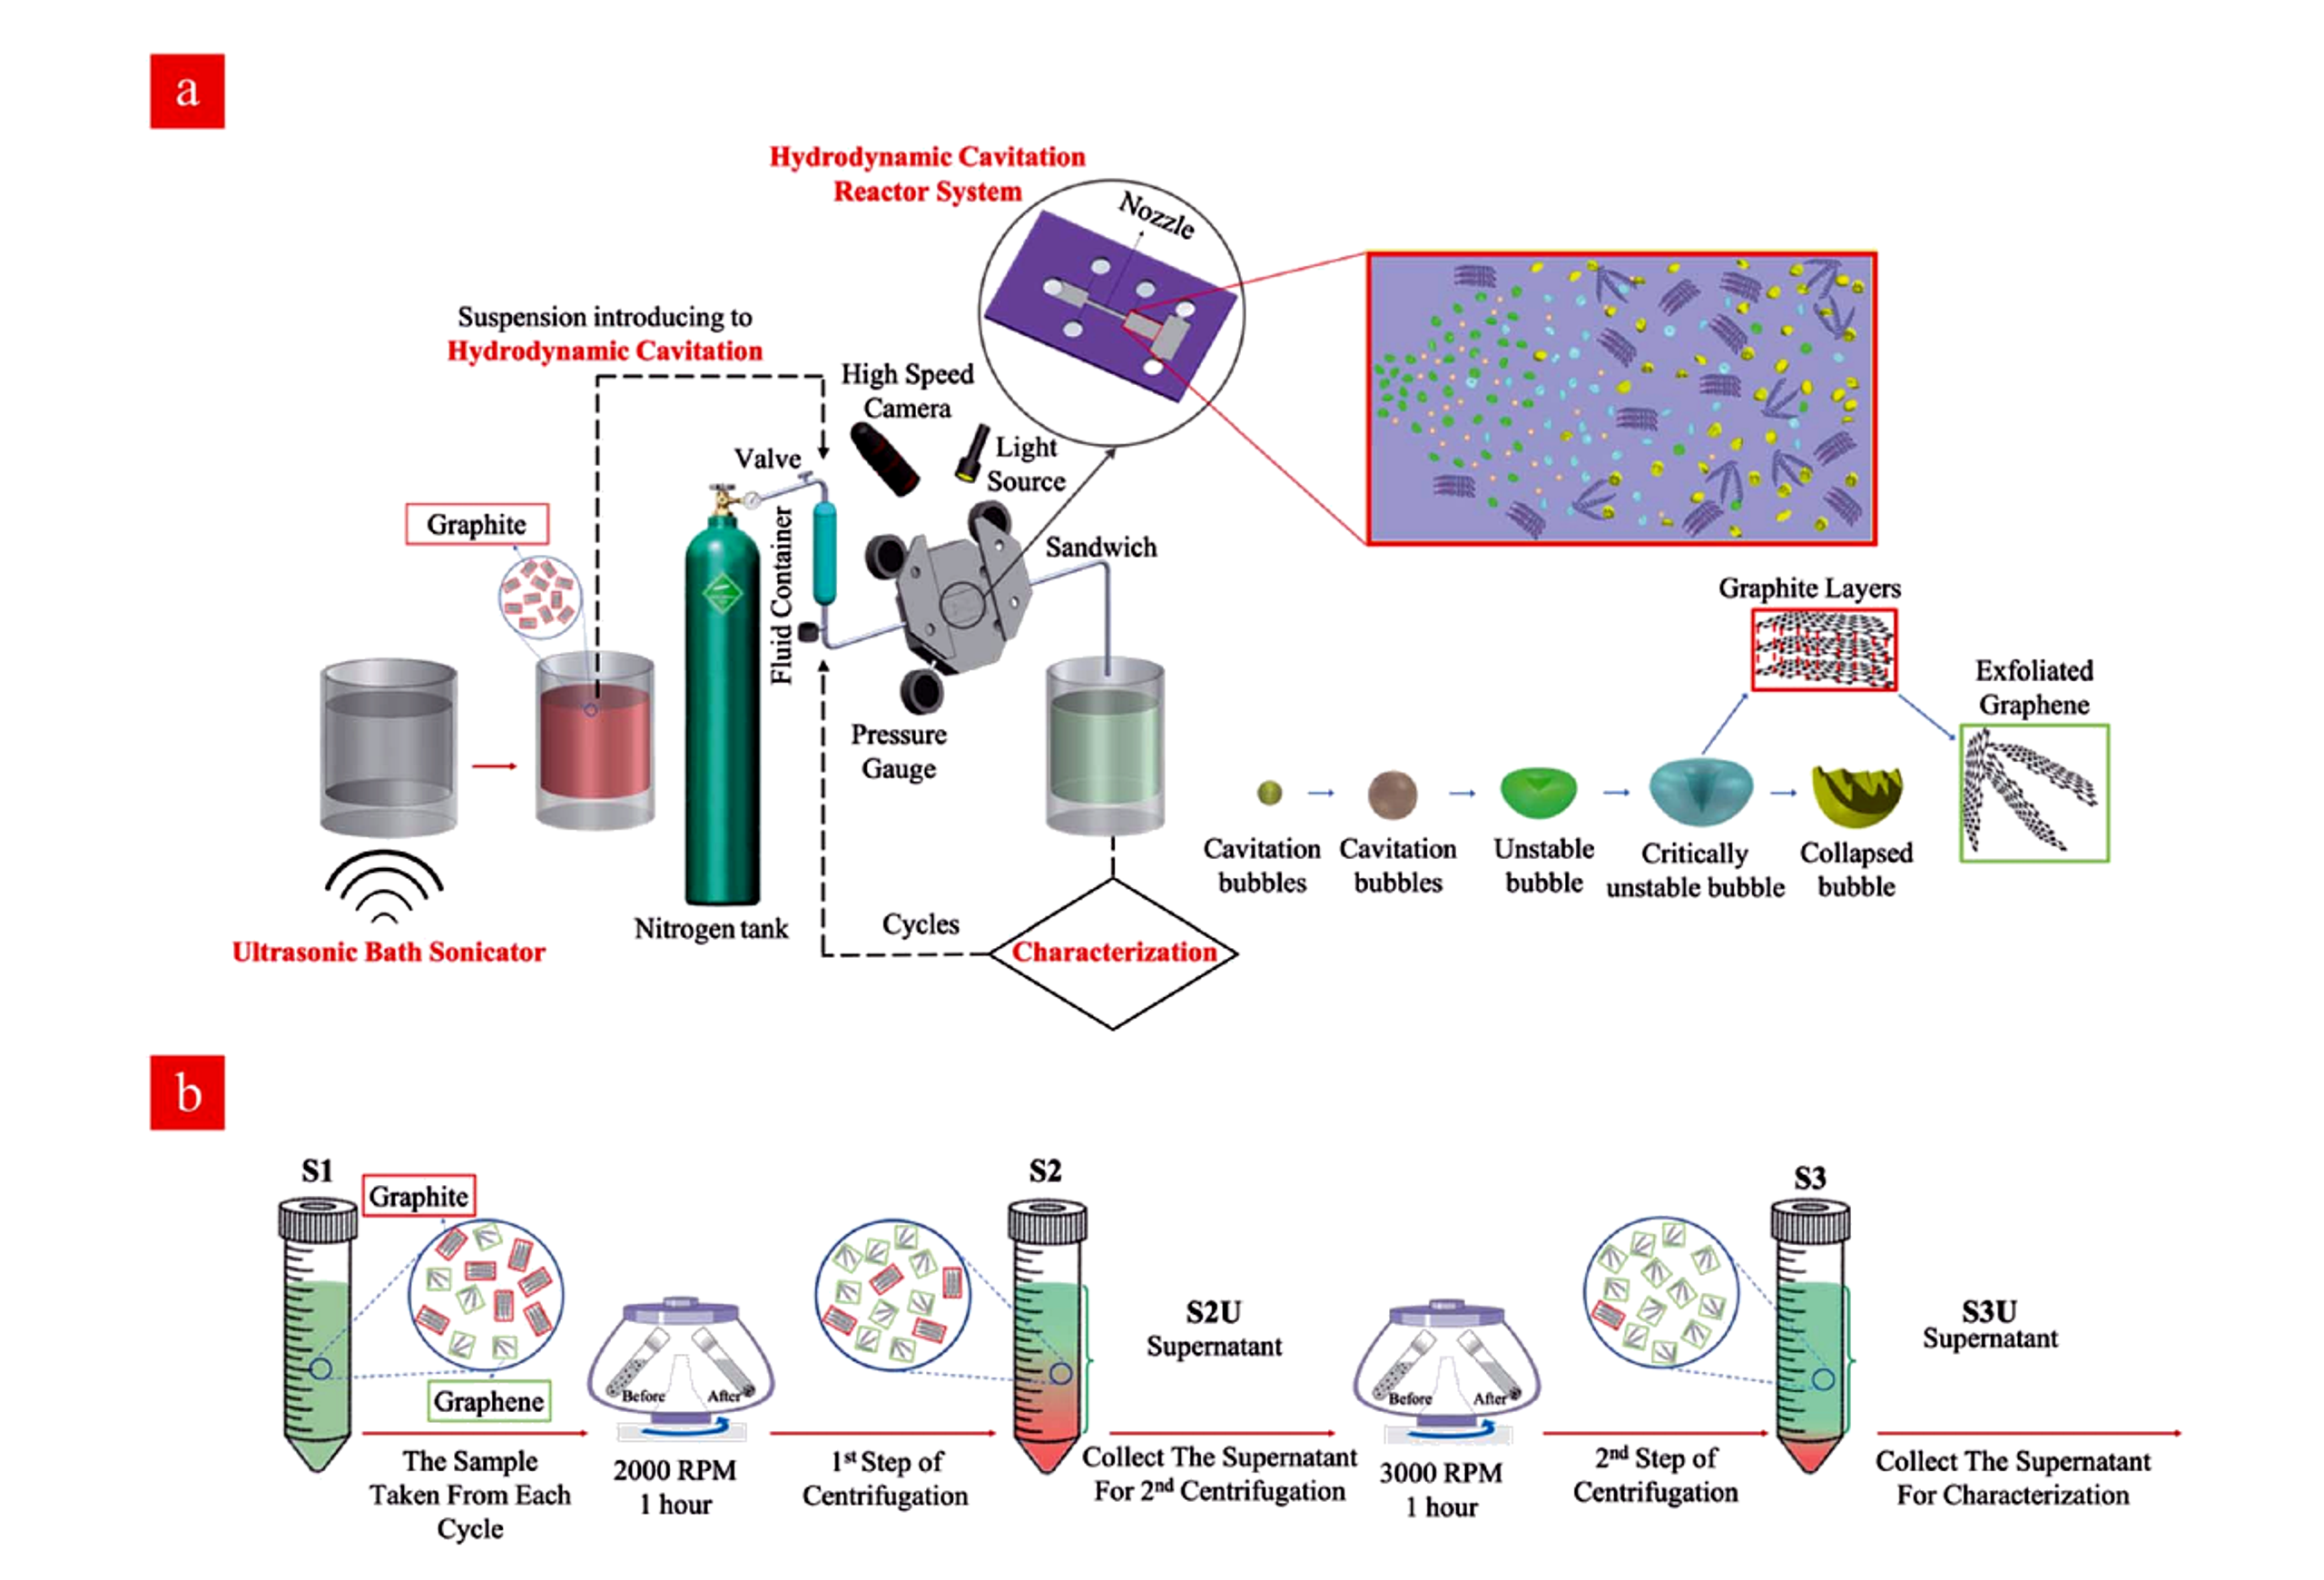
Figure 6.5. Hydrodynamic cavitation reactor system and sequential centrifugation workflow used for water based graphene nanosheet preparation [11].
AFM showed material approximately 1 nm thick after 80 cycles and a thickness range of 1.2 to 2.5 nm after 60 cycles, with lateral dimensions of approximately 1 to 5 micrometers. Excessive exposure generated holes about 100 to 600 nm across. Isolated product efficiencies after 20, 40, 60, and 80 cycles were reported as 8.4, 4.8, 4.0, and 4.4 percent, respectively. The decrease after the first sampling point was attributed partly to material trapping in the experimental flow path, illustrating that system holdup can distort an apparent yield trend [11].
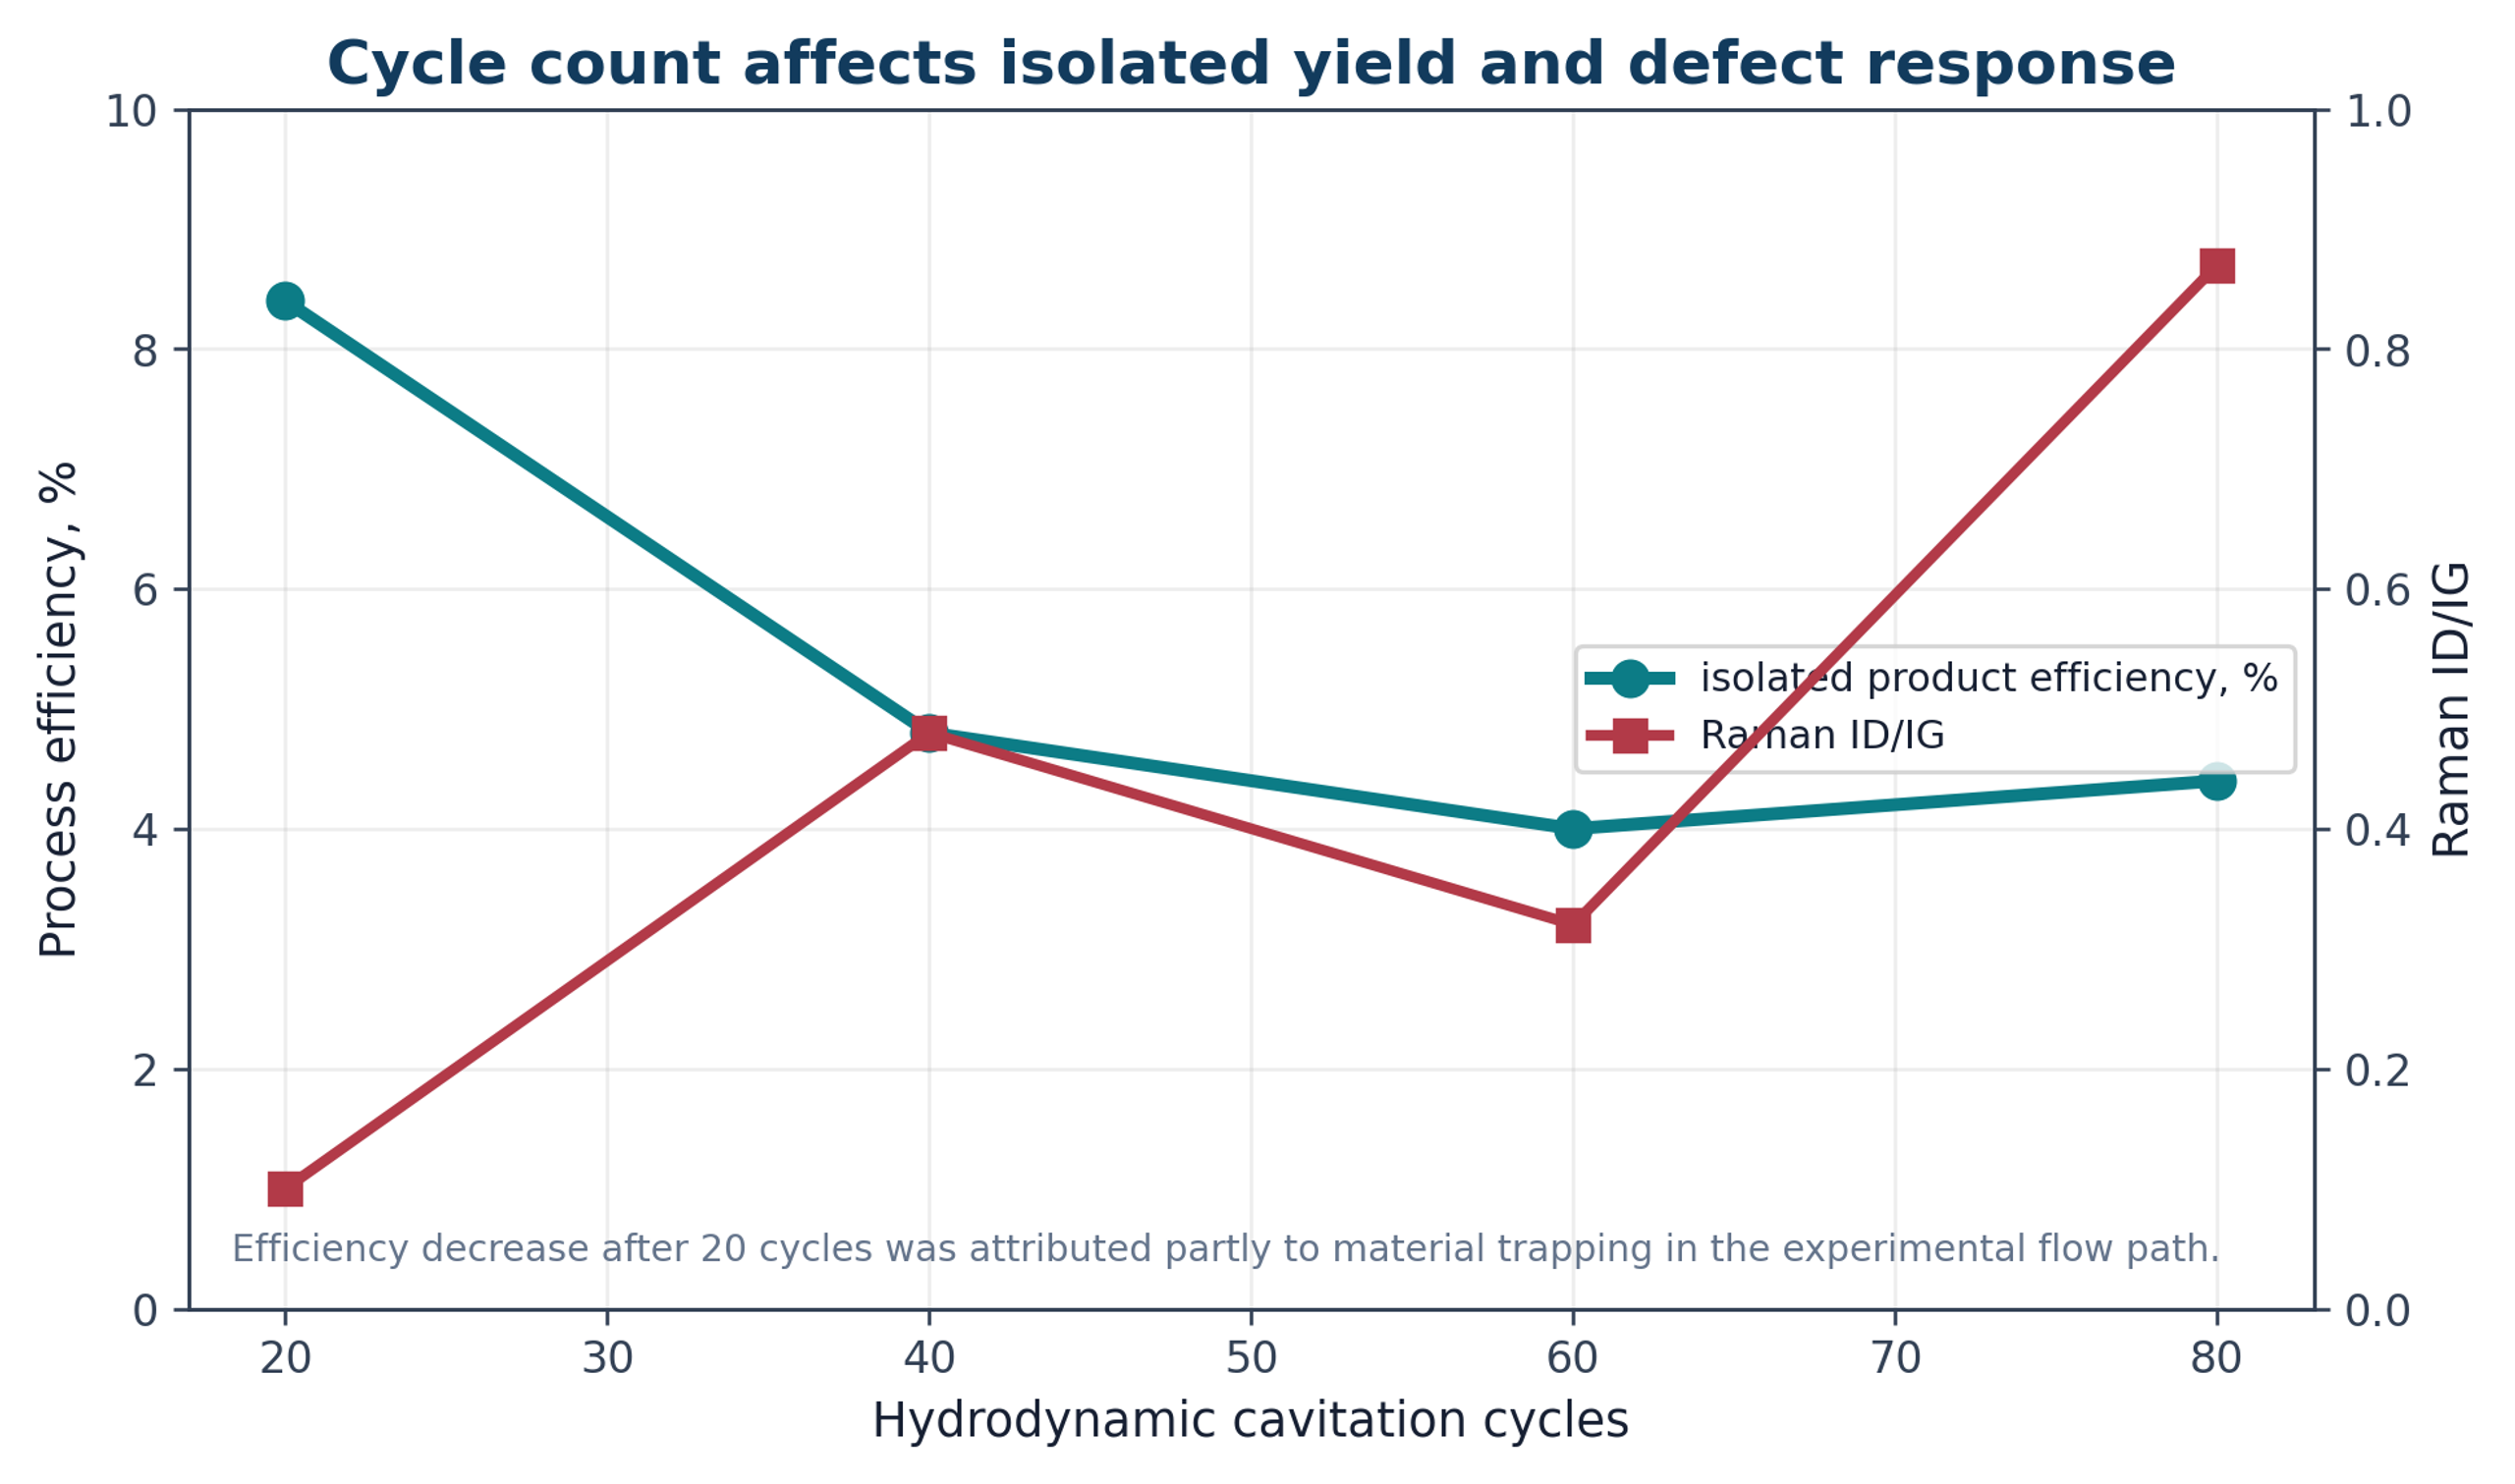
Figure 6.6. Effect of hydrodynamic cavitation cycle count on isolated product efficiency and Raman ID/IG in the microreactor study [11].
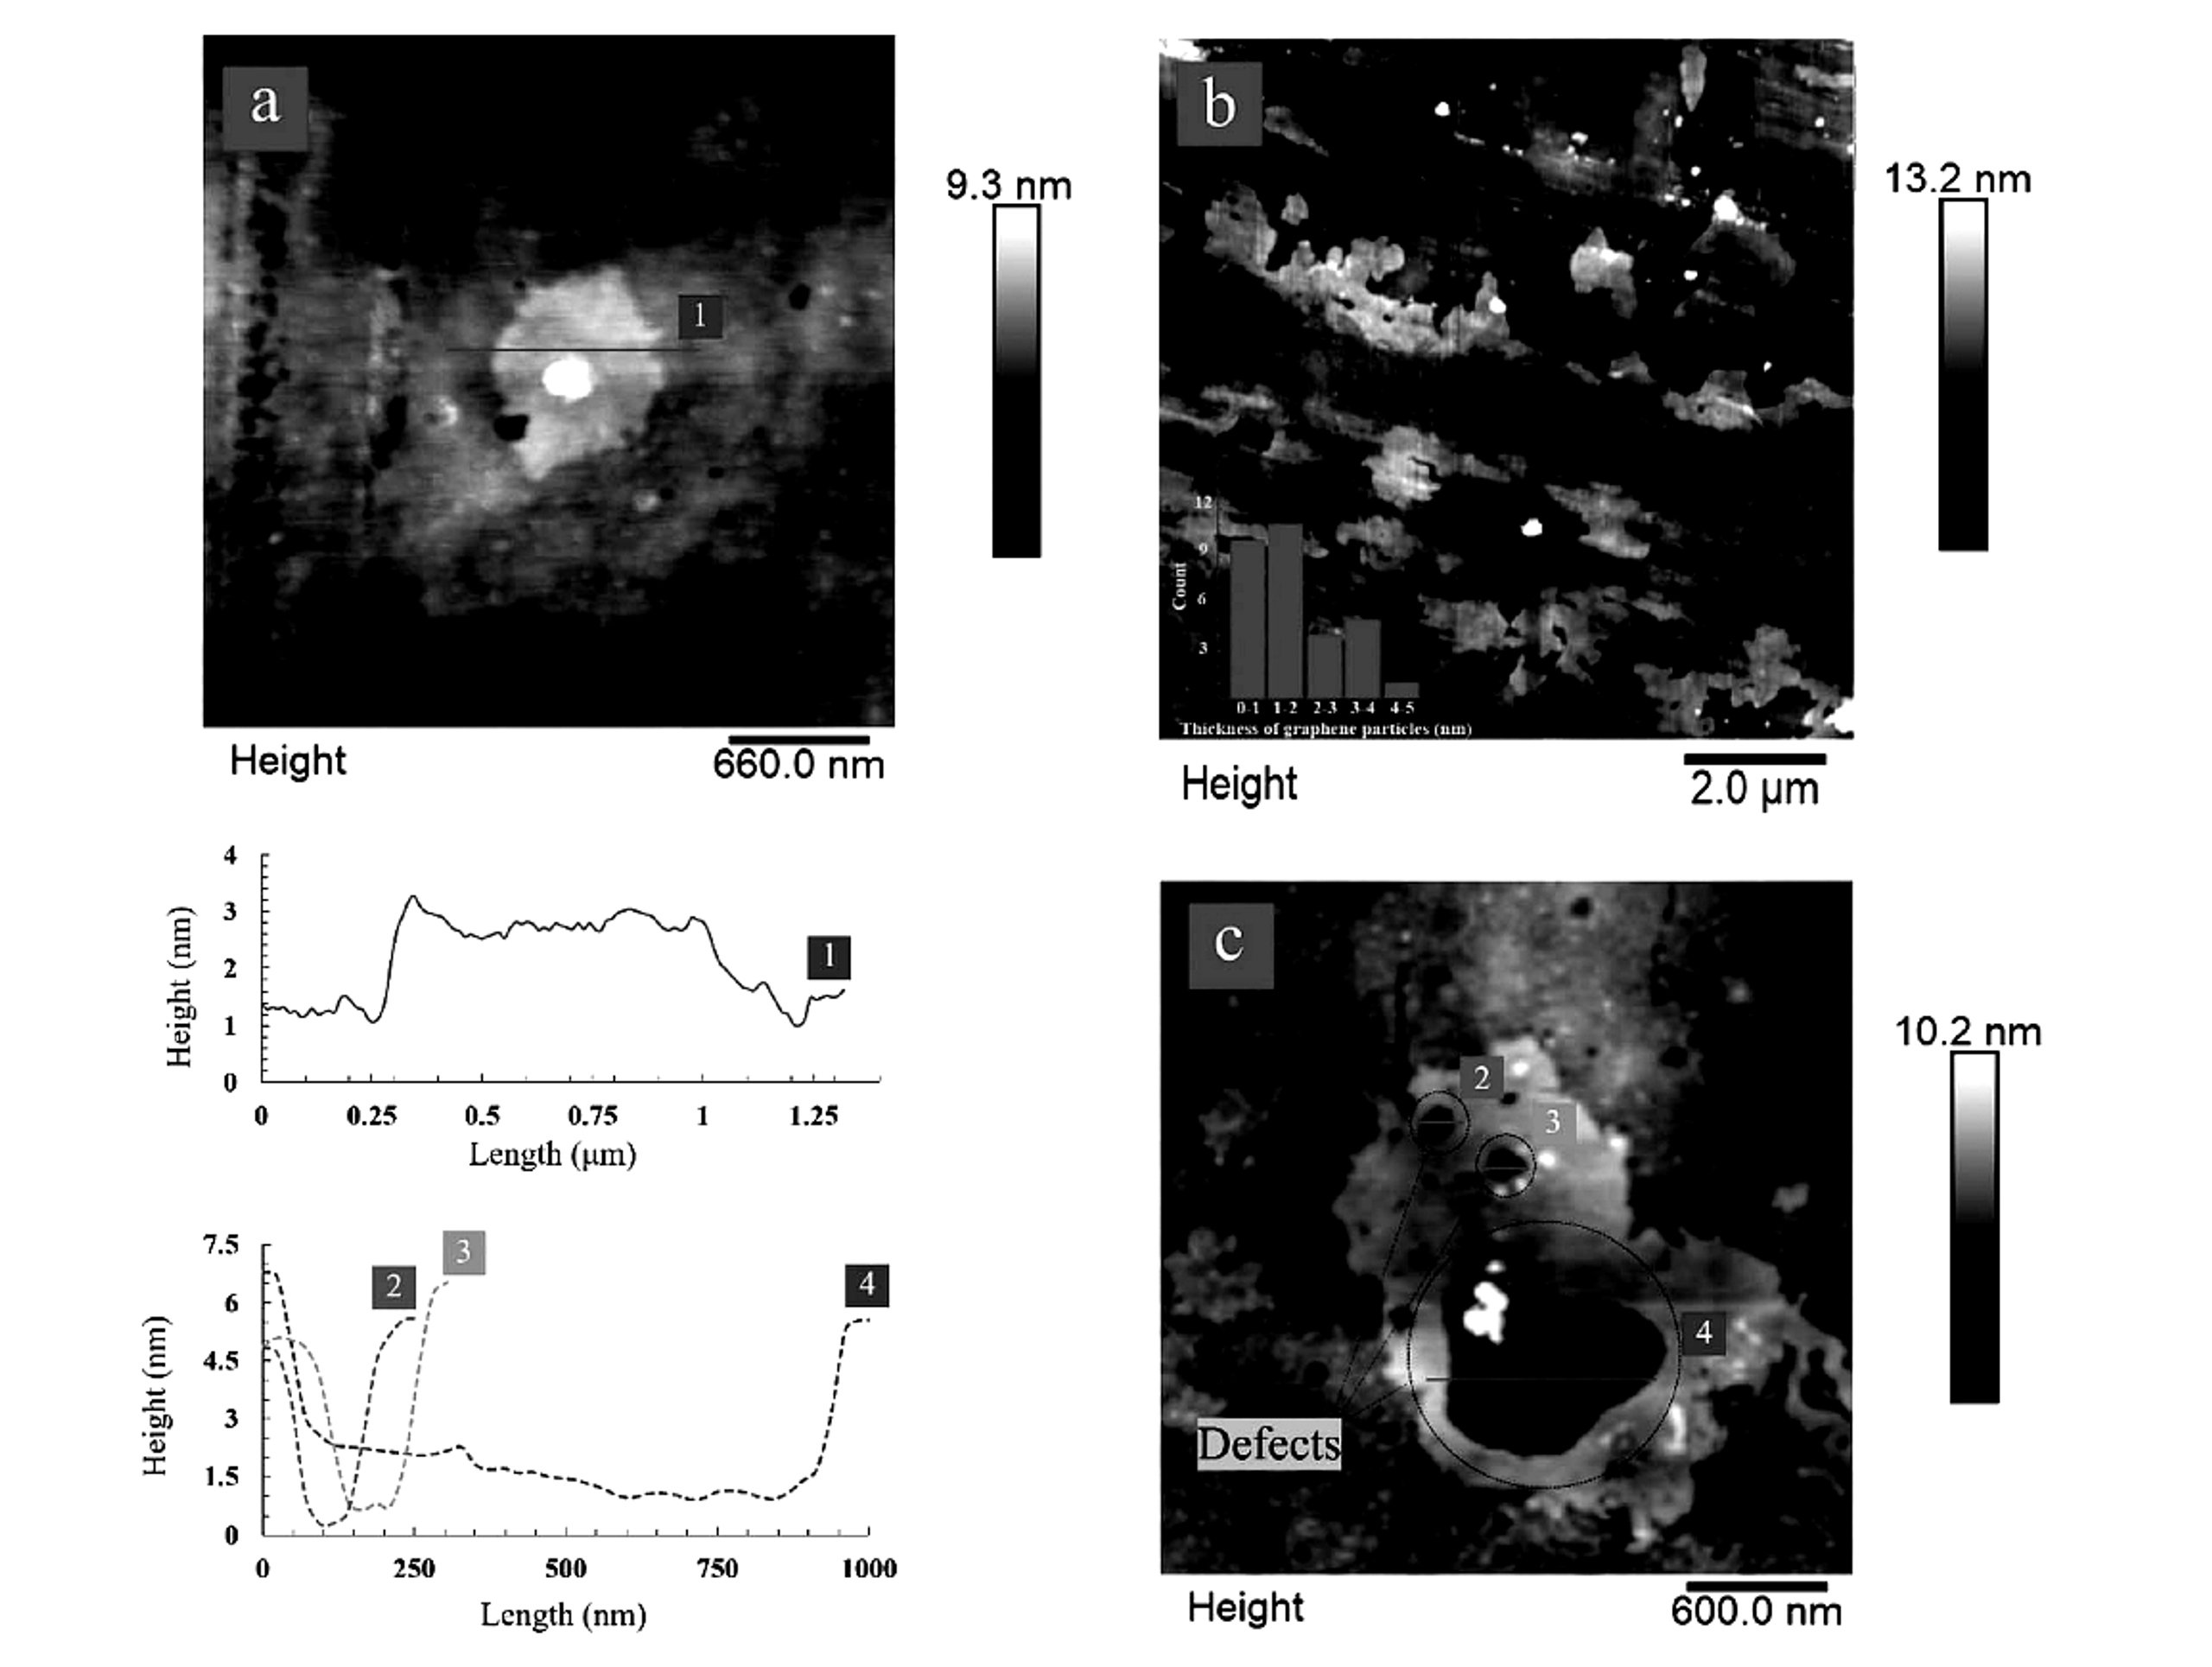
Figure 6.7. AFM images and height profiles showing thin graphene sheets and cavitation induced defects after repeated cycles [11].
6.4 Protein Stabilized Hydrodynamic Exfoliation
A hydrodynamic process using bovine serum albumin as an exfoliation and stabilization agent illustrates the competition among product quality indicators. At 3 h, I2D/IG was reported as 0.39 and ID/IG as 0.25. At 6 h, I2D/IG decreased to 0.35 while ID/IG increased to 0.29. The trend indicates continued evolution of layer structure together with increasing disorder. Protein stabilization may be useful for biological formulations, but the protein becomes part of the product and may be unacceptable for electronic, thermal, or high temperature applications [12].
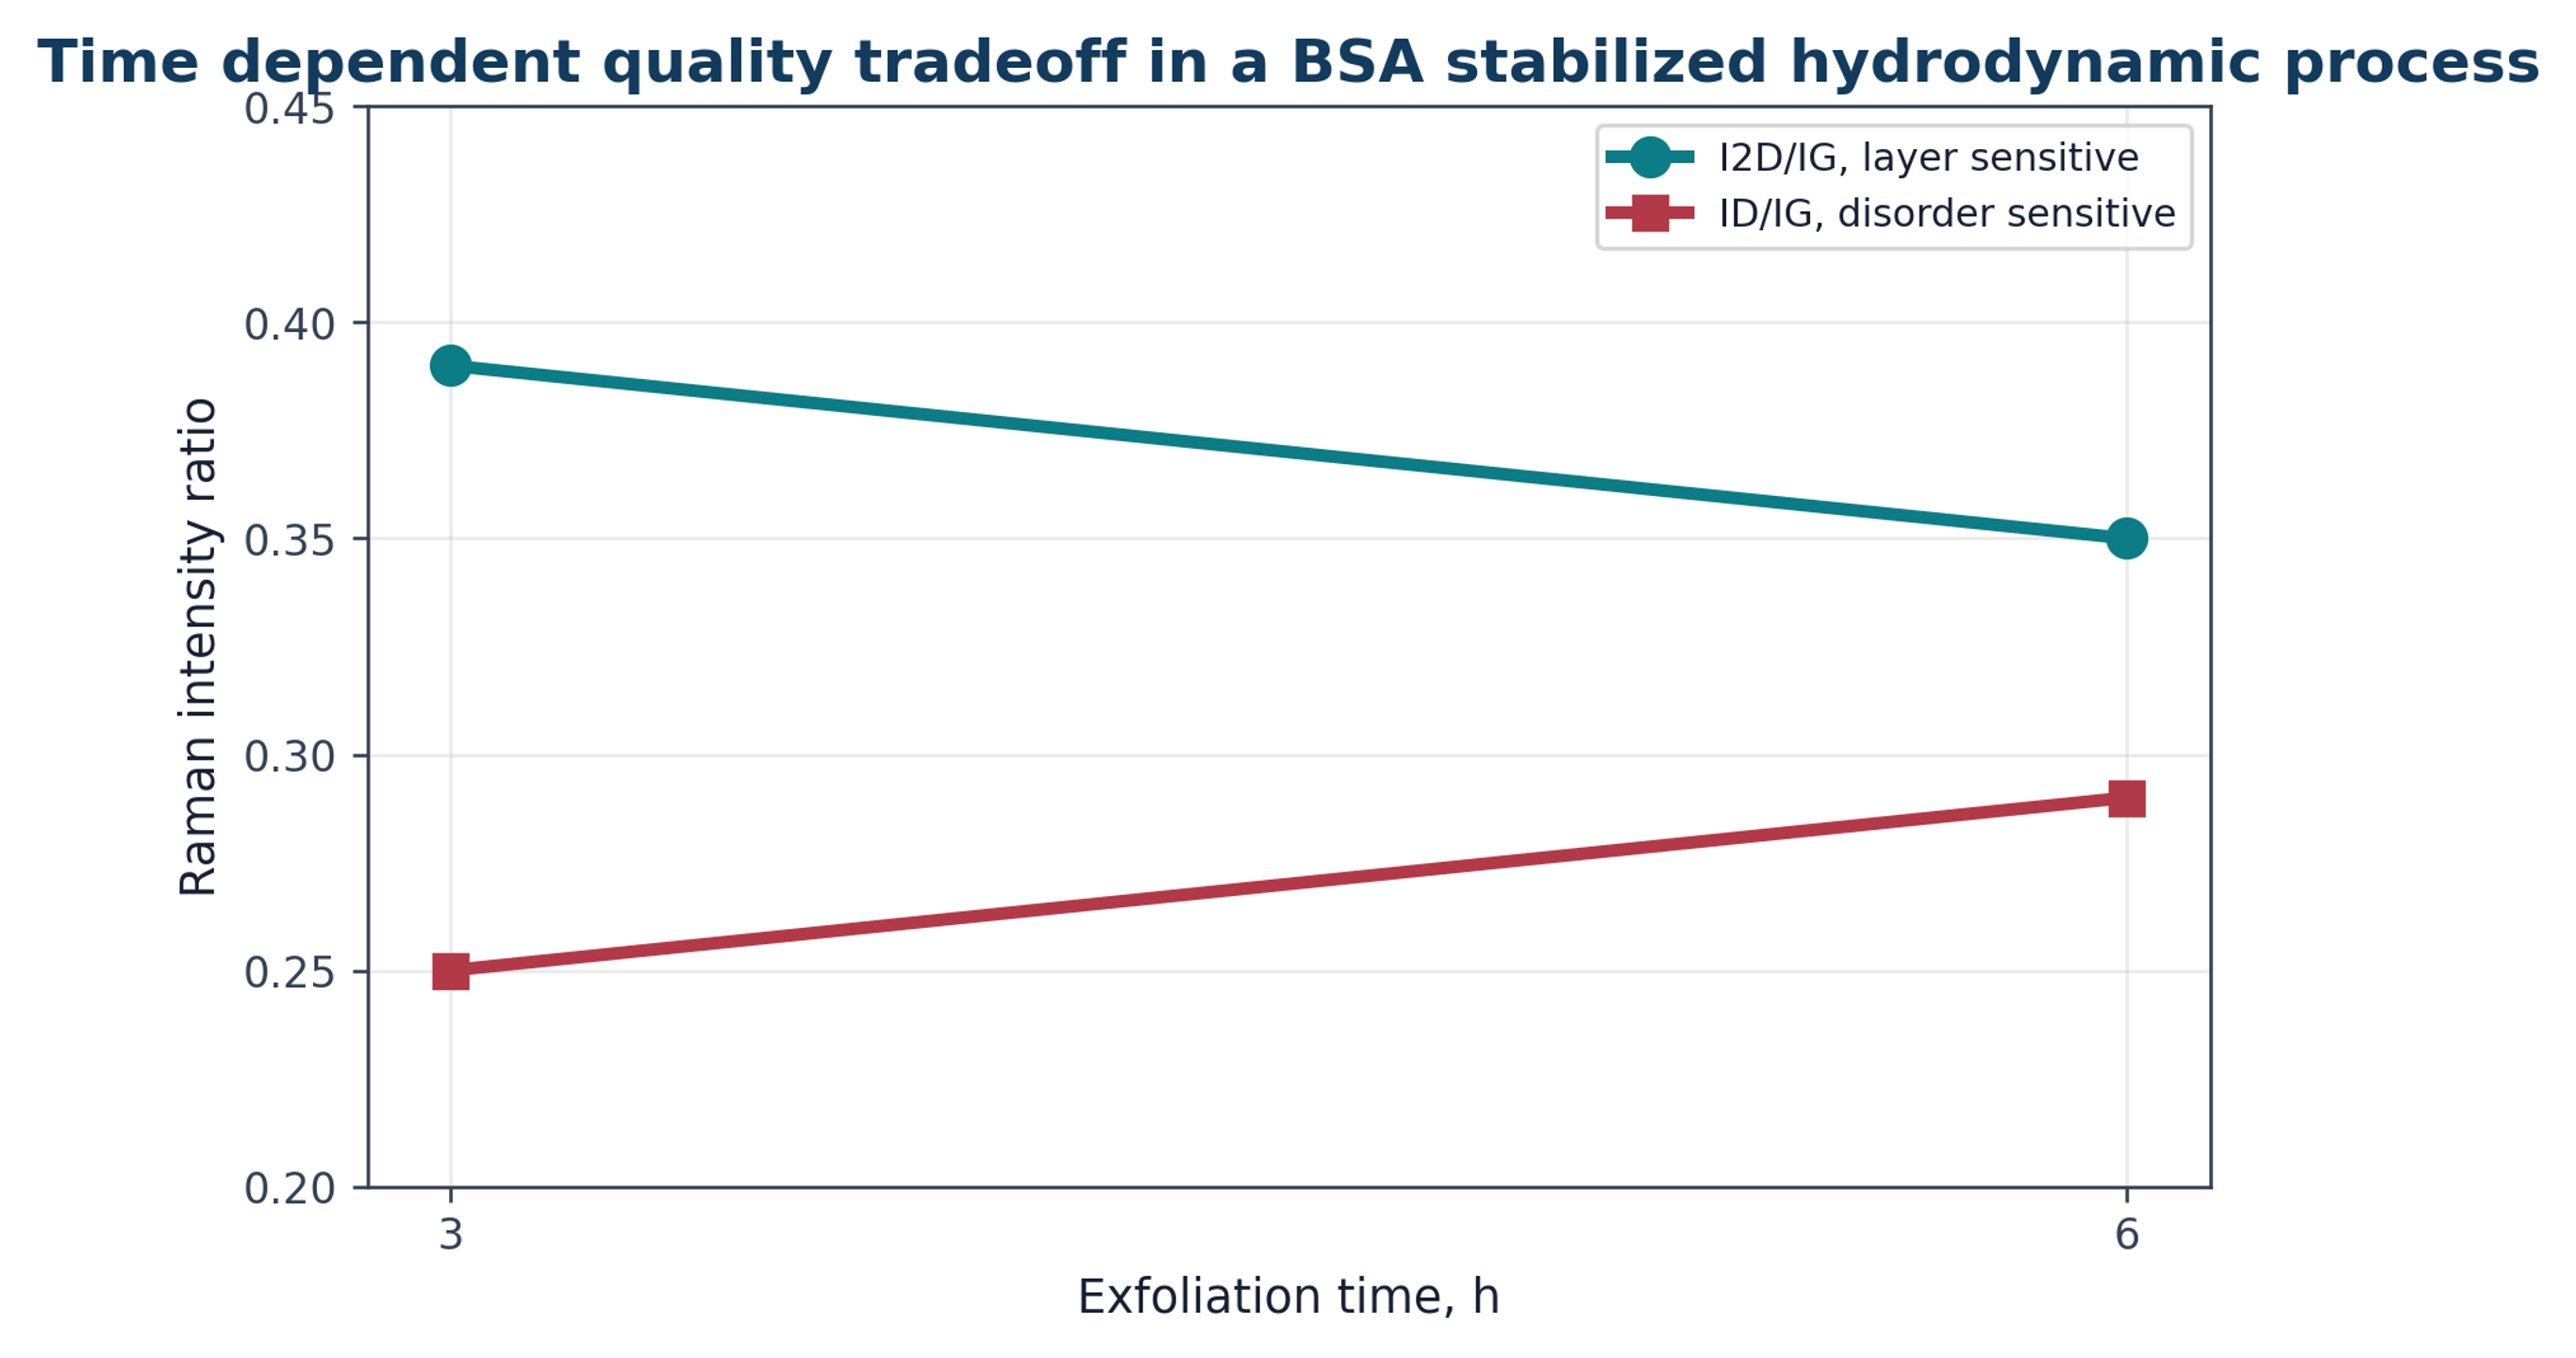
Figure 6.8. Time dependent Raman ratios in a bovine serum albumin stabilized hydrodynamic cavitation process [12].