
Technical publication
Back to publications
Reactors & equipment
Cavitation Driven Exfoliation of Graphene and Two Dimensional Materials
okozyuk.com
Published
Read complete publication for whole-document Find and printing. Browser Find and native printing on this reader include only loaded content.
12 Characterization and Quality Assurance
No single analytical method can establish that an industrial batch satisfies a graphene specification. Raman spectroscopy is rapid but samples a limited area and can confound edge related D band intensity with basal plane disorder. AFM measures thickness directly but has low throughput and is sensitive to substrate artifacts. TEM provides lattice and layer information but samples a very small mass. SEM covers a larger field but does not directly resolve monolayer thickness. XPS measures surface chemistry, ICP MS identifies trace metals, and UV Vis can estimate dispersed concentration only when the extinction coefficient and scattering conditions are appropriate. A defensible release specification therefore combines complementary methods [2,4,5,7-13].
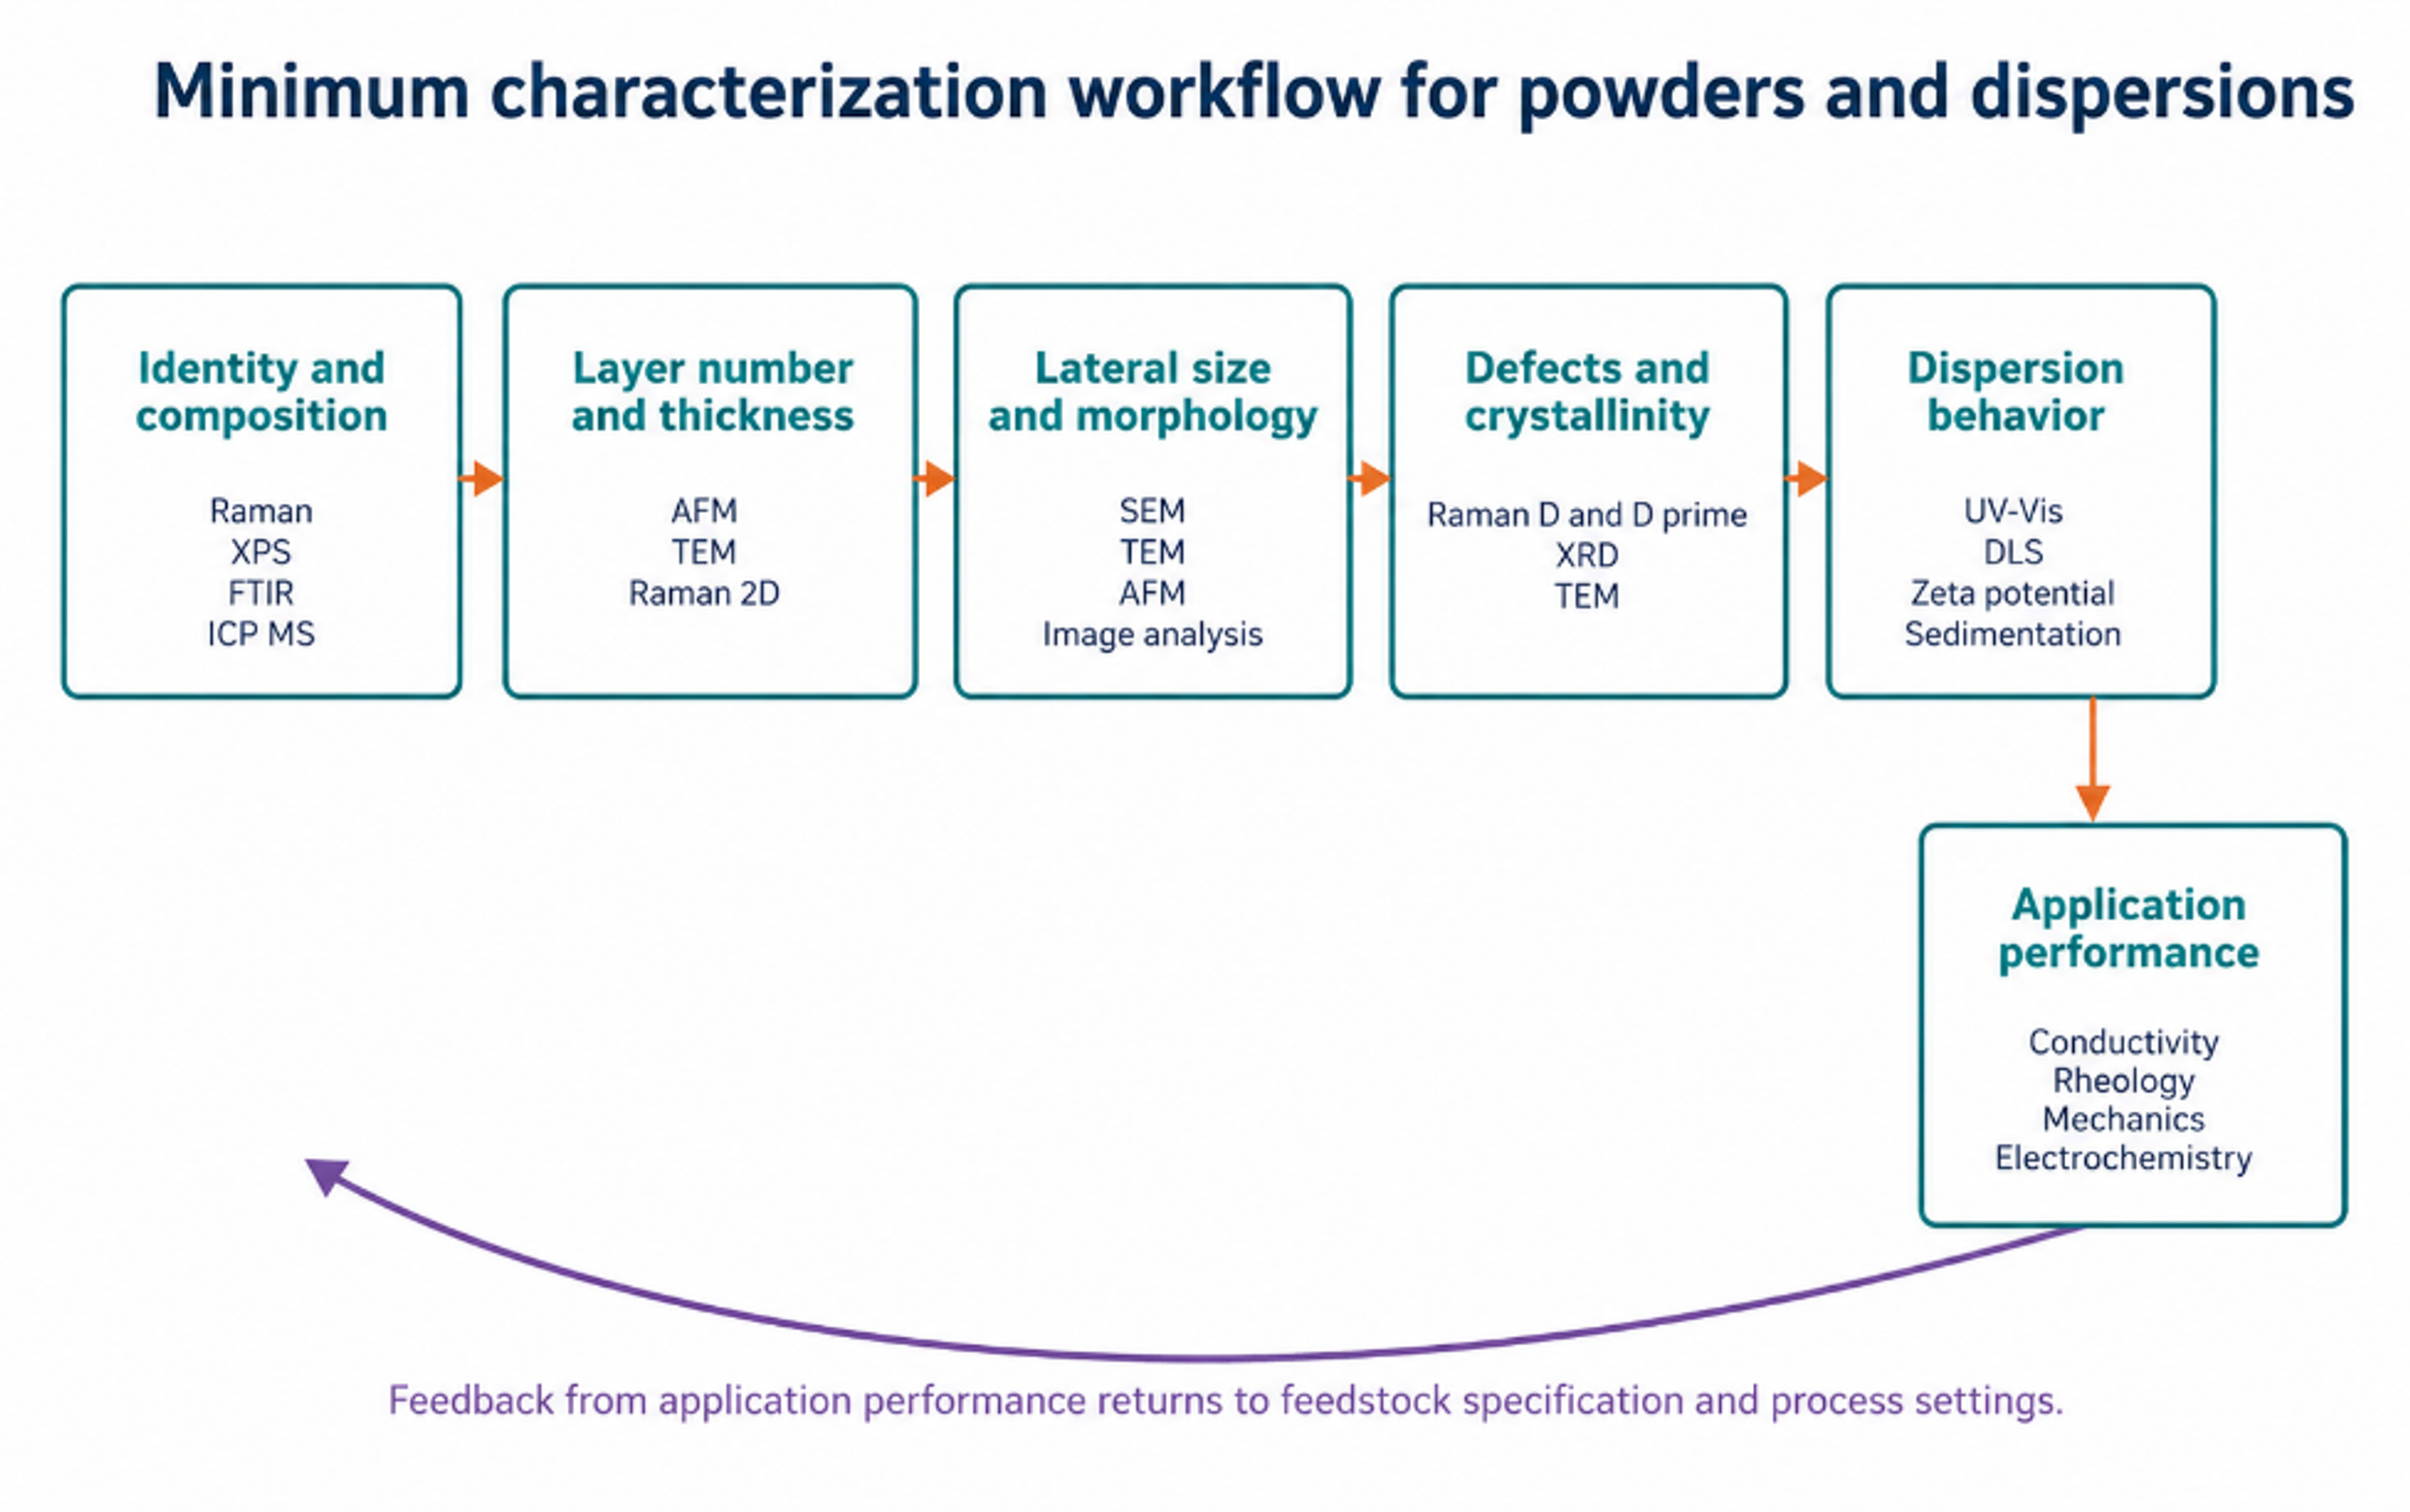
Figure 12.1. Minimum characterization workflow connecting identity, structure, defects, dispersion behavior, and application performance [37].
12.1 Raman Spectroscopy
The principal Raman features are the D band near 1350 cm⁻¹, the G band near 1580 cm⁻¹, the D prime band near 1620 cm⁻¹, and the 2D band near 2700 cm⁻¹. Exact positions depend on excitation wavelength, strain, doping, temperature, and material condition. The D band is activated by disorder and edges. The 2D band shape and intensity provide layer information, but the relationship is not universal for all flake sizes and substrates. Raman mapping across many locations is more representative than a single selected spectrum [2].
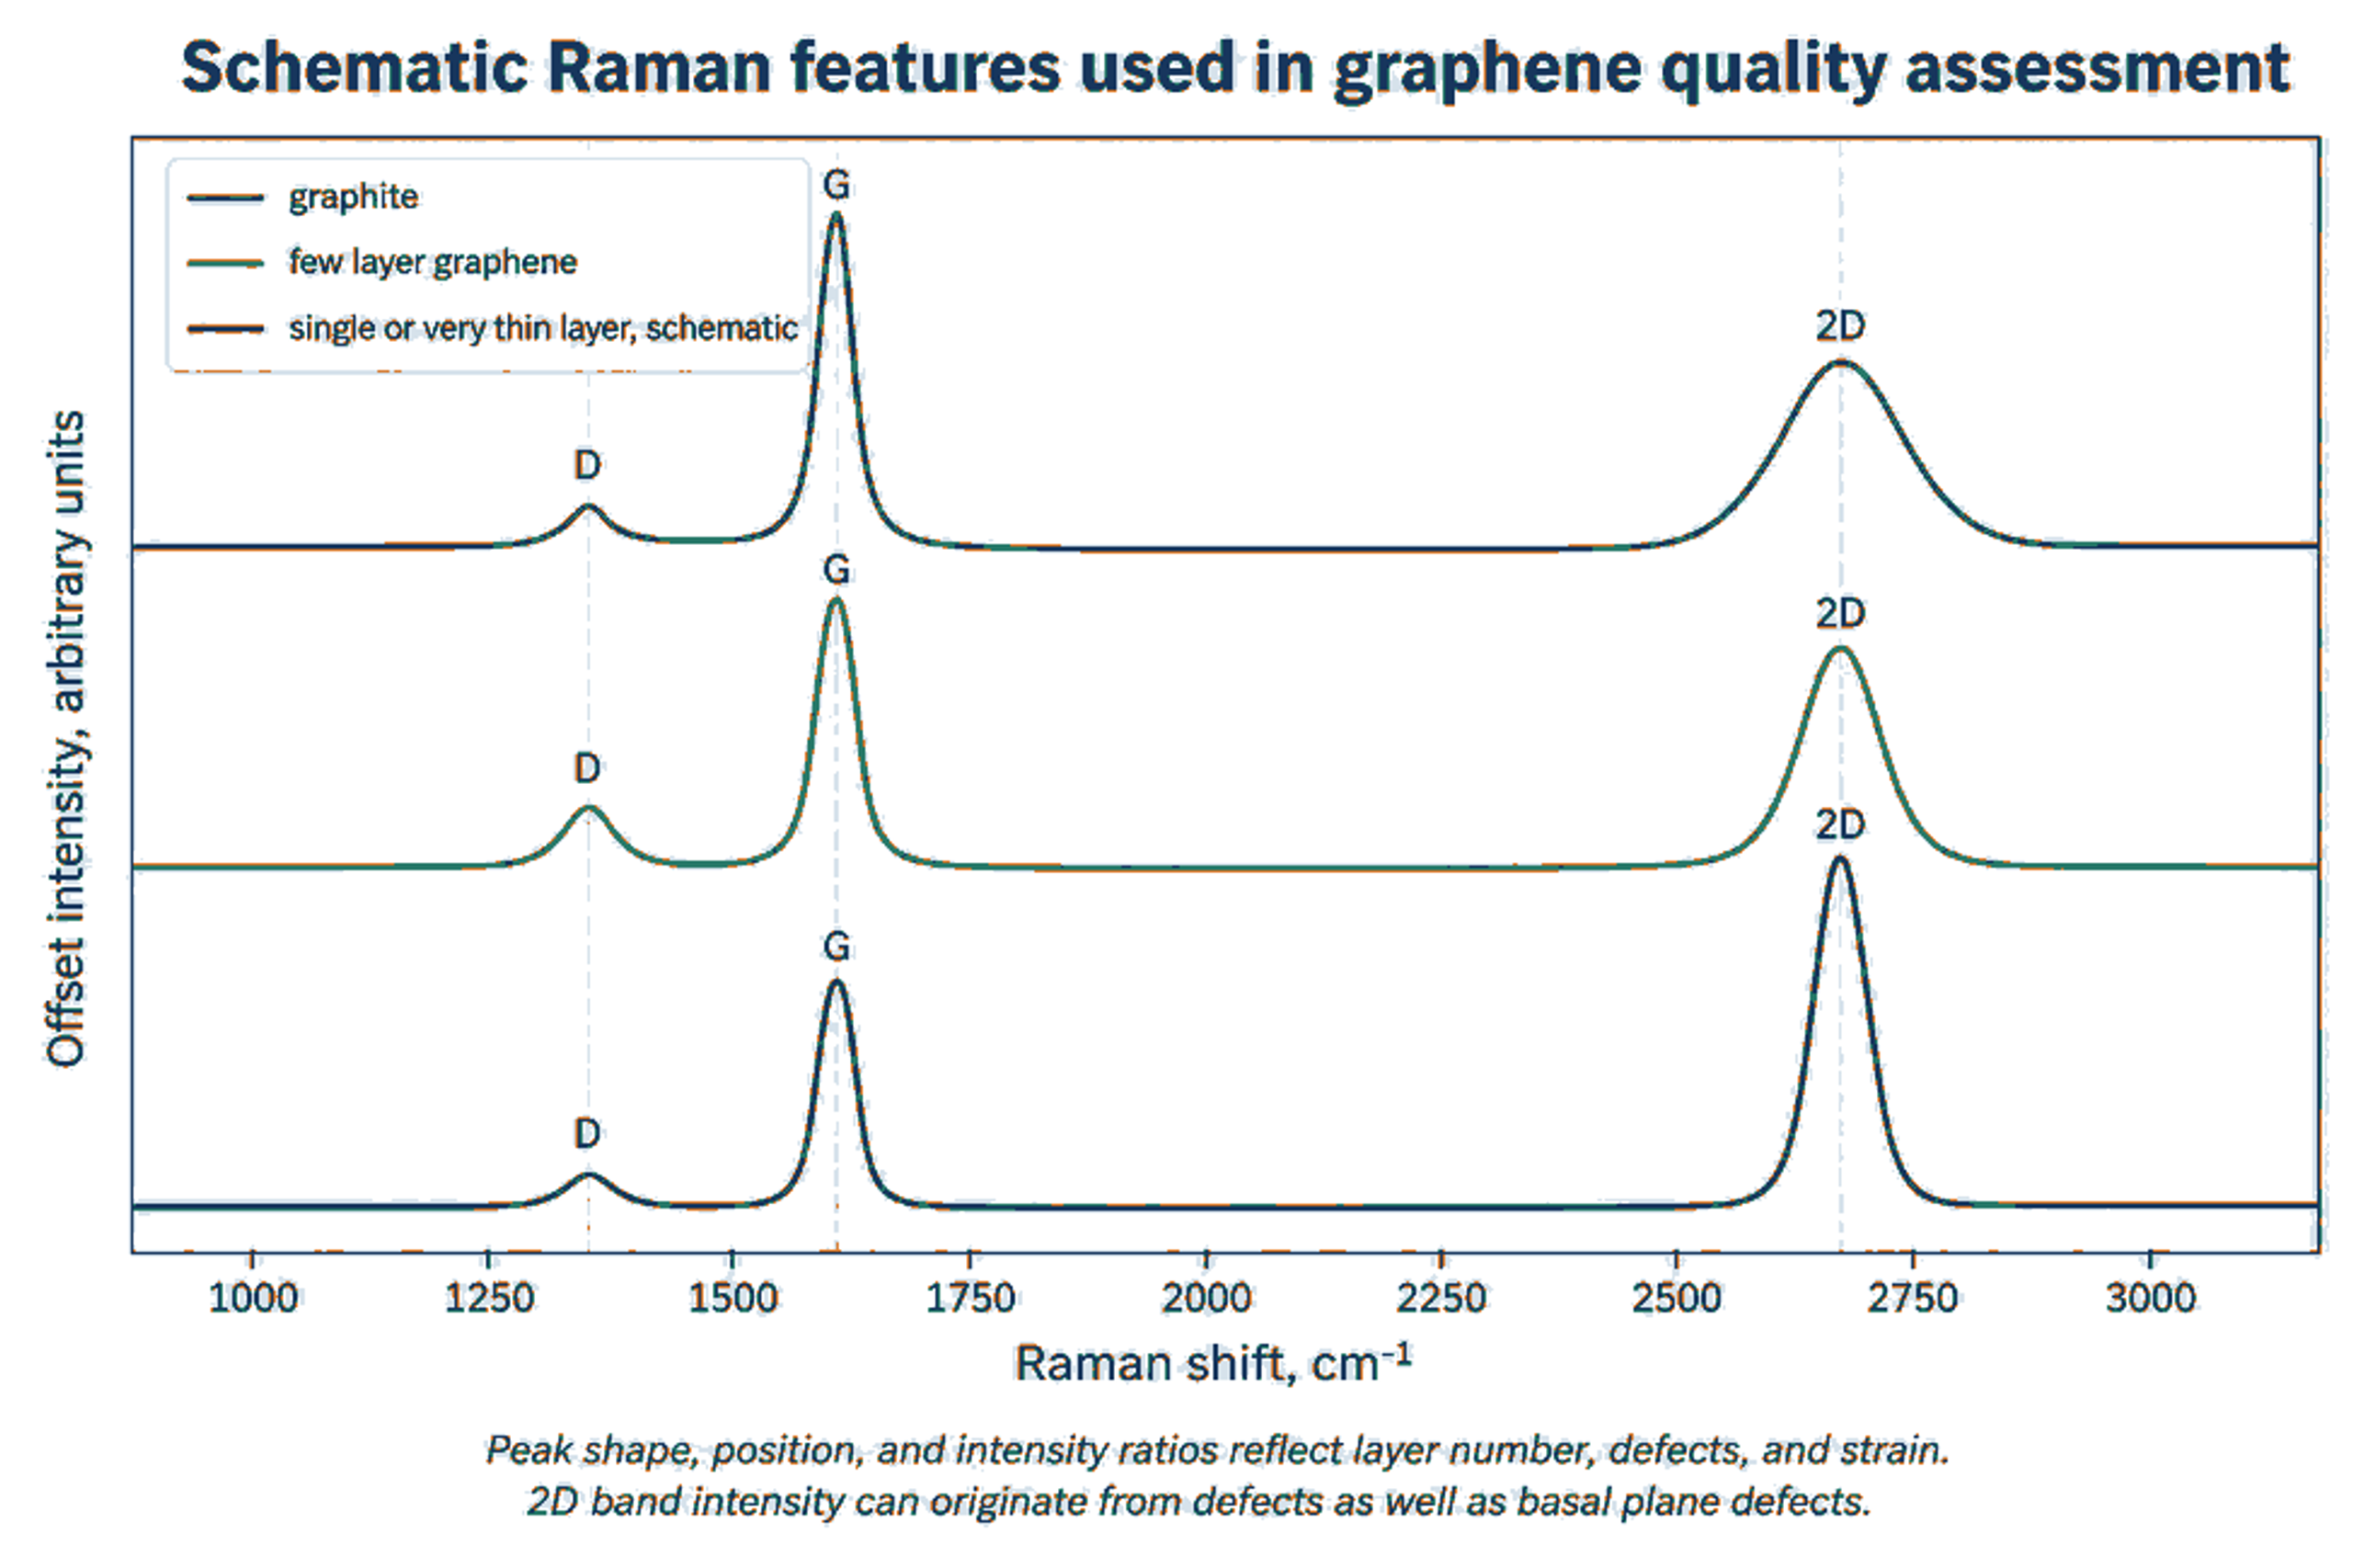
Figure 12.2. Schematic Raman response for graphite, few layer graphene, and very thin graphene. The curves are educational and do not represent one measured batch [2].
Equation (12.1) generalized Tuinstra-Koenig relation used in Raman spectroscopy to determine the in-plane crystallite size () of nanographite, graphene, and other carbon-based materials:
La is an empirical in plane crystallite or defect spacing estimate in nanometers for a specified defect regime, λL is laser wavelength in nanometers, and ID/IG is the D to G intensity ratio. The equation must not be applied outside its calibration regime.
An increase in ID/IG during cavitation does not by itself prove increasing basal plane damage. If lateral size becomes smaller than the laser spot, a larger fraction of edges contributes to the D band. G band broadening, D prime behavior, peak position, mapping statistics, AFM size, and TEM observations should be considered together. The jet cavitation study attributed much of its D band increase to edge generation because strong G band broadening was not observed [9].
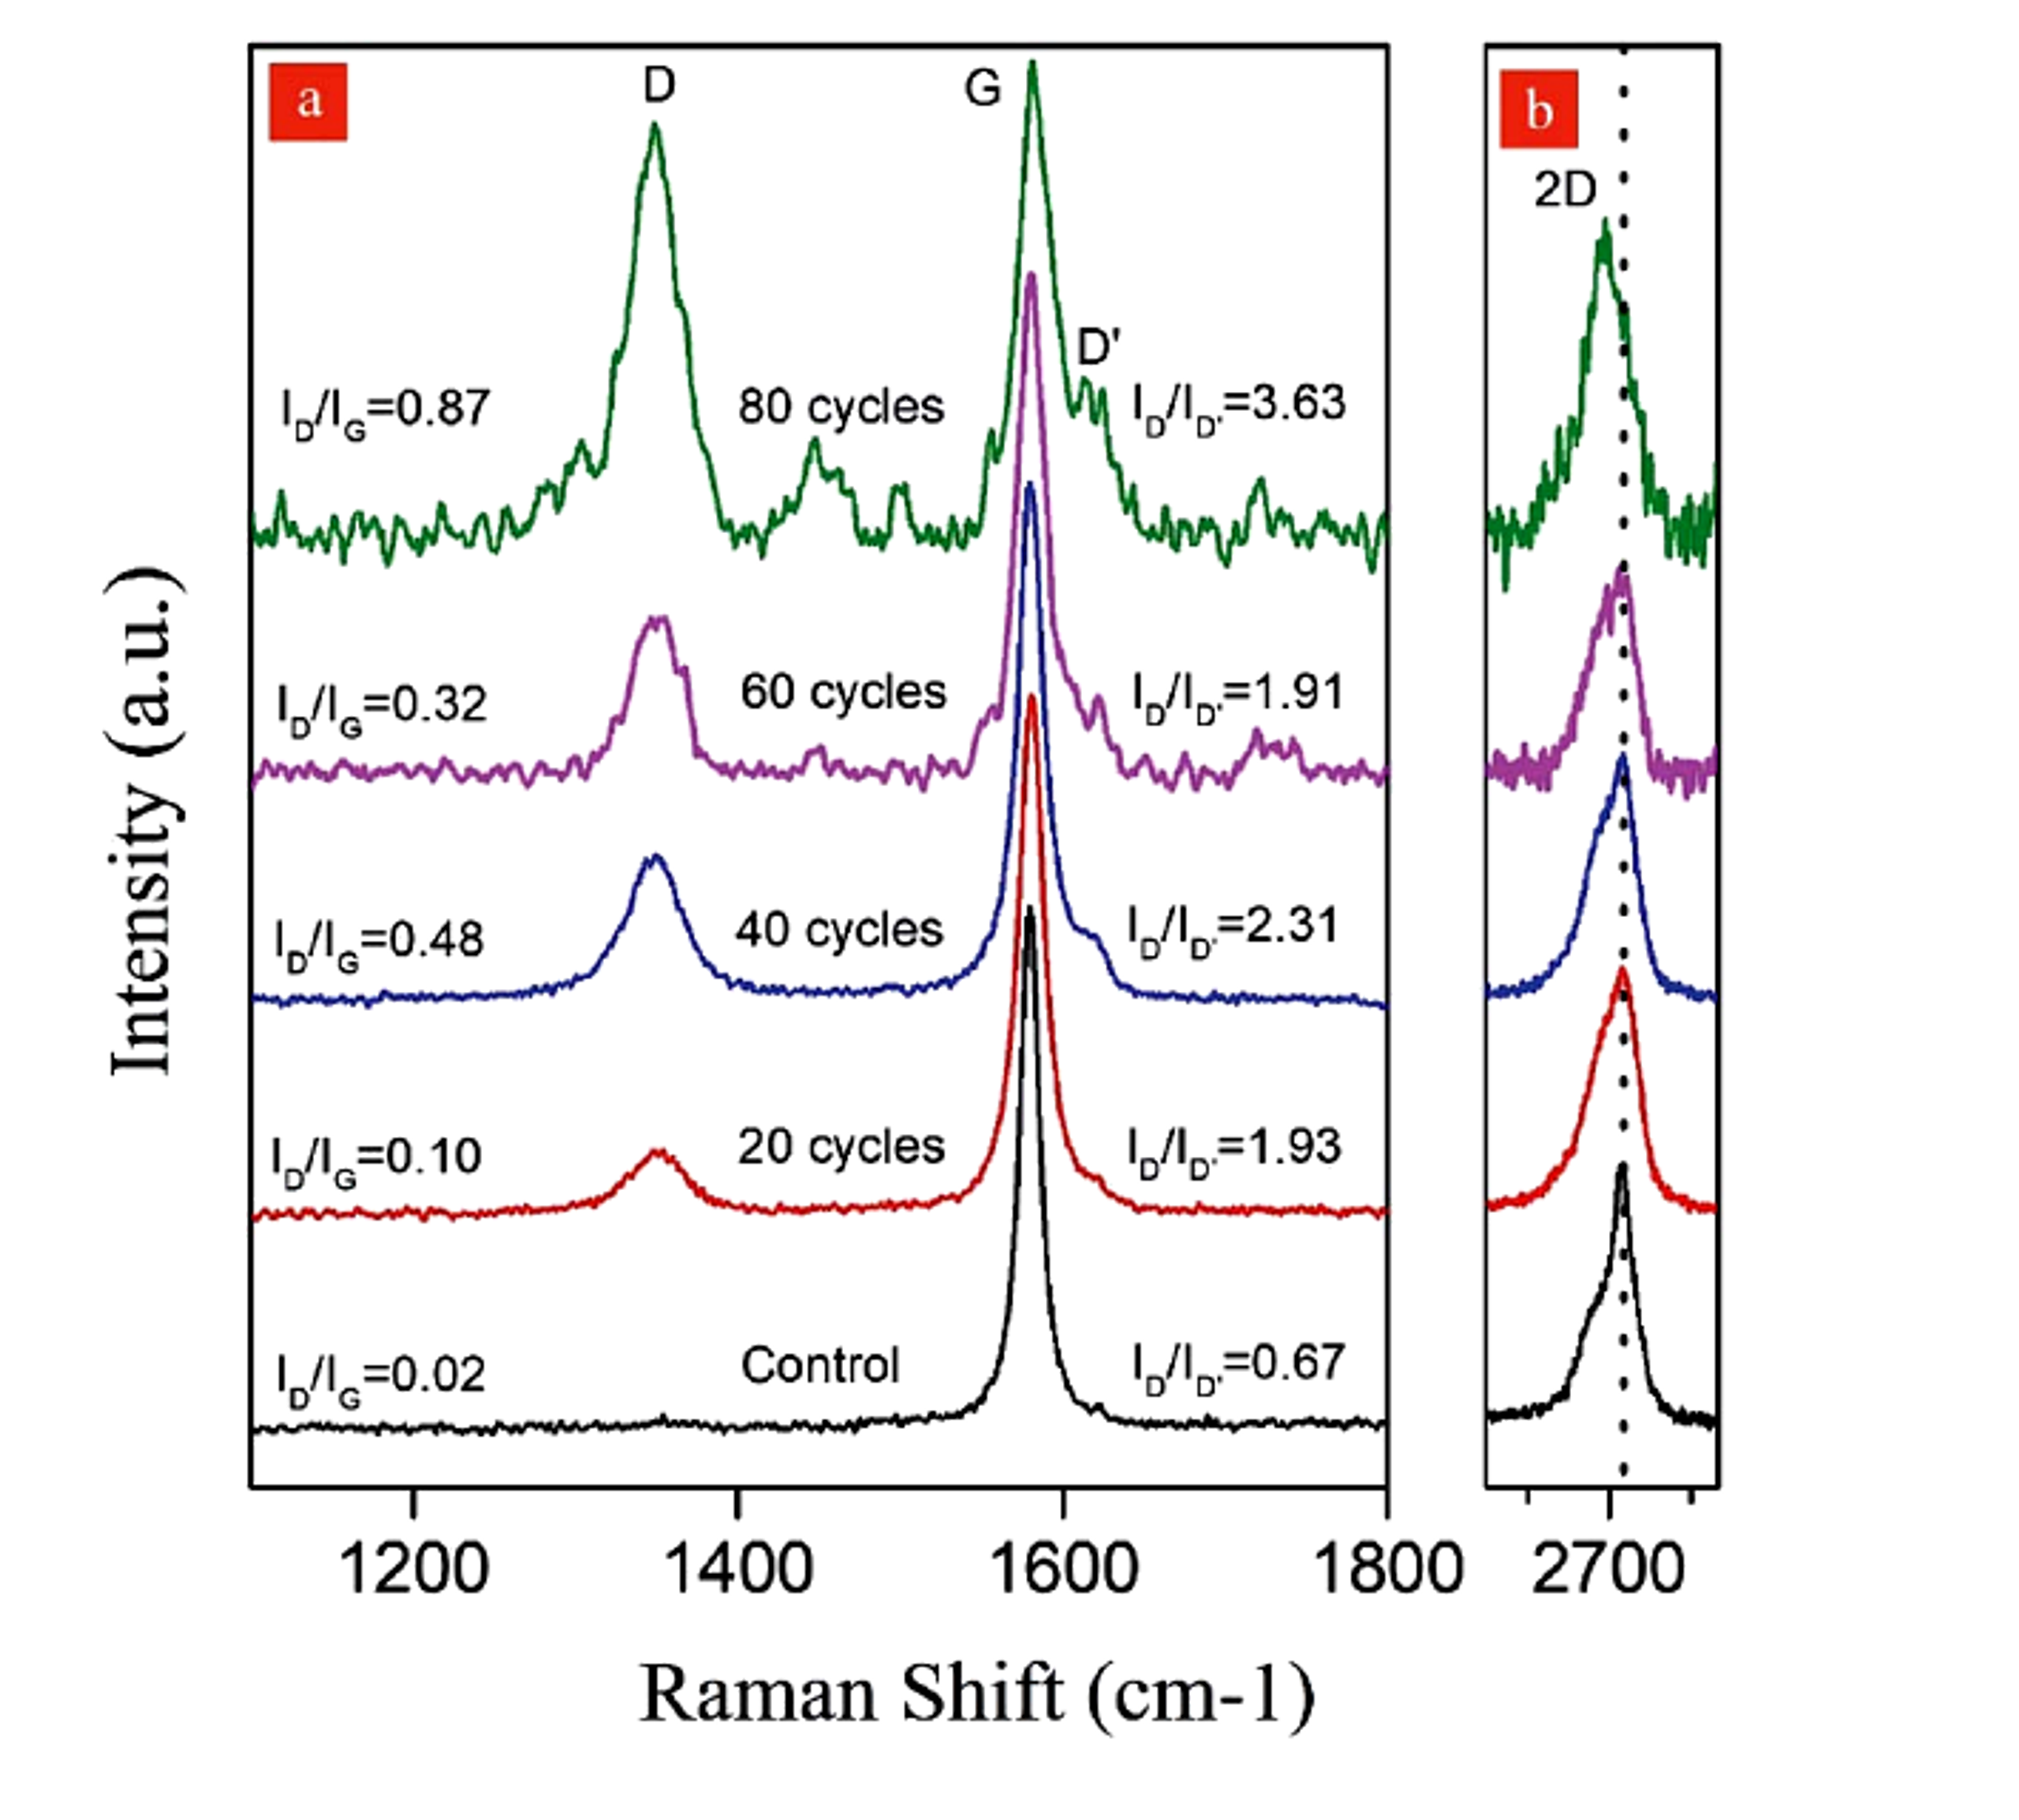
Figure 12.3. Raman spectra after 20, 40, 60, and 80 hydrodynamic cavitation cycles, showing increasing D band response and a 2D band shift after 80 cycles [11].
12.2 Microscopy and Thickness Statistics
AFM thickness measured for a monolayer on a substrate is often greater than the nominal carbon layer spacing because of adsorbed water, residual stabilizer, trapped solvent, substrate interactions, and instrument calibration. A layer classification rule should therefore be validated with reference material and supported by Raman or TEM. Reported statistics should include the number of flakes measured, sampling locations, threshold definitions, and both number weighted and mass weighted distributions. A small number of selected monolayer images cannot represent batch yield.
N is an approximate layer count, is AFM measured thickness after accounting for substrate and adsorbate offset, and h0 is the calibrated apparent thickness per layer. The calibration should be established for the specific substrate and sample preparation. The equivalent aspect ratio, , is defined by the projected flake area, , and flake thickness, :
Using an area equivalent diameter avoids selecting an arbitrary length for irregular flakes.
12.3 Concentration and Dispersion Stability
Equation (12.4) is the Beer-Lambert relation used to connect optical attenuation with the concentration of a dispersed material. In fluid analysis and nanoparticle suspensions, the relation is widely used for spectrophotometric concentration measurements when the extinction coefficient and scattering conditions are validated for the specific formulation.
is absorbance at wavelength λ, is the extinction coefficient for the specific material and dispersion, C is concentration, and l is optical path length.
Equation (12.5) defines the normalized conconcentration ratio:
S(t) is a normalized dispersion stability index based on dispersed concentration at time t relative to the initial concentration . The sampling height and method must be fixed.
Extinction coefficients vary with flake size, thickness, stabilizer, scattering, and instrument geometry. A coefficient obtained from another formulation should not be applied without validation by gravimetry or an independent mass balance. Stability should be measured at the intended storage concentration and temperature because dilution can change adsorption equilibrium and produce a misleading result.
12.4 Chemical Purity and Trace Contamination
ISO/TS 23359:2025 identifies XPS, TGA, ICP MS, and FTIR among the methods used for chemical characterization of powders and liquid dispersions [5]. XPS provides surface elemental composition and oxygen bonding information. TGA quantifies volatile material, stabilizer content, and oxidation behavior. ICP MS detects trace metals from feedstock and equipment, while FTIR identifies major functional groups and residual organics. These measurements should be linked to application limits rather than reported only as descriptive spectra.
Table 12.1. Recommended quality control metrics for cavitation exfoliation products.
| Attribute | Primary methods | Report as | Why it matters |
|---|---|---|---|
| Layer number or thickness | AFM, TEM, Raman, XRD for bulk context. | Distribution, median, percent below defined thresholds. | Controls electronic, optical, barrier, and surface behavior. |
| Lateral size | SEM, TEM, AFM, validated image analysis, DLS as supporting method. | Number and area weighted distributions. | Controls aspect ratio, percolation, printability, reinforcement, and filtration. |
| Defects and crystallinity | Raman mapping, TEM, XRD. | ID/IG, D prime behavior, peak widths, map statistics, lattice observations. | Distinguishes useful edges from unacceptable basal plane damage. |
| Surface chemistry | XPS, FTIR, TGA. | Atomic composition, O/C, functional groups, organic residue. | Controls compatibility, conductivity, stability, and reactivity. |
| Trace metals and ash | ICP MS, ICP OES, ash, SEM EDS. | Mass fraction by element and total ash. | Critical for electronics, catalysis, biomedical use, and color. |
| Specific surface area | Gas adsorption with stated model and degassing. | m² g⁻¹ with uncertainty. | Relates to accessible surface and aggregation. |
| Dispersion stability | UV Vis, sedimentation, zeta potential, rheology. | Concentration retention with time and redispersion energy. | Determines storage, pumping, coating, and formulation life. |
| Application performance | Electrical, thermal, mechanical, rheological, electrochemical, or catalytic test. | Performance against control at fixed loading and processing. | Confirms that material metrics translate to value. |