
Technical publication
Back to publications
Reactors & equipment
Cavitation-Assisted Particle Dispersion
okozyuk.com
Published
Read complete publication for whole-document Find and printing. Browser Find and native printing on this reader include only loaded content.
8 Material case studies
8.1 Zinc oxide
The supplied results describe cavitation-assisted dispersion of a commercial ZnO powder with an average crystallite size of approximately 67 nm and micron sized agglomerates [1,2]. The volume-weighted mean diameter decreased from 16.73 µm in the control sample to 0.50 µm after one pass, 0.31 µm after five passes, and 0.27 µm after ten passes. The D90 value decreased from 51.93 to 0.91 µm after one pass and to 0.51 µm after ten passes.
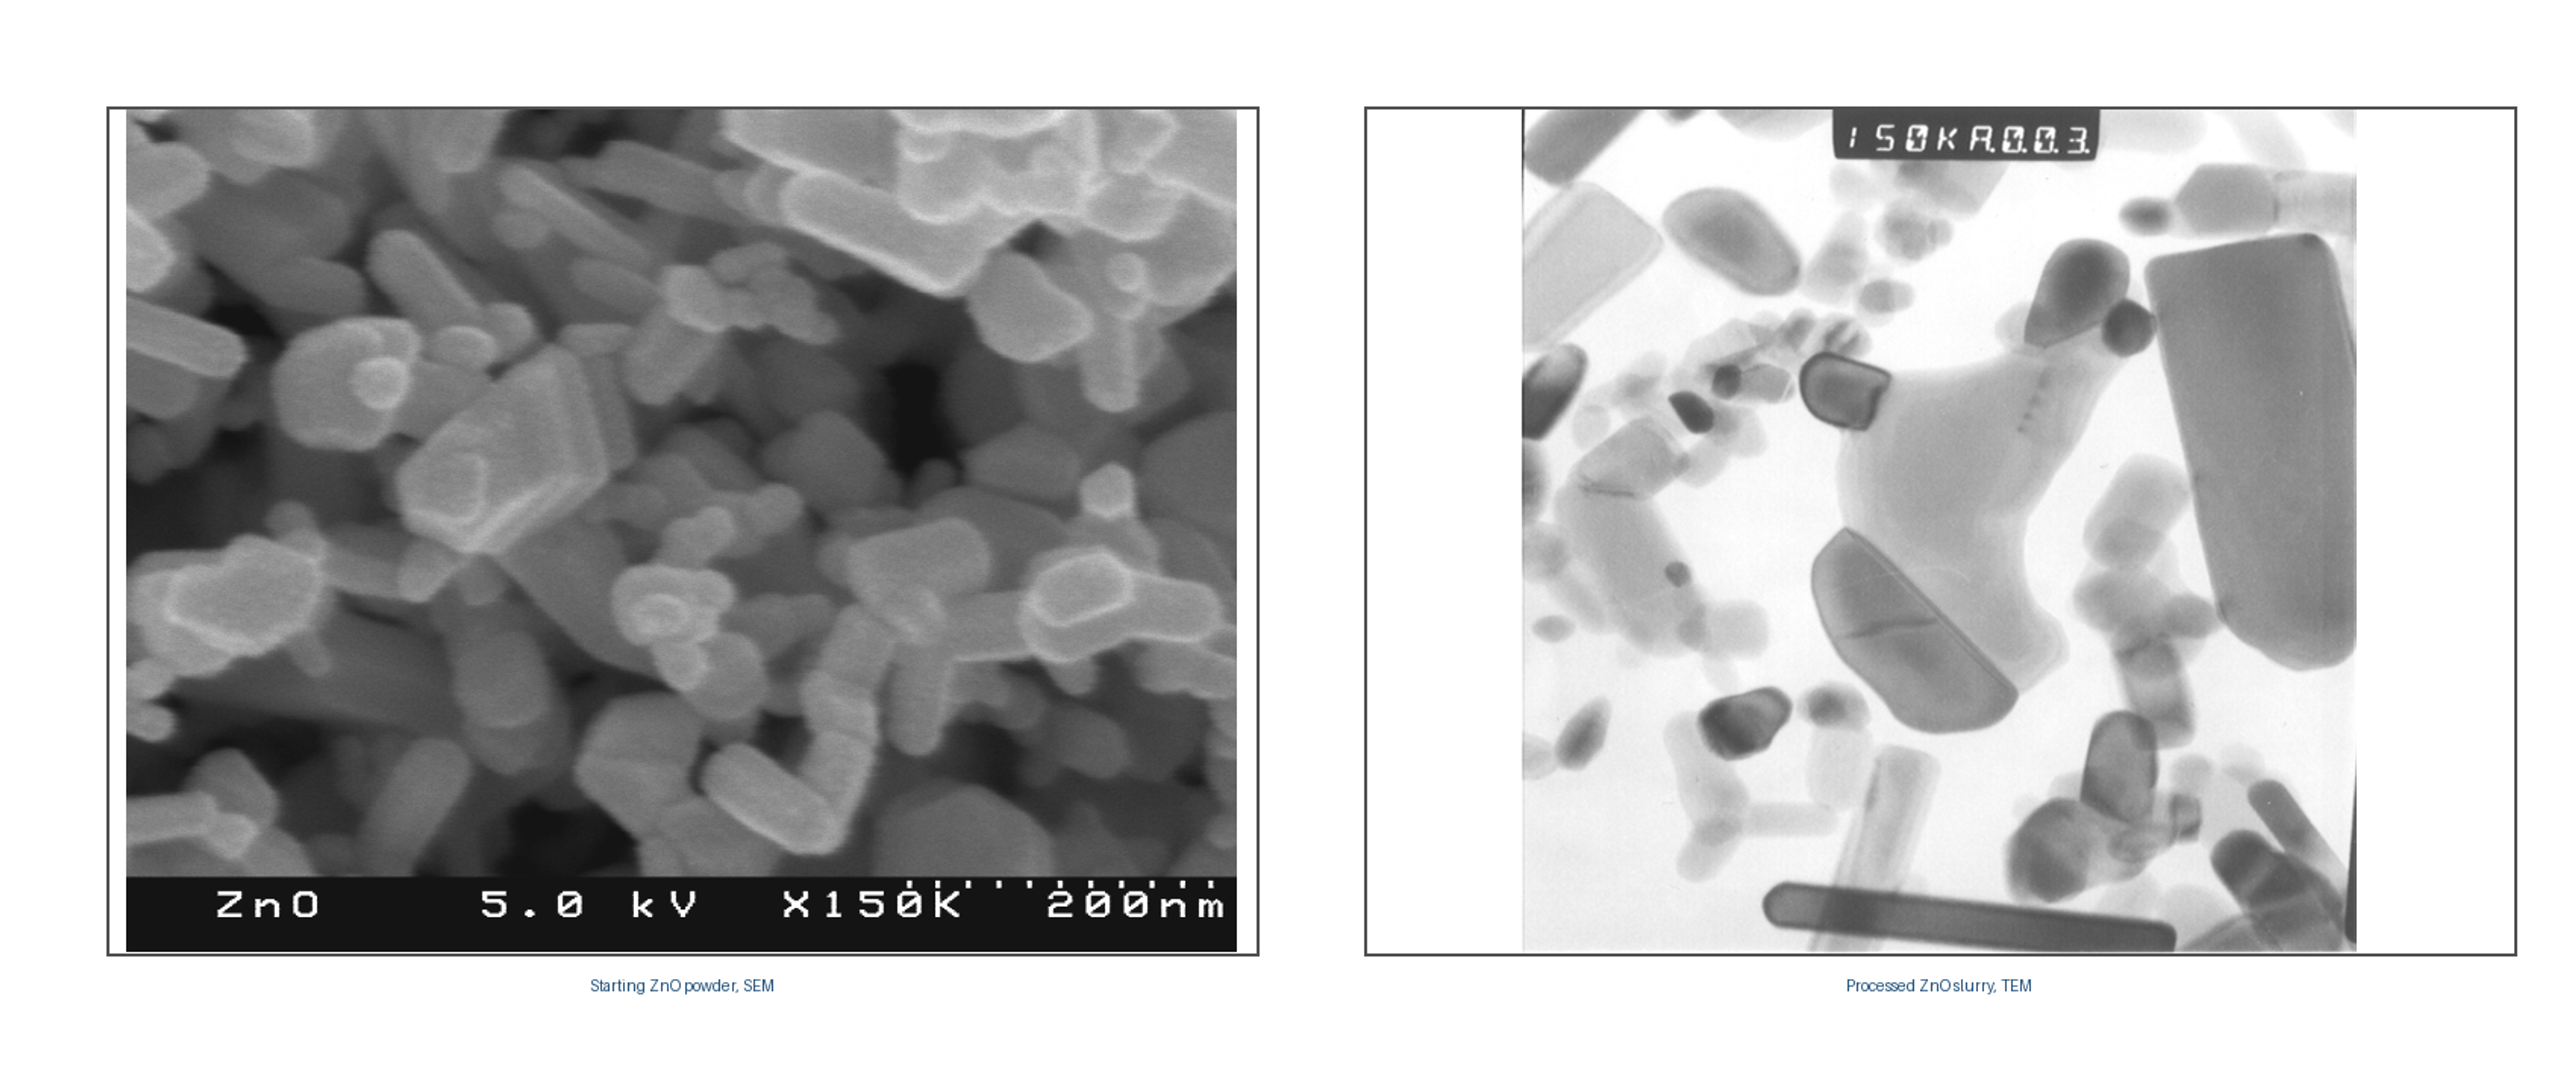
Figure 8.1. Starting ZnO powder observed by SEM and processed ZnO observed by TEM [2].
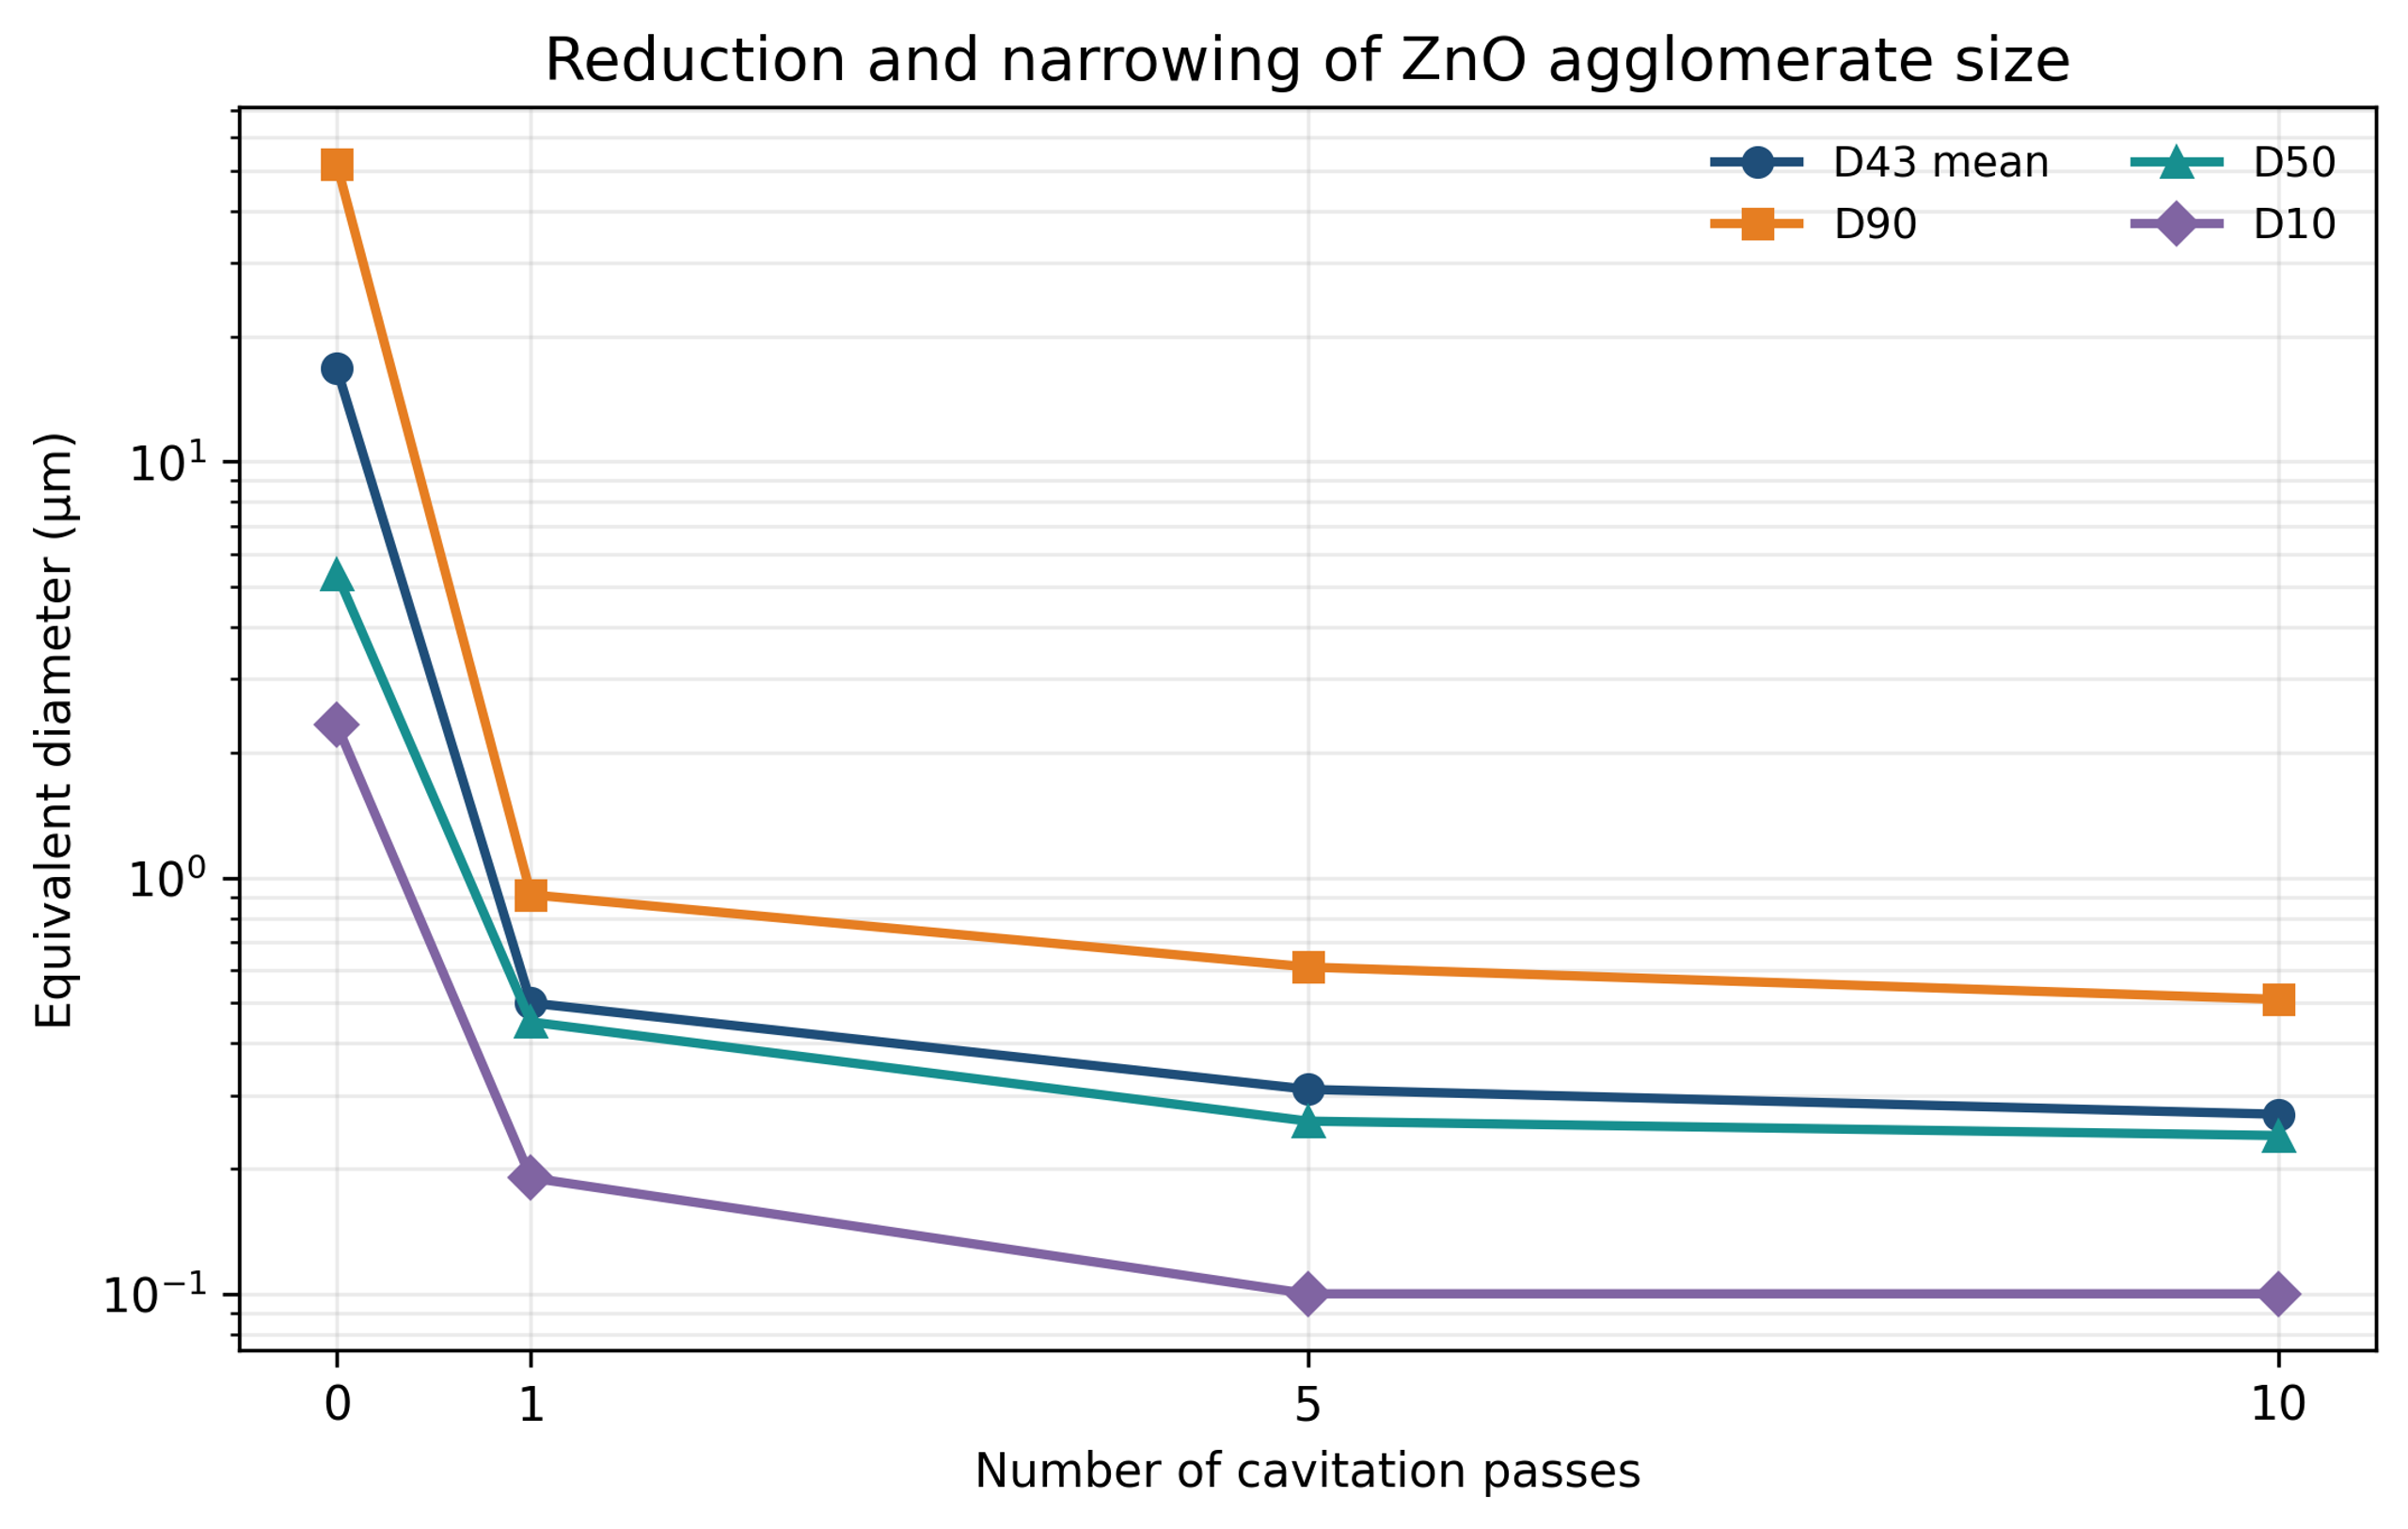
Figure 8.2. Reduction and narrowing of ZnO agglomerate size with cavitation passes [1,2].
Table 8.1. ZnO particle size response to number of passes.
| Passes | mean (µm) | (µm) | (µm) | (µm) |
|---|---|---|---|---|
| Control | 16.73 | 51.93 | 5.37 | 2.33 |
| 1 | 0.50 | 0.91 | 0.45 | 0.19 |
| 5 | 0.31 | 0.61 | 0.26 | 0.10 |
| 10 | 0.27 | 0.51 | 0.24 | 0.10 |
The large improvement after the first pass, followed by smaller incremental changes, is consistent with a broad strength distribution. Weak agglomerates fail early, whereas the remaining structures have stronger contacts or approach an endpoint limited by stabilization. The 0.27 micrometer mean should not be interpreted as crystallite size. The evidence is predominantly consistent with deagglomeration, although some aggregate erosion cannot be excluded.
8.2 Bentonite clay
A 5 wt% bentonite slurry showed a pressure-dependent decrease in mean equivalent diameter after one pass. The mean decreased from 567.4 nm in the control to 431.9 nm at 34.47 MPa, 343.7 nm at 68.95 MPa, and 275.8 nm at 103.42 MPa [1,2].
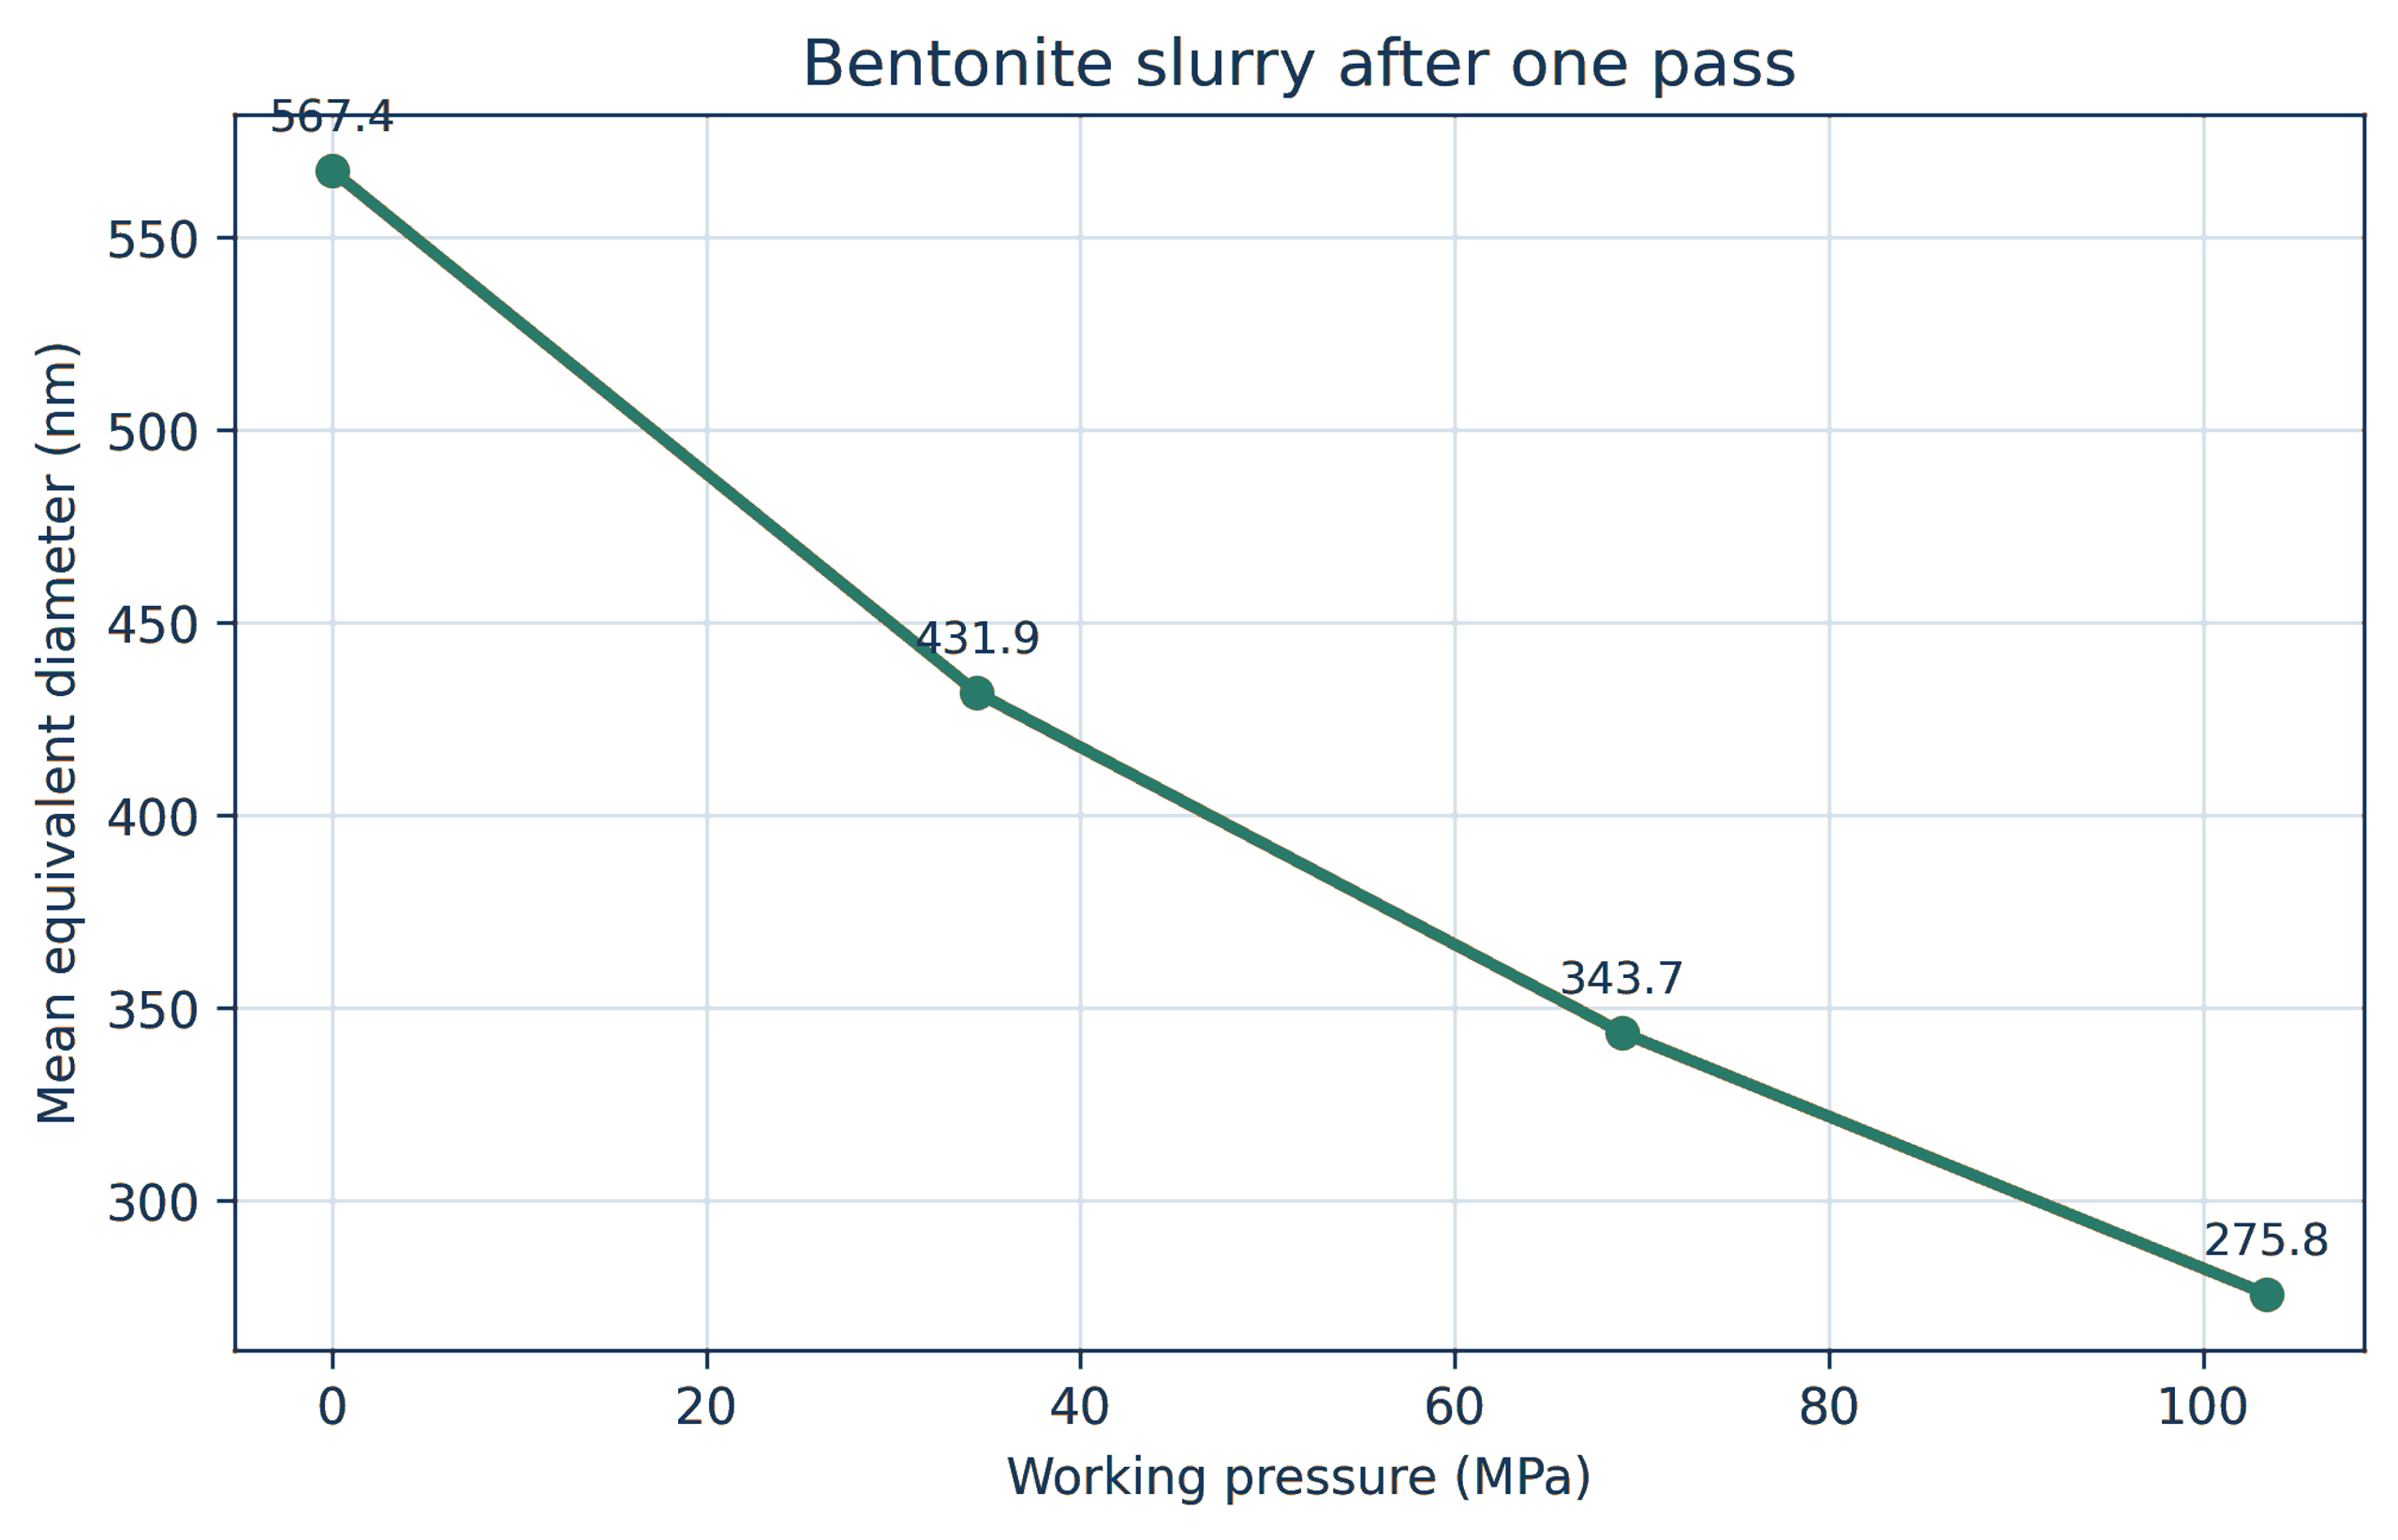
Figure 8.3. Mean diameter of a 5 wt% bentonite slurry after one pass at increasing pressure [1,2].
Bentonite response depends strongly on hydration time, exchangeable cation, ionic strength, pH, and platelet chemistry. A pressure response measured in one aqueous formulation cannot be transferred directly to another. Rheology may change more strongly than median size because a small amount of delaminated high aspect ratio material can alter the network.
8.3 Silver powder and nanosilver dispersions
Silver powders for conductive inks often contain nanoscale or submicron primary particles assembled into clusters tens of micrometers in size. The supplied nanosilver data show a control with micrometers, micrometers, micrometers, and a mean of 18.48 micrometers. After 10 minutes of controlled flow cavitation processing, the corresponding values were 0.11, 0.20, 0.33, and 0.21 micrometers [2,26].
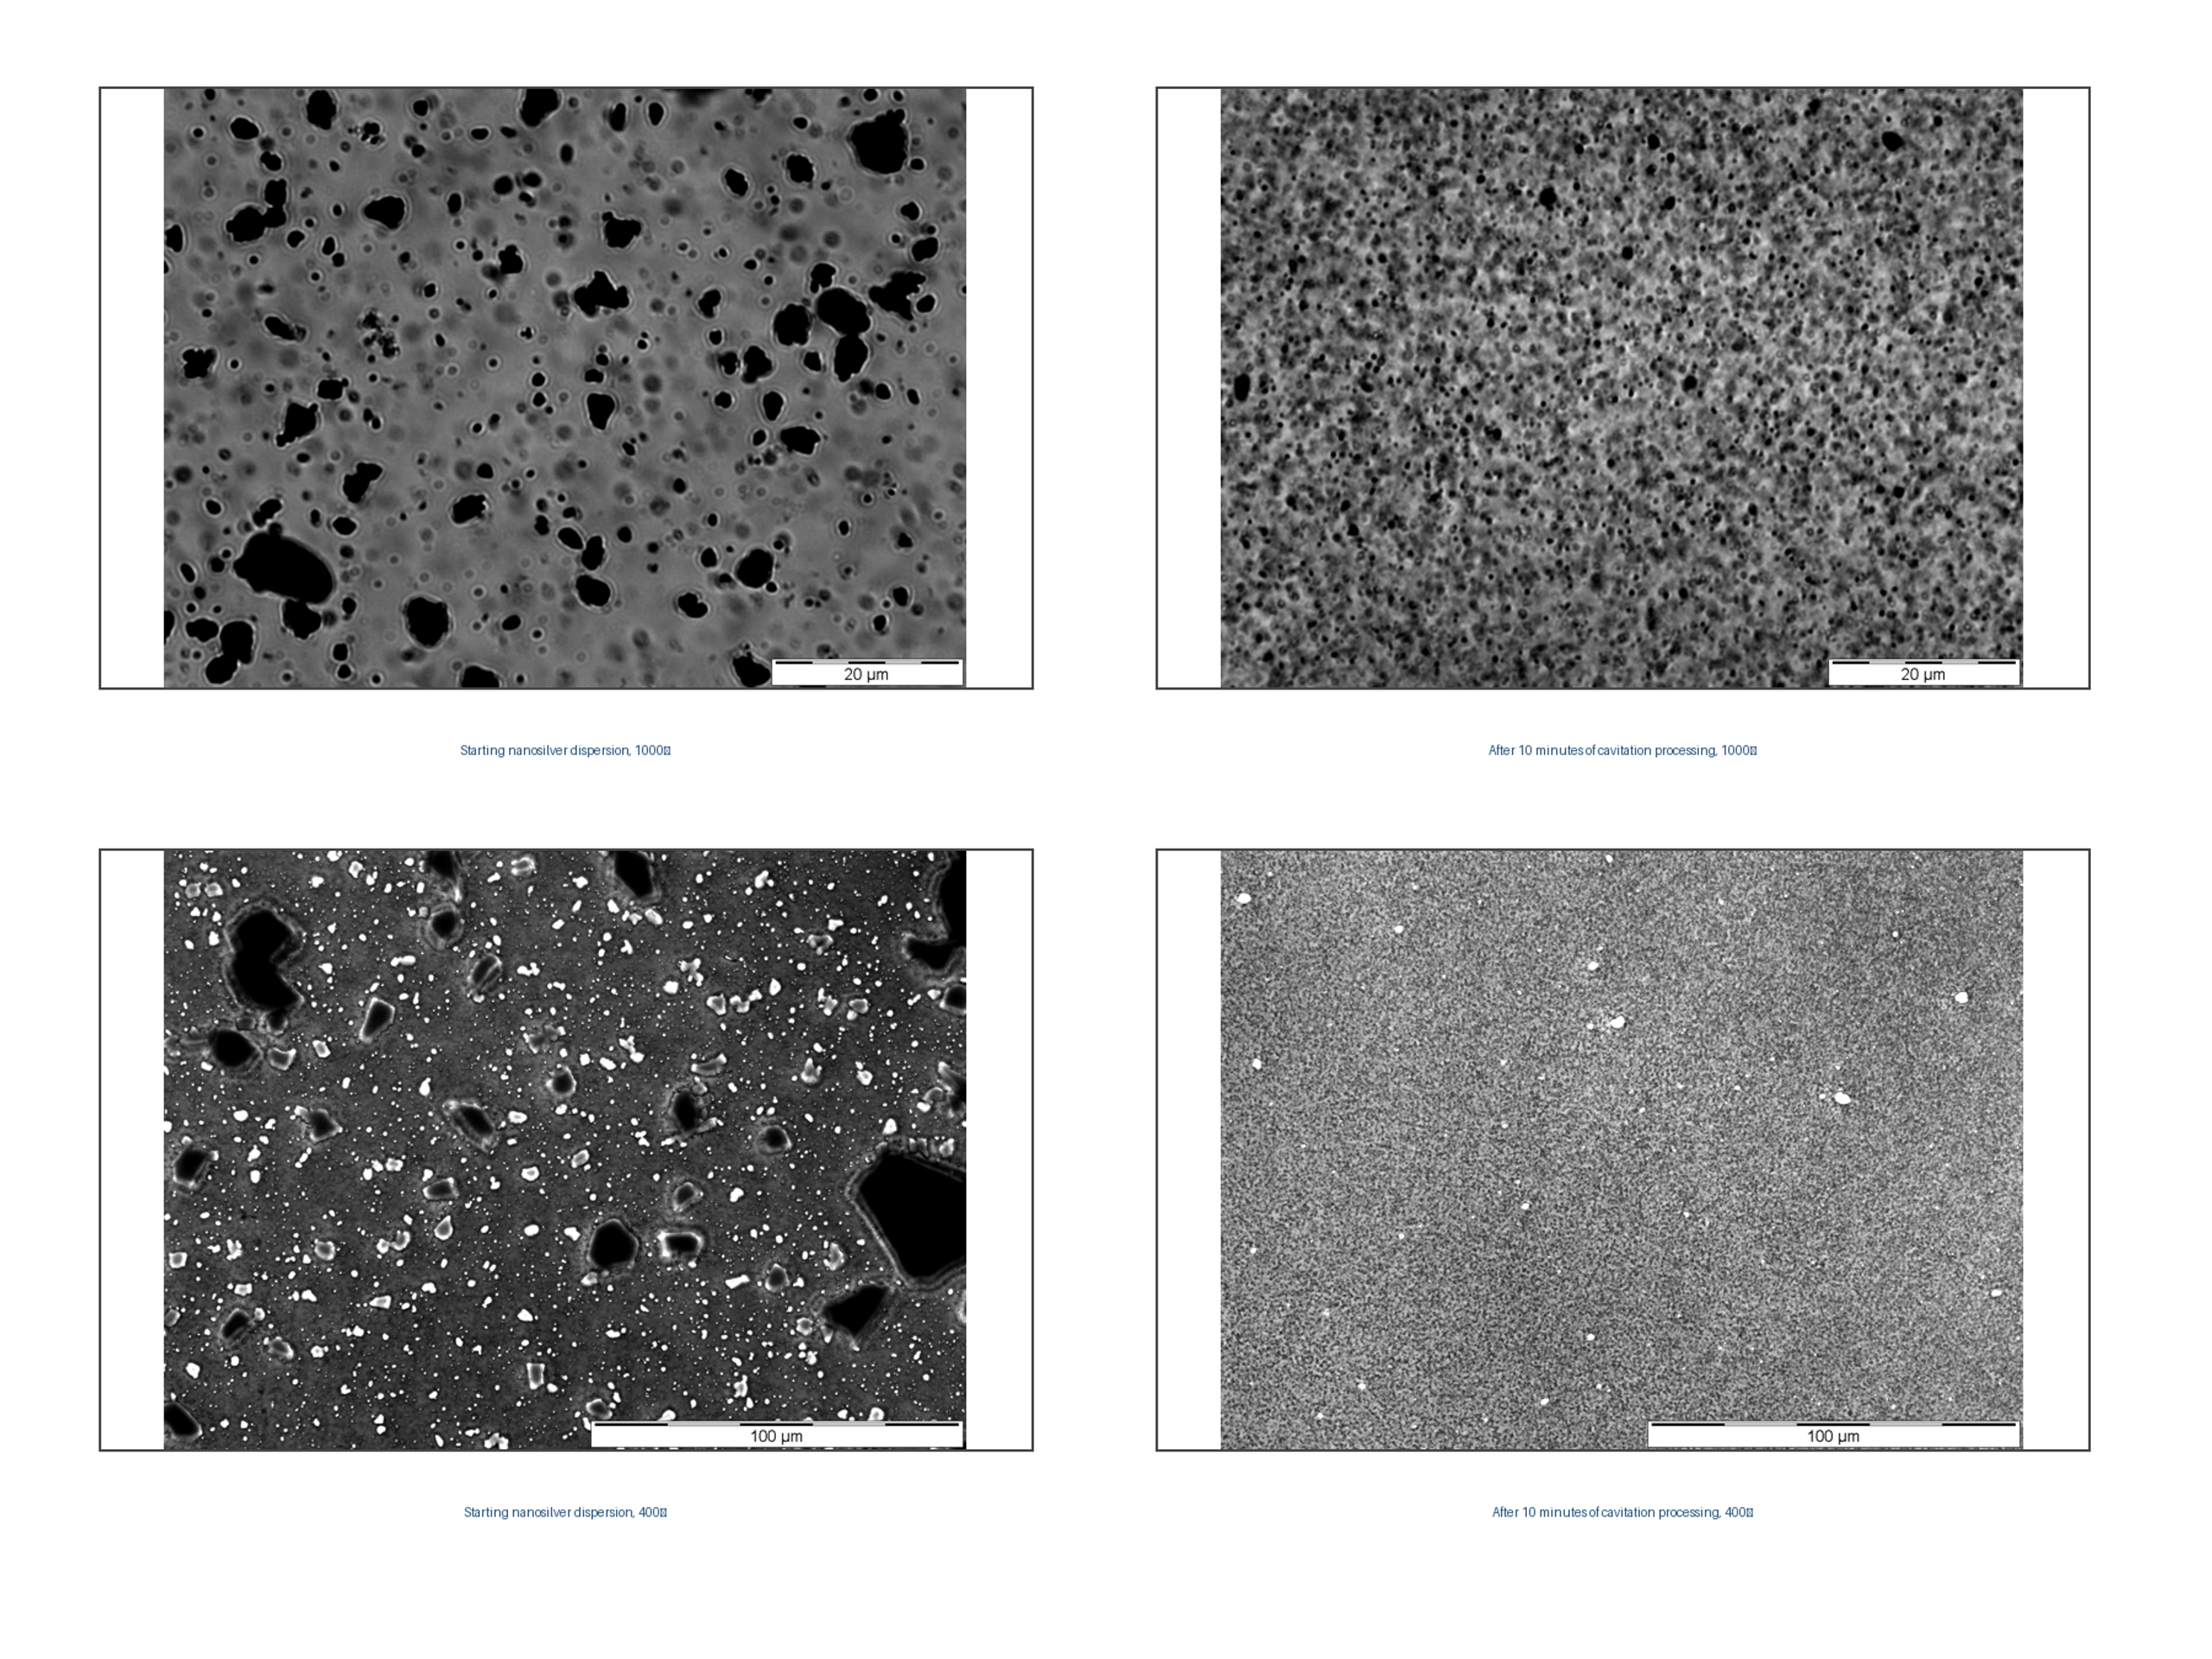
Figure 8.4. Nanosilver dispersion before and after 10 minutes of cavitation processing at 1000× and 400× magnification [2,26].
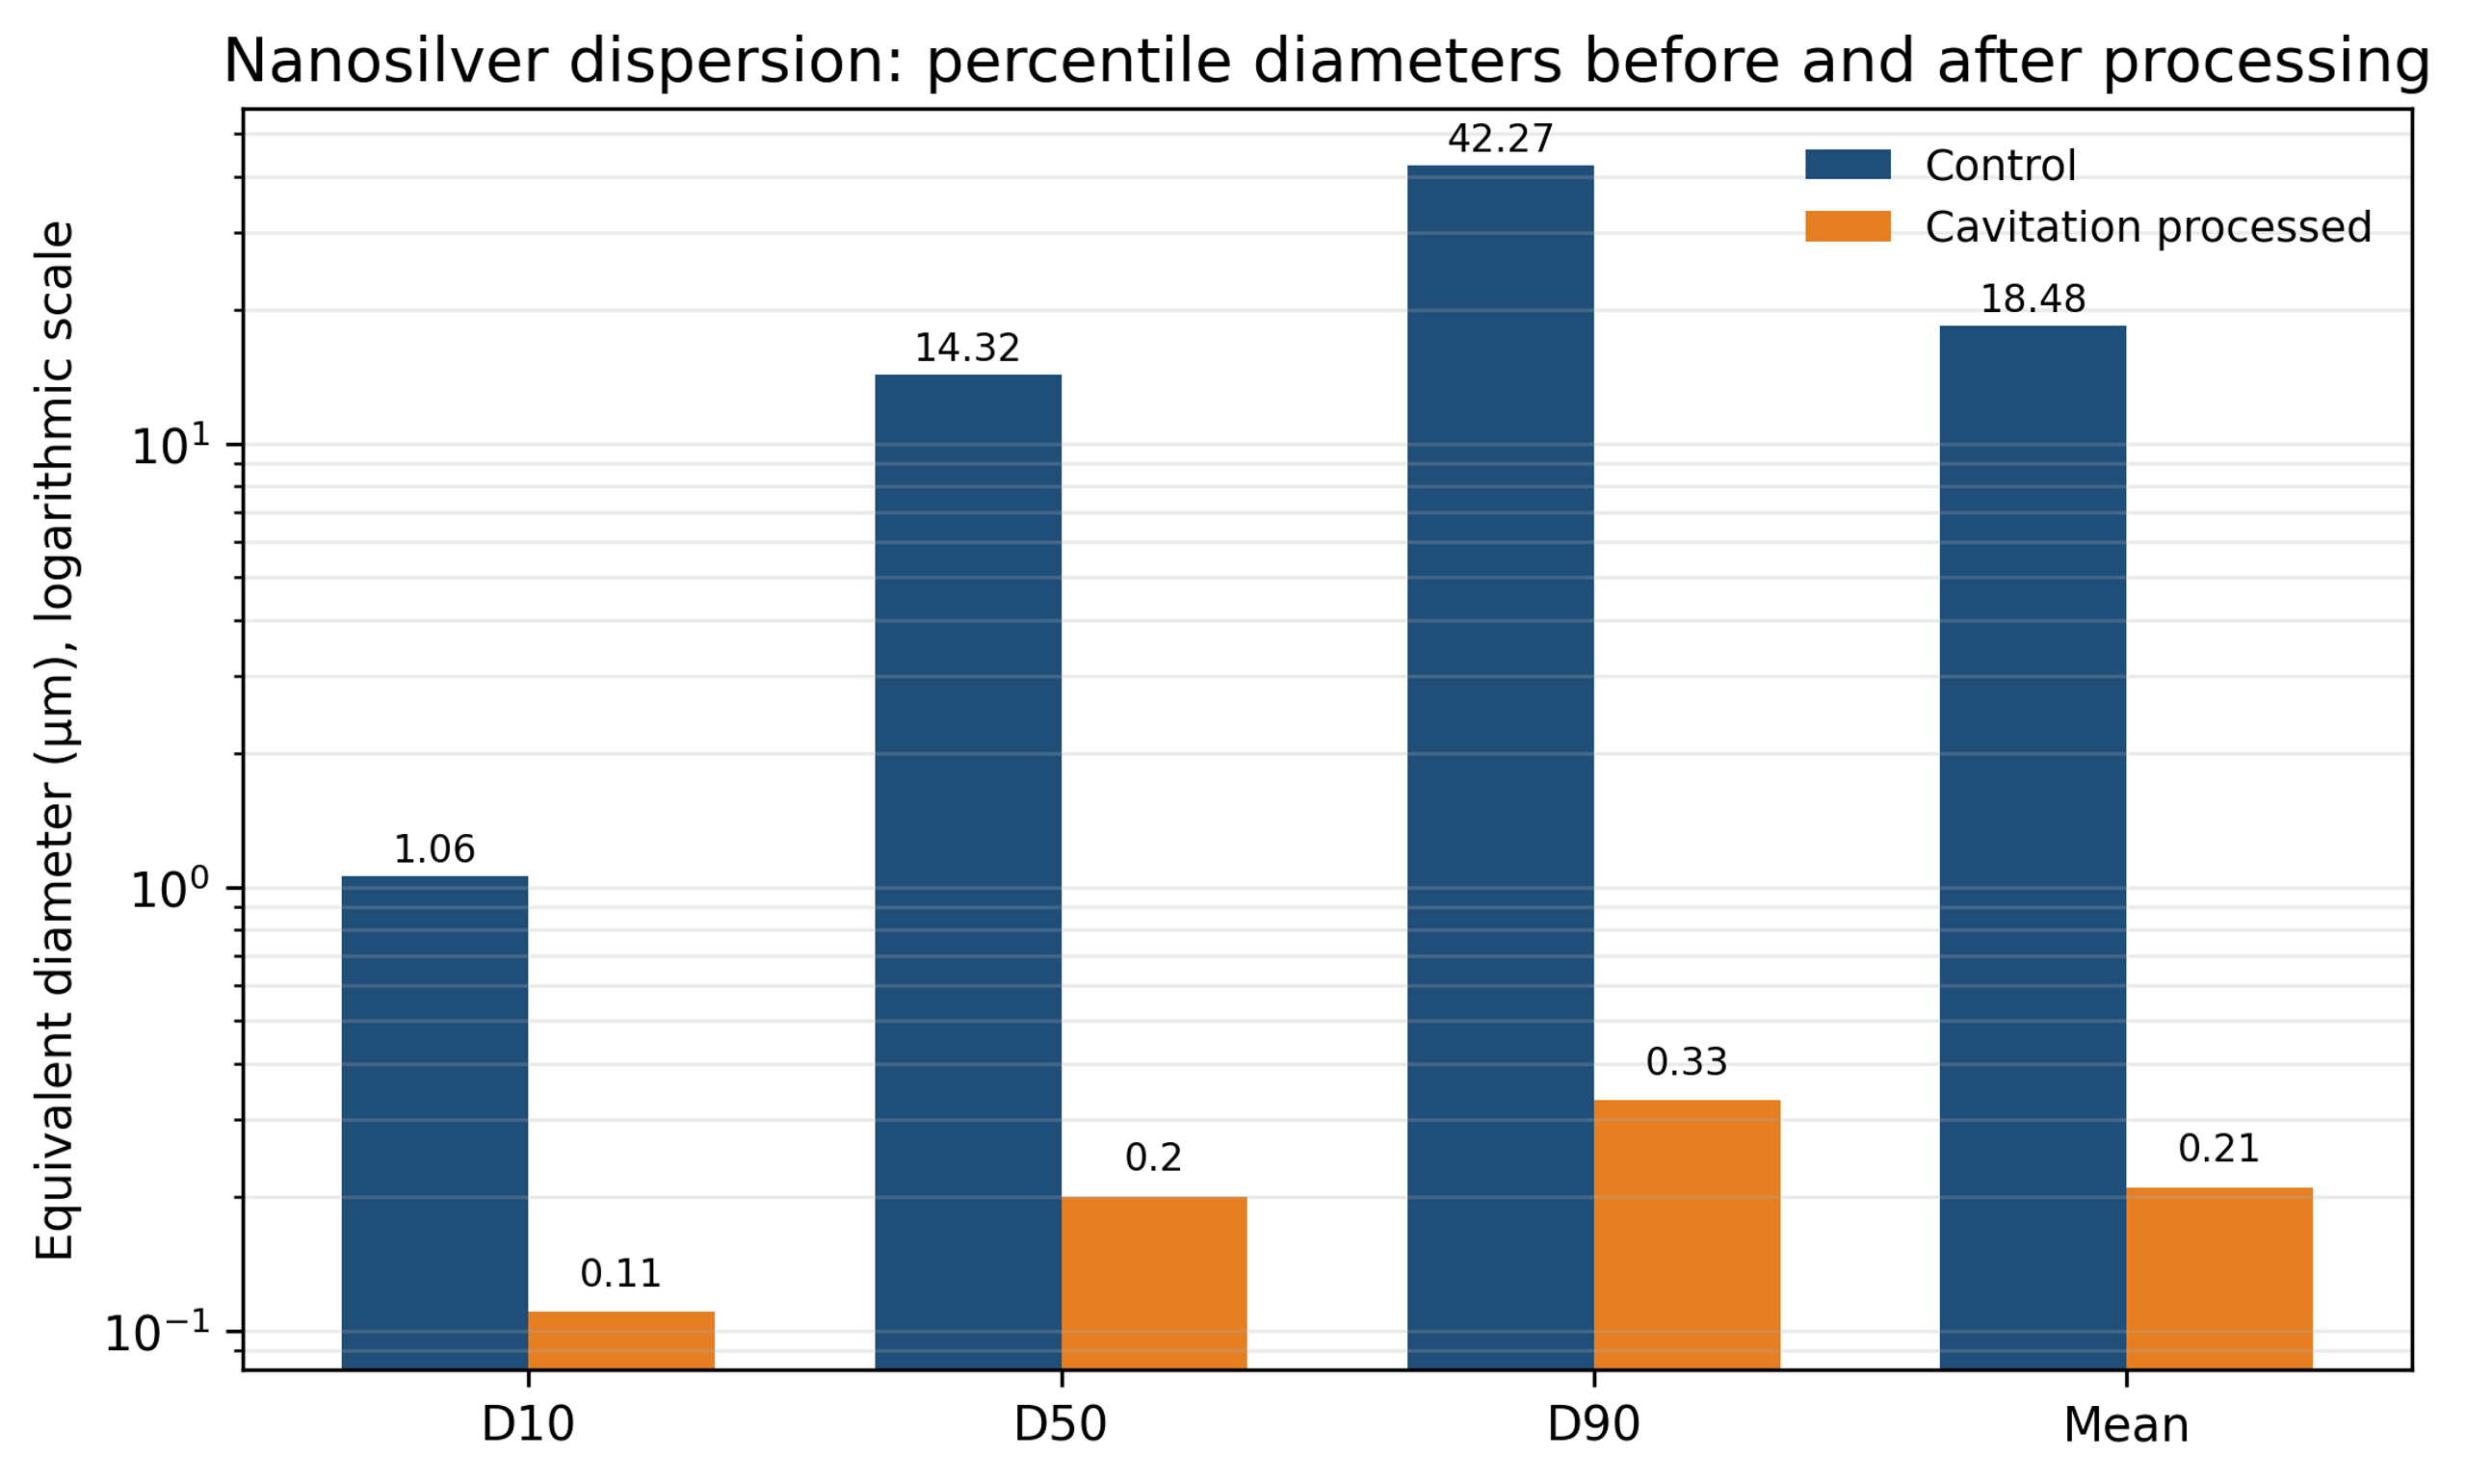
Figure 8.5. Percentile diameters of nanosilver before and after cavitation processing [2,26].
Table 8.2. Nanosilver particle size distribution.
| Condition | (µm) | (µm) | (µm) | Mean (µm) |
|---|---|---|---|---|
| Control | 1.06 | 14.32 | 42.27 | 18.48 |
| Cavitation processed | 0.11 | 0.20 | 0.33 | 0.21 |
The result demonstrates strong elimination of the coarse tail. For conductive flakes, however, excessive fracture can reduce aspect ratio and alter percolation, packing, viscosity, and cured conductivity. The correct target may be separation of flake clusters rather than grinding of each flake. Microscopy and electrical testing are therefore required in addition to particle-size measurement.
8.4 Silica, silver flakes, and carbon nanofibers in resin
Figure 8.6 presents before and after micrographs of silver flakes, silica powder, and carbon nanofibers in resin media [27,28]. Data from these materials indicate a denser flake distribution, lower viscosity in silica filled systems, and a more uniform carbon nanofiber network with improved conductivity. These examples demonstrate the range of compositions that can be processed.
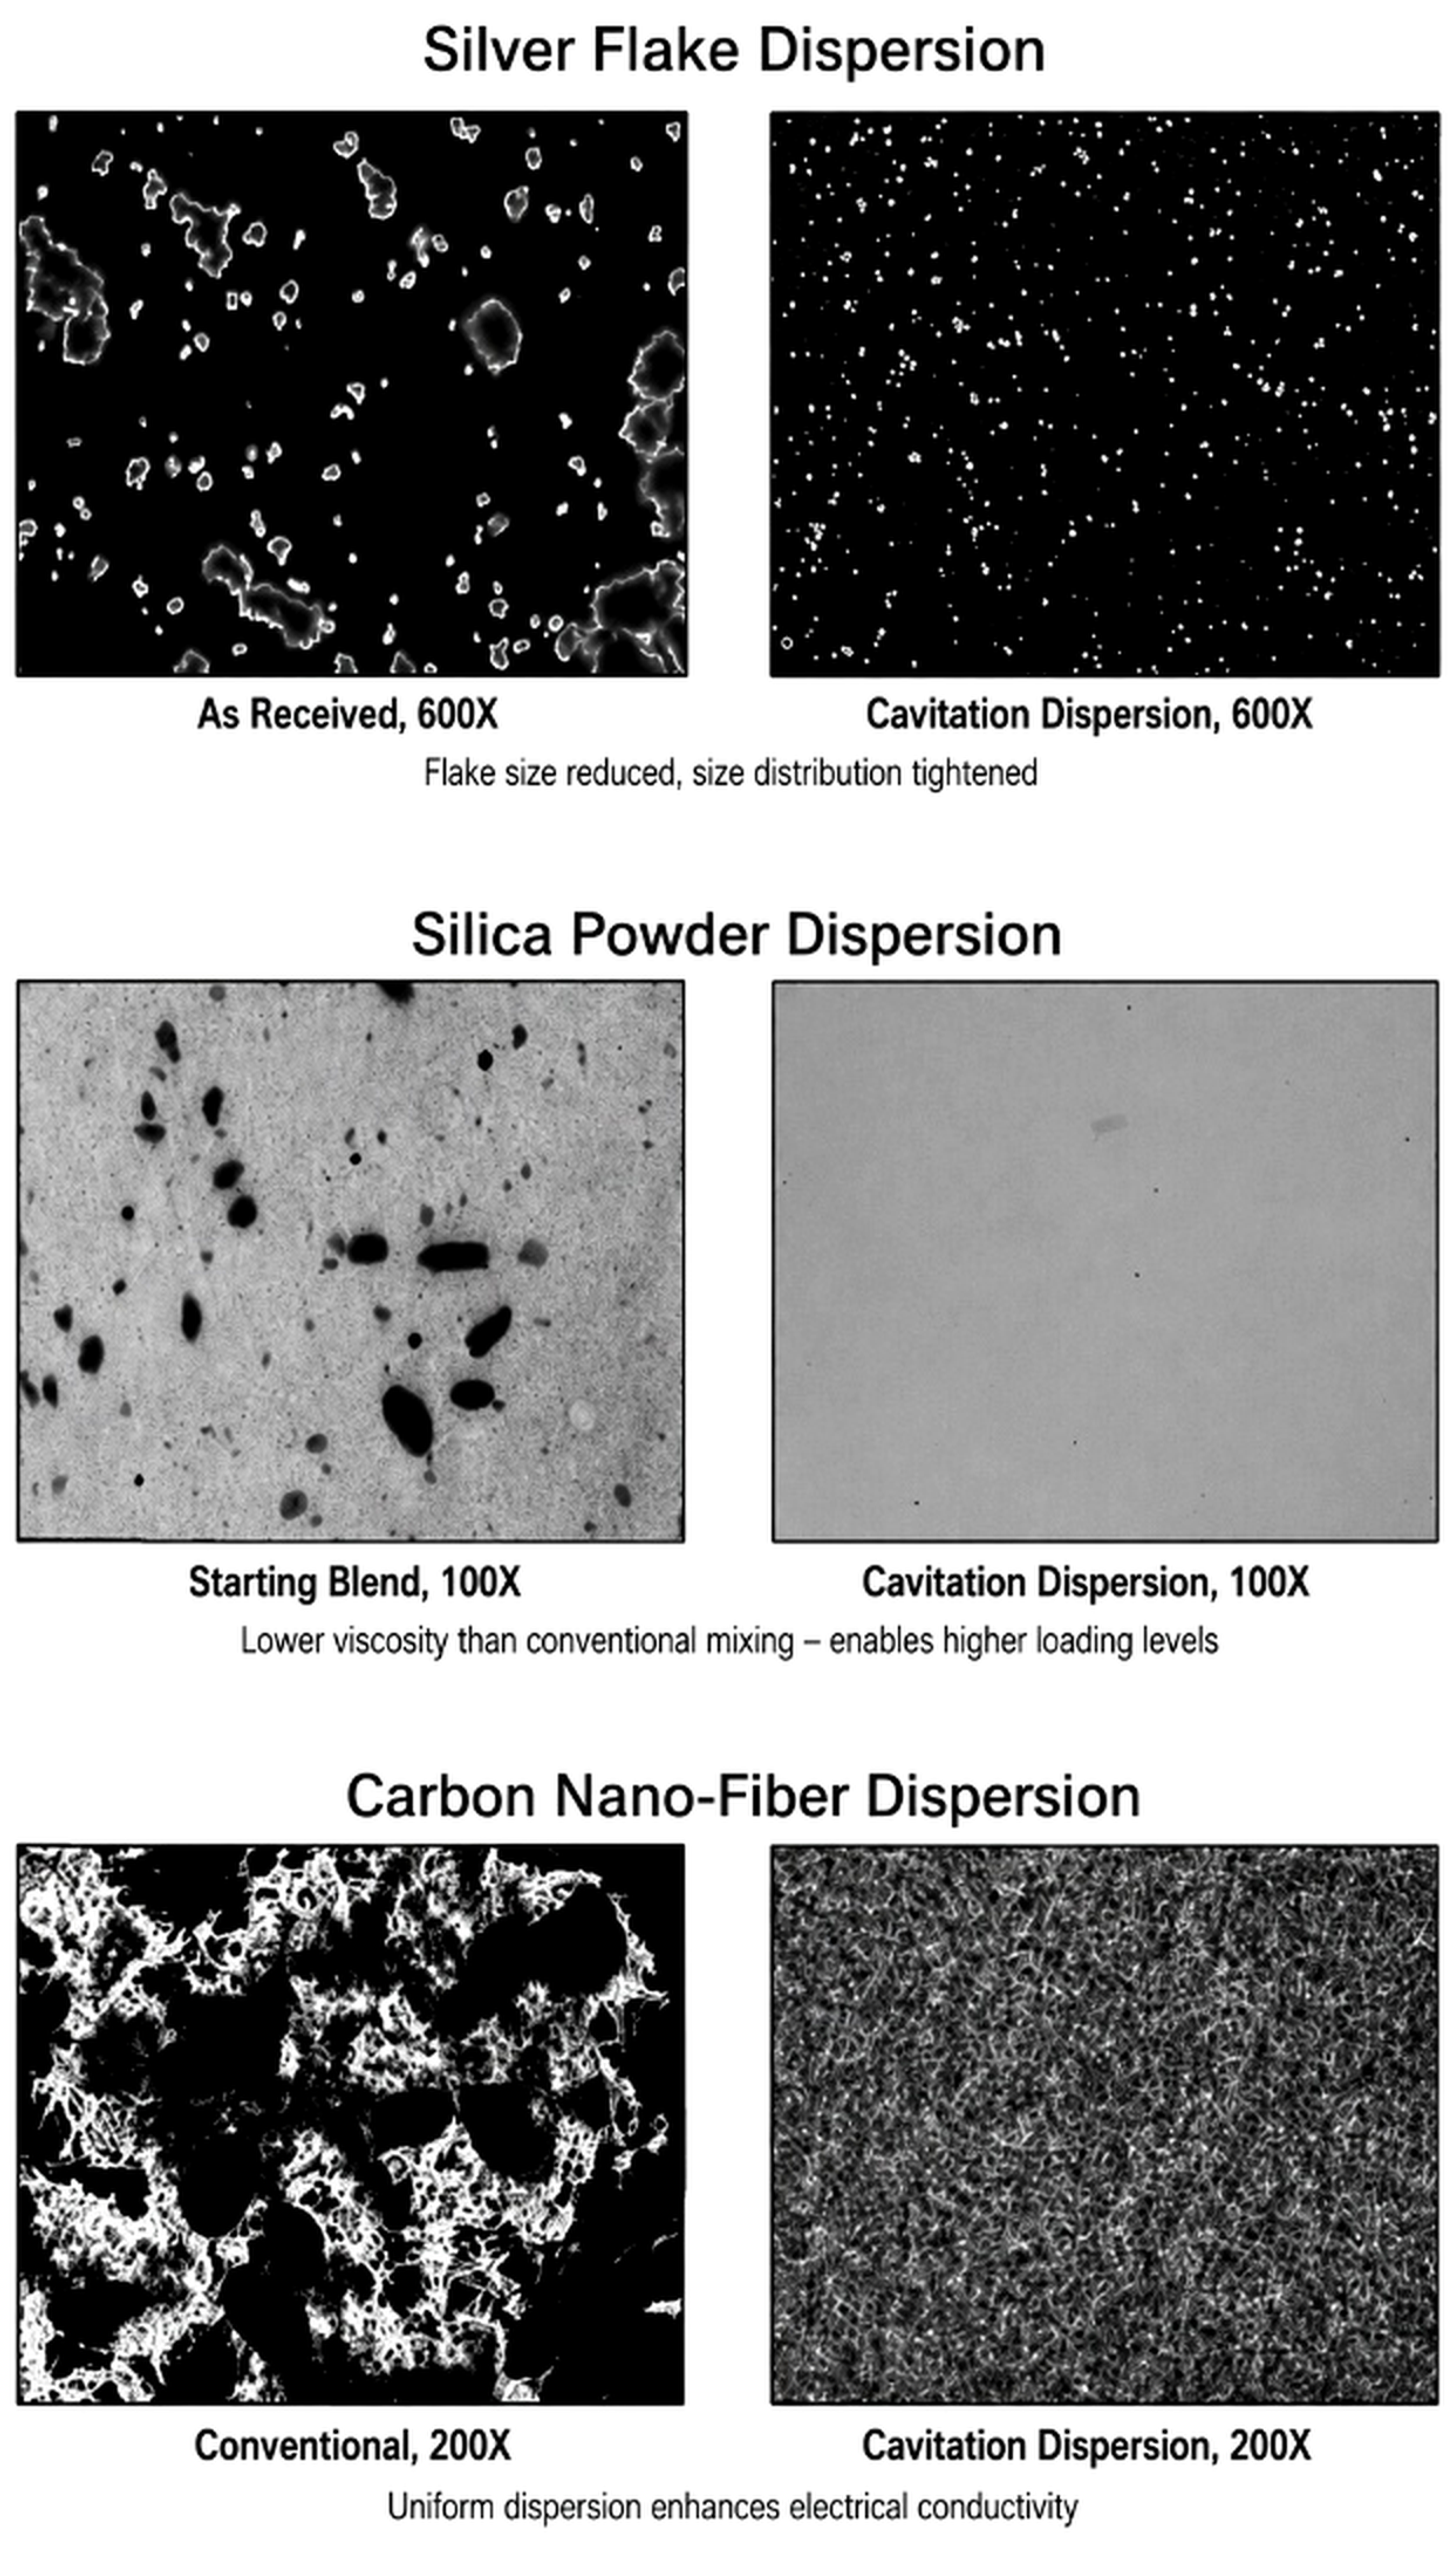
Figure 8.6. Before and after micrographs of silver flake, silica powder, and carbon nanofiber dispersions [27,28].
In filled resins, effectiveness is limited by viscosity and the ability to drive the formulation through small passages. Processing may be performed in a lower viscosity carrier followed by letdown, or in a heated resin within its stability window. Polymer chain scission, gas entrainment, and local overheating should be evaluated.
8.5 Soy slurry particle size reduction
In studies conducted by Arisdyne Systems, two variants of the initial soybean slurry were evaluated at pressures of 3,500, 5,100, and 6,500 psi and with one to four passes [29]. The samples were heated to approximately 70 to 75 °C, and their characteristics were measured five times using a Horiba LA950 analyzer. Sample 1 consisted of a previously ground slurry with a coarser particle size, whereas Sample 2 had undergone additional grinding.
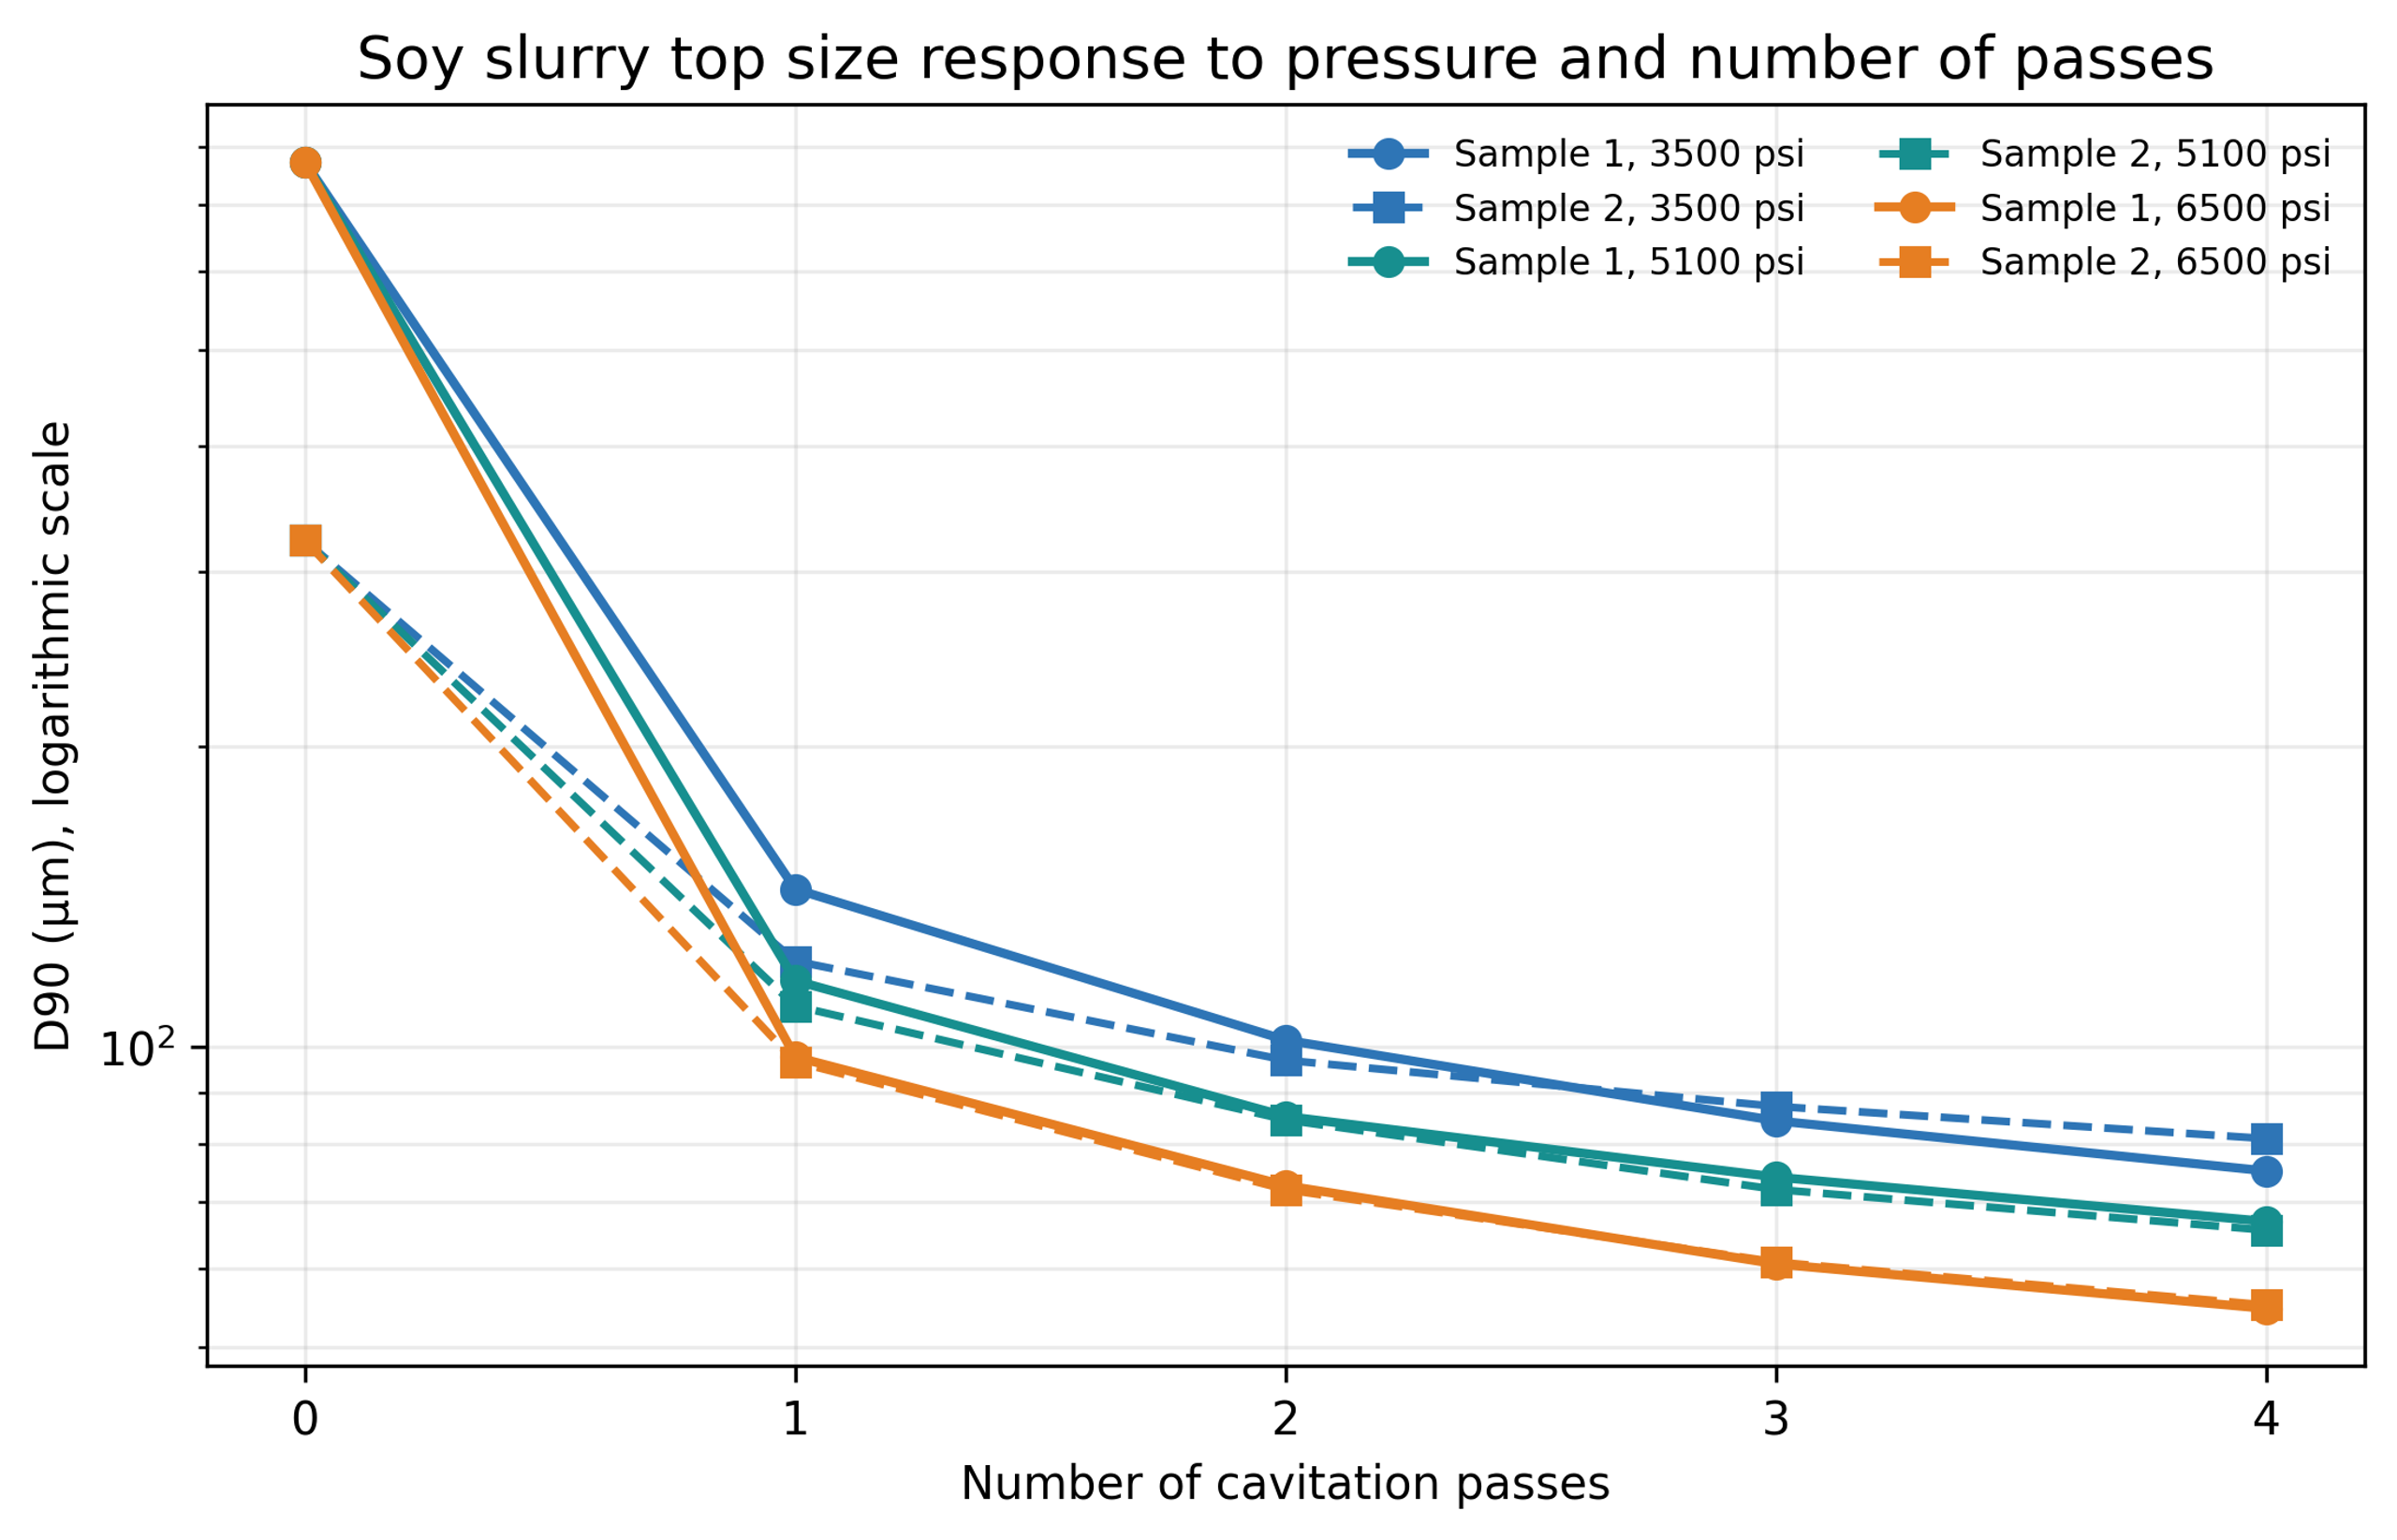
Figure 8.7. Soy slurry response to pressure and number of passes [29].
| Pressure (psi) | 1 pass | 2 passes | 3 passes | 4 passes |
|---|---|---|---|---|
| 3500 psi | 72% | 78% | 81% | 83% |
| 5100 psi | 75% | 81% | 84% | 85% |
| 6500 psi | 79% | 84% | 87% | 88% |
Figure 8.8. Average percent reduction in for two soy slurry feeds. Calculation from supplied data [29].
Table 8.3. Selected soy slurry and values.
| Feed and condition | (µm) | (µm) |
|---|---|---|
| Sample 1 control | 182.304 | 772.039 |
| Sample 1, 3500 psi, 1 pass | 64.448 | 144.019 |
| Sample 1, 5100 psi, 2 passes | 45.075 | 85.230 |
| Sample 1, 6500 psi, 4 passes | 27.043 | 54.690 |
| Sample 2 control | 127.352 | 322.033 |
| Sample 2, 3500 psi, 1 pass | 61.350 | 121.976 |
| Sample 2, 5100 psi, 2 passes | 44.098 | 84.549 |
| Sample 2, 6500 psi, 4 passes | 27.104 | 55.130 |
Both feeds approached a similar endpoint near micrometers and micrometers at 6,500 psi after four passes. Higher pressure reduced the number of passes required for a comparable result. The distributions also became narrower and less bimodal. Because the samples had been frozen for shipment, the report notes that freeze and thaw history may have affected cell wall damage and control particle size [29].
8.6 Alumina and titania nanofluids
Karimzadehkhouei and coworkers used a short micro orifice to process heated gamma alumina nanofluids [23]. In one test series, the mean hydrodynamic diameter decreased from approximately 1718 nm after heating to 1281 nm at 10 bar and 825 nm at 60 bar. In the second series, values of 515 nm at 60 bar and 255 nm at 90 bar were reported. Lower cavitation number correlated with greater deagglomeration.
A later cavitation on chip study used dilute titania nanofluid and direct high-speed visualization [24]. The mean hydrodynamic diameter increased from 255 nm to 1281 nm after thermal agglomeration, then decreased to 342 nm at 2 MPa and 164 nm at 7 MPa.
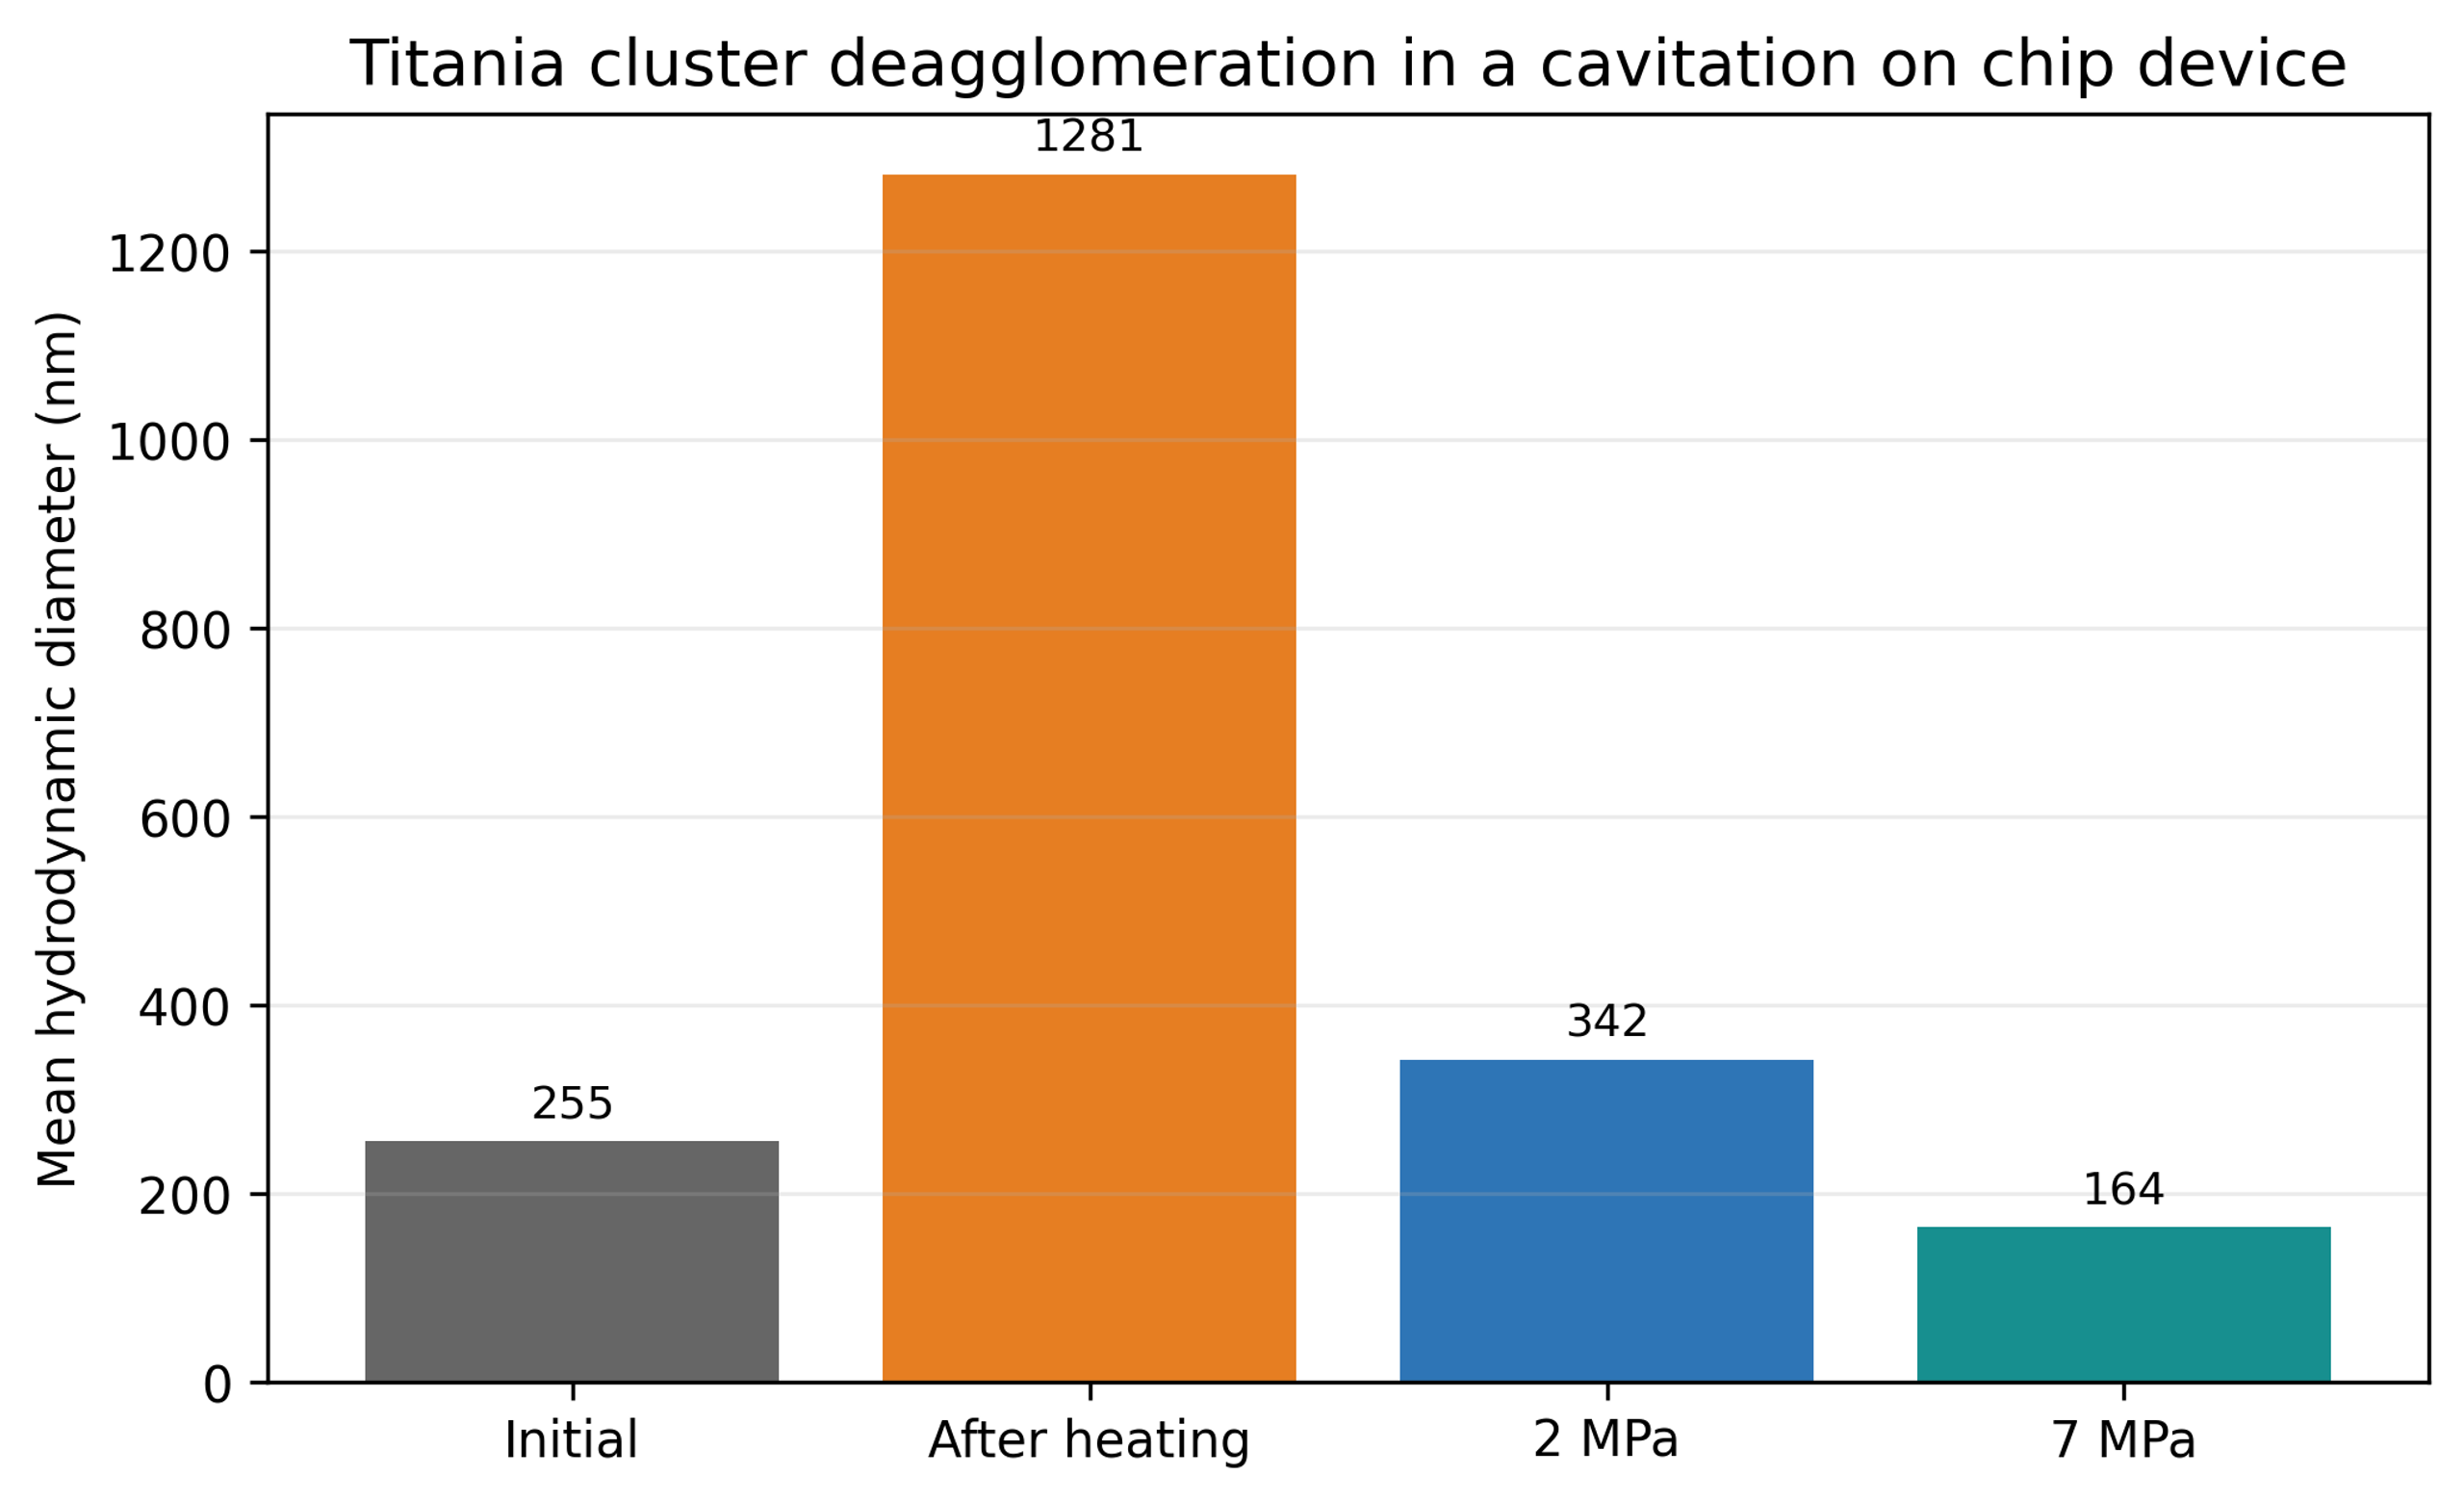
Figure 8.9. Titania cluster deagglomeration in a cavitation on chip device [24].
The authors estimated local impact pressure scales of approximately 80 to 175 MPa for the modeled conditions [24]. These are local model-based estimates, not uniform stresses measured throughout the device. The final DLS size represents hydrodynamic agglomerates and does not indicate fracture to the same primary particle size.
8.7 Silicon nanomilling
The water jet mill study began with monocrystalline silicon particles with a maximum size near 100 micrometers [30]. After 180 seconds, a standard high-pressure nozzle produced a separated fine fraction with a median near 148 nm. A cavitating nozzle produced a reported median near 32 nm under otherwise comparable conditions.
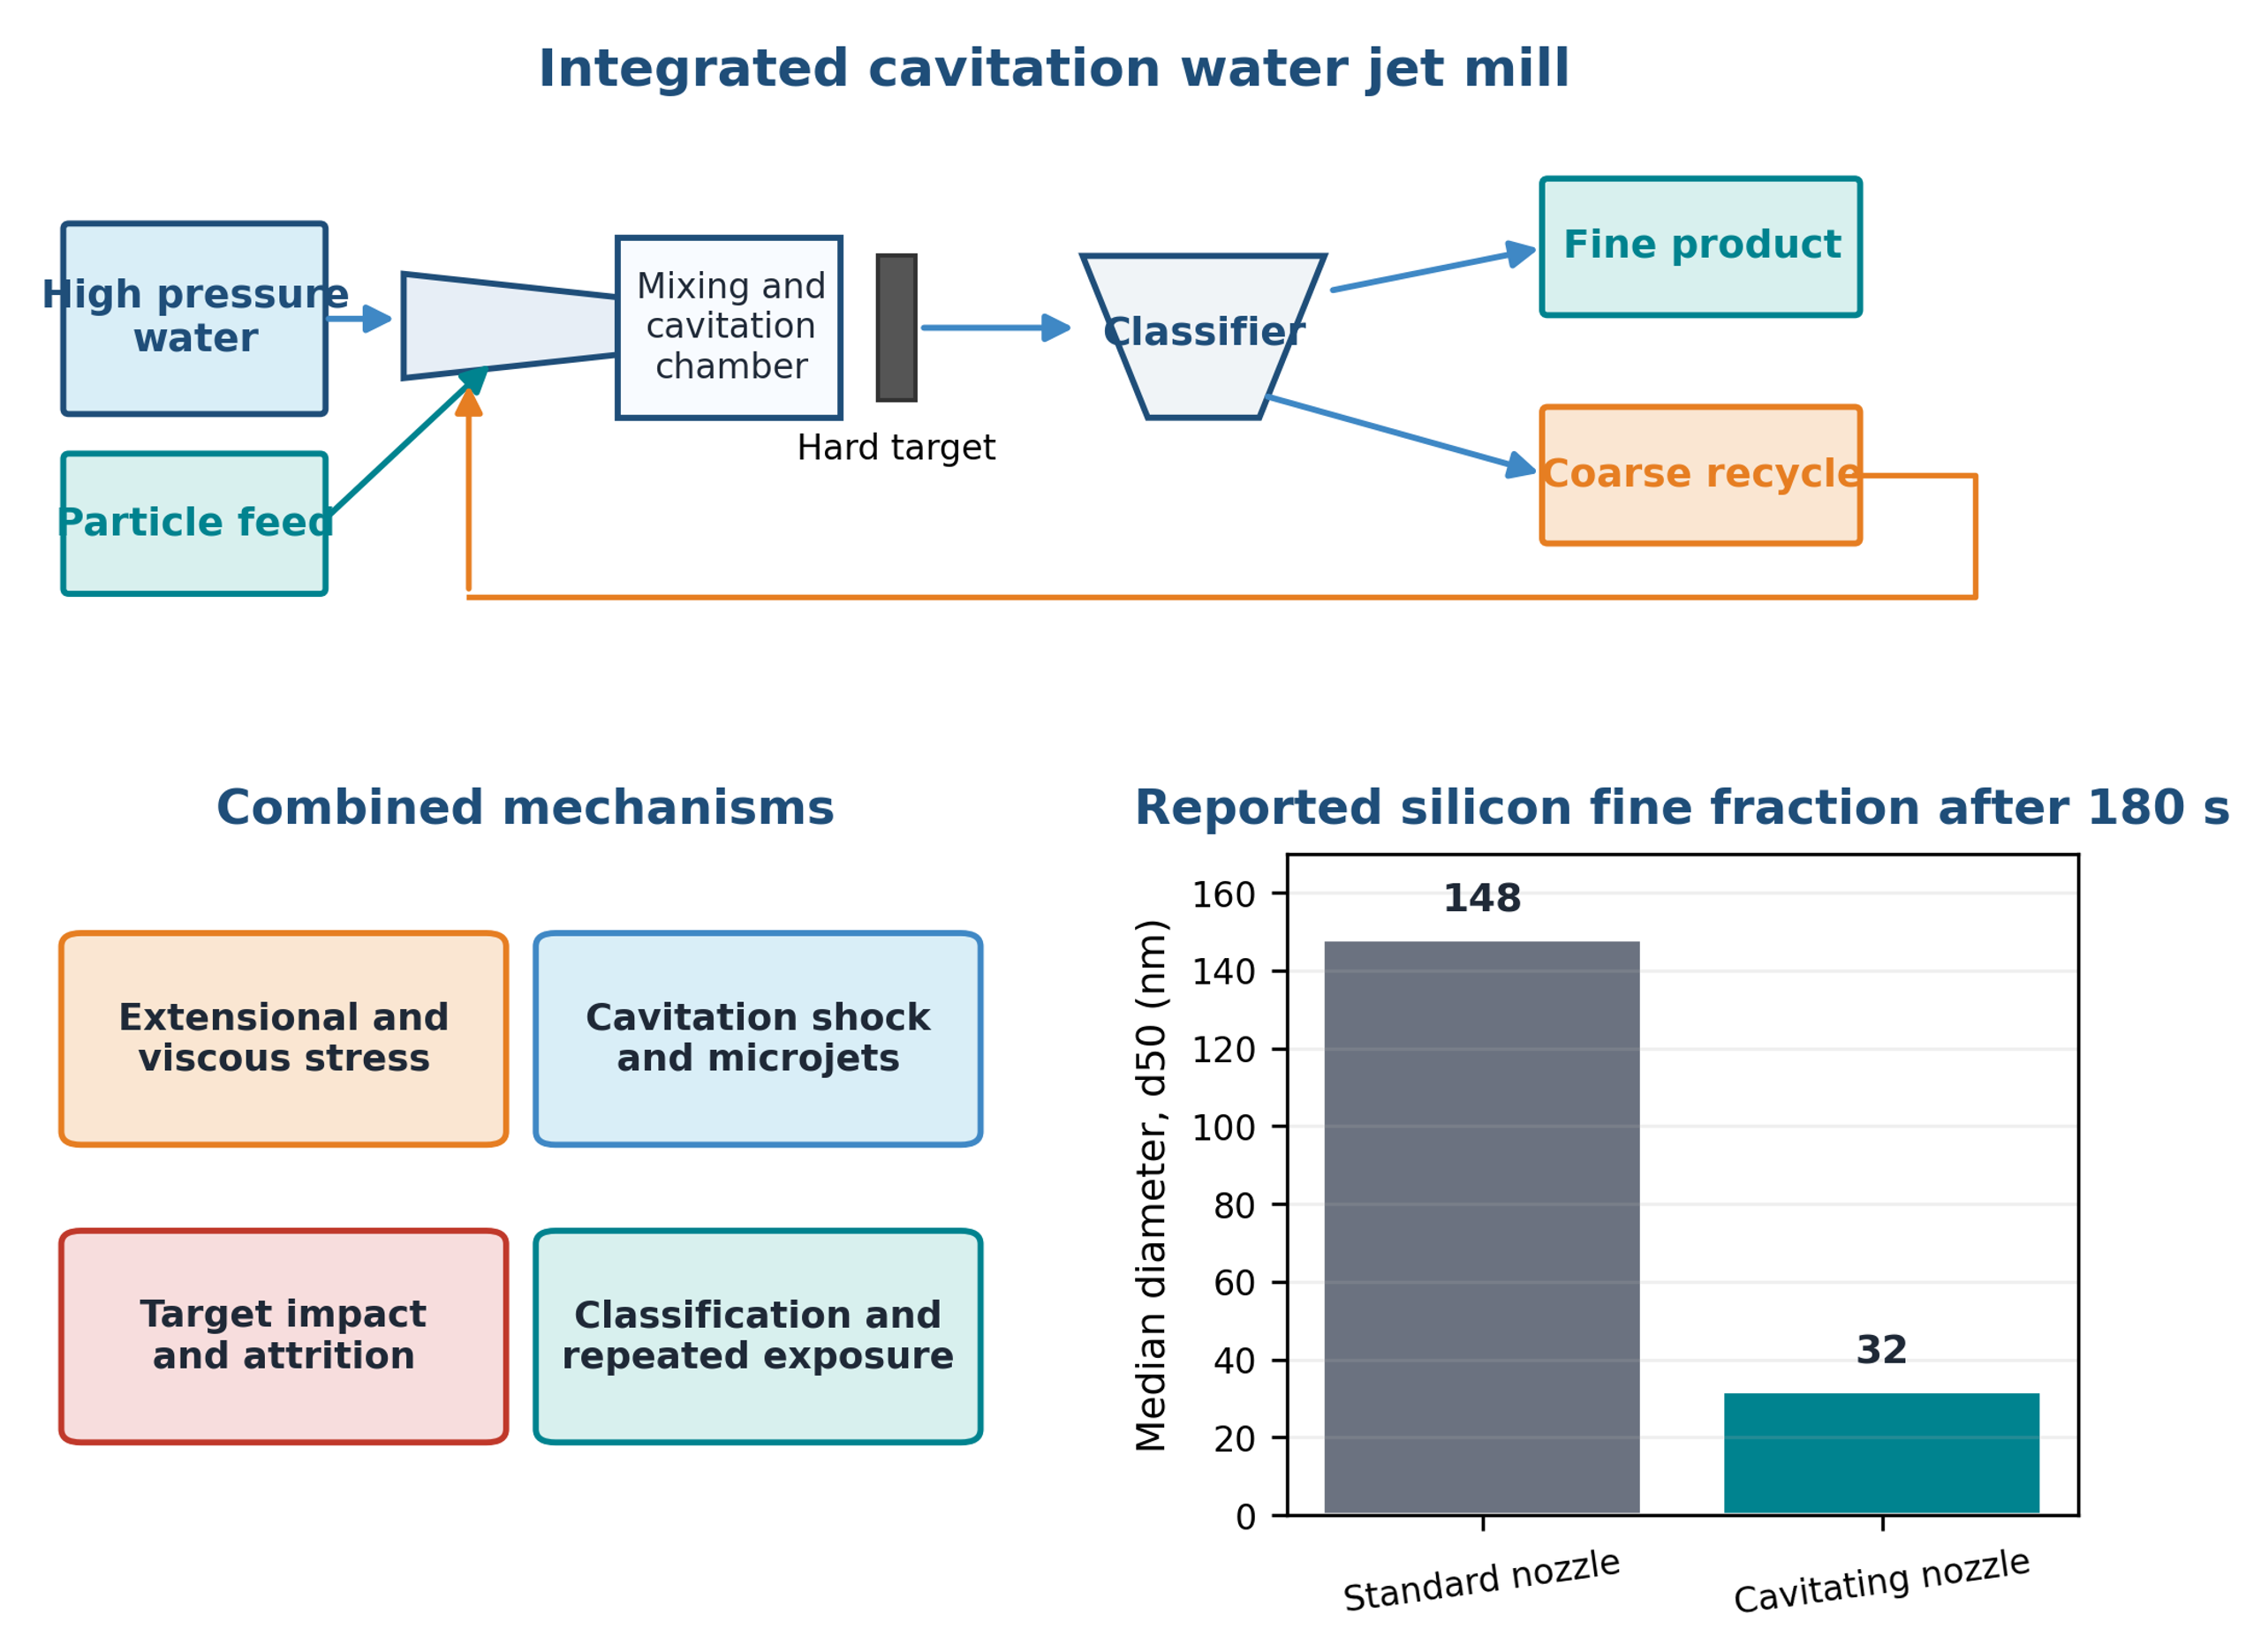
Figure 8.10. Integrated water jet mill loop, active mechanisms, and reported silicon median size after 180 seconds [30].
This case combines deagglomeration and comminution with target impact, recirculation, and classification. It should not be used as evidence that cavitation alone produced the complete size reduction. Energy allocation among jet kinetic energy, heating, cavitation, impact, and classification is also difficult.
8.8 Exfoliation of graphite and production of few layer graphene
Layered materials have strong in-plane bonding and weaker interlayer attraction. In hydrocavitating microchannels, acceleration and wall shear can initiate sliding or peeling, while pressure recovery, microjets, and collapse waves act normal or oblique to the sheets. Open access studies of natural graphite demonstrate that these effects can be combined in water-based microreactors and recirculating flow paths [31,33,40].
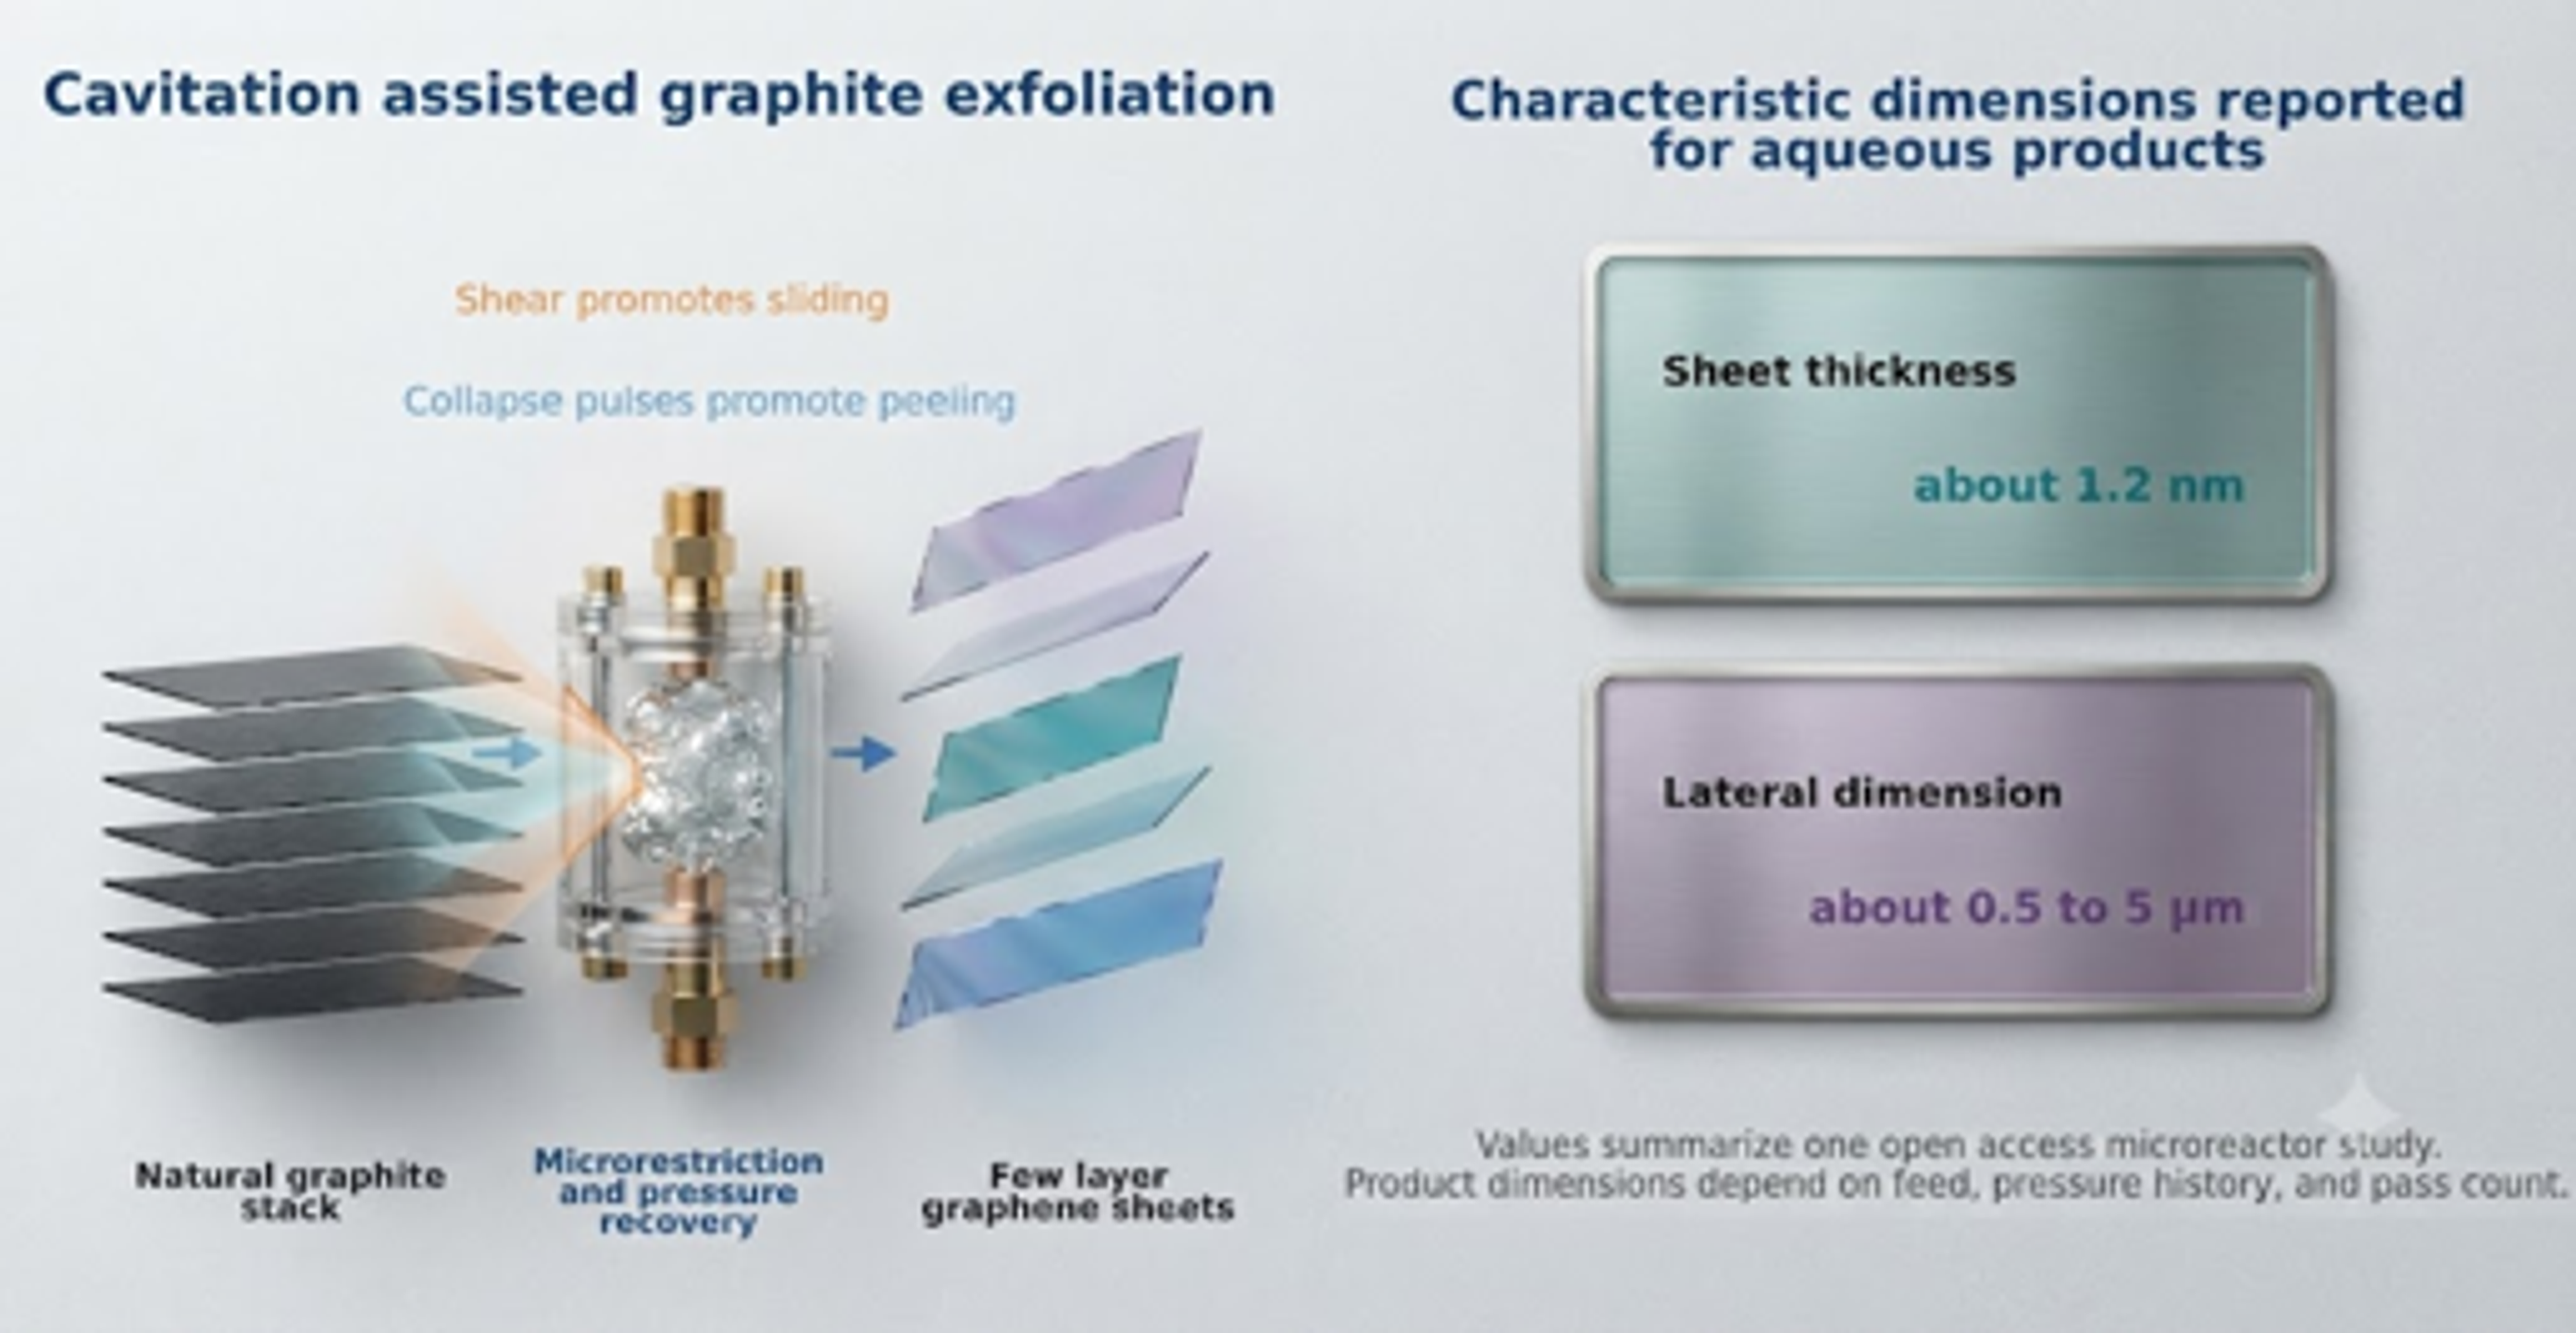
Figure 8.11. Cavitation assisted graphite exfoliation mechanism and reported characteristic dimensions of aqueous few-layer graphene products [58].
Qiu and coworkers used a hydrocavitating lab on a chip to exfoliate natural graphite in an aqueous surfactant suspension and reported monolayer and few-layer graphene with lateral dimensions around 300 nm [31]. Jafarpour and coworkers later described aqueous exfoliation of natural graphite in a microfluidic cavitation reactor without surfactant and reported sheets with thickness near 1.2 nm and lateral dimensions from approximately 0.5 to 5 micrometers [33]. The desired product is a thin sheet with preserved lateral size and low defect density. Overprocessing can reduce lateral size or introduce defects, so thickness, lateral dimension, Raman response, diffraction, and defect density should be measured together.
8.9 Pharmaceutical wet milling and crystallization
The supplied data compare cavitation processing conditions for naproxen in water containing hydroxypropyl cellulose and sodium lauryl sulfate [1]. The control had micrometers and micrometers. A CP300 condition at 2,500 psi and approximately 50.7 cumulative passes produced micrometers and micrometers. A LEWA condition at 9,000 psi and approximately 204.7 passes produced micrometers and micrometers.
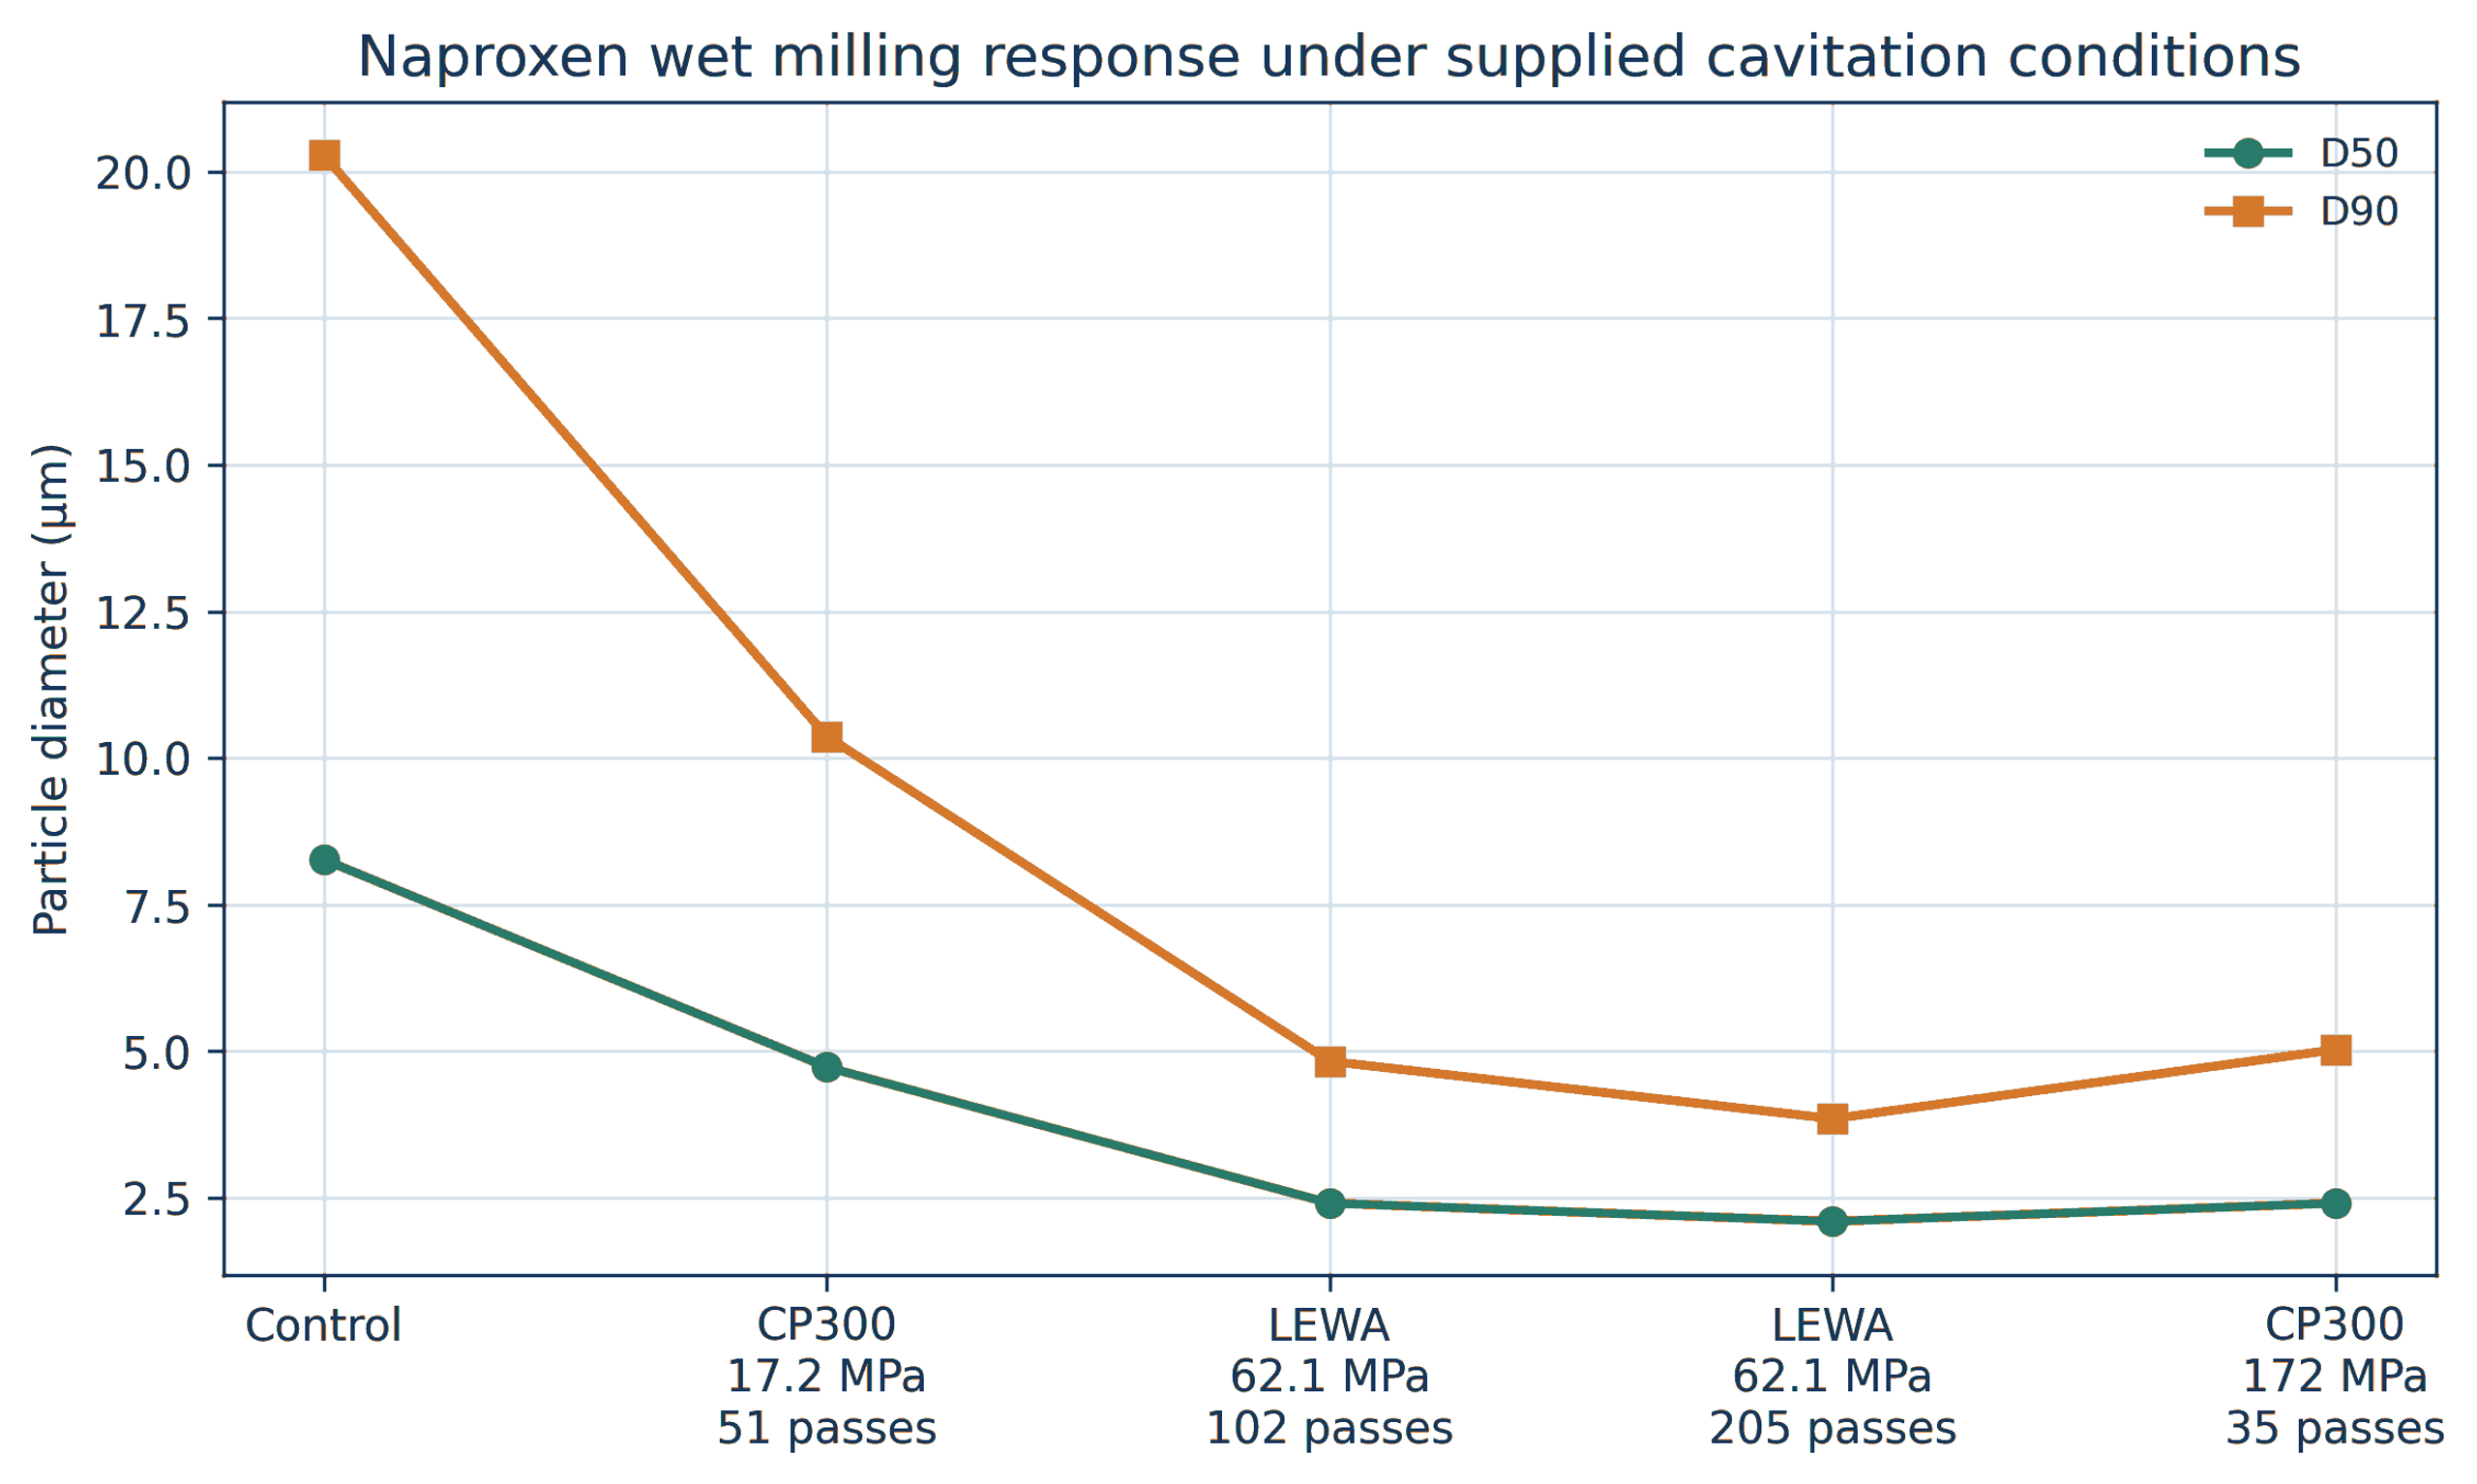
Figure 8.12. Naproxen median and upper tail particle sizes under supplied wet milling conditions [1].
Pressure alone did not determine performance. The 9,000 psi LEWA condition with greater cumulative exposure produced a smaller upper tail than the 25,000 psi CP300 condition with fewer passes. Geometry, local stress, pass distribution, and cumulative exposure must be considered together.
Tiwari and coworkers compared hydrodynamic cavitation, ultrasound, and wet milling for paracetamol particle engineering in saturated solution [36]. Their vortex cavitation device produced a larger fine fraction than the comparison methods under the tested conditions and demonstrated that cavitation can be integrated with crystallization rather than used only as a post milling step. Pharmaceutical development must verify polymorphic form, chemical stability, dissolution, excipient integrity, sterility strategy, and metal contamination. General pharmaceutical nanomilling practice also emphasizes stabilizer selection, temperature control, process energy, and verification of solid state form [17].
8.10 Cavitation induced agglomeration in CMP slurries
Cavitation does not always disperse particles. Litchy and coworkers circulated fumed silica, colloidal silica, alumina, and ceria chemical mechanical planarization slurries through several pump types [37]. When inlet pressure was reduced while nominal shear remained similar, some formulations developed a larger coarse particle population. The effect was especially pronounced for fumed silica and depended strongly on formulation.
Possible mechanisms include collapse-induced compaction, damage to stabilizing surface layers, gas-liquid interface effects, local concentration gradients, intense collisions, and rapid reattachment of fresh surfaces. The practical lesson is that higher cavitation intensity is not automatically better. Every formulation has a process window.
Table 8.4. Summary of selected quantitative case studies.
| Material | Starting condition | Reported cavitation result | Dominant interpretation | Source |
|---|---|---|---|---|
| ZnO | Mean agglomerate size 16.73 µm | 0.50 µm after one pass and 0.27 µm after ten passes | Predominantly deagglomeration | [1,2] |
| Bentonite, 5 wt% | Mean 567.4 nm | 275.8 nm after one pass at 103.42 MPa | Tactoids and cluster disruption | [1,2] |
| Nanosilver | µm | µm | Strong coarse tail elimination | [2,26] |
| Soy slurry, coarse feed | µm | µm at 6500 psi and four passes | Cell and particle disruption plus narrowing | [29] |
| Heated titania nanofluid | Mean 1281 nm | 164 nm at 7 MPa | Deagglomeration | [24] |
| Silicon | Feed maximum near 100 µm | Cavitating nozzle output median 32 nm | Cavitation, shear, impact, and classification | [30] |
| Graphite | Natural graphite flakes in water | Few layer graphene nanosheets; sheet thickness near 1.2 nm and lateral size about 0.5 to 5 micrometers in one study | Exfoliation with thickness reduction | [31,33] |
| CMP fumed silica | Stabilized polishing slurry | Coarse particle population increased | Cavitation assisted agglomeration | [37] |
8.11 Iron oxide in water and mixed solvent media
An internal test processed a 5 wt% iron oxide suspension in distilled water through a CP300 system fitted with elements 12 and 14. The feed hopper was agitated at 800 rpm, the operating pressure was 5,000 psi (34.47 MPa), the bulk temperature was held at 25 °C, and the material was recirculated for 40 minutes, corresponding to slightly more than 16 nominal passes. The reported mean equivalent diameter decreased from 160.23 µm to 8.6 µm, while optical transmittance increased from 81.7 to 90.0 percent [48]. The diameter reduction was 94.6 percent. Because no microscopy or crystallite measurement was reported, the data establish a reduction in suspended object size but do not distinguish weak agglomerate separation from aggregate or crystal fracture.
For comparison among different feeds, a useful descriptive quantity is the deagglomeration factor:
where Fd is the deagglomeration factor, dx,0 is the initial value of a specified particle size metric, and dx, f is its final value. For the water-based iron oxide test, Fd = 18.6. The factor is a reporting metric, not a mechanistic constant, and it is valid only when the same analytical method and weighting basis are used before and after processing.
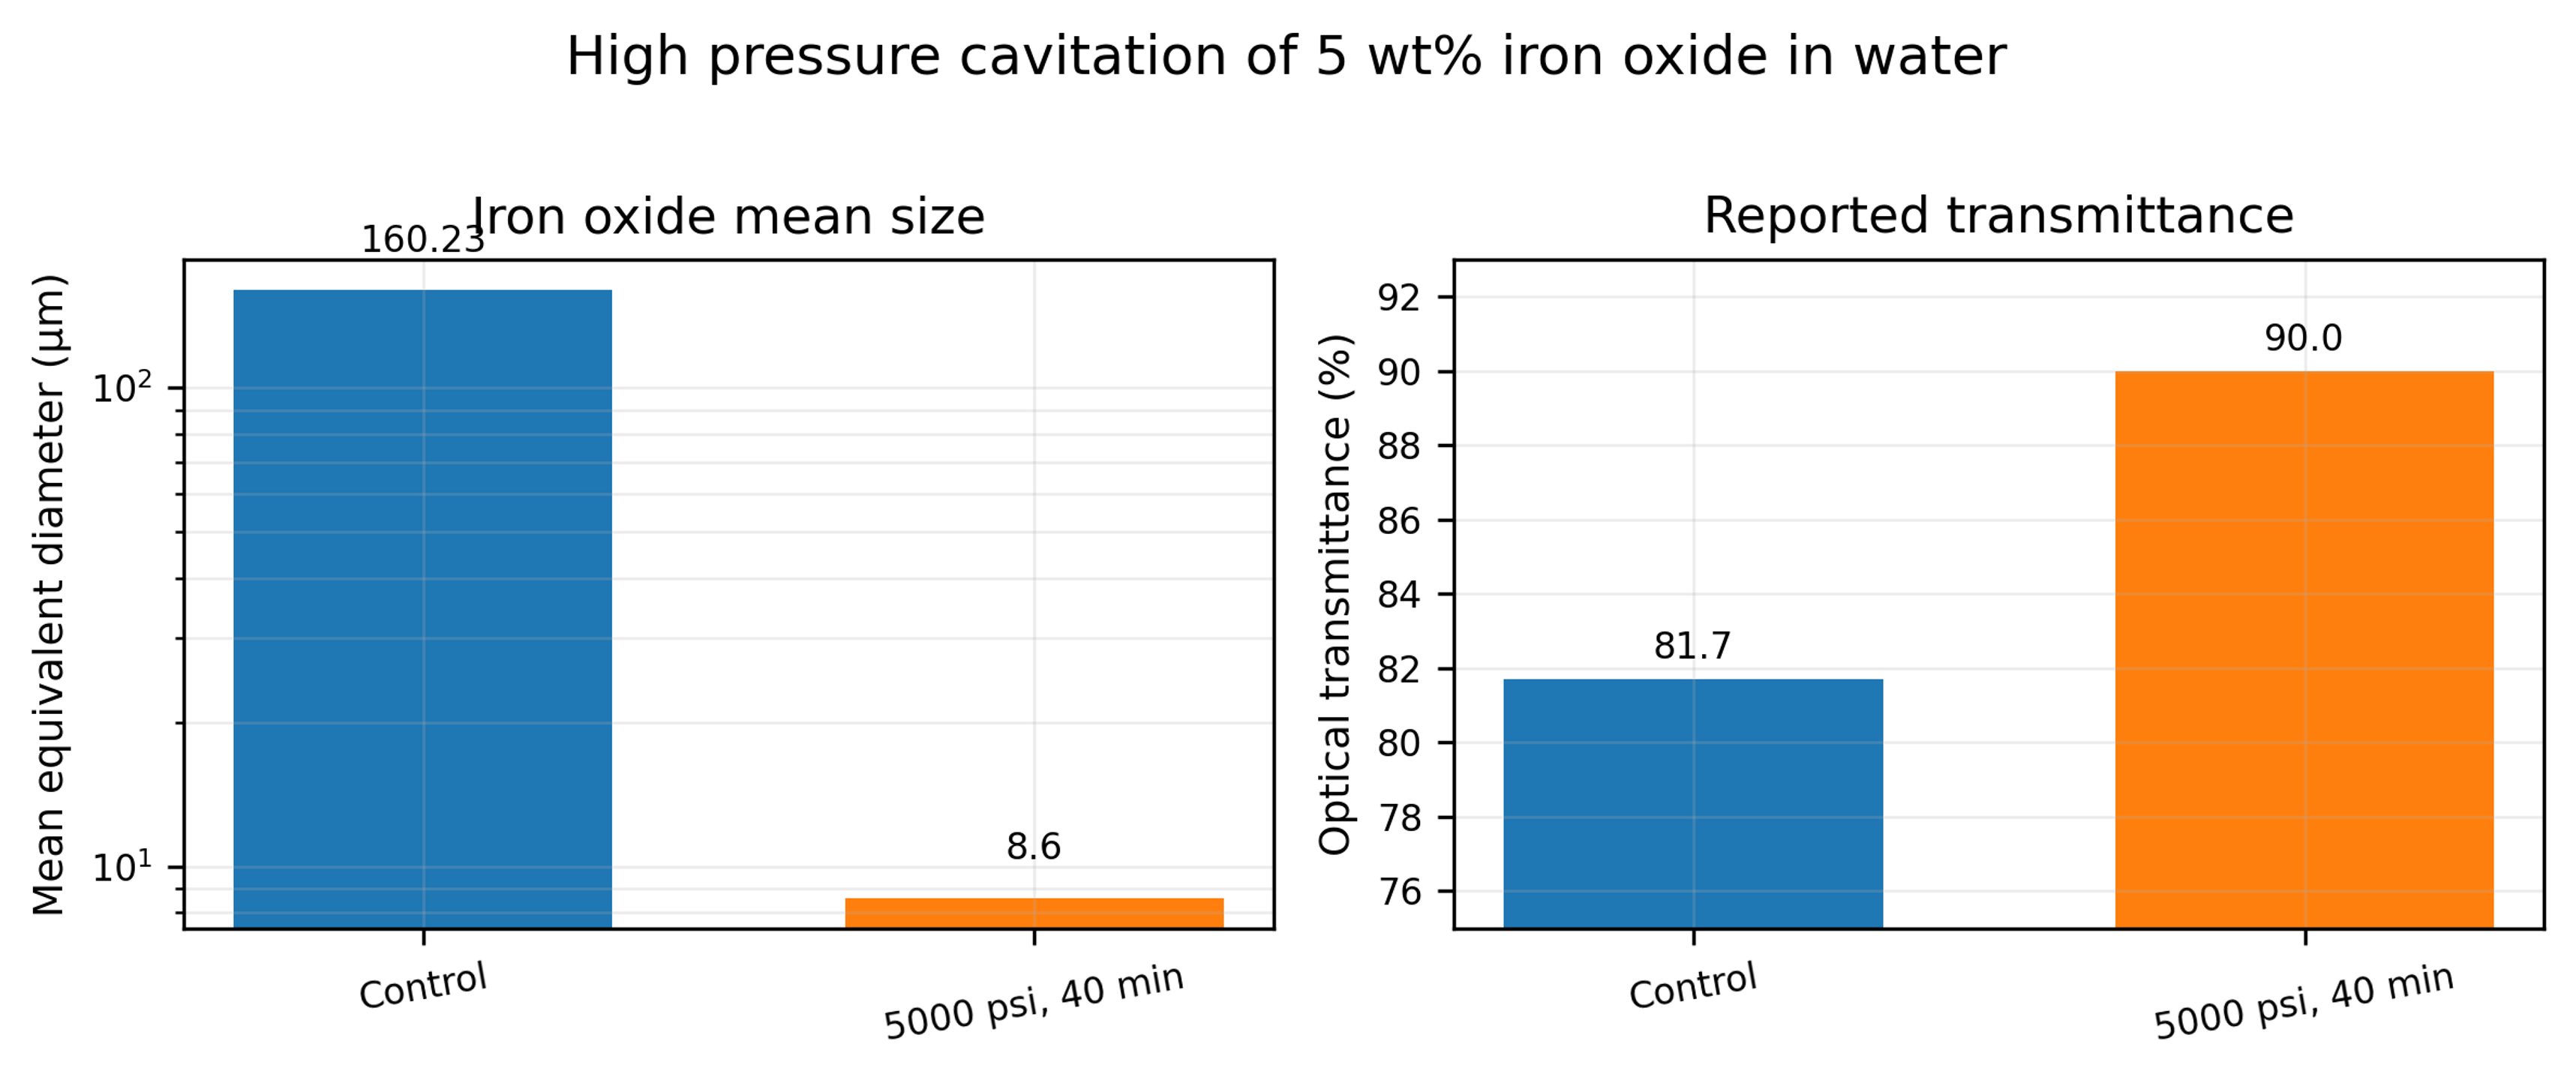
Figure 8.13. Mean size and optical transmittance reported for 5 wt% iron oxide in water before and after 40 minutes at 5,000 psi [48].
Another data sheet describes iron oxide dispersed in a toluene and water mixture. Five passes through an M 110Y processor at 23,000 psi reduced the reported mean size from approximately 750 nm to 71 nm [49]. The sheet prints 15.86 MPa beside 23,000 psi; the correct pressure conversion is 158.6 MPa. This correction is important because pressure based energy and scale calculations would otherwise be low by a factor of ten.
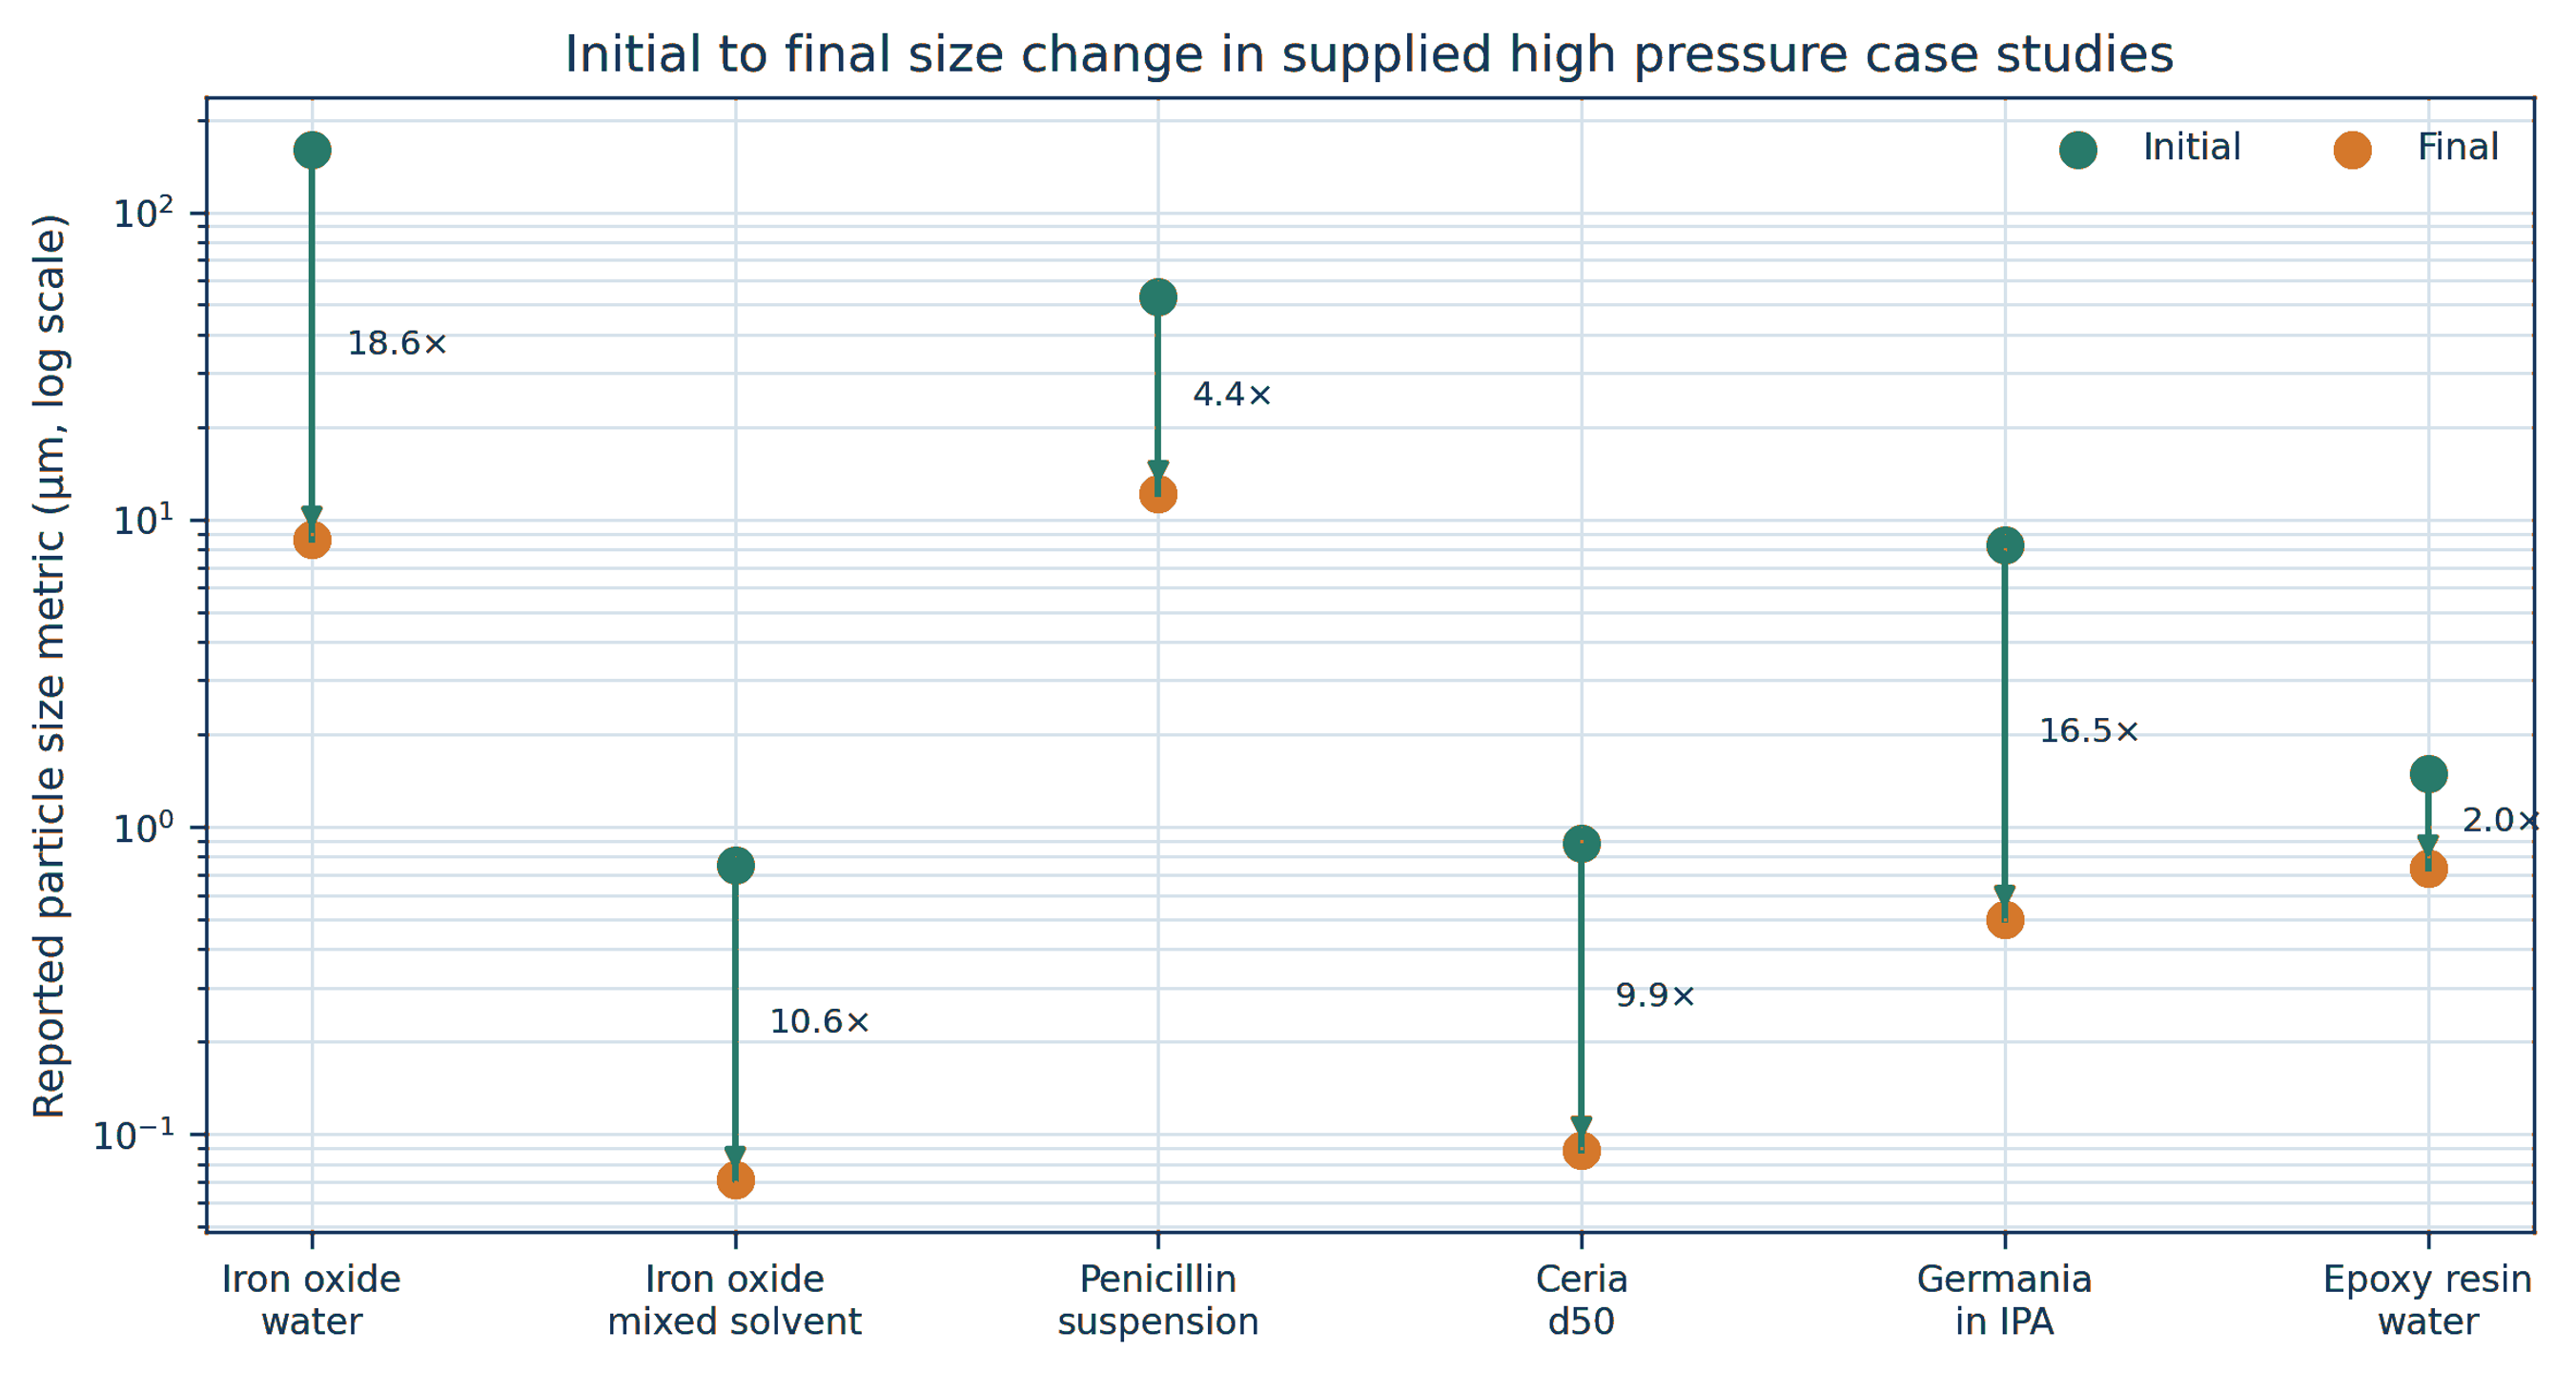
Figure 8.14. Initial and final size metrics for selected supplied high-pressure case studies. Vertical arrows show the direction of size reduction, and labels show the deagglomeration factor defined by Equation (8.1) [48-54].
Table 8.5 summarizes the principal operating conditions and reported results. Pressure and pass count alone do not explain the different responses because feed strength, solids concentration, liquid viscosity, chamber geometry, and analytical basis vary substantially.
Table 8.5. Selected high pressure particle processing results from supplied reports.
| Material and medium | Solids | Pressure | Exposure | Initial metric | Final metric | Reduction | Source type |
|---|---|---|---|---|---|---|---|
| Iron oxide in water | 5 wt% | 34.47 MPa; 5,000 psi | 40 min; about 16 passes | Mean 160.23 µm | Mean 8.6 µm | 94.6% | Internal report [48] |
| Iron oxide in toluene and water | Not stated | 158.6 MPa; 23,000 psi | 5 passes | Mean 0.750 µm | Mean 0.071 µm | 90.5% | Manufacturer sheet [49] |
| Penicillin suspension | Not stated | 124.1 MPa; 18,000 psi | 1 pass | Mean 53 µm | Mean 12.1 µm | 77.2% | Manufacturer sheet [50] |
| Ceria in water, pH about 2.5 | 12 wt% | 158.6 MPa; 23,000 psi | 2 passes | d50 0.885 µm | d50 0.089 µm | 89.9% | Manufacturer test report [51] |
| Germania in isopropyl alcohol | 10 wt% | 158.6 MPa; 23,000 psi | 1 pass | Mean 8.301 µm | Mean 0.502 µm | 94.0% | Manufacturer sheet [52] |
| Bisphenol epoxy resin in water | 60 wt% | 68.95 MPa; 10,000 psi | 15 passes | Mean 1.486 µm | Mean 0.733 µm | 50.7% | Manufacturer sheet [54] |
8.12 Ceria and germania oxide systems
Additional ceria data provide a useful distinction between pressure response and pass response. A 12 wt% ceria slurry at pH about 2.5 had initial D₁₀, D₅₀, and D₉₀ values of 0.301, 0.885, and 3.100 µm, respectively. At 23,000 psi, the first pass reduced these values to 0.072, 0.098, and 0.180 µm. The minimum reported D₅₀ and D₉₀ values occurred after the second pass, at 0.089 and 0.148 µm, followed by small fluctuations during passes three and four [51]. The result indicates that most weak clusters failed during the first exposure, while the remaining coarse population approached an endpoint controlled by stronger contacts, reattachment, or measurement variation.
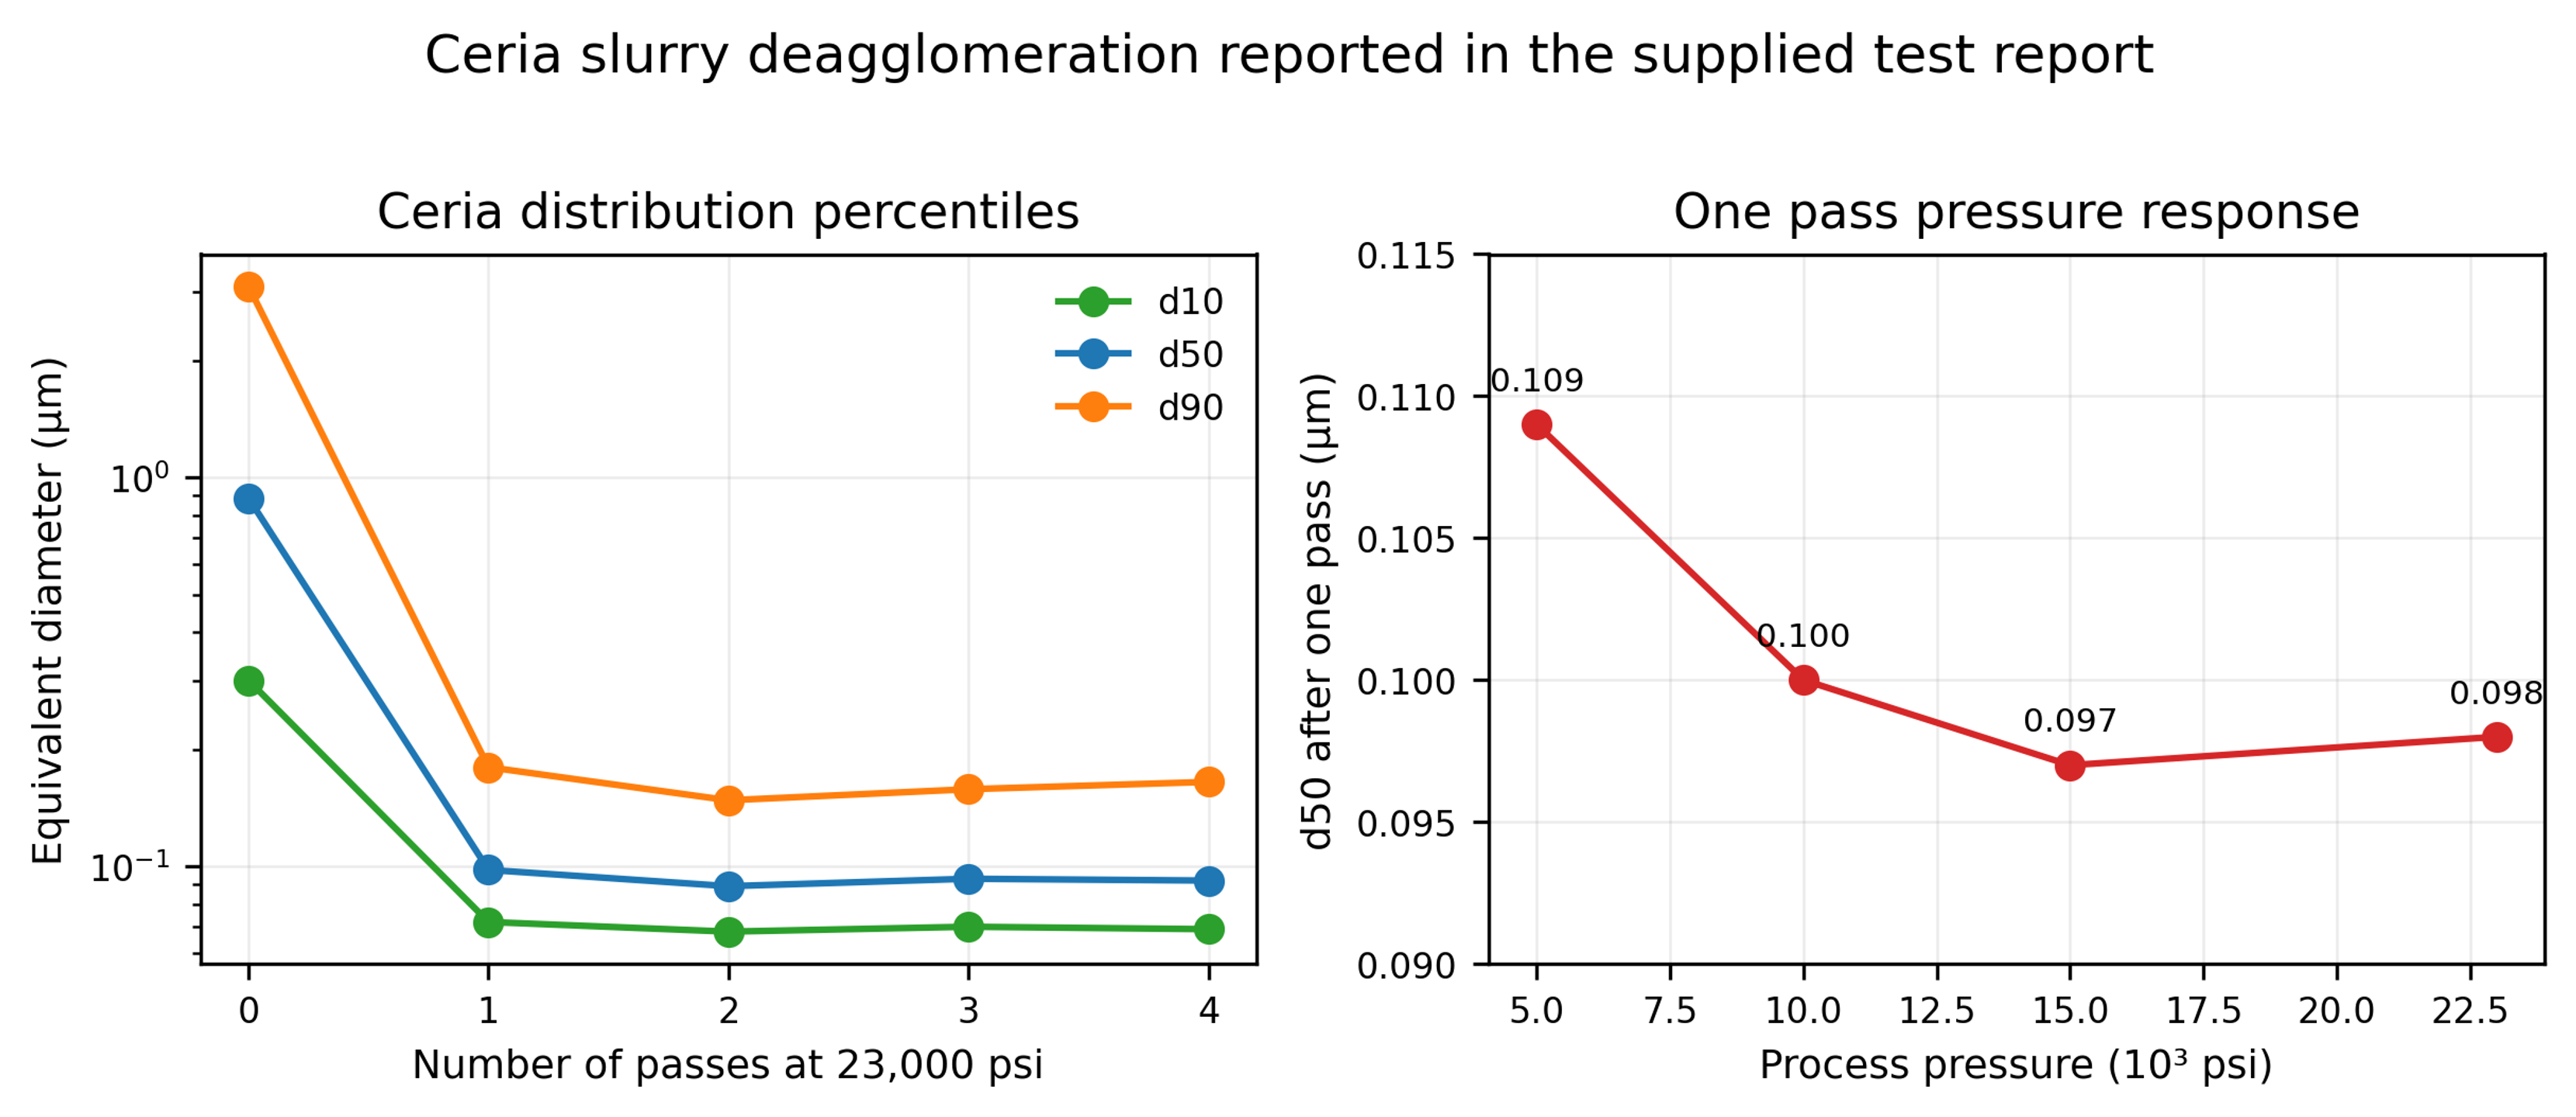
Figure 8.15. Ceria size percentiles versus pass count at 23,000 psi and one pass D₅₀ versus pressure [51].
The one pass median diameter changed only from D₅₀ = 0.109 µm at 5,000 psi to approximately 0.097 to 0.100 µm between 10,000 and 23,000 psi. Thus, once the chamber generated sufficient stress to disrupt the dominant agglomerates, further pressure increase produced limited additional change in the median. The upper tail and product damage should be monitored before selecting the highest pressure.
Table 8.6. Ceria particle size results. [51].
| Pressure | Passes | (µm) | (µm) | (µm) |
|---|---|---|---|---|
| Control | 0 | 0.301 | 0.885 | 3.100 |
| 23,000 psi | 1 | 0.072 | 0.098 | 0.180 |
| 23,000 psi | 2 | 0.068 | 0.089 | 0.148 |
| 23,000 psi | 3 | 0.070 | 0.093 | 0.158 |
| 23,000 psi | 4 | 0.069 | 0.092 | 0.165 |
| 15,000 psi | 1 | 0.072 | 0.097 | 0.169 |
| 10,000 psi | 1 | 0.074 | 0.100 | 0.171 |
| 5,000 psi | 1 | 0.078 | 0.109 | 0.220 |
The germania data sheet reports a 10 wt% GeO₂ suspension in isopropyl alcohol. One pass at 23,000 psi reduced the mean size from 8.301 to 0.502 µm and D₉₀ from 14.469 to 0.612 µm [52]. The large reduction in both the mean and the coarse tail is consistent with extensive agglomerate disruption or fracture of brittle structures. Processing a flammable solvent at 158.6 MPa requires equipment specifically rated for the solvent, pressure, electrical classification, seal compatibility, and controlled heat removal. The reported result is not a general authorization to process isopropyl alcohol in an arbitrary cavitation unit.
8.13 Pharmaceutical crystals, concentrated resins, and equipment scale
A penicillin suspension processed once at 18,000 psi showed a reported mean size reduction from 53 to 12.1 µm [50]. This response after one pass is useful for preliminary equipment sizing, but pharmaceutical application requires additional verification of assay, polymorphic form, crystal habit, dissolution, sterility or bioburden controls, and excipient stability. A size target alone is not a complete pharmaceutical specification.
The 60 wt% bisphenol epoxy resin and water dispersion responded much more gradually. Fifteen passes at 10,000 psi reduced the reported mean size from 1.486 to 0.733 µm [54]. The modest factor of 2.03 is consistent with the combined effects of high dispersed phase concentration, increased viscosity, restricted bubble growth, and reattachment driven by collisions. In such systems, dilution studies and formulation optimization may be more effective than simply increasing pass count.
Equipment scale should be defined by pressure history, critical passage geometry, chamber material, flow per chamber, cooling capacity, and pass distribution rather than by machine designation alone. Parallel chambers can increase throughput, but every branch must receive the same pressure and must remain free of partial plugging. Abrasive oxide service also requires scheduled inspection of nozzles, seats, intensifier seals, and downstream metal contamination.
8.14 Carbon nanotube bundle separation and aspect ratio control
Carbon nanotubes illustrate the difference between successful deagglomeration and excessive structural damage. A manufacturer data sheet reports that one pass at 23,000 psi separated dense nanotube bundles, whereas 10 and 20 passes progressively shortened the visible nanotube population [53]. The reported chamber shear rate was 5.9 million s⁻¹. The first pass was therefore beneficial for bundle opening, but continued exposure shifted the mechanism toward tube scission and aspect ratio loss.
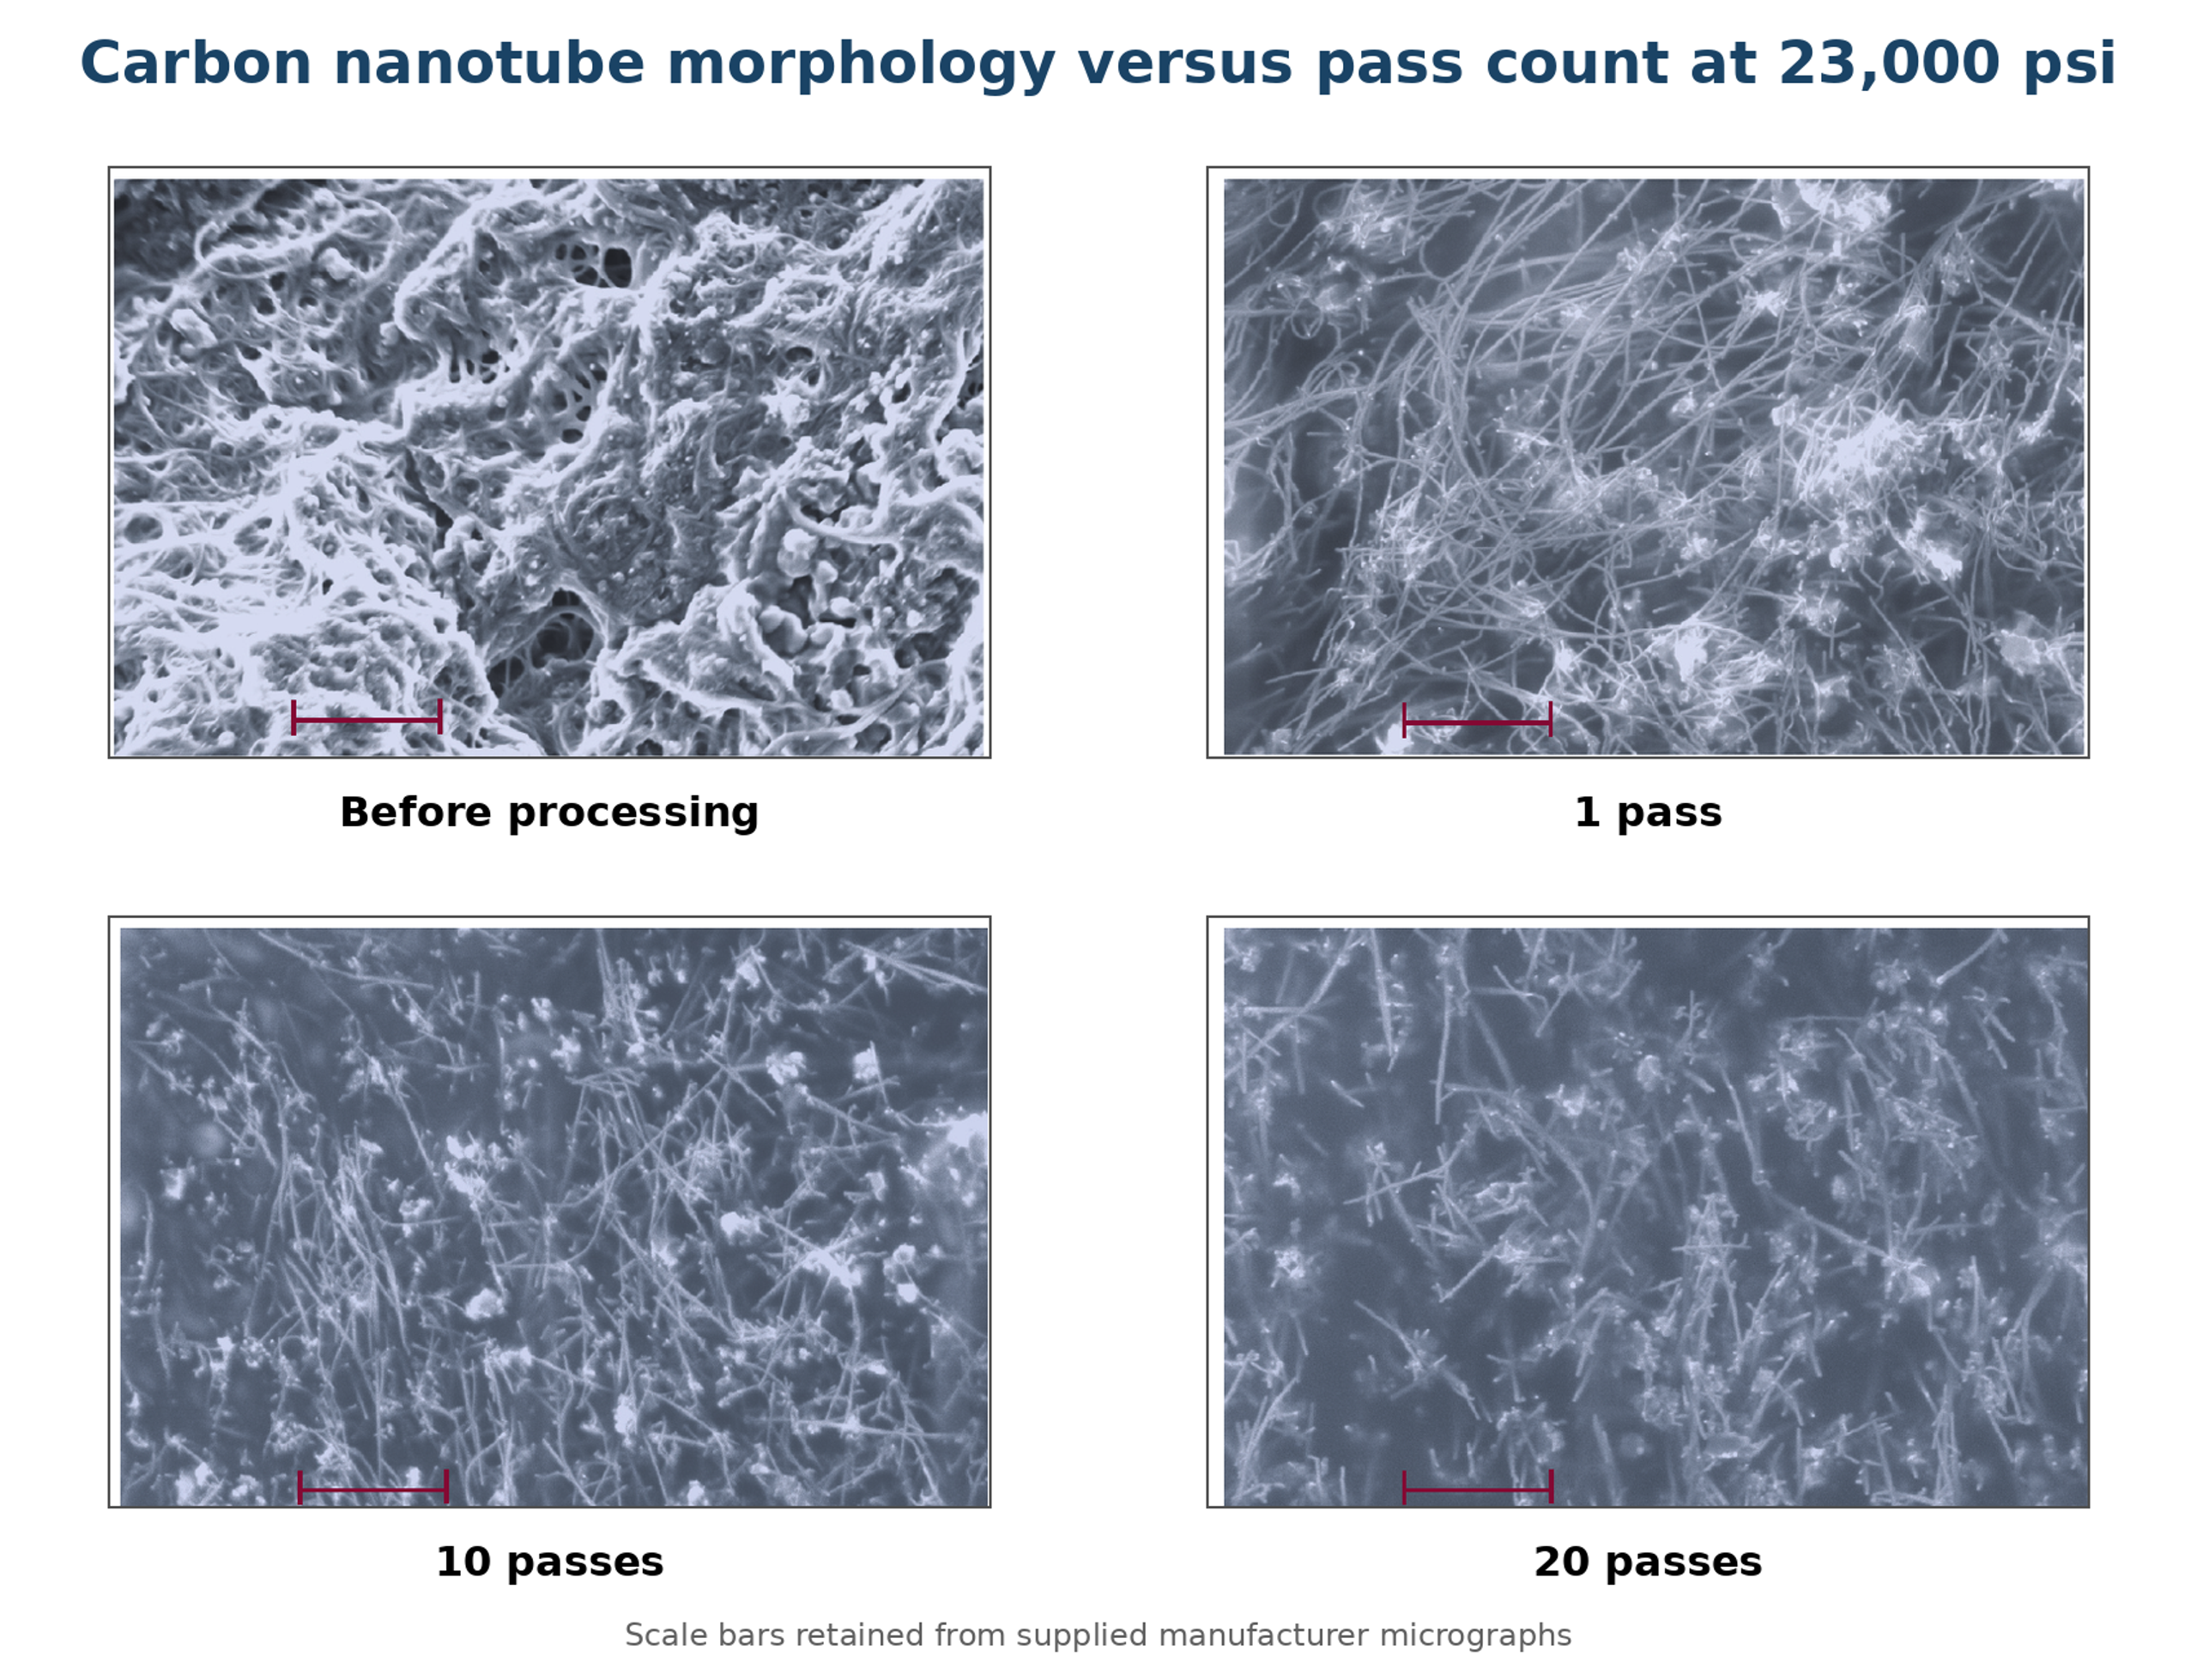
Figure 8.16. Carbon nanotube micrographs before processing and after 1, 10, and 20 passes. One pass opened the bundles, while additional passes shortened the visible nanotubes [53].
A separate article describes a 30 L hydrodynamic cavitation loop for dispersing multilayer carbon nanotubes in water containing a polycarboxylate superplasticizer. The reported flow was 1.15 L s⁻¹, motor power was 3 kW, treatment time was 60 minutes, and the suspension completed approximately 100 to 105 cycles through a passive cavitation disperser [56]. The resulting liquid was used to prepare concrete containing nanotubes at 0.05 percent of cement mass.
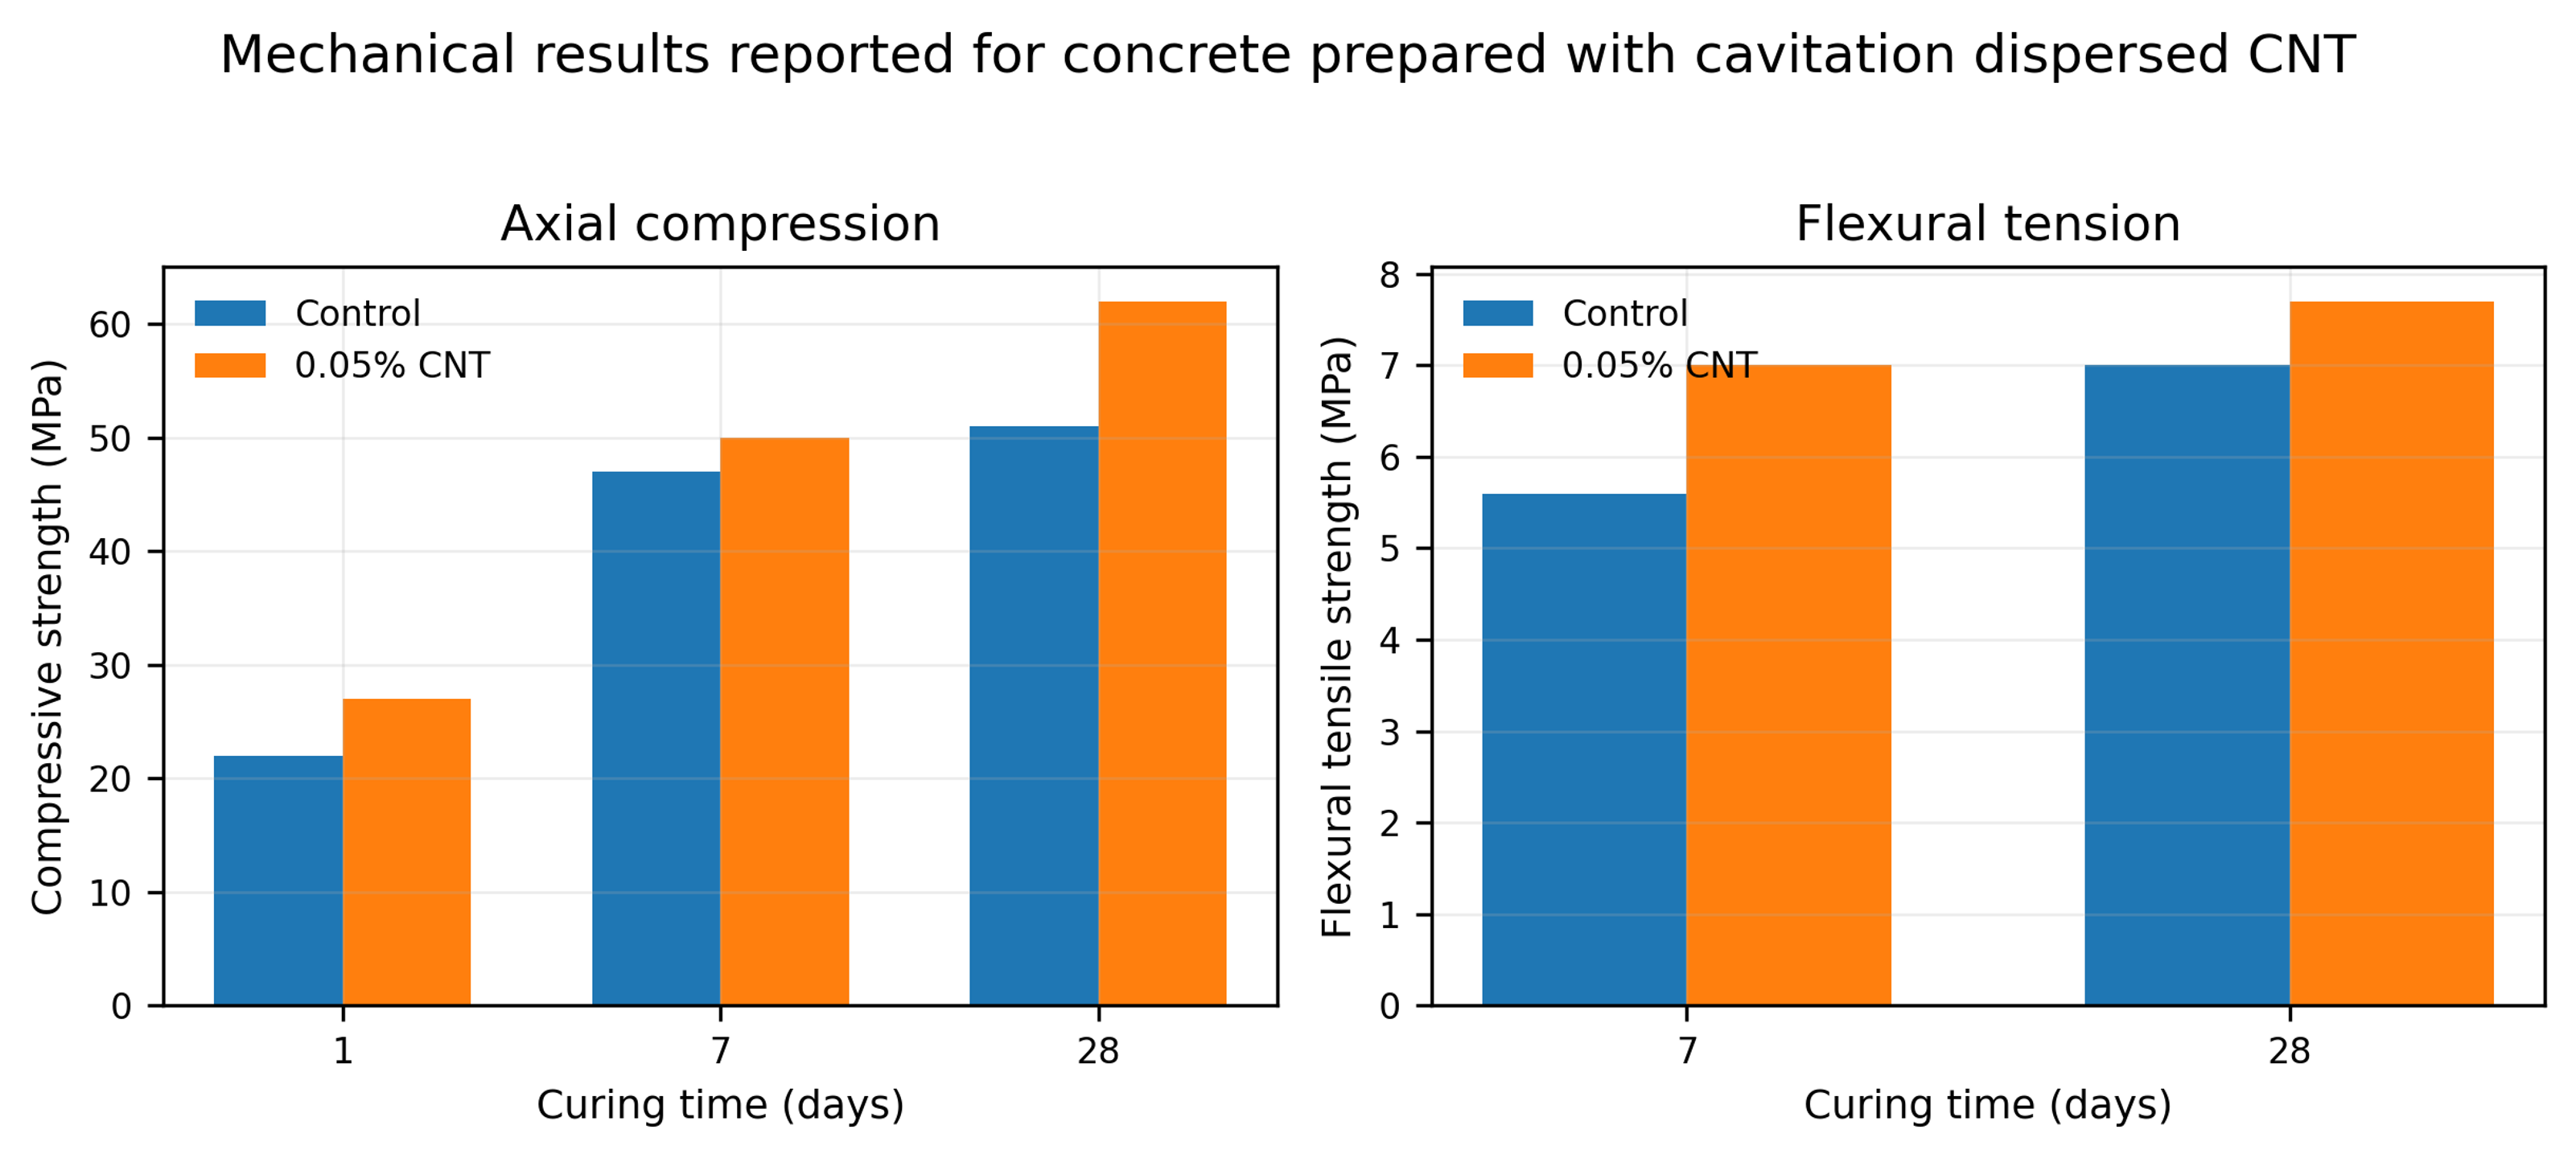
Figure 8.17. Mechanical results reported for concrete prepared with cavitation dispersed carbon nanotubes [56].
Table 8.7. Reported concrete strength with and without 0.05 percent carbon nanotubes. [56].
| Mixture | Compressive 1 day (MPa) | Compressive 7 days (MPa) | Compressive 28 days (MPa) | Flexural 28 days (MPa) |
|---|---|---|---|---|
| Control | 22 | 47 | 51 | 7.0 |
| 0.05% CNT | 27 | 50 | 62 | 7.7 |
At 28 days, the reported compressive strength increased from 51 to 62 MPa and flexural strength increased from 7.0 to 7.7 MPa. These results are consistent with improved nanotube distribution, but the nanotube addition itself, superplasticizer interactions, curing, air content, and batch variability also affect strength. A rigorous validation should include dispersion microscopy, rheology, replicate specimens, and a control prepared with the same dispersant and processing history but without nanotubes.
8.15 Plant raw materials, controlled comminution, and mass transfer area
Vitenko and Zaretska studied white and black mulberry leaves in a static cavitation device consisting of a circulation loop and a Venturi type working section with an adjustable truncated cone. Ground leaves and extractant were charged at a mass ratio of 1 to 10 and processed for 2, 5, 10, 15, or 20 minutes [55]. The objective was to increase the solid-liquid mass transfer area enough to accelerate extraction without producing excessive fines that increase turbidity and complicate separation.
The authors represented the measured particle diameter distribution by a normal density function:
where f(d) is the relative density of particle diameters, d is particle diameter in millimeters, is the fitted mean diameter, and is the fitted standard deviation. For the reported material and operating range, the time dependence was approximated by:
where τ is the cavitation processing time in minutes. These empirical relations apply only to the specified mulberry feed, pretreatment, liquid ratio, and device. They should not be extrapolated beyond the 0 to 20 minute test interval without new measurements.
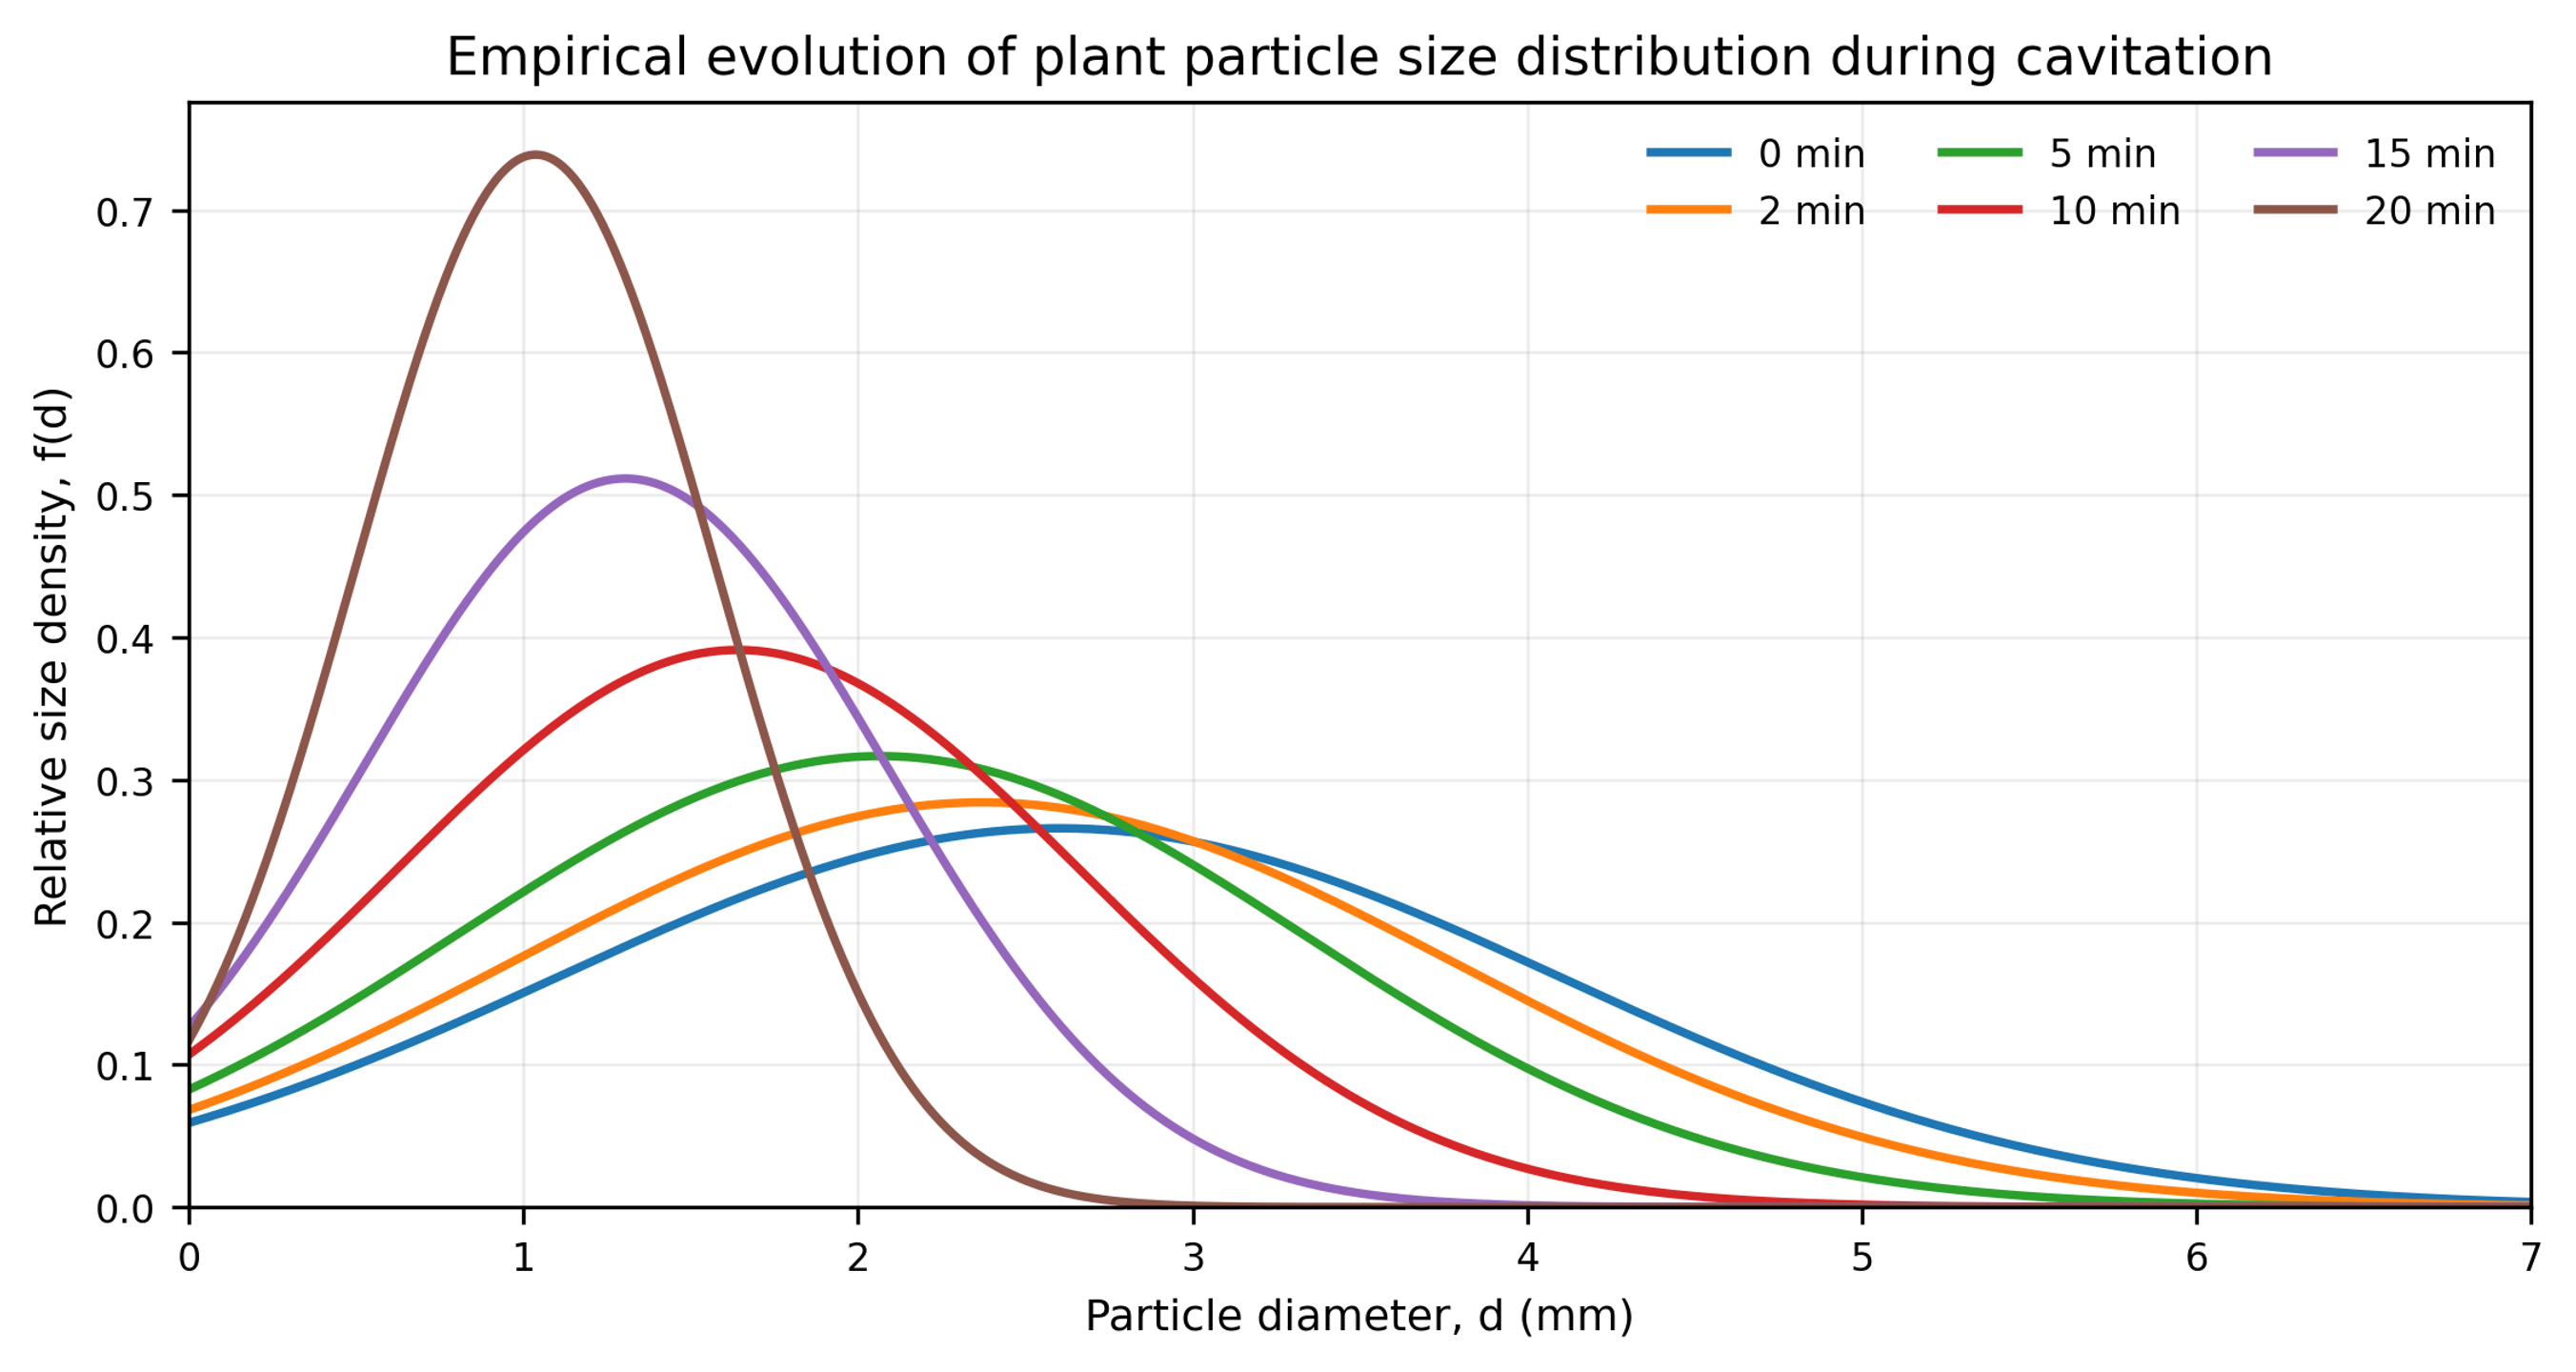
Figure 8.18. Empirical evolution of the plant particle diameter distribution calculated from Equations (8.2) to (8.4) [55].
The strongest surface development occurred at Re = 1.45 × 10⁵ and λ = 2.5. After 20 minutes, the reported mass transfer area increased from 3.62 to 6.92 m² for black mulberry and from 3.16 to 5.55 m² for white mulberry. These changes correspond to area increases of approximately 91 and 76 percent. At λ = 0.5, comminution was limited, whereas λ = 6 produced less surface area than the intermediate stage. The nonmonotonic response is consistent with a change from productive collapse to an overdeveloped cavity field, shielding, or altered residence in the most effective collapse zone.
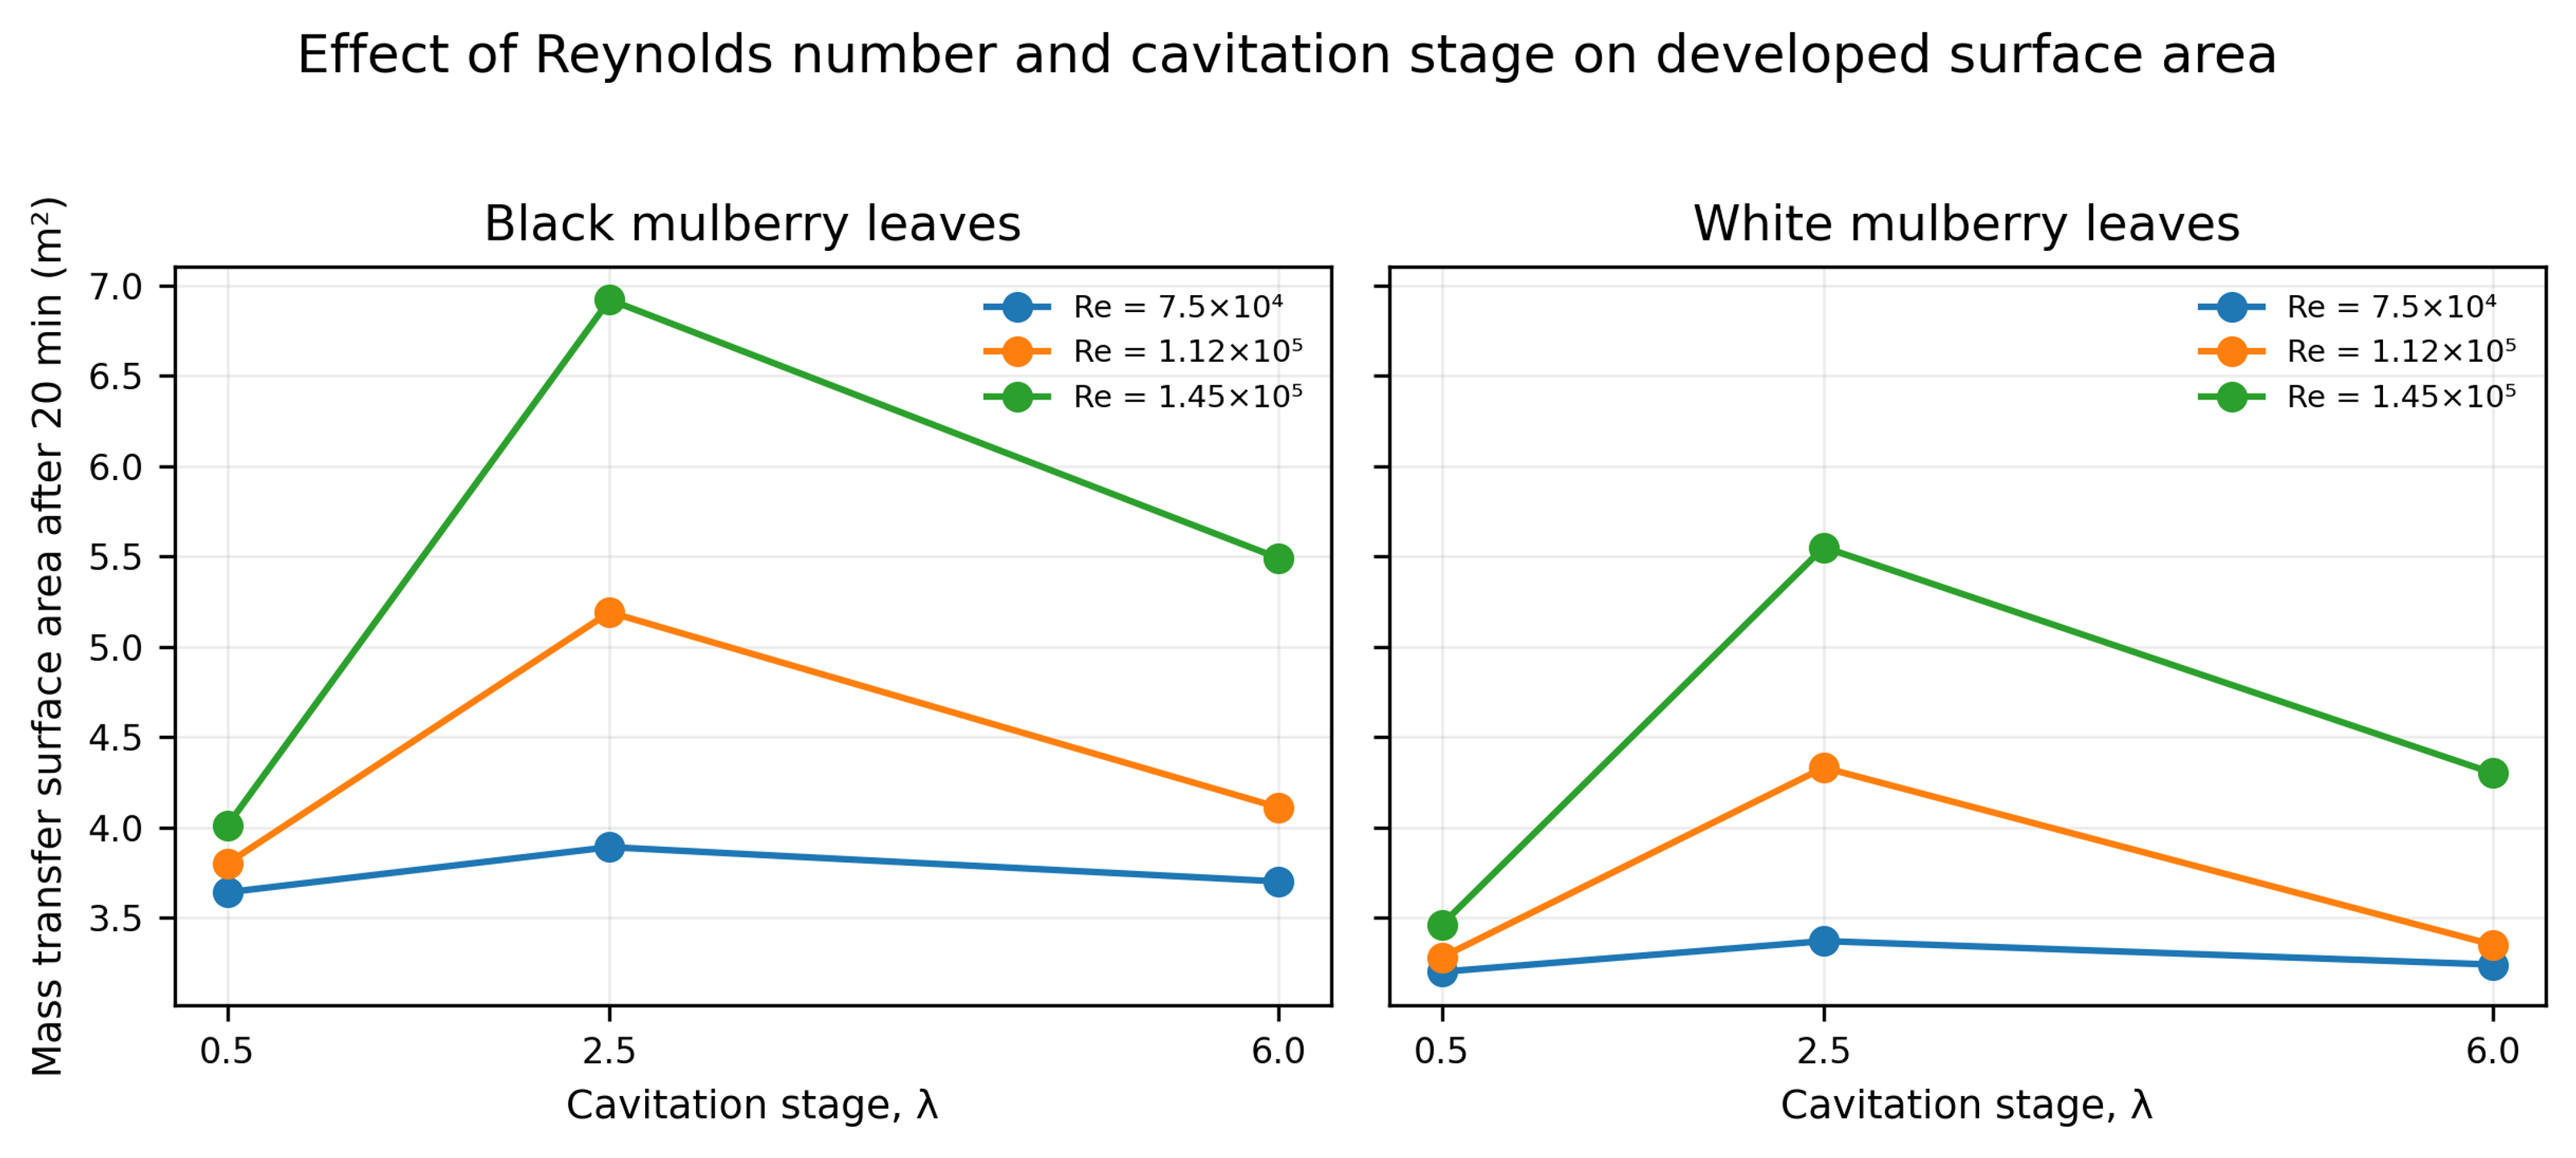
Figure 8.19. Final mass transfer surface area after 20 minutes as a function of Reynolds number and cavitation stage for black and white mulberry leaves [55].
Table 8.8. Change in plant mass transfer surface area after 20 minutes. Source: [55].
| Reynolds number | Cavitation stage λ | Black mulberry, m² | Black area ratio | White mulberry, m² | White area ratio |
|---|---|---|---|---|---|
| 7.5 × 10⁴ | 0.5 | 3.62 to 3.64 | 1.01 | 3.16 to 3.20 | 1.01 |
| 7.5 × 10⁴ | 2.5 | 3.62 to 3.89 | 1.07 | 3.16 to 3.37 | 1.07 |
| 7.5 × 10⁴ | 6 | 3.62 to 3.70 | 1.02 | 3.16 to 3.24 | 1.03 |
| 1.12 × 10⁵ | 0.5 | 3.62 to 3.80 | 1.05 | 3.16 to 3.28 | 1.04 |
| 1.12 × 10⁵ | 2.5 | 3.62 to 5.19 | 1.43 | 3.16 to 4.33 | 1.37 |
| 1.12 × 10⁵ | 6 | 3.62 to 4.11 | 1.14 | 3.16 to 3.35 | 1.06 |
| 1.45 × 10⁵ | 0.5 | 3.62 to 4.01 | 1.11 | 3.16 to 3.46 | 1.09 |
| 1.45 × 10⁵ | 2.5 | 3.62 to 6.92 | 1.91 | 3.16 to 5.55 | 1.76 |
| 1.45 × 10⁵ | 6 | 3.62 to 5.49 | 1.52 | 3.16 to 4.30 | 1.36 |
The article also reports that formation of particles below 1 mm increased liquid turbidity and complicated clarification. This is a practical reminder that the optimum extraction condition may be below the condition that maximizes newly created area. Product recovery, filtration, centrifugation, and sensory or optical quality must be included in the optimization criterion.
8.16 Cross case interpretation and endpoint selection
Many data sets that vary with pass count can be described empirically by an asymptotic endpoint model:
where dₓ(N) is the selected size metric after N passes, dₓ,∞ is the asymptotic value for the specified formulation and device, and kₓ is an empirical pass response constant. The equation is not a universal breakage law. It is a compact way to quantify the large first pass change, declining incremental benefit, and practical endpoint observed for ZnO, ceria, soy solids, and other feeds.
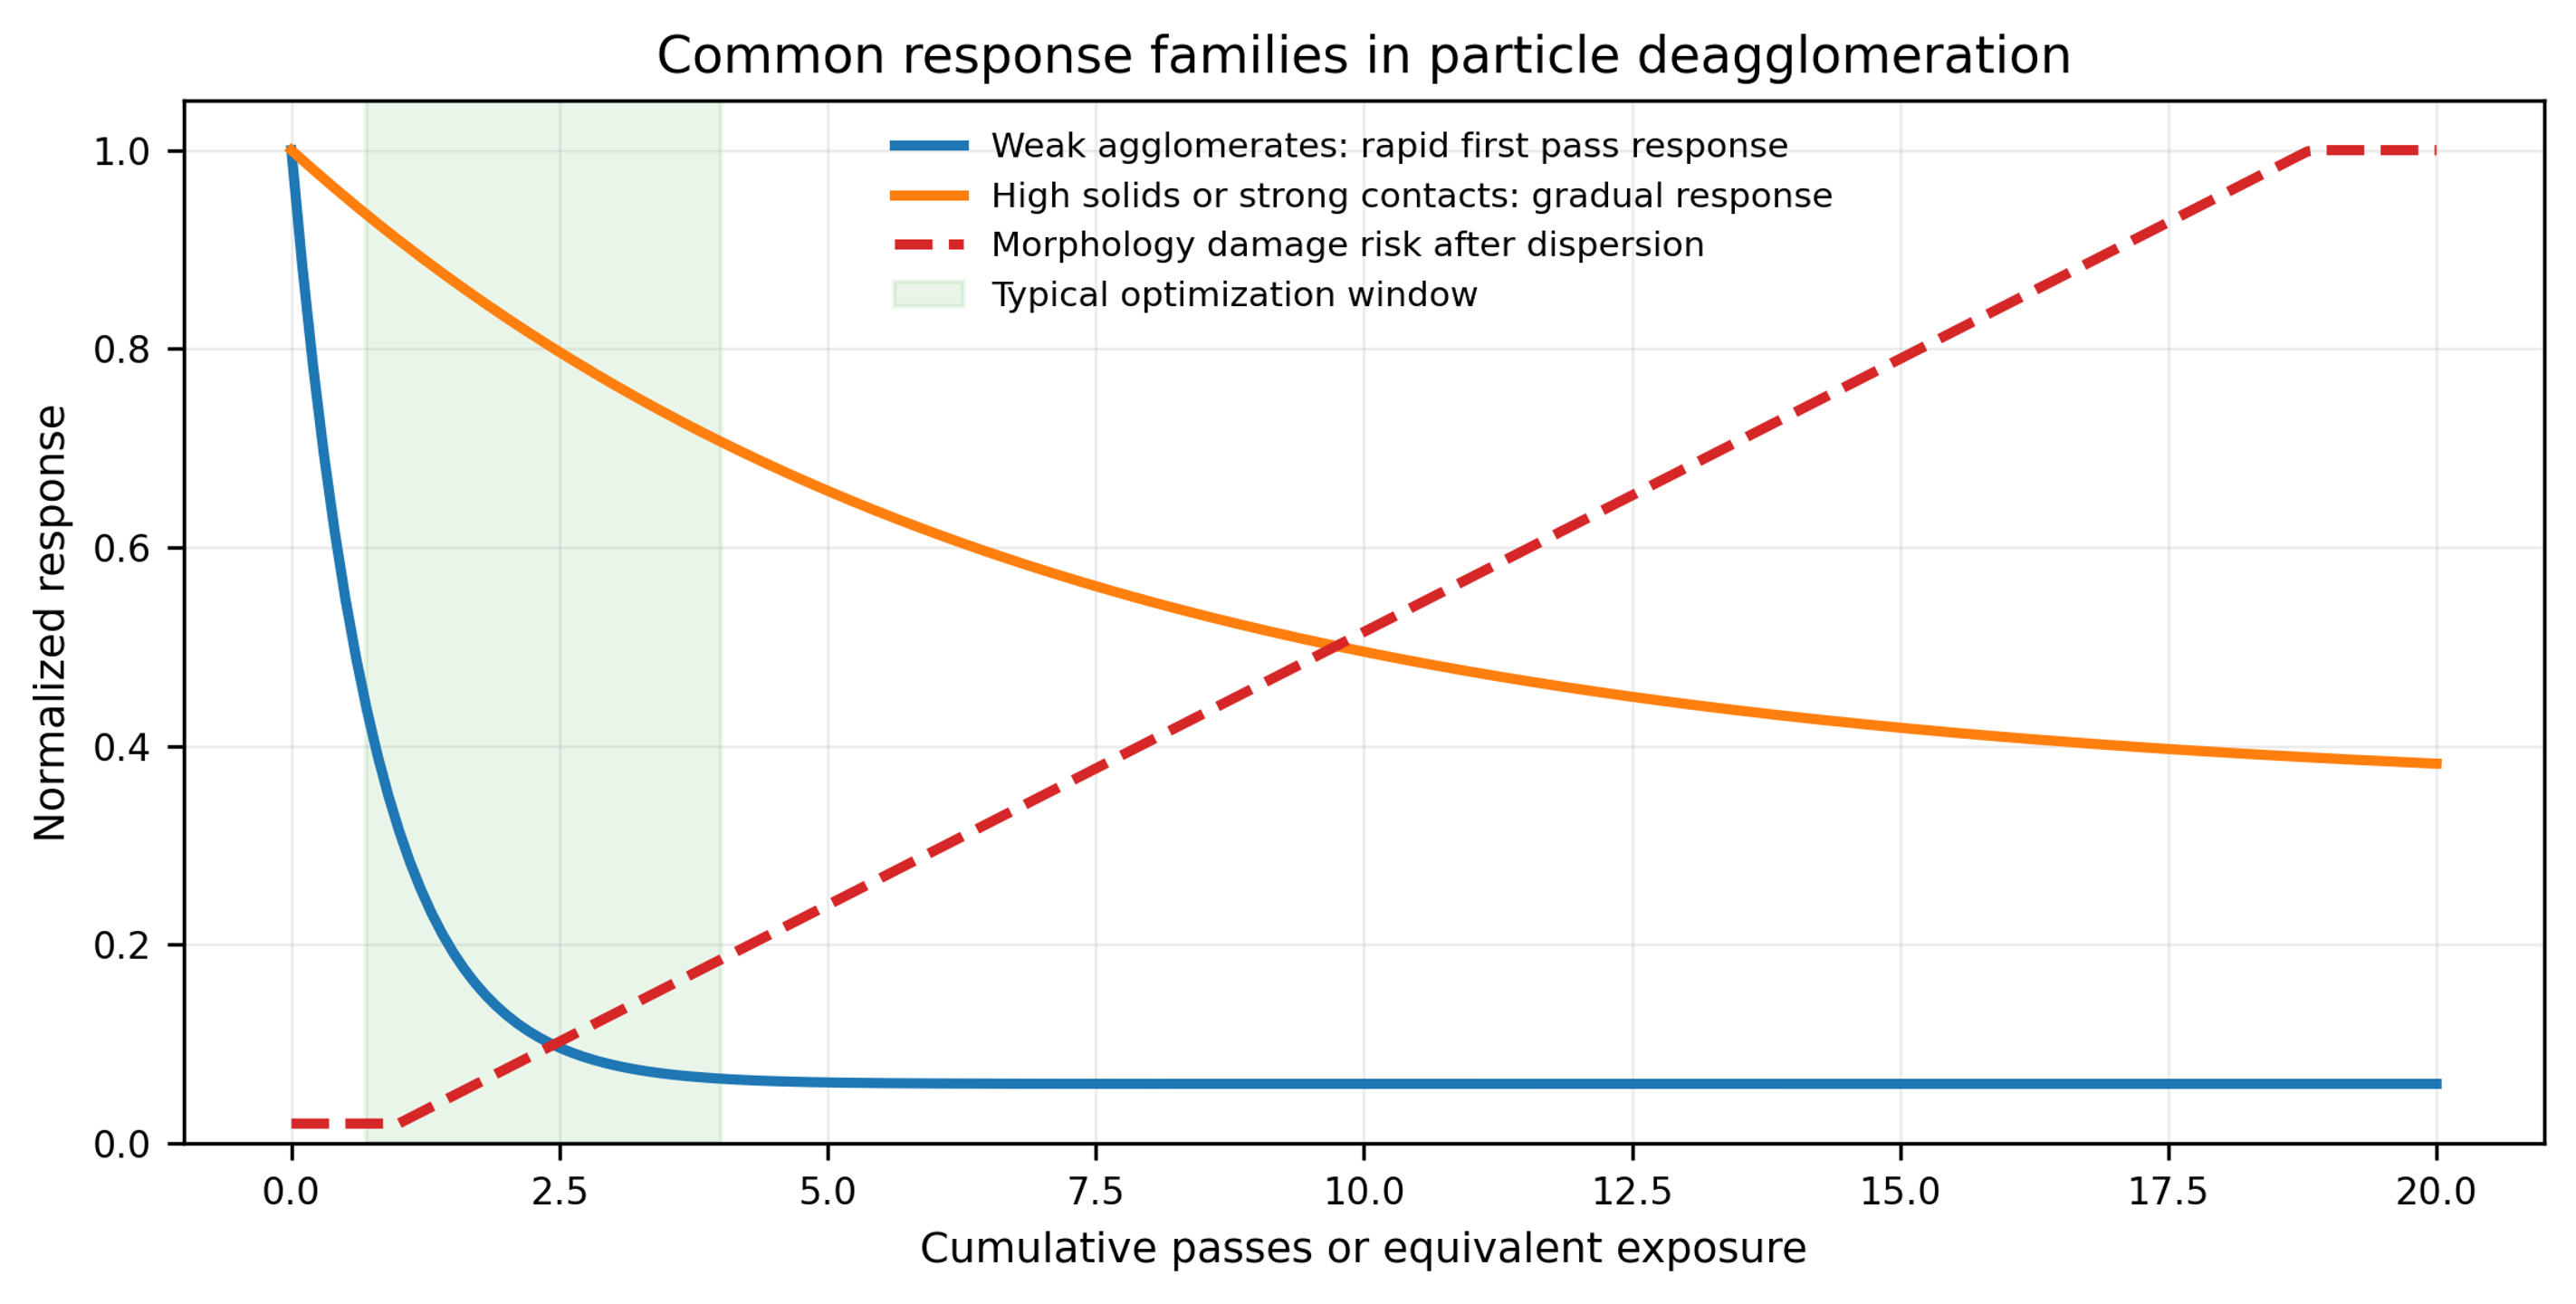
Figure 8.20. Common response families in particle deagglomeration. Weak agglomerates may show a rapid first pass response, concentrated or strongly bonded systems may respond gradually, and morphology damage risk can increase after the dispersion objective has already been reached [58].
Across the supplied cases, four recurring conclusions emerge. First, the first effective pass often removes most weak agglomerates. Second, high solids loading and viscosity can shift the process toward gradual erosion and repeated exposure. Third, the median may reach a plateau while the coarse tail or morphology continues to change. Fourth, carbon nanotube, fiber, and flake systems require an explicit aspect ratio or length specification because additional processing can improve dispersion while simultaneously degrading function. The process endpoint should therefore be determined from particle size, coarse particle count, aged stability, rheology, morphology, contamination, and application performance rather than from pressure or pass count alone.