
Technical publication
Back to publications
Reactors & equipment
Cavitation-Assisted Particle Dispersion
okozyuk.com
Published
Read complete publication for whole-document Find and printing. Browser Find and native printing on this reader include only loaded content.
2 Particle structure and process objectives
2.1 Primary particles, aggregates, agglomerates, and flocs
The terms primary particle, crystallite, aggregate, agglomerate, and floc describe distinct levels of particulate structure. Although these terms are often used inconsistently, the distinction determines the stress required for breakup and the interpretation of particle-size data.
A primary particle is the smallest discrete solid object relevant to the process. It may be a single crystal, a polycrystalline grain, a platelet, a flake, a fiber, a hollow sphere, or an irregular fragment. Crystallite is a coherent diffraction domain and may be smaller than a polycrystalline primary particle. An aggregate consists of primary particles joined by strong necks, sintered contacts, covalent bonds, siloxane bonds, or other contacts that are not readily reversible in the liquid. An agglomerate is a larger cluster held mainly by weaker van der Waals attraction, capillary bridges, electrostatic attraction, polymer bridging, or mechanical interlocking. A floc is a reversible network formed in the liquid after particles interact through attractive surface forces or bridging molecules [14,15,18,20].
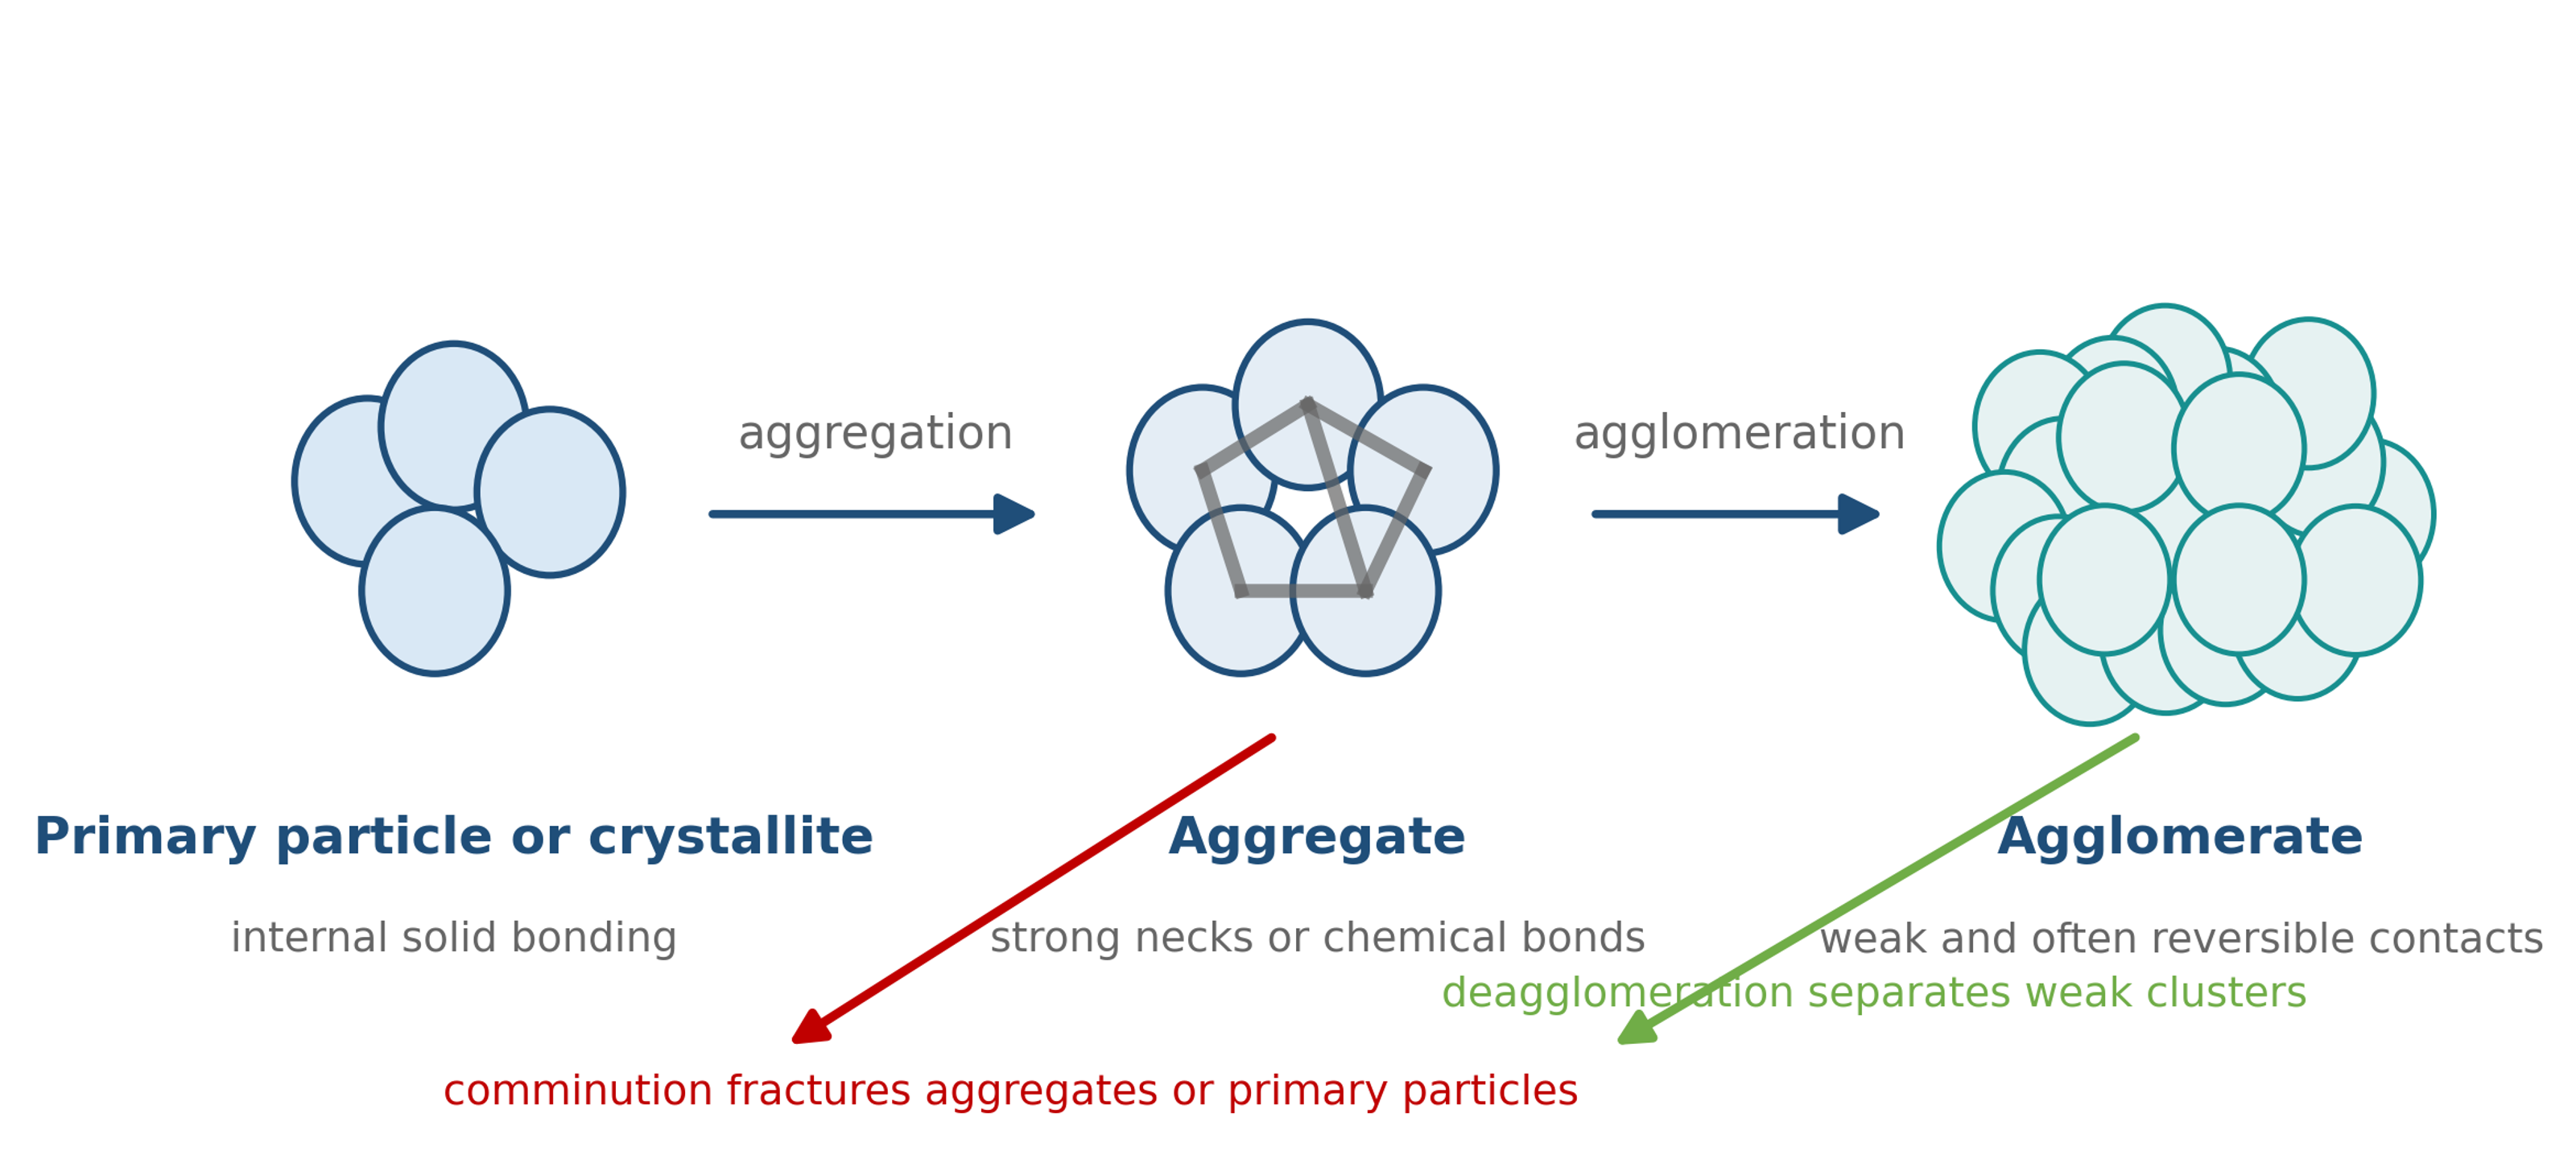
Figure 2.1. Hierarchy of particulate structures and the distinction between deagglomeration and comminution [58].
Table 2.1 summarizes the expected response of each structural level. Deagglomeration should separate weak clusters while preserving aggregates and primary particles whenever possible. Fracture of an aggregate or primary particle constitutes comminution. Exfoliation is a special case in which weak interlayer contacts are separated while the structure within each plane is preserved.
Table 2.1. Structural hierarchy and desired cavitation response.
| Structure | Typical bonding | Preferred process response | Essential analytical evidence |
|---|---|---|---|
| Primary particle or crystallite | Internal crystal or solid state bonding | Preserve unless milling is intended | High resolution SEM or TEM, X ray diffraction, Raman spectroscopy |
| Aggregate | Sintered necks, covalent bonds, strong hydrogen bonding | Preserve or partially erode only when required | SEM or TEM, specific surface area, crystallite size |
| Agglomerate | van der Waals attraction, capillary bridges, polymer bridging, mechanical interlocking | Separate into smaller aggregates or primary particles | Laser diffraction or DLS combined with microscopy |
| Floc | Reversible network formed in the liquid | Break the network and reduce yield stress | Rheometry, microscopy, sedimentation behavior |
| Layered stack or tactoids | Weak interlayer attraction | Delaminate or exfoliate while preserving lateral size | AFM or TEM thickness, Raman response, diffraction |
2.2 Particle size distribution and top size control
A single mean diameter is rarely sufficient to specify a dispersion. The percentiles , , and define the diameters below which 10, 50, and 90 percent of the specified distribution fall. The distribution basis must be reported because number-weighted, surface-weighted, and volume-weighted distributions emphasize different parts of the population. Laser diffraction normally reports a volume-based equivalent diameter. Dynamic light scattering is strongly biased toward larger scatterers and reports a hydrodynamic diameter. Microscopy provides a direct view of particle shape and clustering but examines a smaller population.
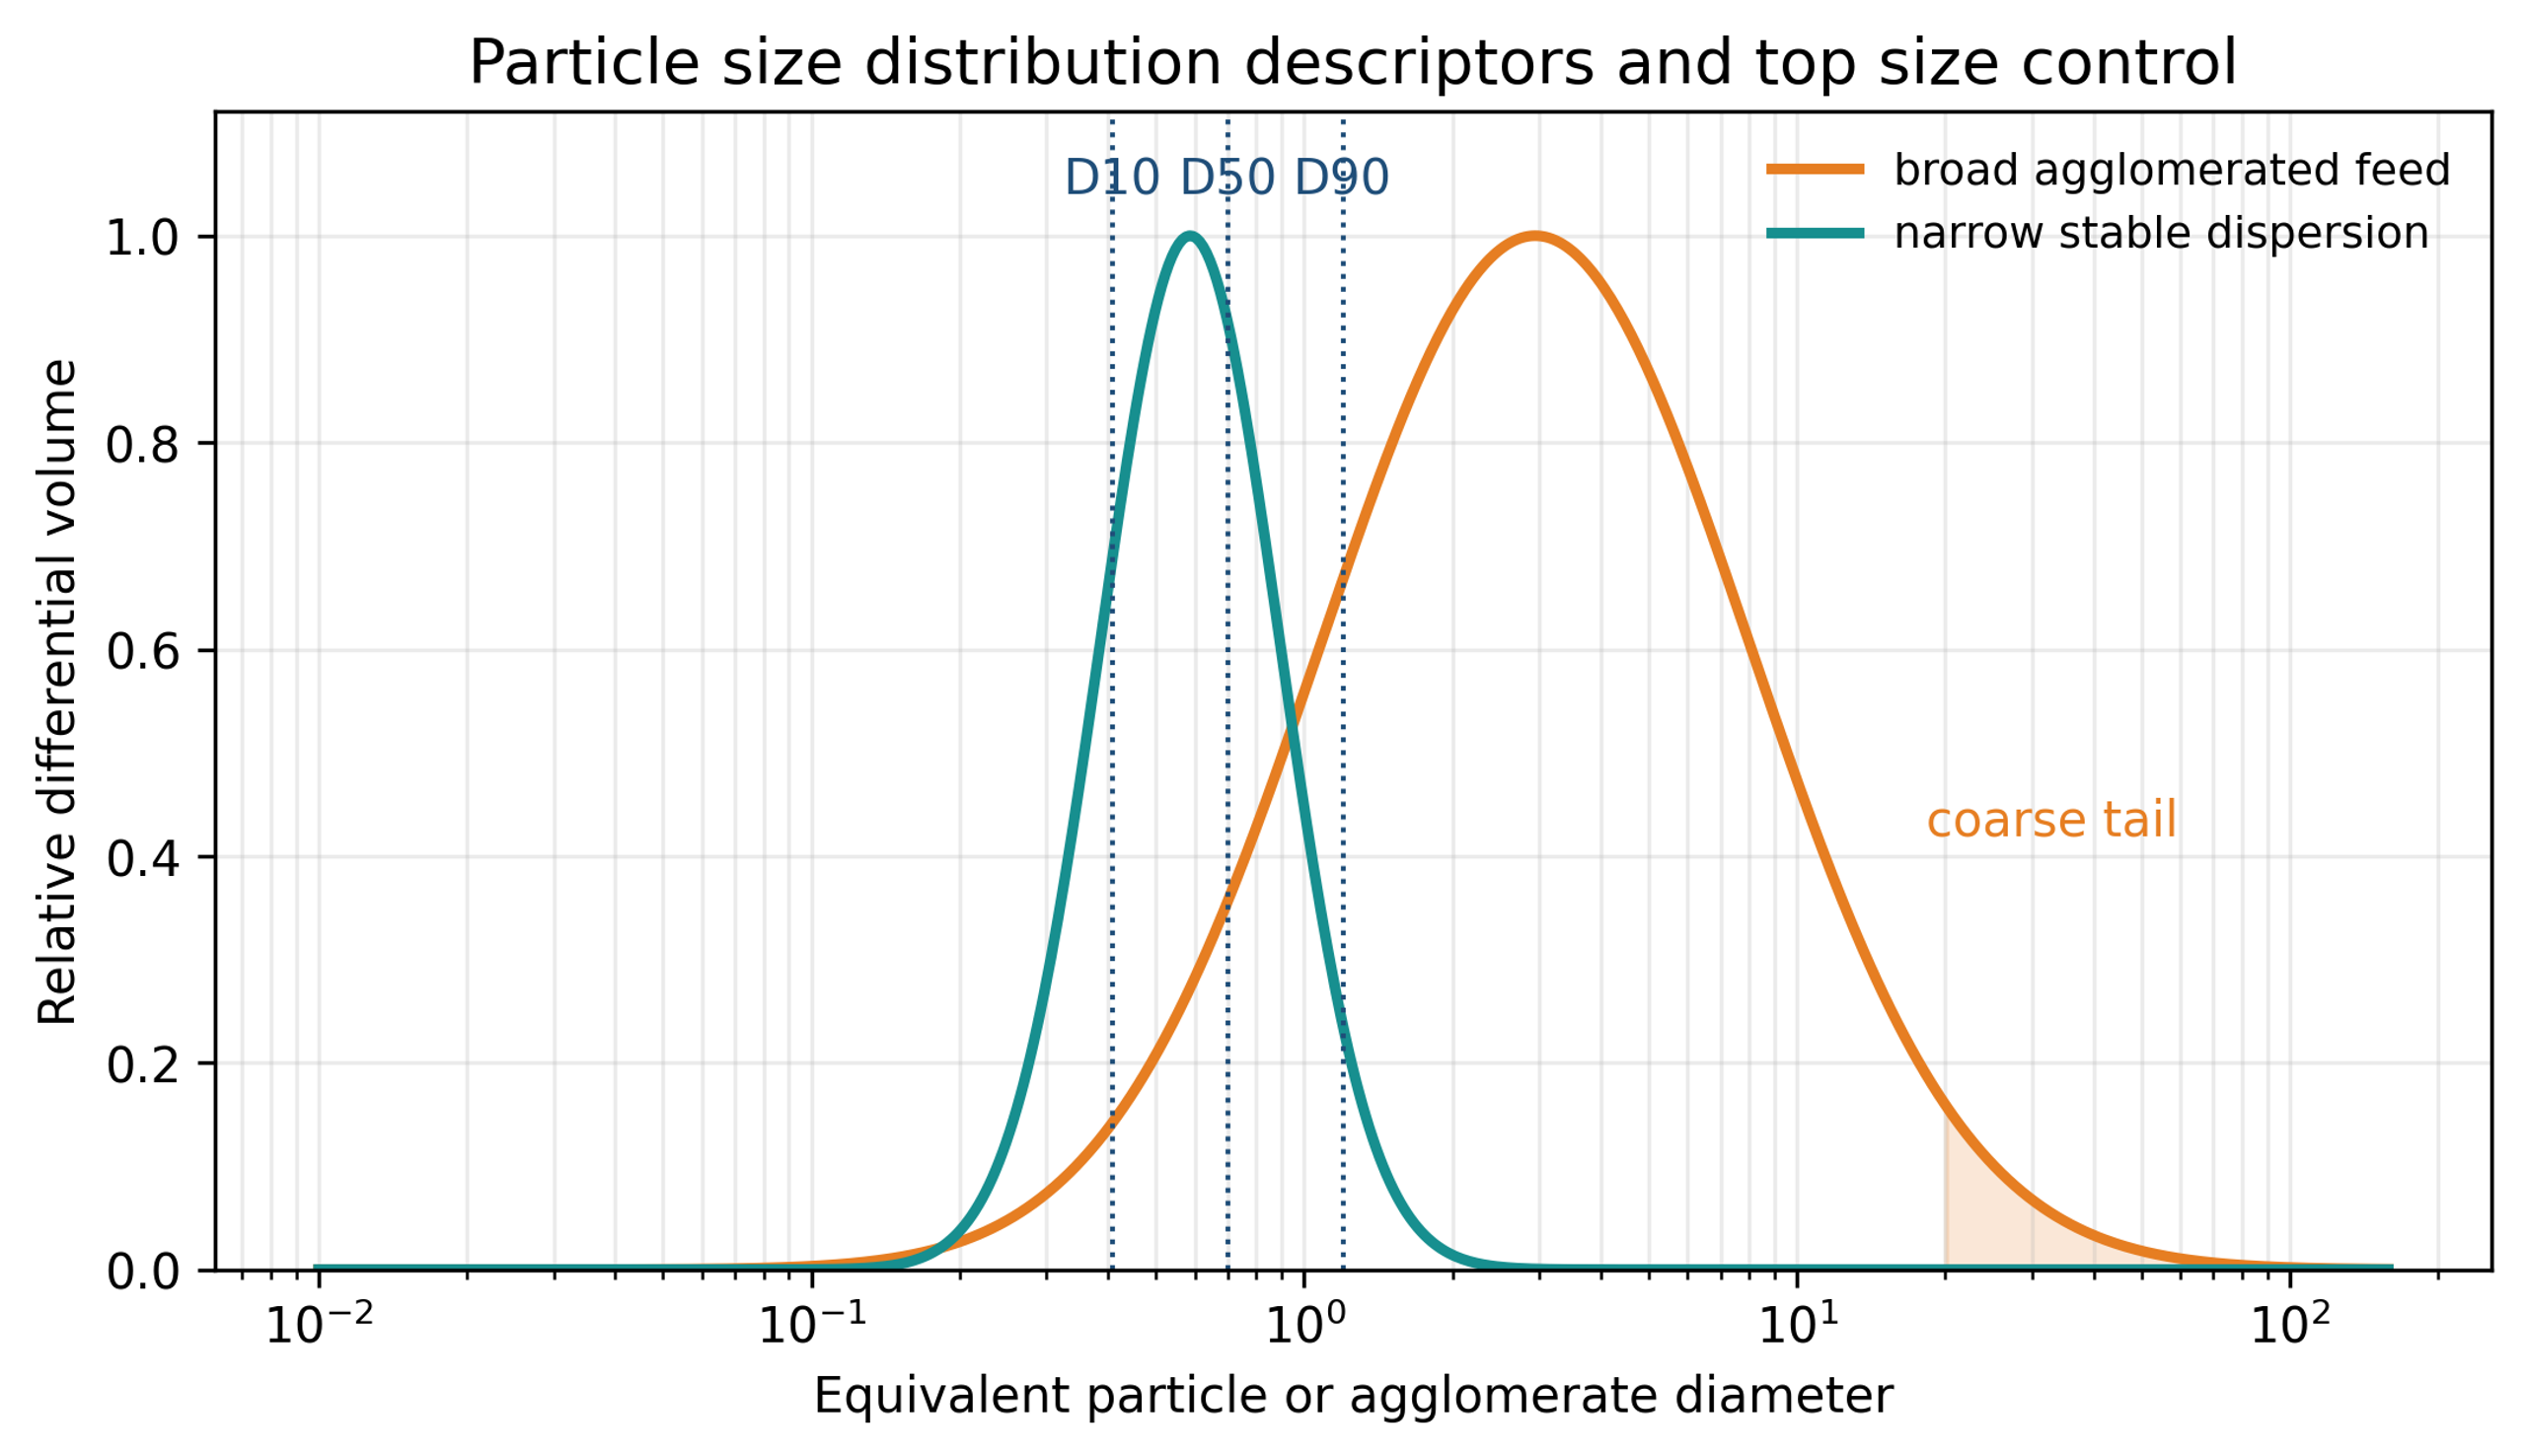
Figure 2.2. Particle size distribution descriptors and the importance of the coarse tail [58].
The width of a volume-based distribution is often summarized by the span:
A low span indicates a narrow distribution, but a narrow distribution is not necessarily stable. The same sample should be measured immediately after processing and after a defined aging period. A reduction in combined with an unchanged or increased may indicate that most agglomerates were dispersed while a small resistant population or contaminant population remained. For printing, coating, filtration, and electronic applications, or a direct coarse particle count can be more important than the mean.
The percent reduction in a selected size metric is:
where is the reduction in percent. This calculation is meaningful only when the analytical method, optical properties, dispersion procedure, solids concentration, and sampling protocol remain consistent.
2.3 Product specifications
A cavitation dispersion process should be defined through measurable critical quality attributes rather than pressure or pass count alone. Typical targets include:
-
, , , span, and a specified maximum particle count.
-
Viscosity, yield stress, thixotropic recovery, and flow behavior at the required solids loading.
-
Sedimentation, creaming, or phase separation during storage and transport.
-
Preservation of crystal phase, surface treatment, particle shape, aspect ratio, and porosity.
-
Chemical purity, especially metals released by pump, valve, and reactor wear.
-
Acceptable temperature rise, gas entrainment, foam, and solvent loss.
-
Throughput, cleaning time, batch repeatability, and energy consumption.
-
Functional properties such as conductivity, thermal conductivity, opacity, catalytic activity, dissolution rate, or mechanical strength.
Table 2.2 illustrates how the controlling specification changes with the application.
Table 2.2. Representative product objectives for cavitation dispersed materials.
| Application | Primary particle objective | Critical upper tail concern | Additional performance test |
|---|---|---|---|
| Conductive silver ink | Separate powder or flake clusters without excessive fracture | Screen blockage and printed line defects | Electrical resistivity, printability, cured microstructure |
| Ceramic slip | Break tactoids and reduce viscosity | Surface defects and nozzle blockage | Casting density, shrinkage, fired microstructure |
| Nanofluid | Reduce hydrodynamic agglomerate size | Sedimentation and channel blockage | Aged size, thermal conductivity, viscosity |
| Pharmaceutical suspension | Reduce crystals or agglomerates to a controlled range | Dose nonuniformity and poor dissolution | Polymorph, dissolution, chemical stability |
| Fiber filled polymer | Separate fiber bundles | Unmixed bundles and local defects | Fiber length, conductivity, mechanical properties |
| Layered material | Exfoliate stacks to thin sheets | Thick unexfoliated platelets | Sheet thickness, lateral size, defect density |
| Food or biomass slurry | Disrupt cells and reduce coarse fragments | Grit, mouthfeel, fouling | Rheology, extractability, sensory or separation behavior |