
Technical publication
Back to publications
Industrial applications
Sonochemical Effect Induced by Hydrodynamic Cavitation
okozyuk.com
Published
Read complete publication for whole-document Find and printing. Browser Find and native printing on this reader include only loaded content.
14 Experimental Evidence and Design Validation
A rigorous analysis of hydrodynamic sonochemistry must distinguish a plausible mechanism from experimentally demonstrated chemistry. Bubble dynamics calculations can predict collapse intensity, but they do not by themselves establish the number of active bubbles, the survival of radicals, or the conversion achieved in the liquid. Conversely, target compound disappearance can be caused by adsorption, volatilization, thermal history, mechanical breakup, or analytical bias. The most credible studies combine hydraulic measurements, flow visualization, chemical dosimetry, product analysis, and a declared energy balance. The studies reviewed below illustrate this evidence hierarchy and provide quantitative design constraints for practical reactors.
14.1 Controlled flow apparatus and patent precedents
U.S. Patent 5,937,906 describes a continuous flow through method in which a local constriction produces a hydrodynamic cavitation cavern and a downstream pressure increase collapses the transported cavities [16]. The patent specifies a local liquid velocity of at least 16 m s⁻¹ and a downstream static pressure increase of at least 0.85 kg cm⁻², approximately 83 kPa. Its drawings include bluff body and baffle arrangements with transient passages, demonstrating that the invention is based on controlled pressure history rather than on a single nozzle shape. These values are design claims, not universal inception criteria; actual thresholds depend on vapor pressure, dissolved gas, nuclei population, viscosity, surface condition, and the absolute pressure level.
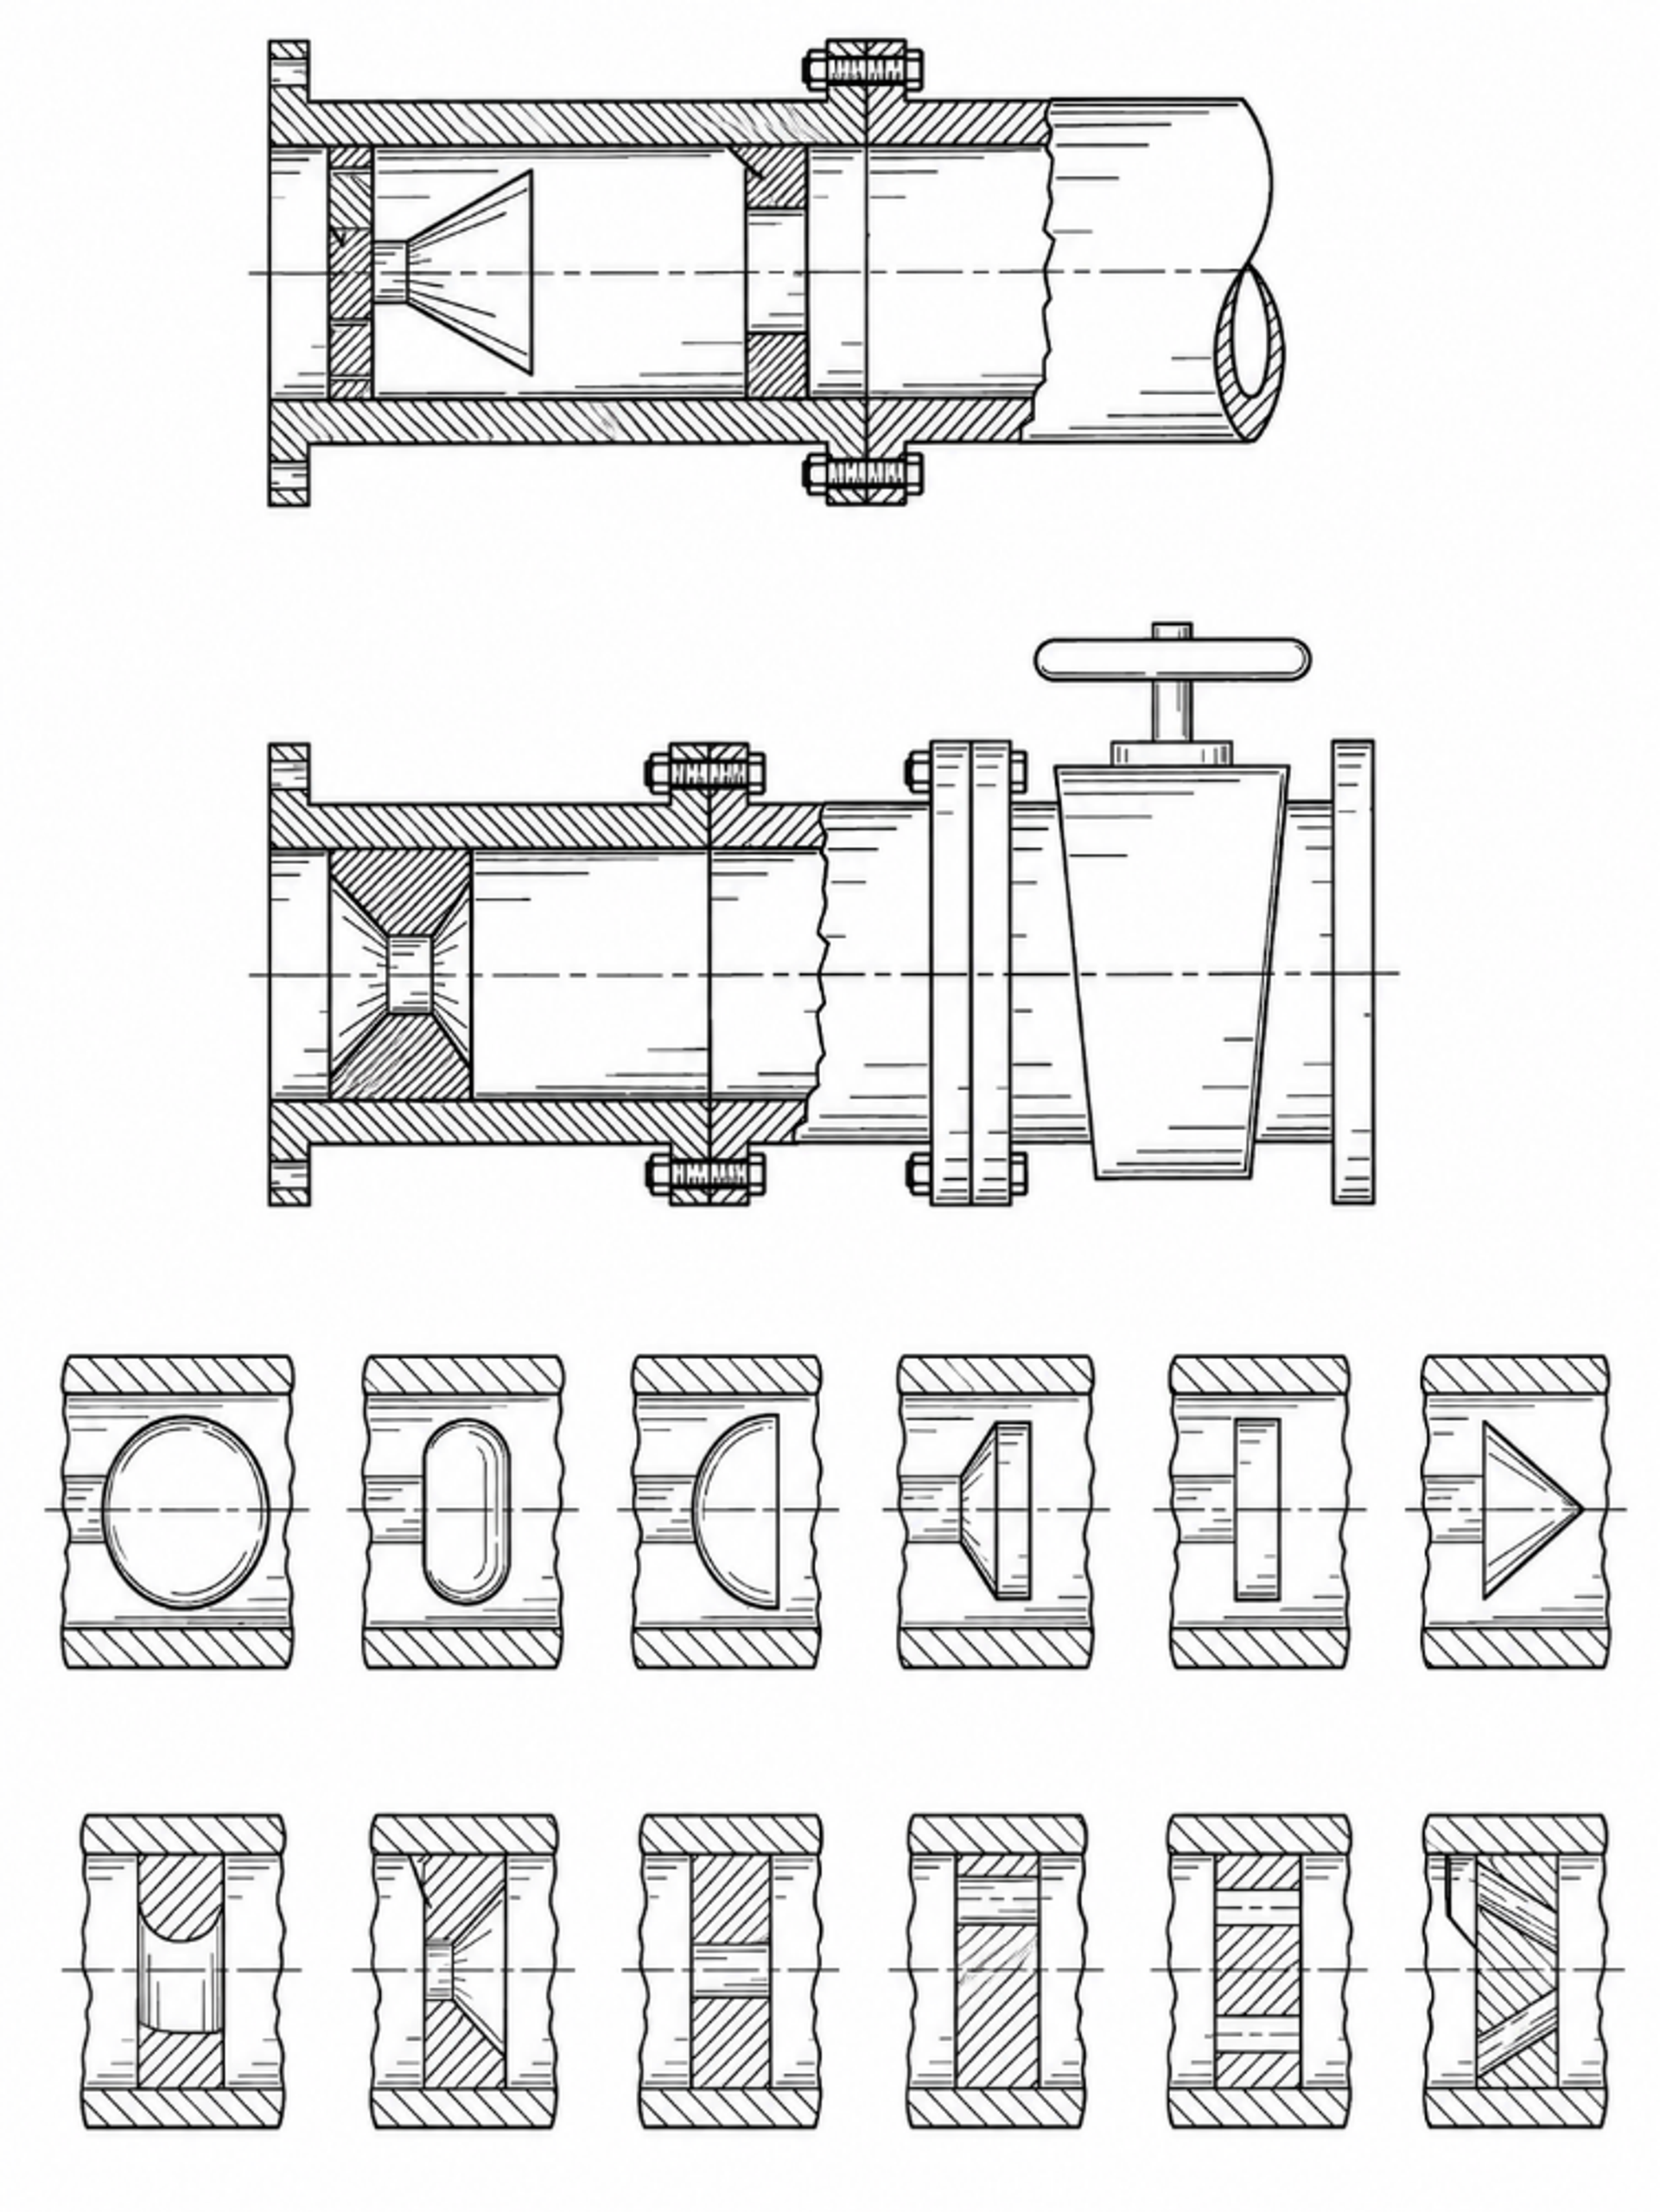
Figure 14.1. Controlled flow cavitation apparatus and alternative constriction elements. [16].
U.S. Patent 5,969,207 extends the controlled flow concept to liquid hydrocarbon mixtures [66]. The disclosure describes a baffle induced local restriction, an accelerated region, a cavitation field, and chemical transformations including decomposition, isomerization, cyclization, and synthesis. The patent also presents model estimates of very short collapse times and extreme internal states. Such estimates are useful for framing possible reaction pathways, but they should not be treated as direct thermometric measurements. Independent product analysis and controls without cavitation are required before assigning a hydrocarbon transformation to a hot spot mechanism.
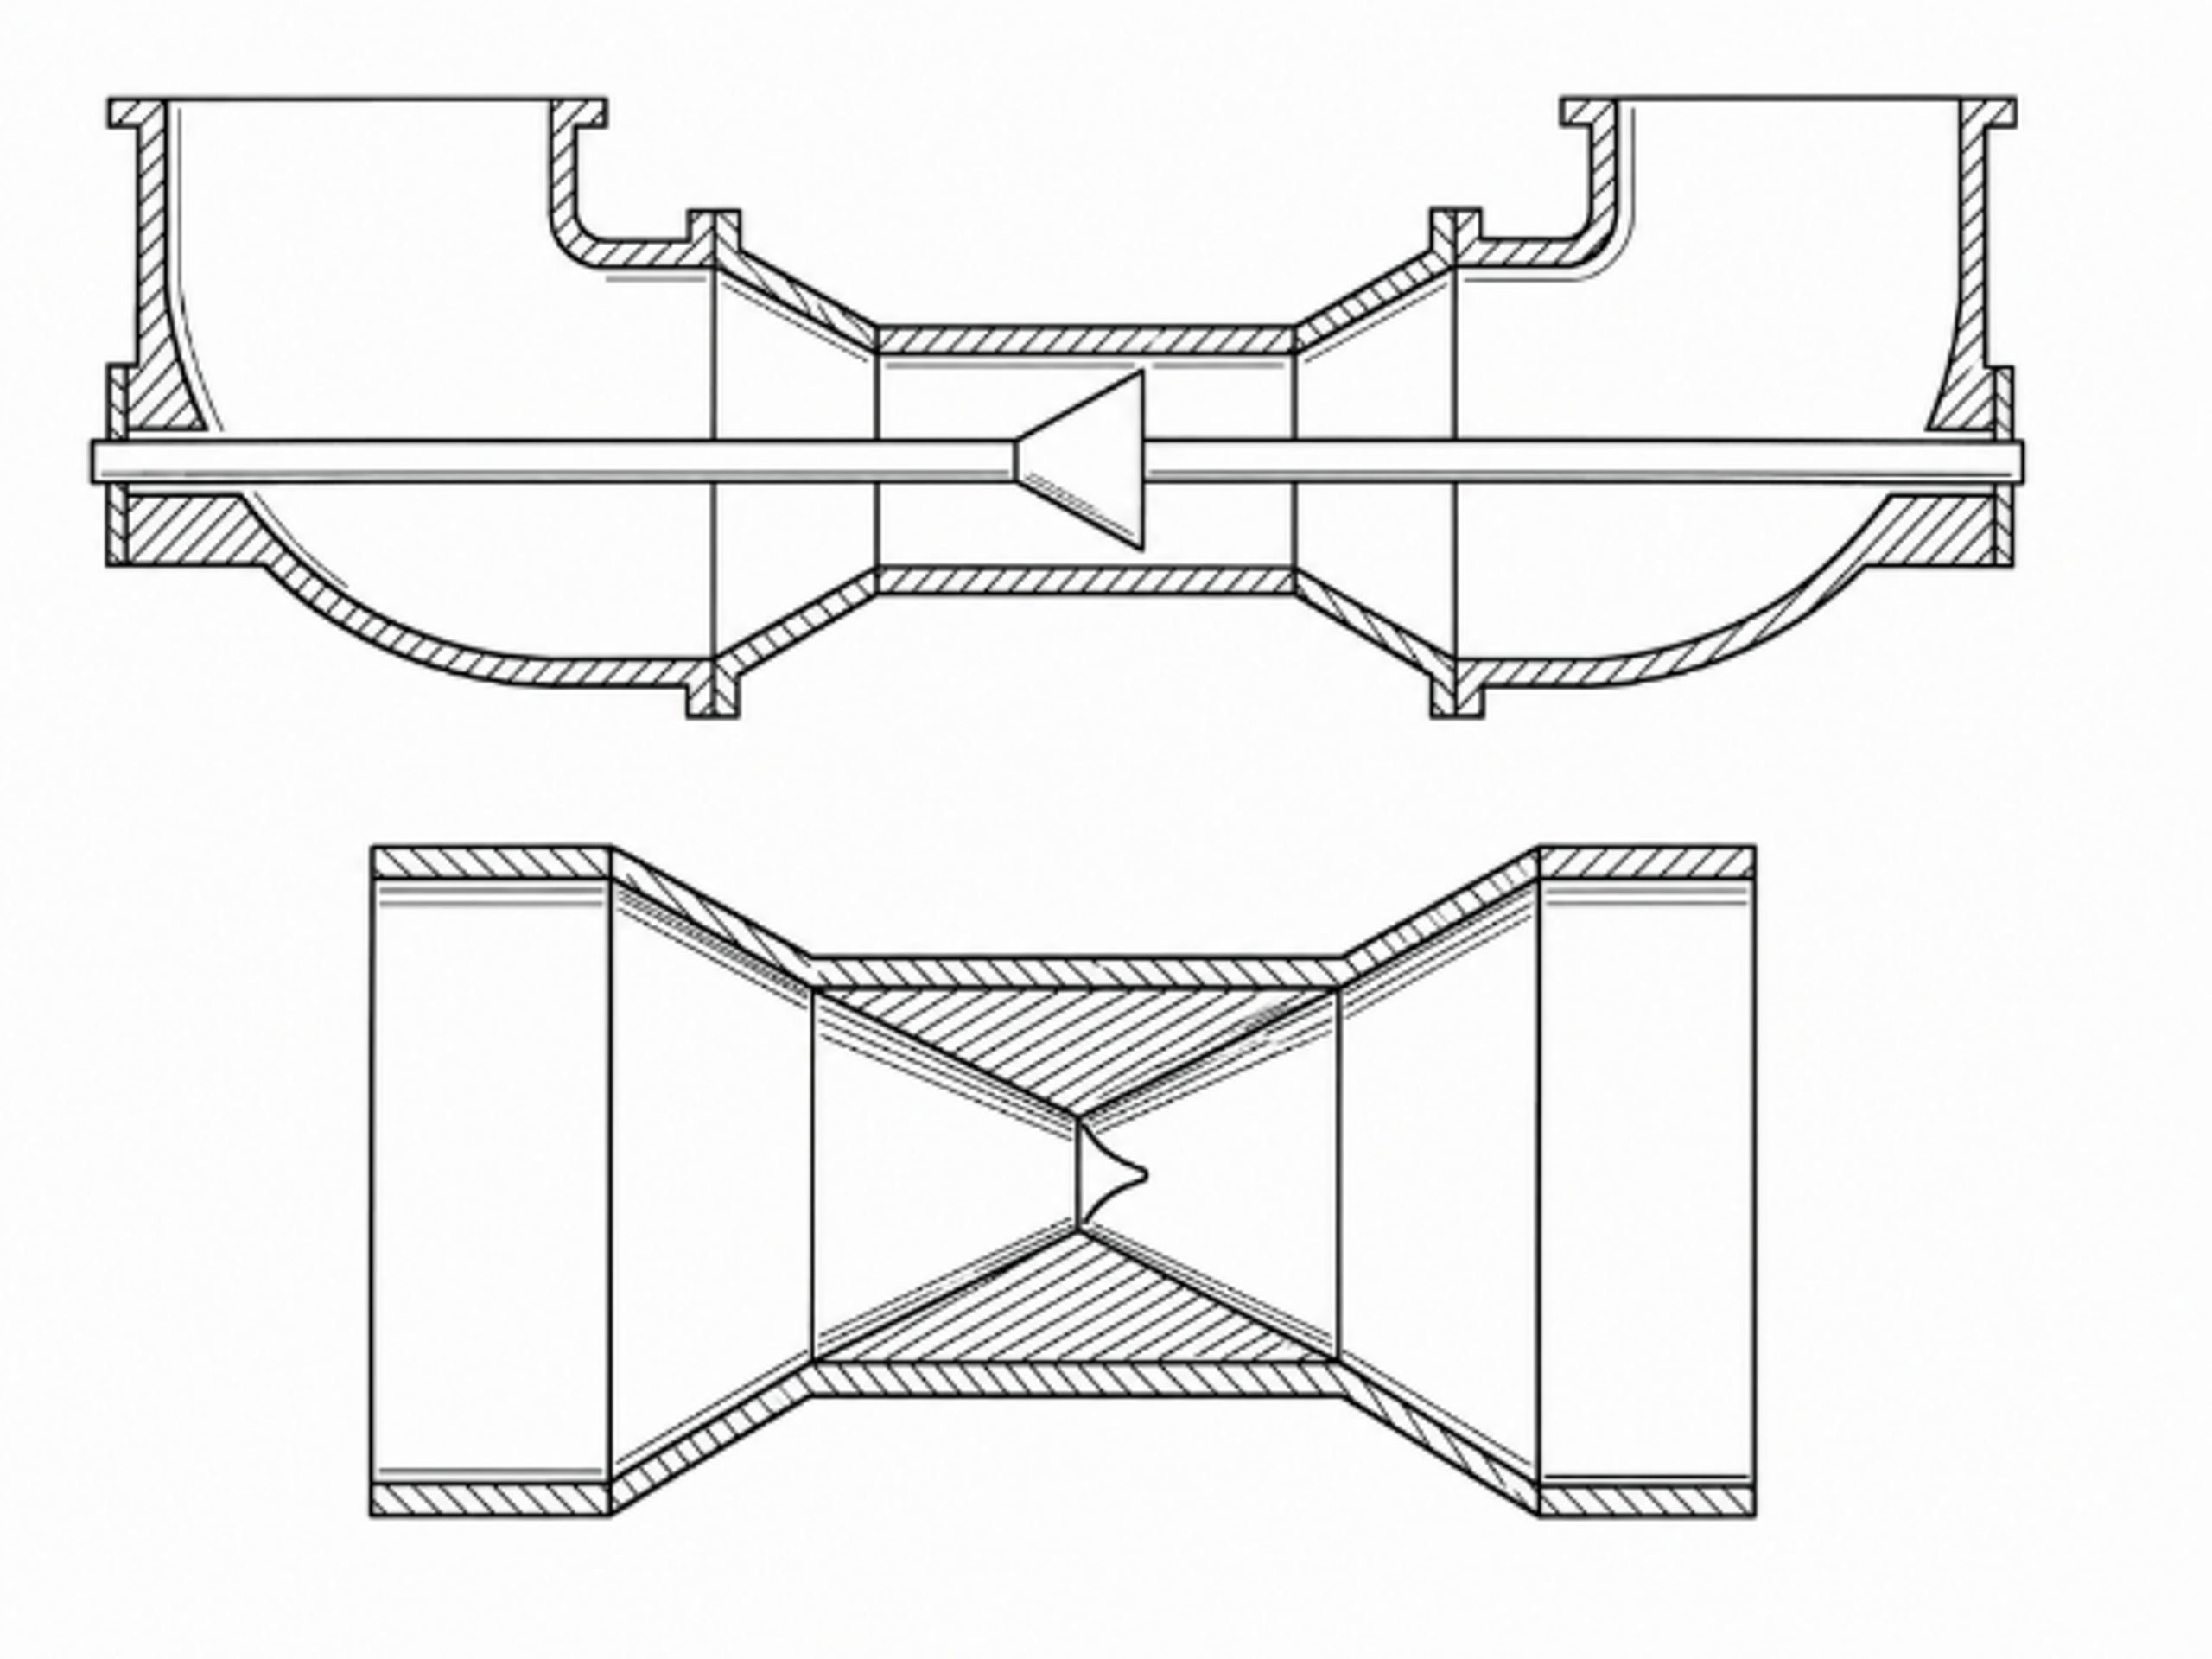
Figure 14.2. Hydrodynamic cavitation passage proposed for changing the composition of liquid hydrocarbon mixtures. [66].
14.2 Venturi and orifice geometry: multibubble effects control net yield
Pawar and coworkers compared three Venturi devices and one orifice using a four part methodology: single phase CFD, single bubble dynamics, high speed photography, and iodide oxidation [11]. This comparison is important because the single bubble calculations and the reactor scale chemistry did not rank the devices in the same order. The Venturi devices generated larger vapor clouds and, in some cases, stronger predicted individual bubble conditions. Nevertheless, the orifice produced the highest reported iodine liberation per unit dissipated energy.
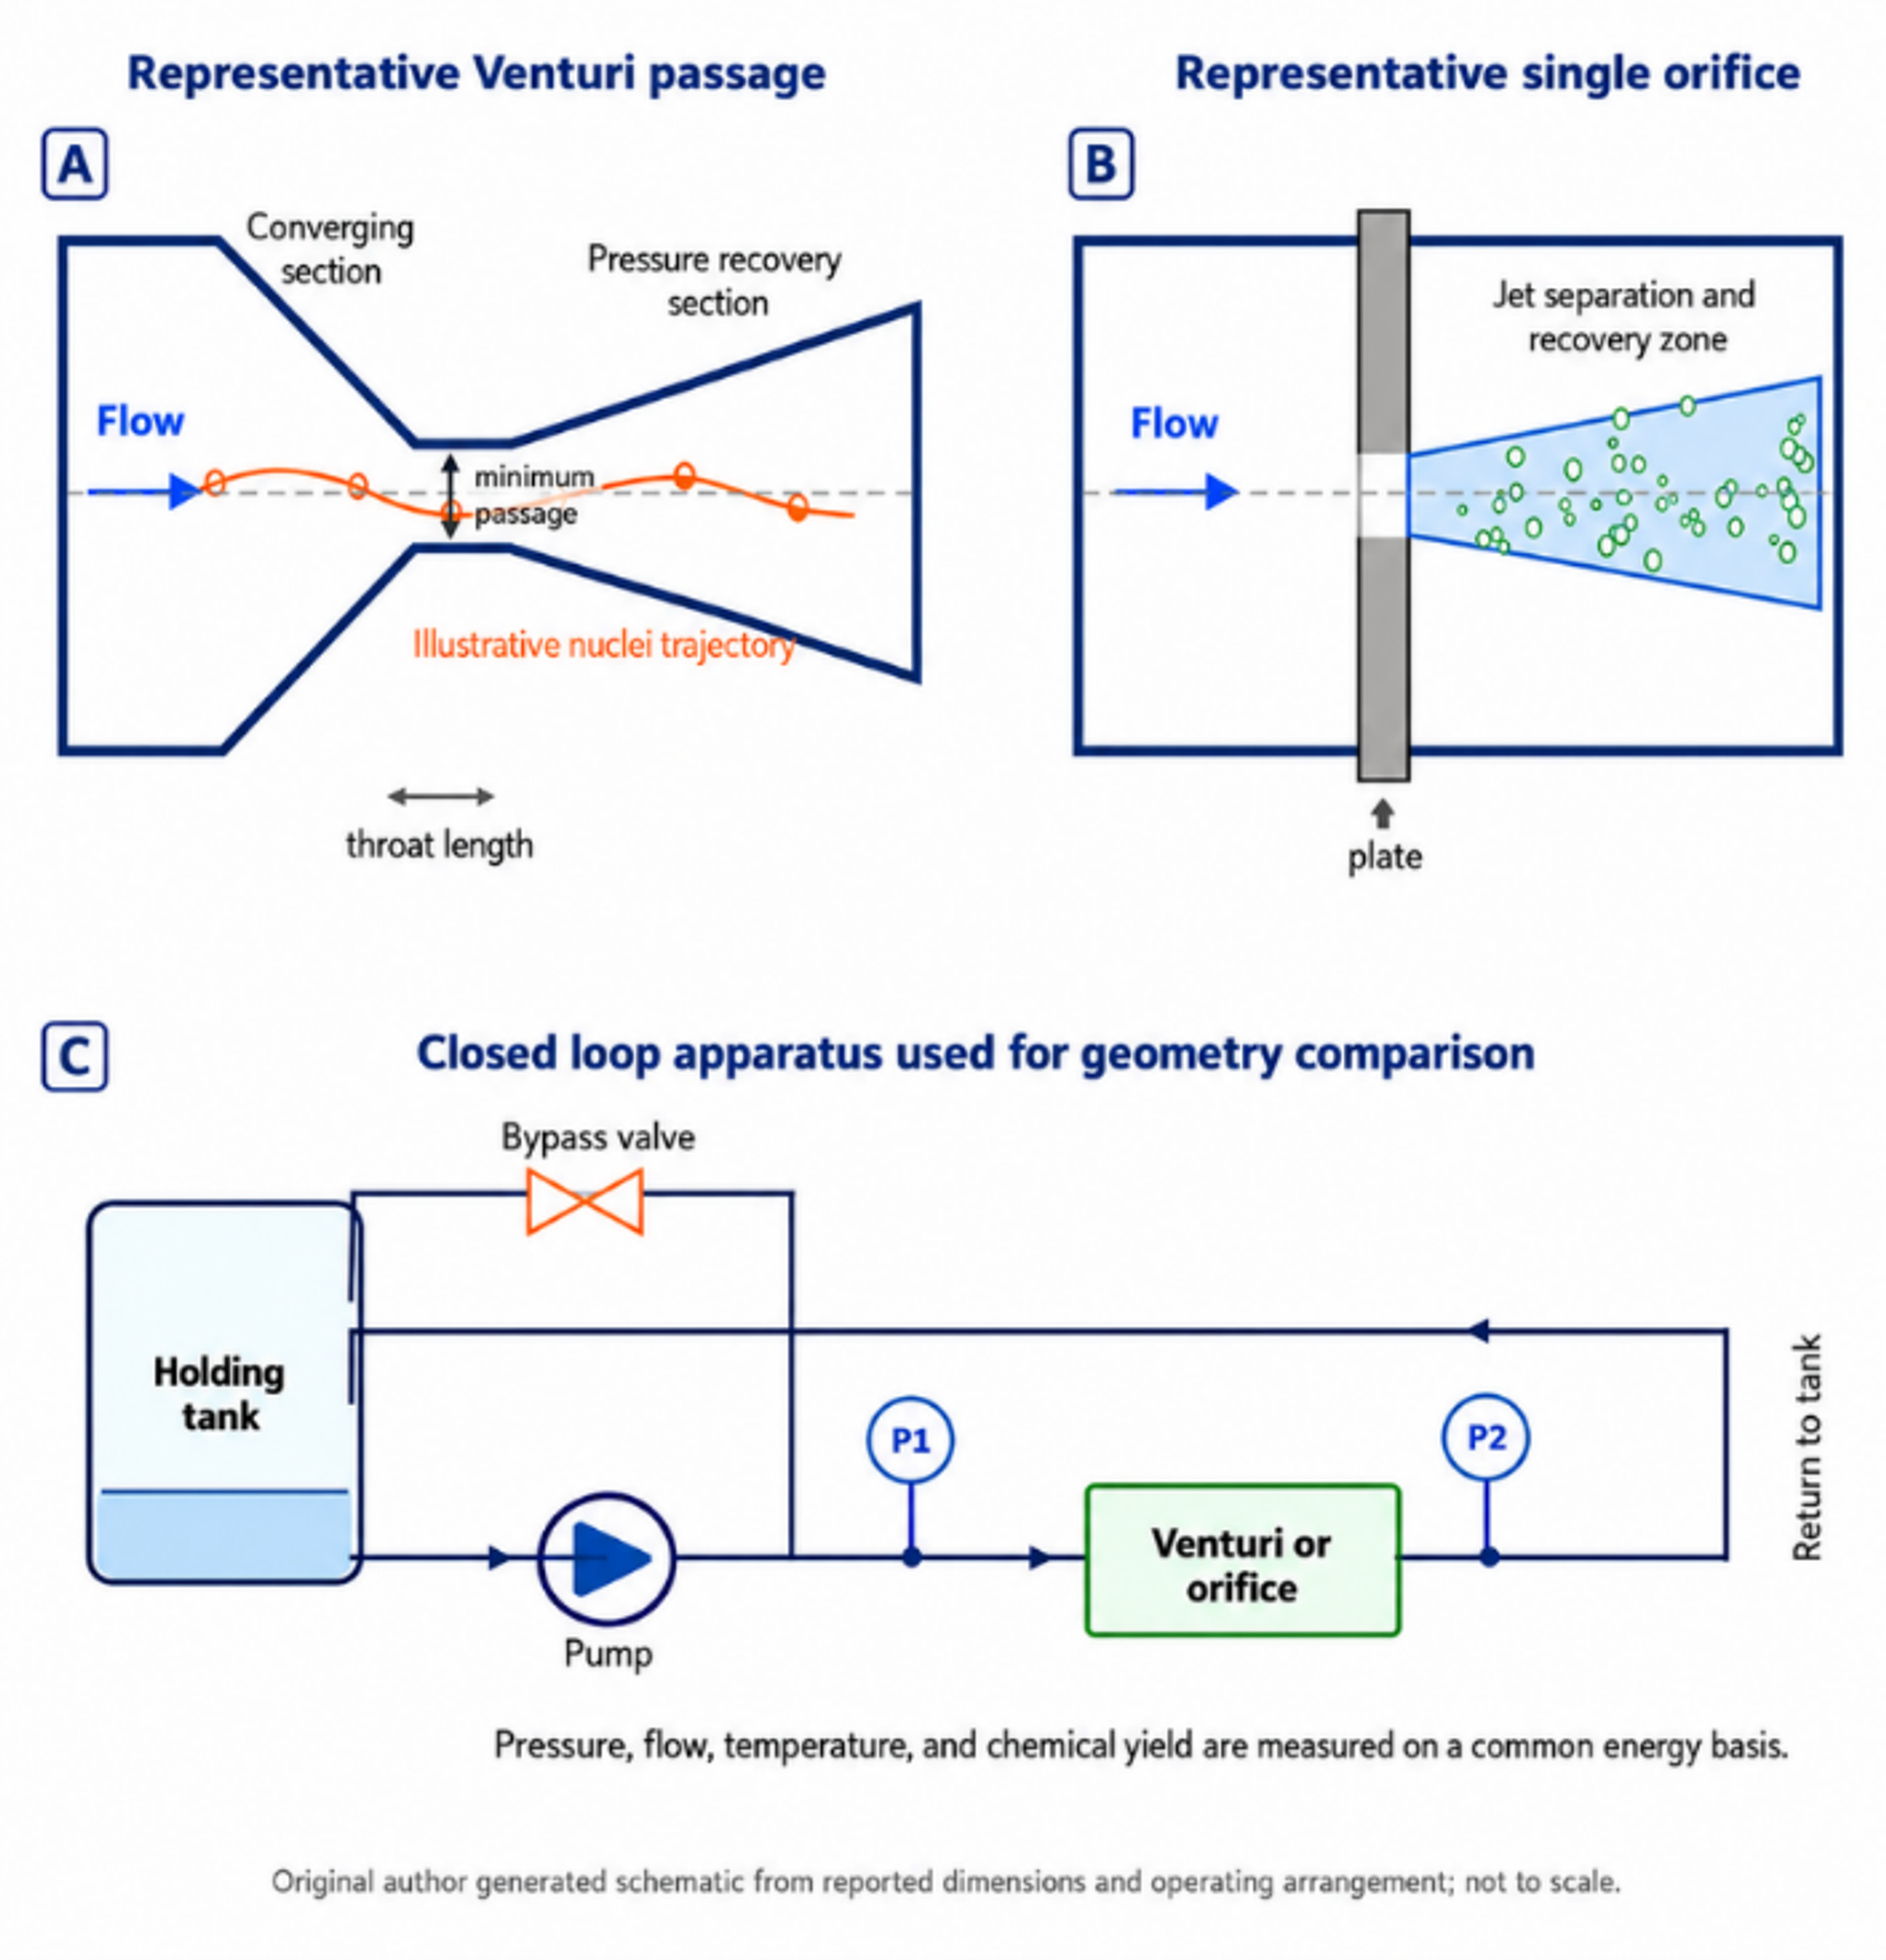
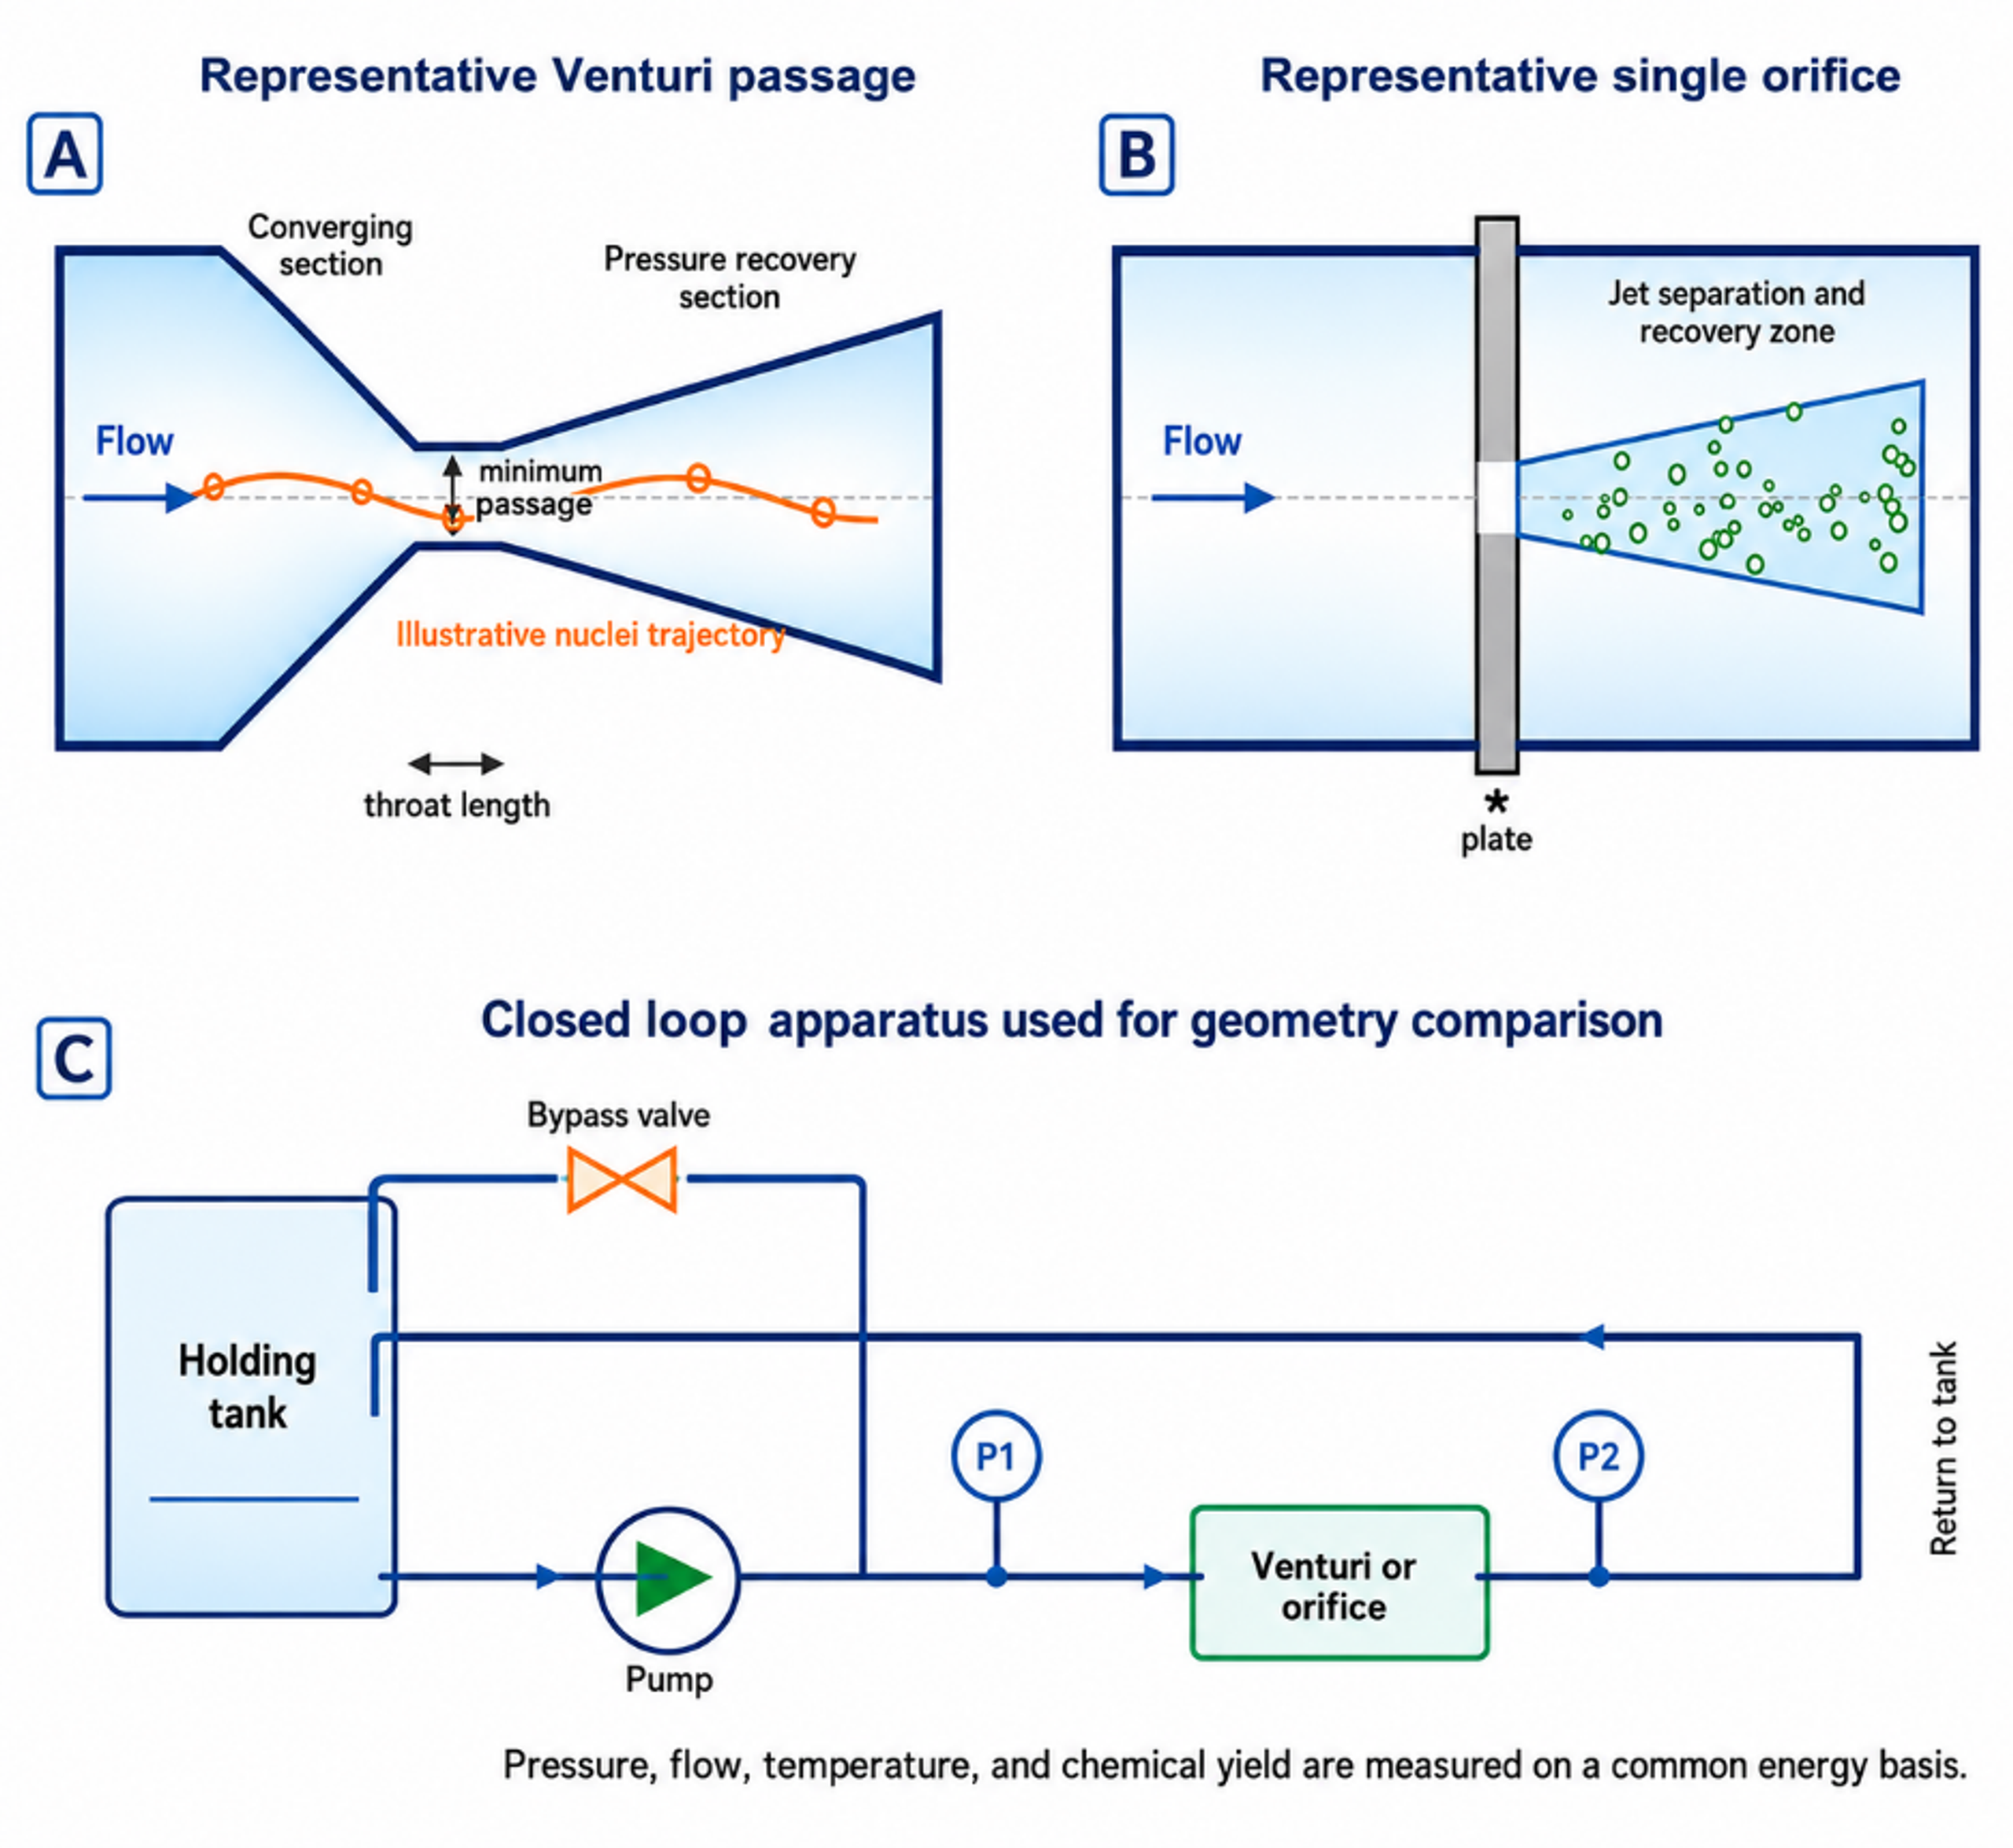
Figure 14.3. Original schematic of representative Venturi and single orifice passages and the closed loop geometry comparison apparatus. [11].
The reported average yields were 0.115, 0.106, 0.039, and 0.165 mg I₂ kJ⁻¹ for Venturi 1, Venturi 2, Venturi 3, and the orifice, respectively. The corresponding reported pump powers were 31.78, 36.31, 61.20, and 21.83 W. Figure 14.4 redraws these values on a common basis. The orifice result should not be generalized to every orifice. It demonstrates that the bubble population and collapse environment can outweigh nominal pressure or visible vapor volume.
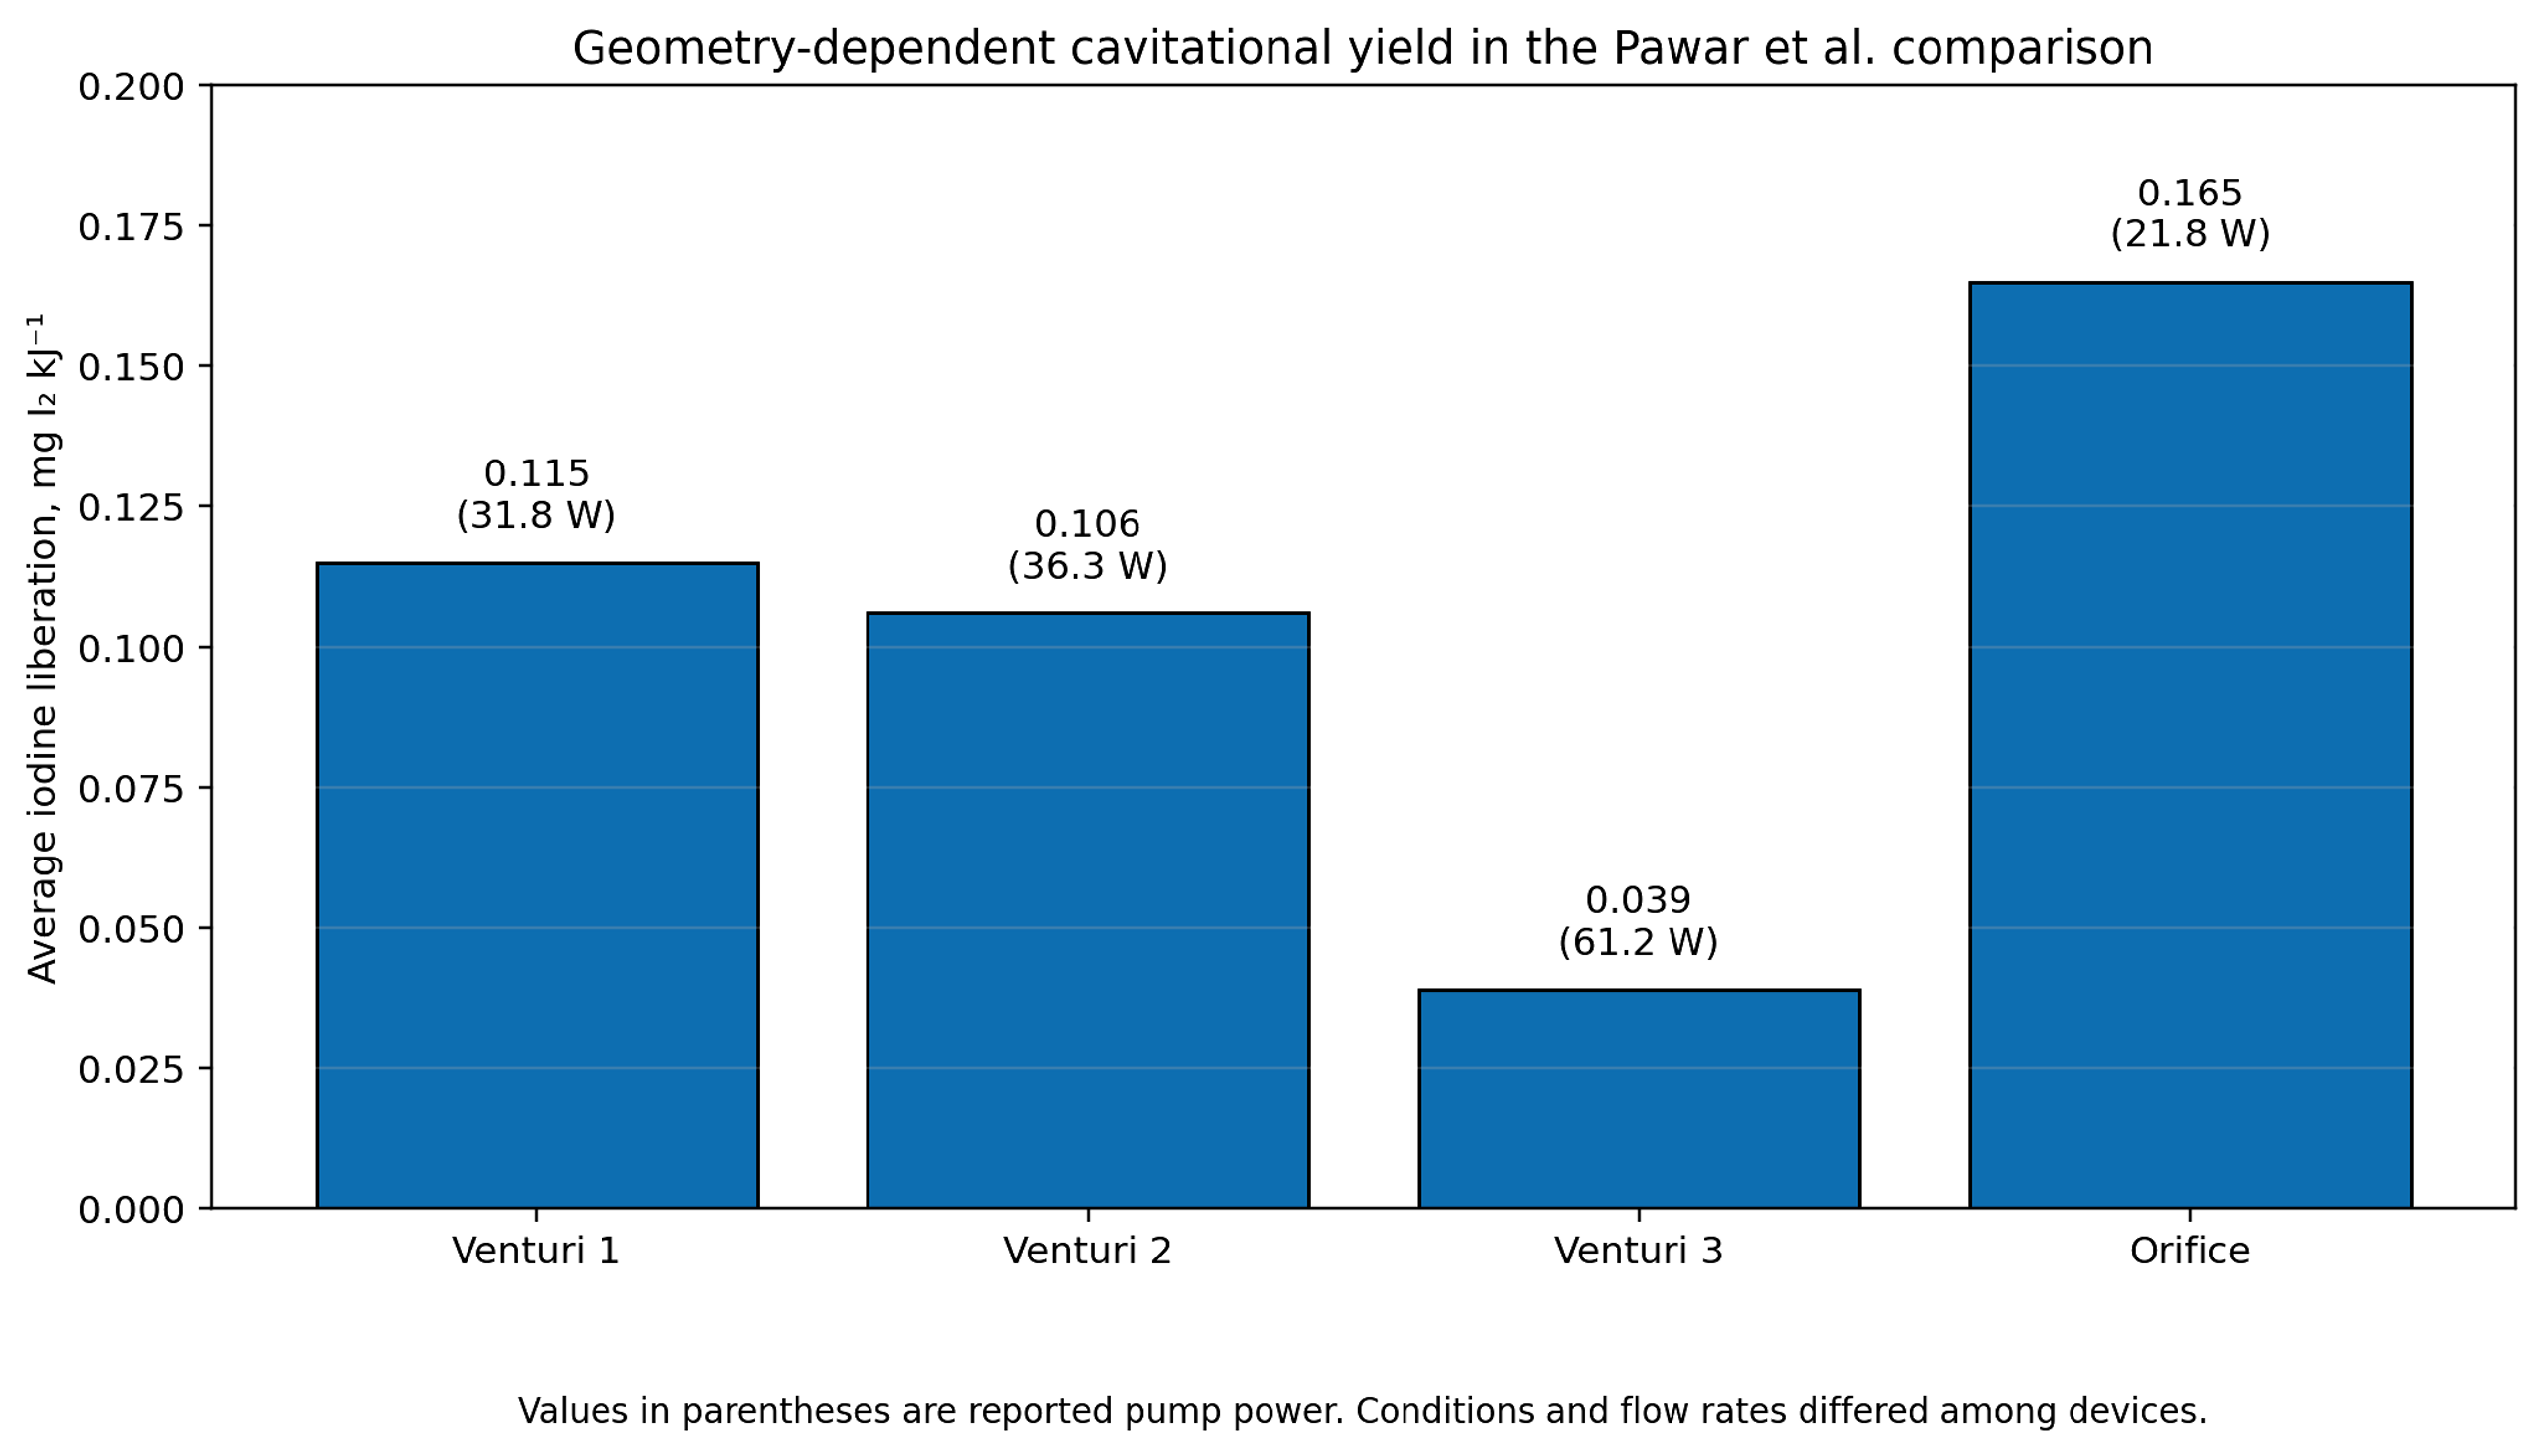
Figure 14.4. Average iodine liberation per unit energy for the four flow geometries evaluated by Pawar et al. [11].
The conceptual comparison in Figure 14.5 illustrates why chemical yield can decrease as a cavitation cloud becomes larger. Reported high speed observations show that dense clouds promote bubble interaction, coalescence, asymmetric collapse, shock shielding, and radical recombination. A smaller population of more isolated bubbles can therefore produce a higher net chemical yield even when total vapor volume is lower. For reactor design, void fraction and chemical yield must be optimized separately.
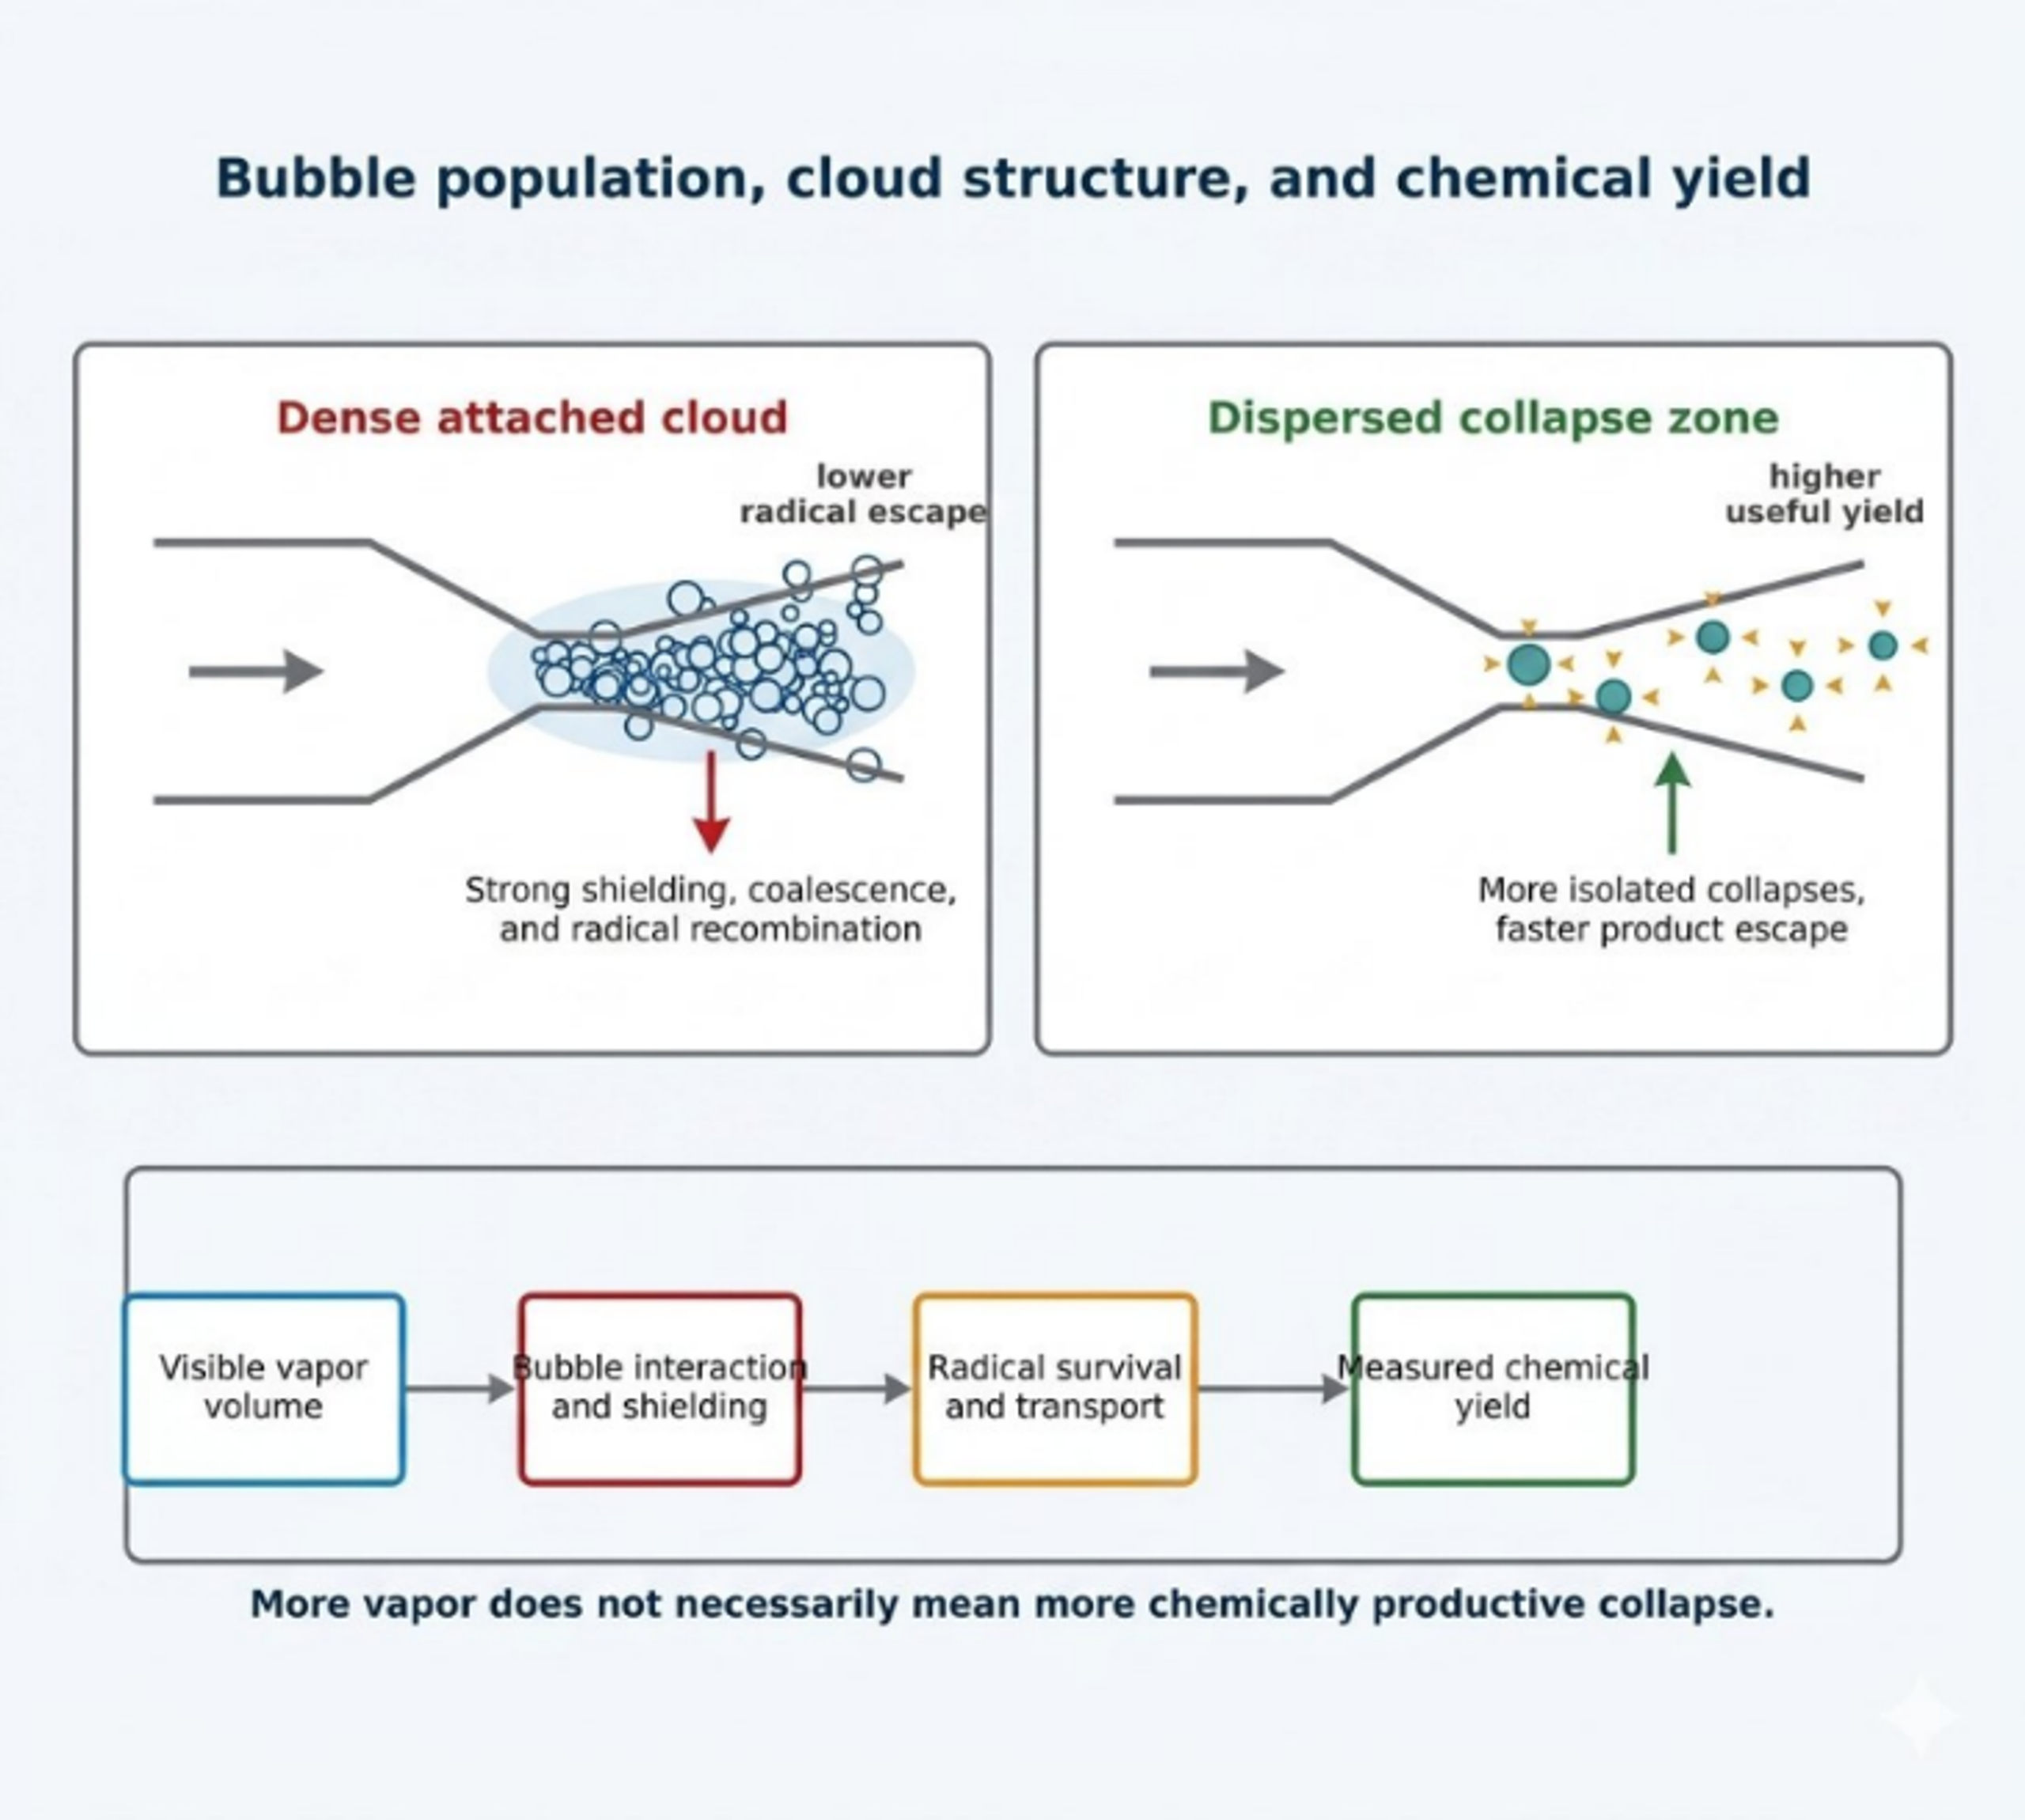
Figure 14.5. Conceptual comparison of a dense attached cavitation cloud and a dispersed collapse zone, showing the influence of bubble interaction, shielding, radical survival, and transport on measured chemical yield [81].
14.3 Chemical dosimetry and spatial radical diagnostics
Chemical dosimeters convert short lived radical chemistry into a stable or optically detectable product. No single dosimeter is universal. Iodide responds to hydroxyl radicals, peroxide, chlorine derived species, and other oxidants. Salicylic acid, coumarin, and terephthalic acid trap hydroxyl radicals through aromatic hydroxylation, but the measured yield depends on probe concentration, product branching, pH, and analytical recovery. Luminol provides valuable spatial information, although its emission depends on formulation, oxygen, pH, and camera integration time. Sulfite and Fricke systems measure integrated oxidation and require careful control of atmospheric oxygen.
Amin and coworkers used salicylic acid dosimetry in a high pressure recirculating hydrocavitator [67]. The reported hydroxylated product yield was maximal at an initial salicylic acid concentration of 750 ppm. No product was detected below 100 psi in their apparatus, whereas higher upstream pressure increased product formation. The study also reported that placing a 20 kHz ultrasonic probe downstream of the hydrodynamic device improved hydroxylated product formation by about 15 percent when the separation was 5 to 10 mm. These results show that a dosimeter must first be optimized for concentration and reactor geometry before it can be used to compare operating conditions.
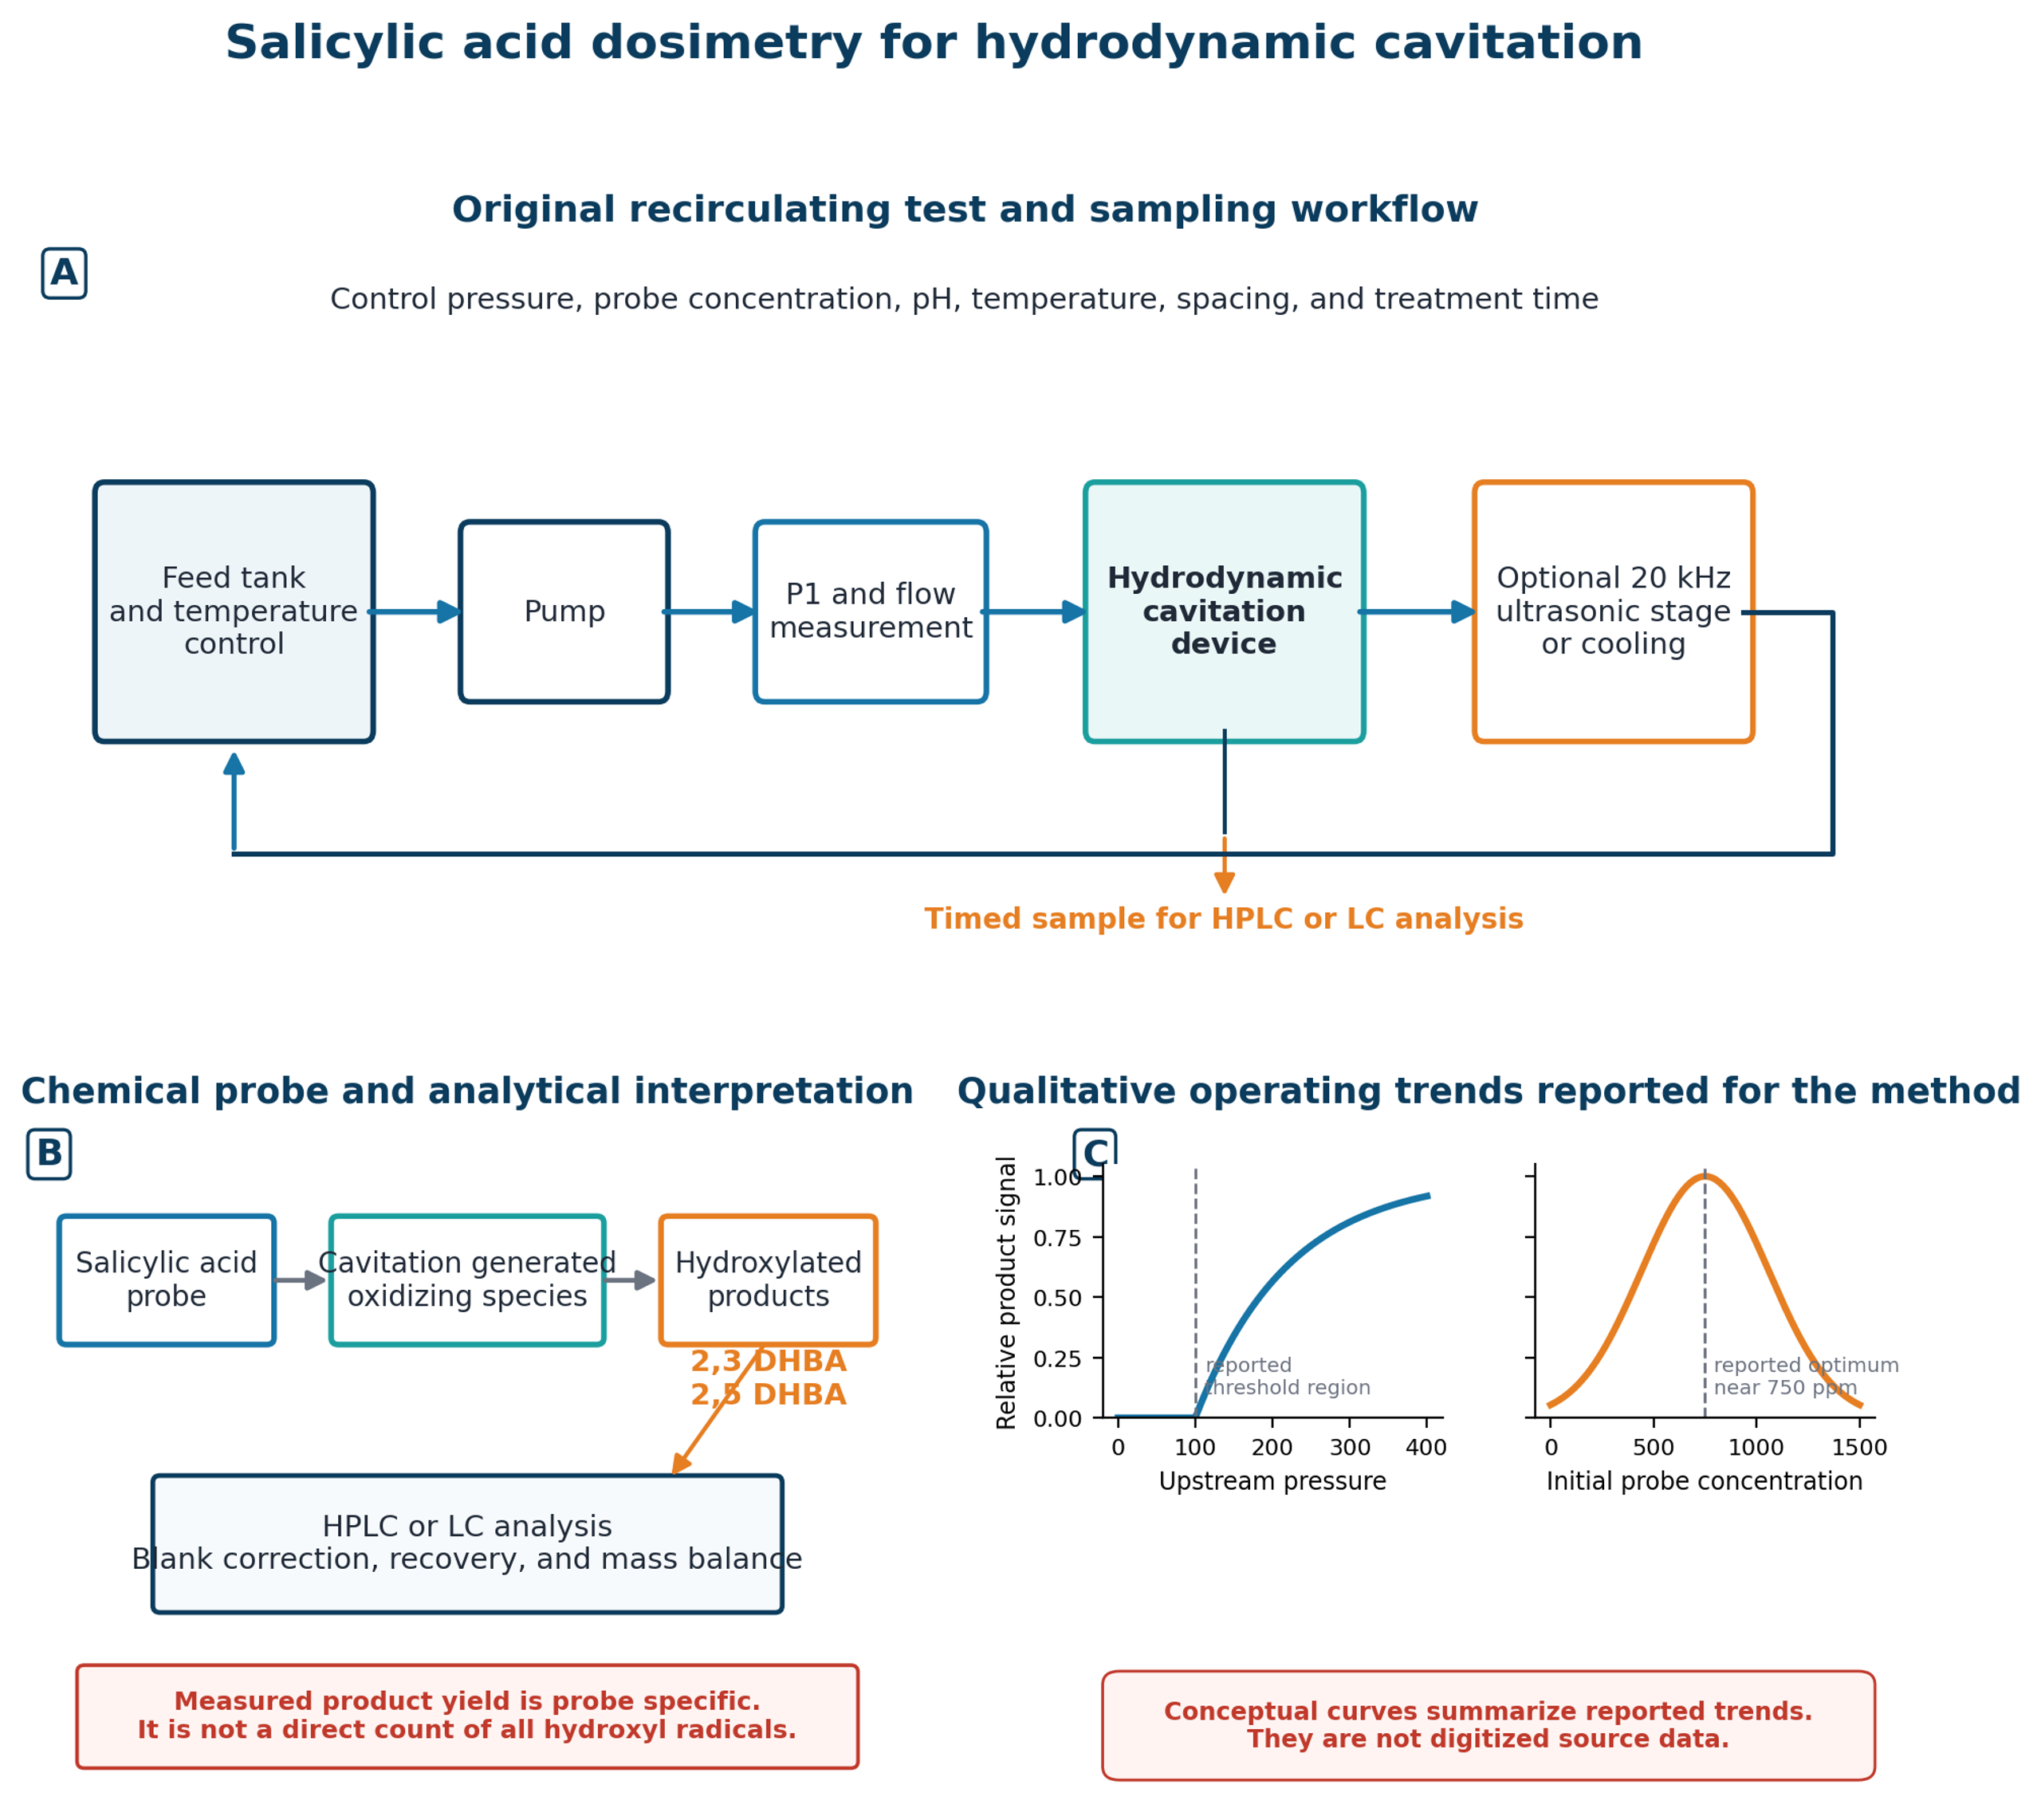
Figure 14.6. Salicylic acid dosimetry workflow, analytical interpretation, and qualitative operating trends for a hydrodynamic cavitation reactor with an optional downstream ultrasonic stage. Generated schematic based on experimental design and reported trends in Amin et al. [67].
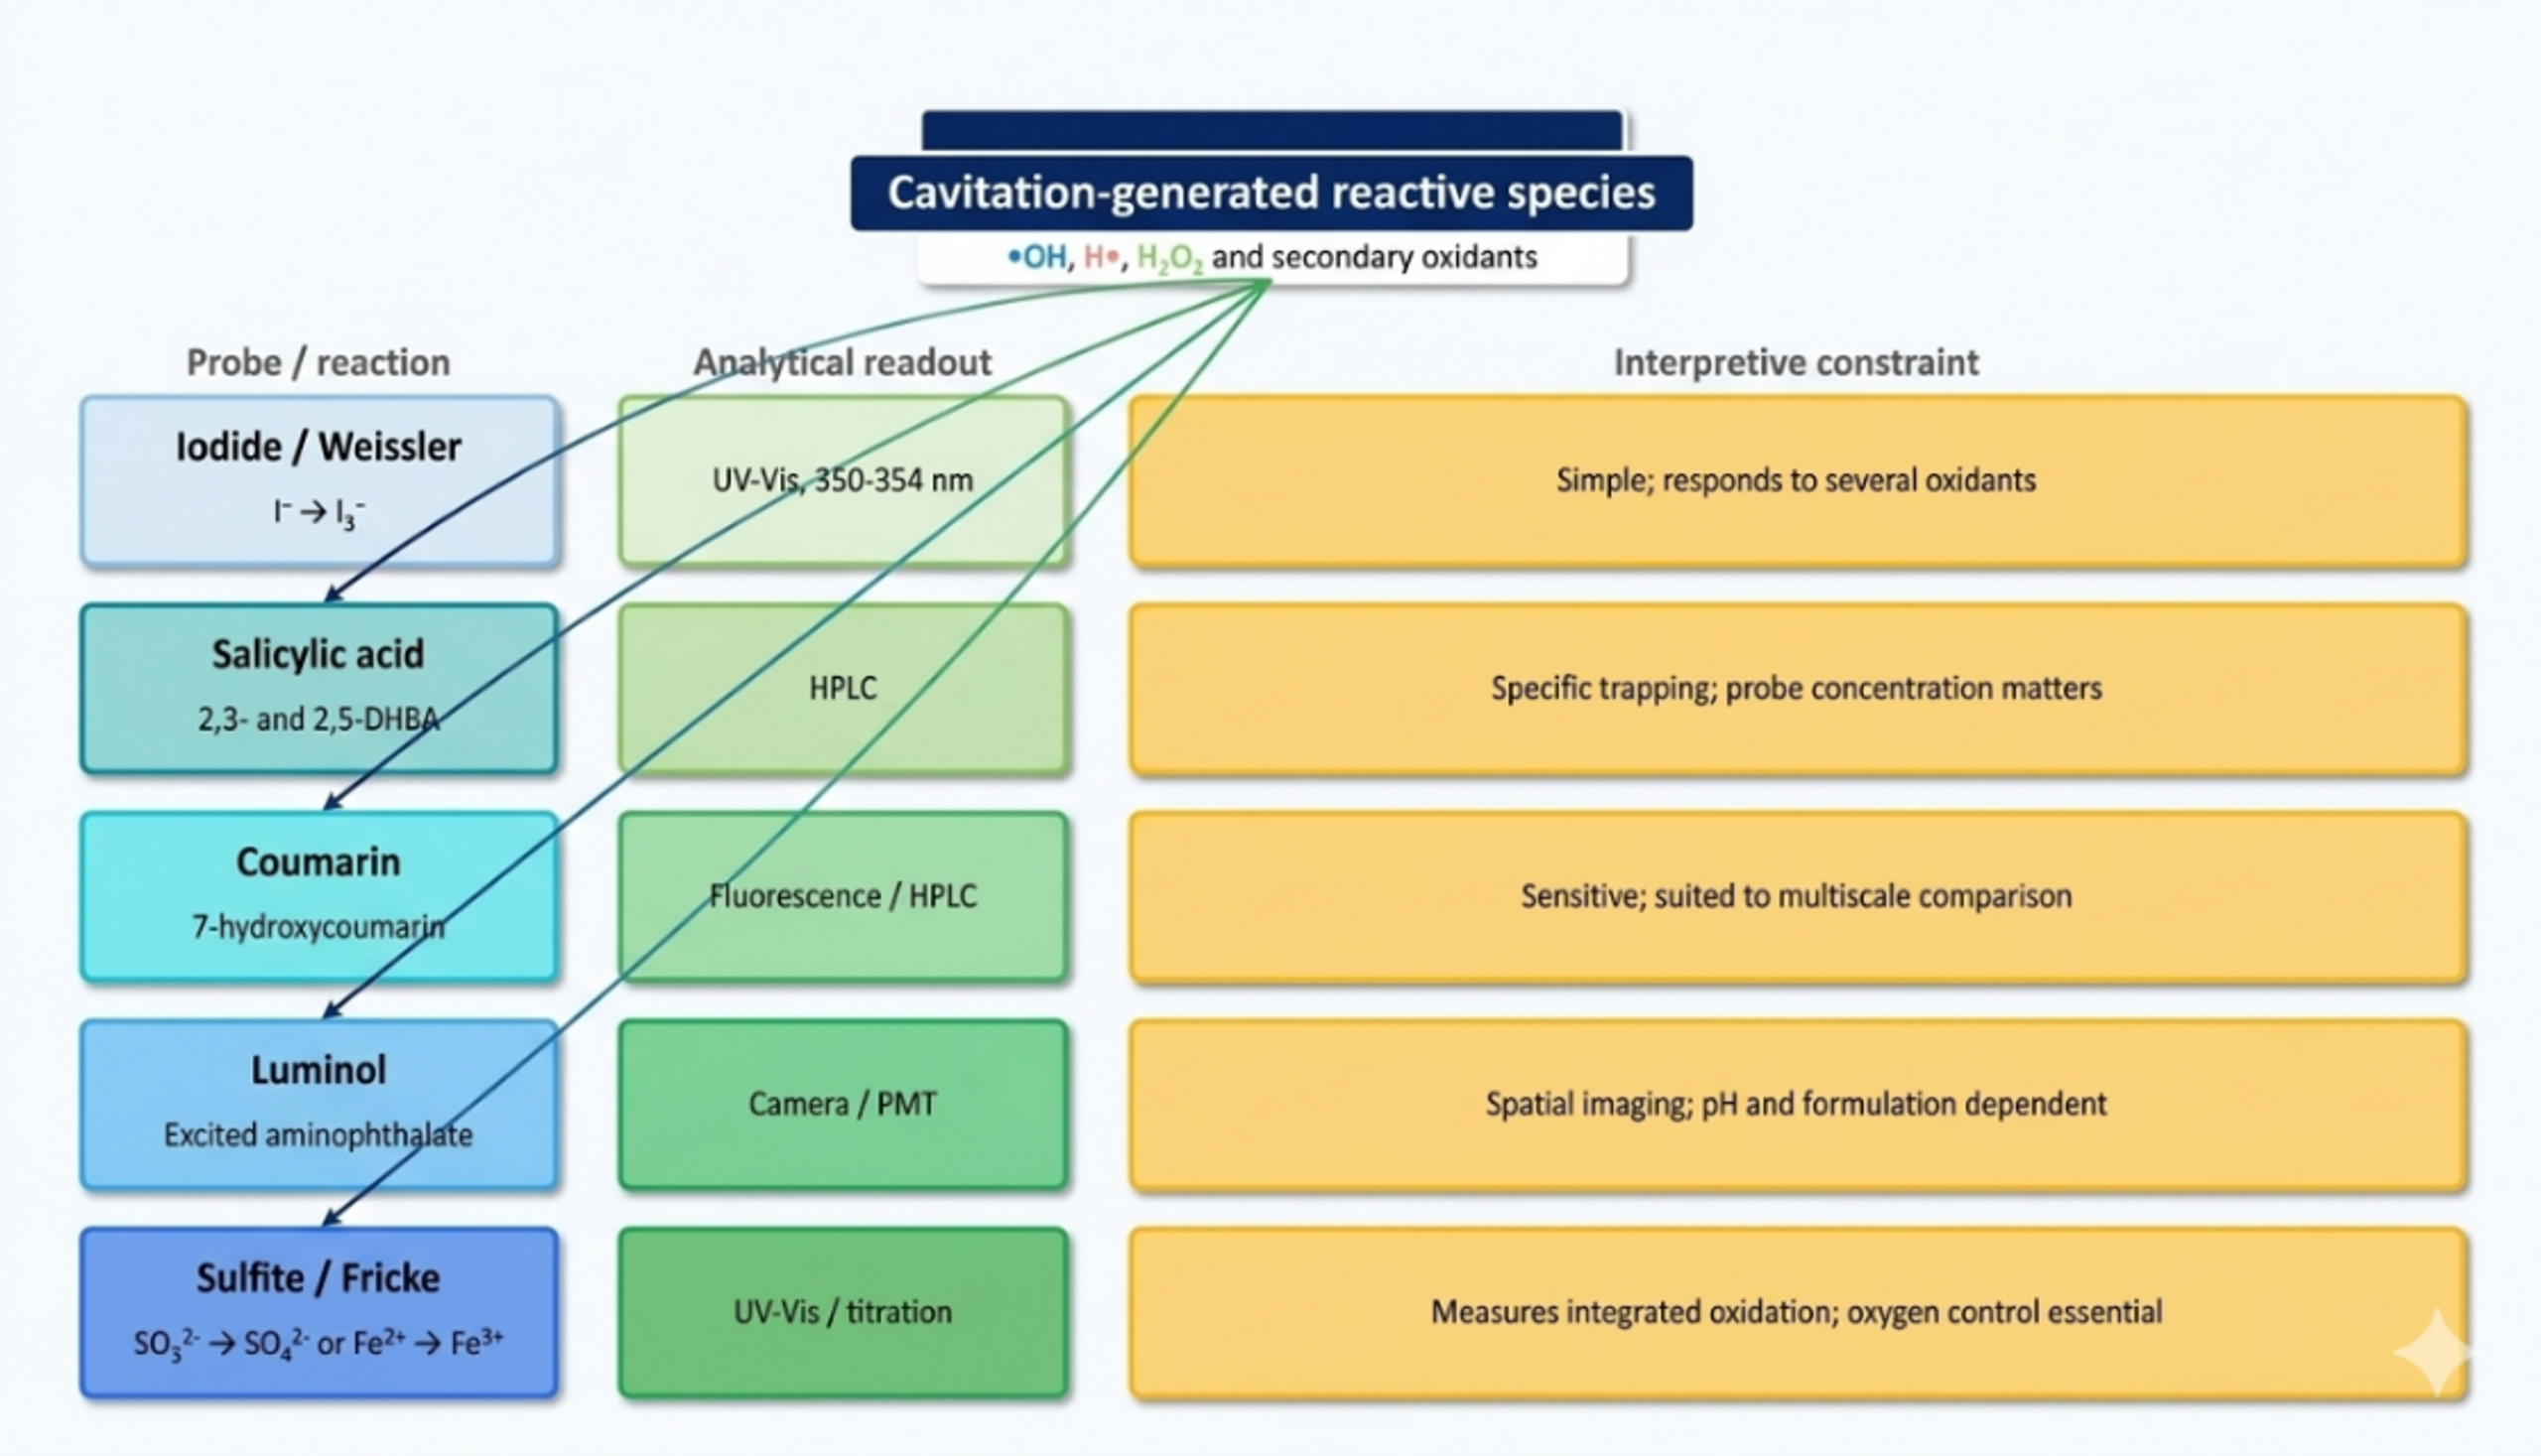
Figure 14.7. Selection logic for chemical dosimetry of hydrodynamic cavitation [81].
Spatially resolved luminol imaging provides an additional layer of evidence. Nöpel and coworkers examined a cavitating free jet from 1.0 and 1.7 mm orifices at 10 to 30 bar [68]. The luminous region expanded with inlet pressure and was substantially larger for the 1.7 mm orifice at the same pressure because of the higher flow rate. When the luminous volume was normalized by reactor volume and plotted against hydraulic power, the two orifices approached a common trend. This result indicates that hydraulic power can organize the gross spatial extent of chemistry, while local intensity and chemical yield still require a separate measurement.
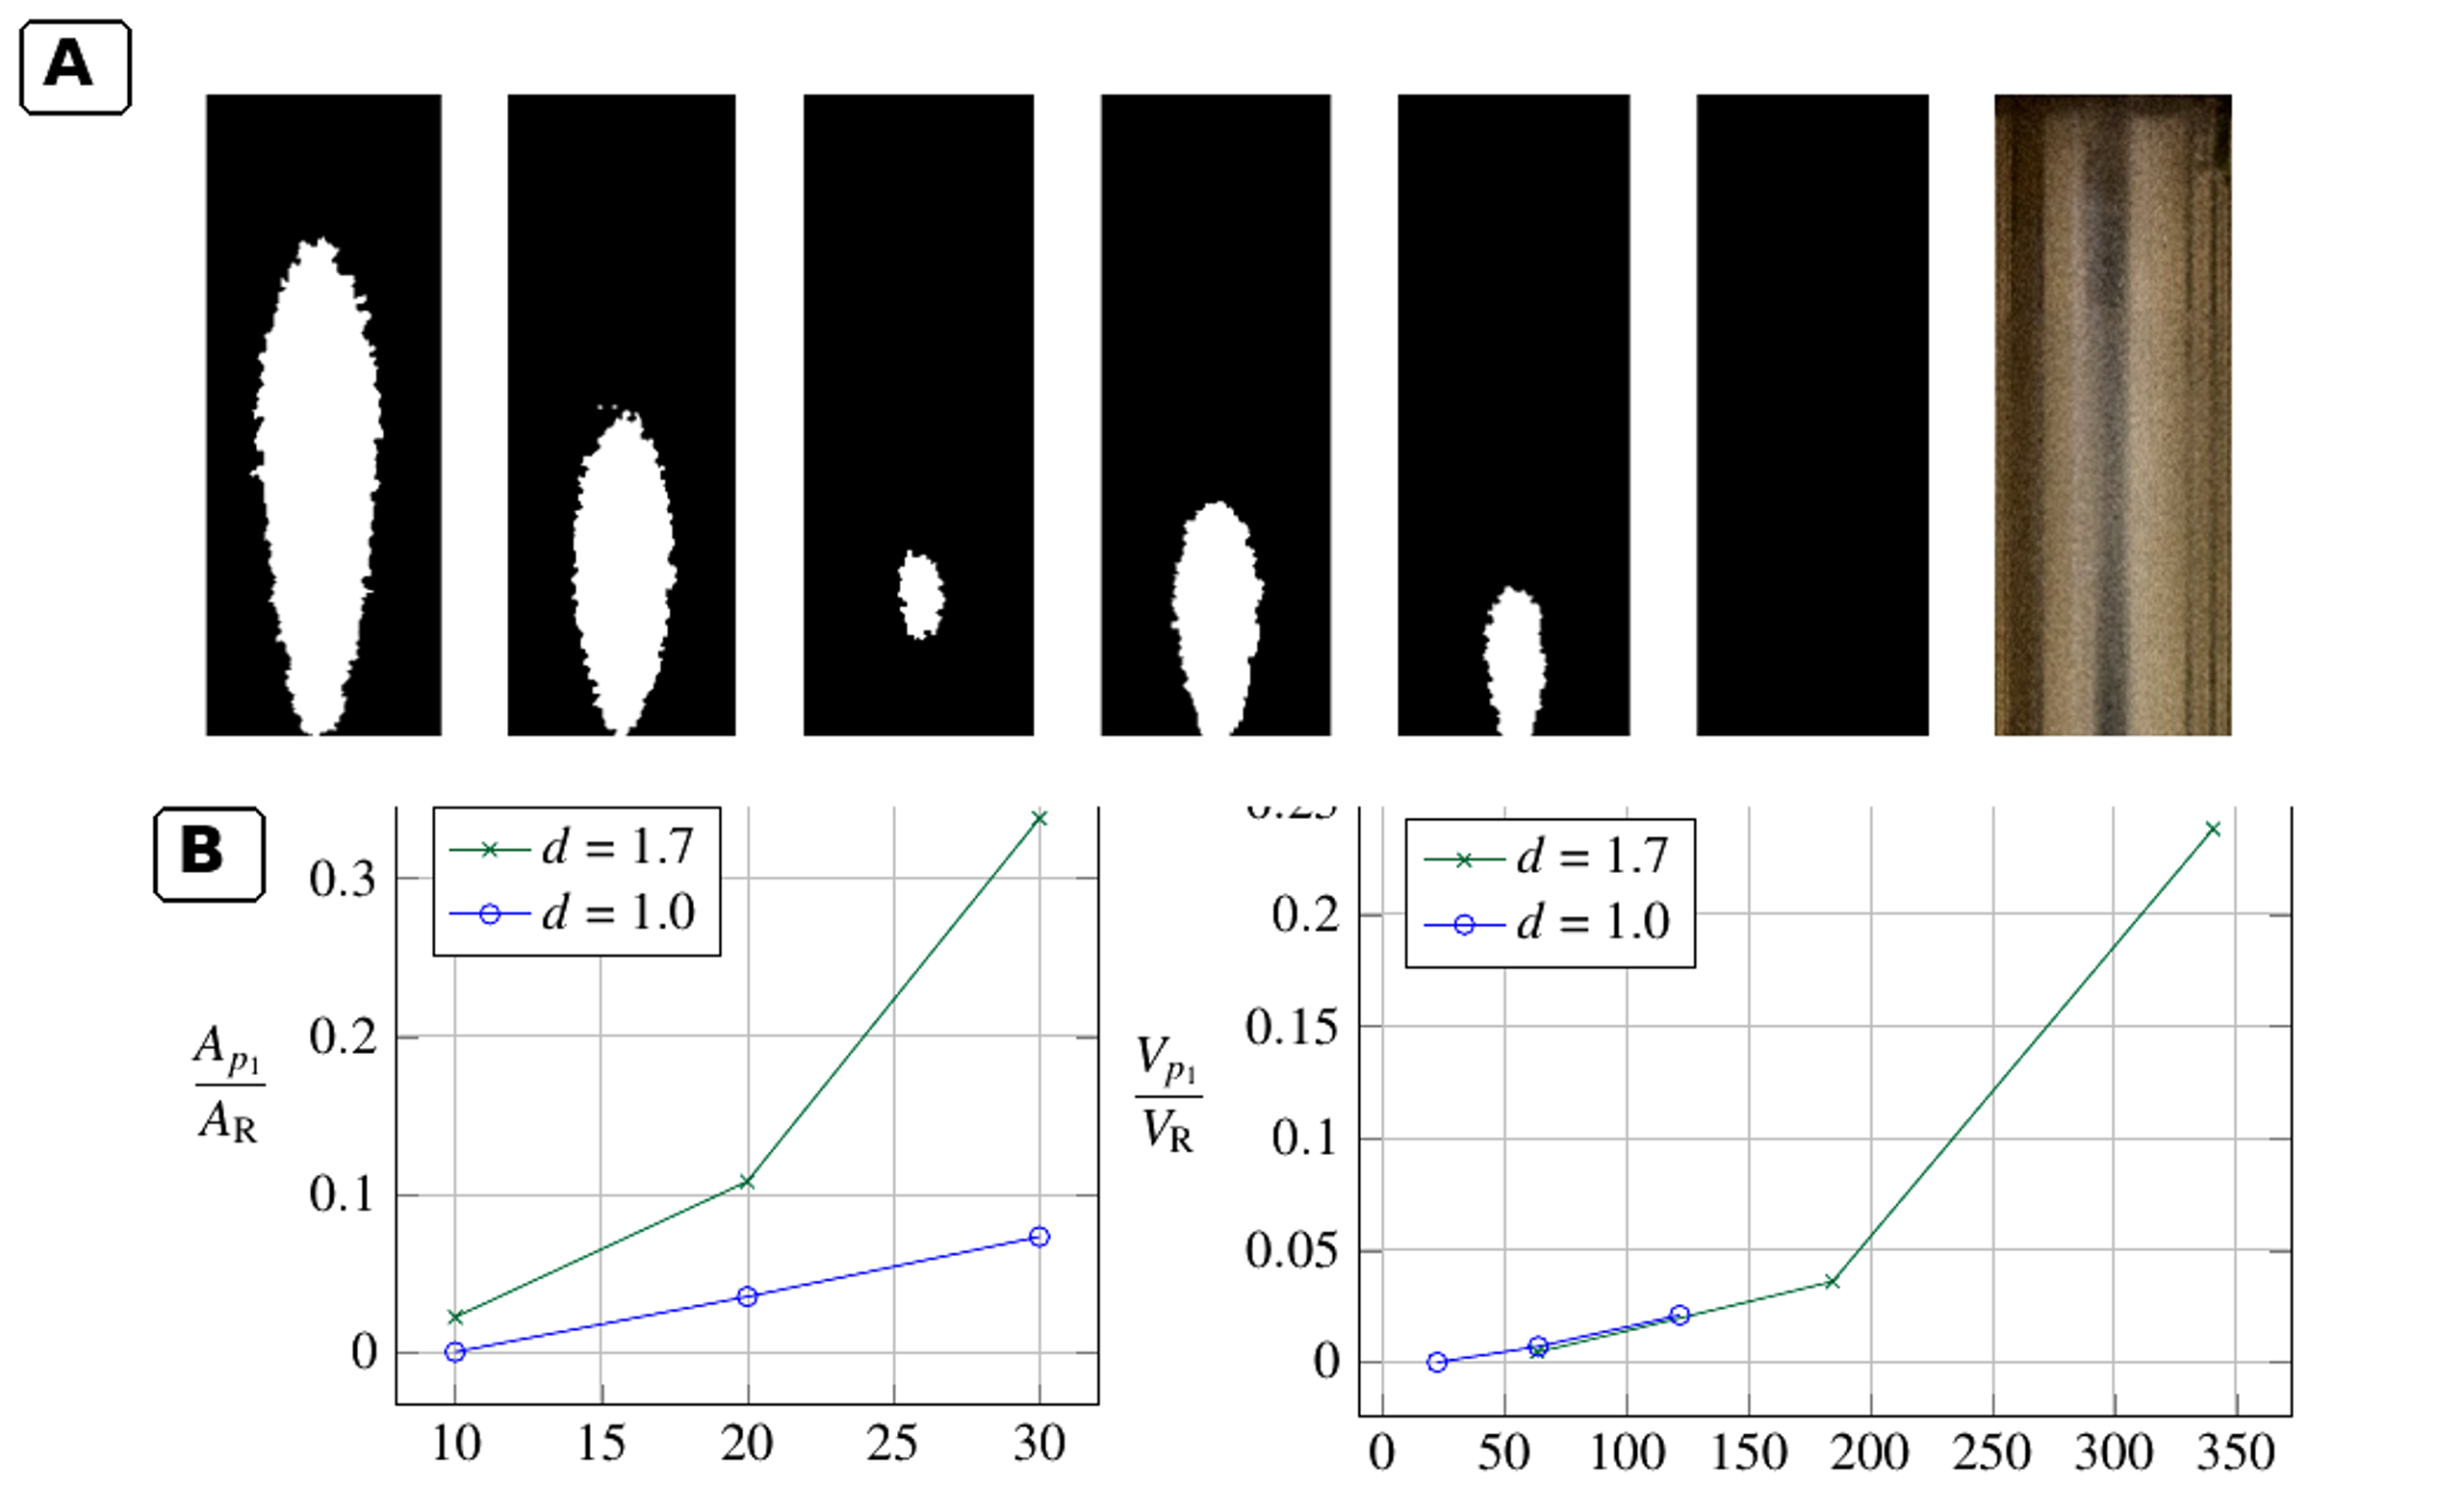
Figure 14.8. Spatial distribution of luminol chemiluminescence and normalized light emitting region in an orifice jet reactor [68].
Tandiono and coworkers demonstrated sonochemistry and sonoluminescence in microfluidic channels under acoustic excitation [69]. Although the forcing mechanism was acoustic, their observation that chemiluminescence was concentrated near gas liquid interfaces is directly relevant to hydrodynamic microdevices. It supports the three zone interpretation: reactant location relative to the bubble core and interface strongly controls which pathways are observed.
14.4 Coupling cavitation with oxidants: decolorization is not mineralization
Rajoriya, Bargole, and Saharan evaluated Rhodamine 6G degradation in circular and slit Venturi reactors and then coupled hydrodynamic cavitation with hydrogen peroxide and ozone [70]. Under their optimized HC only condition, the reported decolorization was 32.06 percent. Addition of hydrogen peroxide at a dye to peroxide molar ratio of 1:30 increased decolorization to 53.72 percent. The HC ozone combination achieved complete decolorization in about 10 min under the reported conditions, while 84 percent TOC removal was obtained at 20 bar with an ozone feed of 3 g h⁻¹ after 120 min. The difference between color removal and TOC removal is fundamental: cleavage of the chromophore can be rapid even when substantial organic carbon remains.
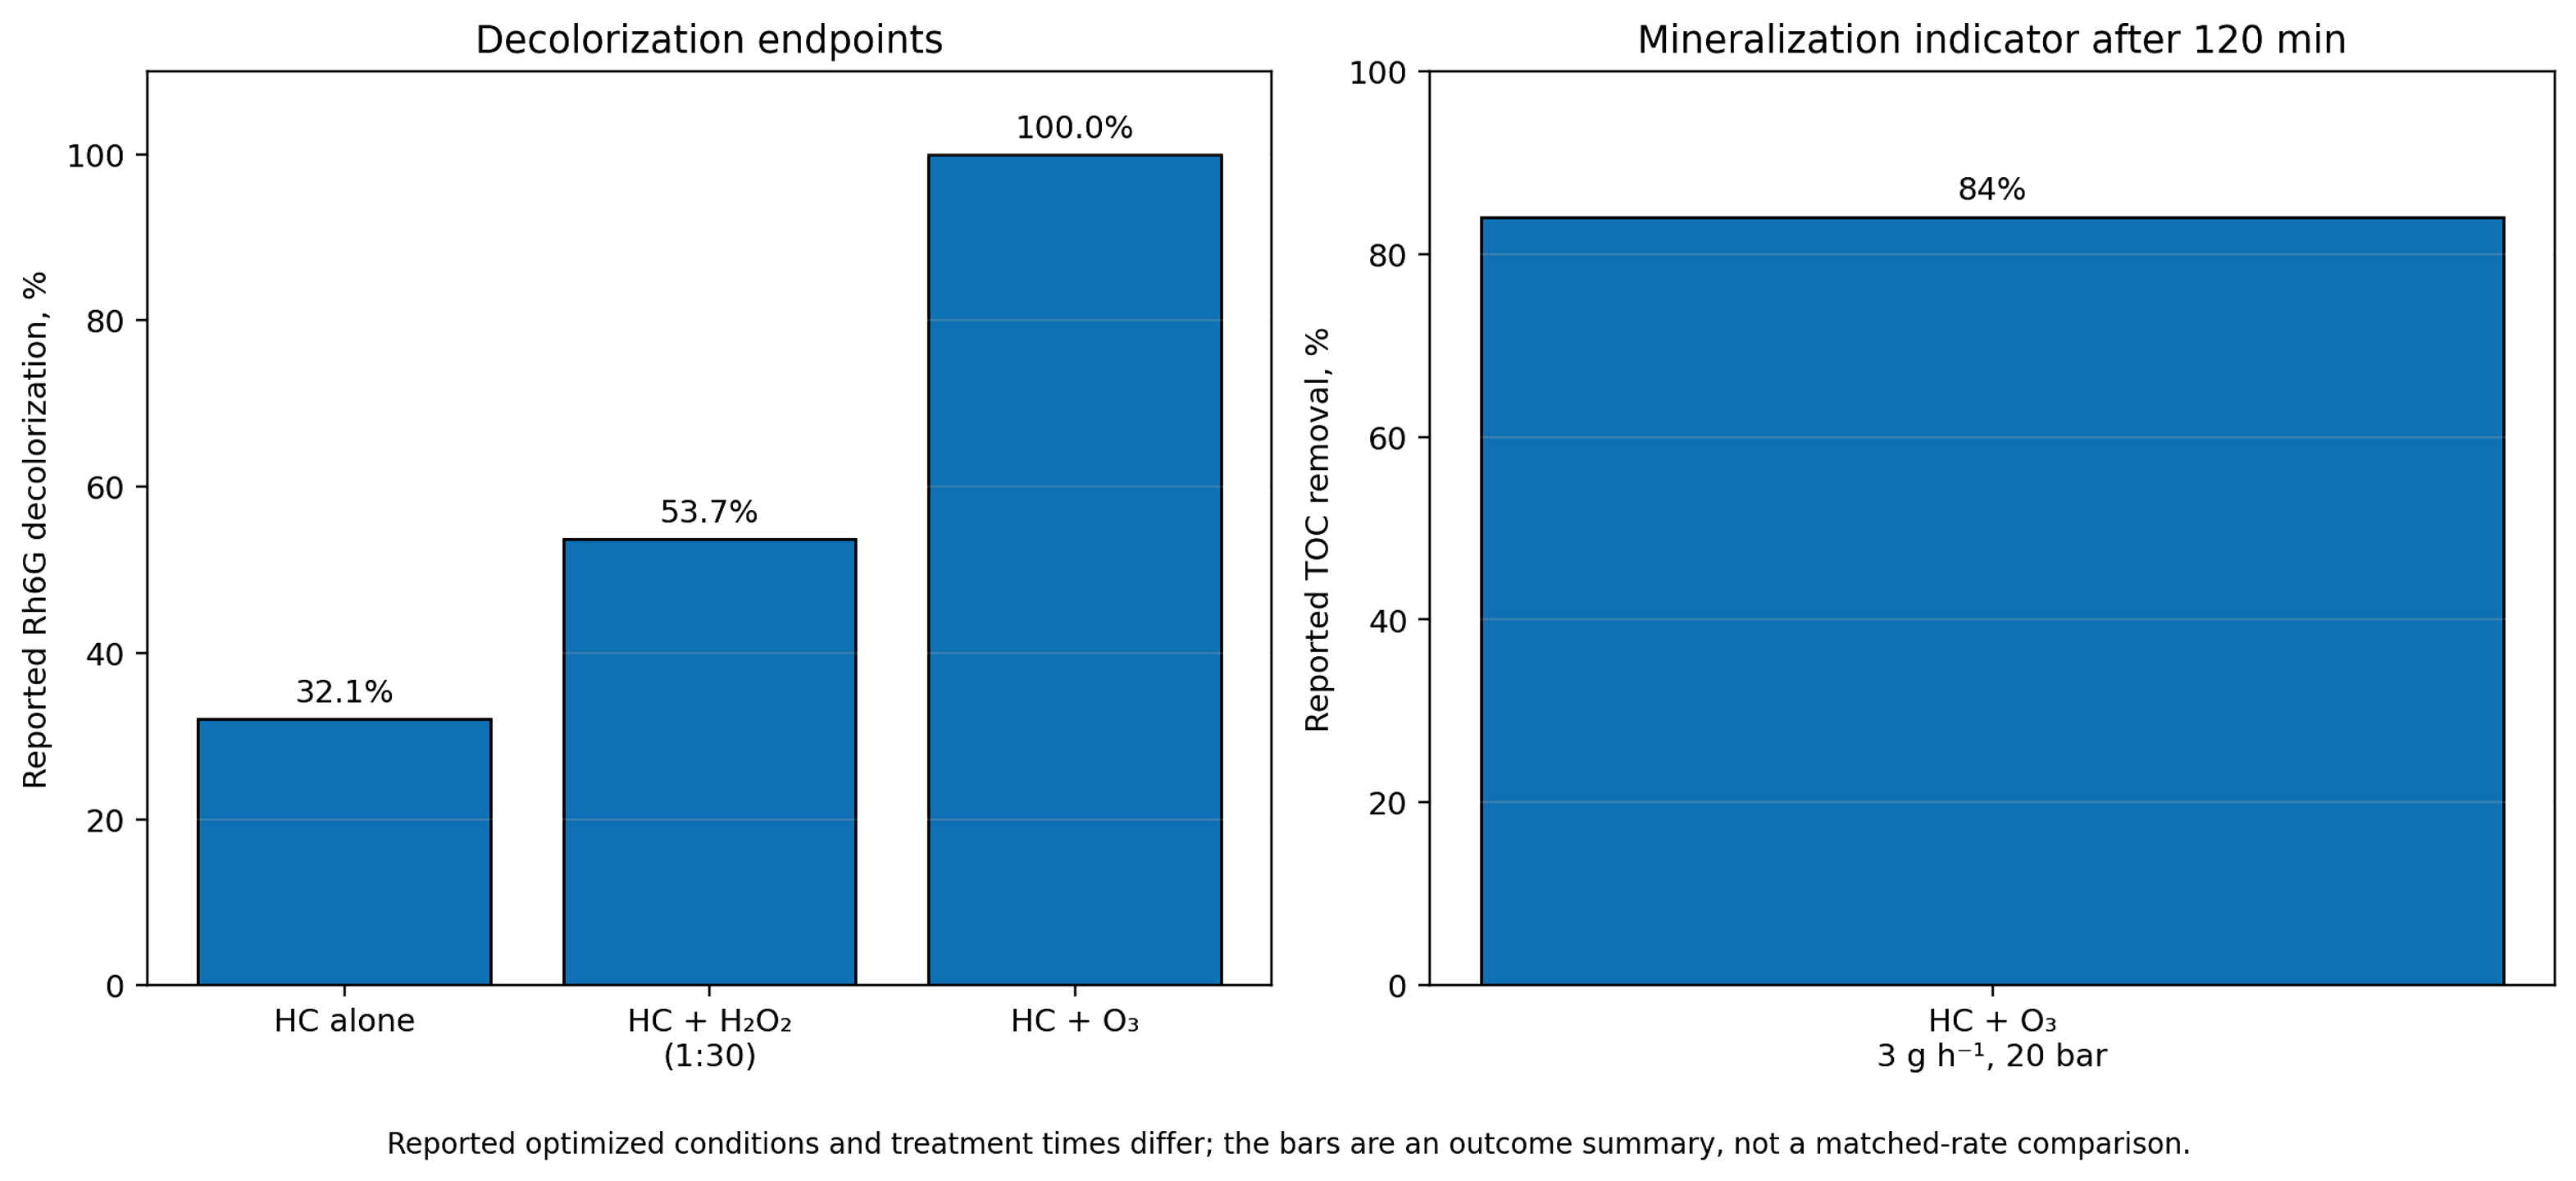
Figure 14.9. Reported Rhodamine 6G decolorization and mineralization indicators for selected optimized conditions. [70].
Hybrid process claims should be tested against component controls at matched temperature, reagent dose, gas transfer, residence time, and energy input. Ozone injected at or near the low pressure region can improve gas liquid transfer and expose ozone to radical generating collapse, but it also adds electrical energy for ozone generation. A whole process evaluation must therefore report both the cavitation loop power and the oxidant generation power.
14.5 Vortex devices and the scale dependence of radical efficiency
Vortex based devices generate a low pressure core through swirling motion rather than a narrow wall bound constriction. The configuration can keep the principal cavity away from solid surfaces, reduce clogging risk, and process liquids with suspended solids. Figure 14.10 shows the inlet, processing vortex core, inception zone, collapse zone, and pressure drop used in a recent multiscale analysis [71].
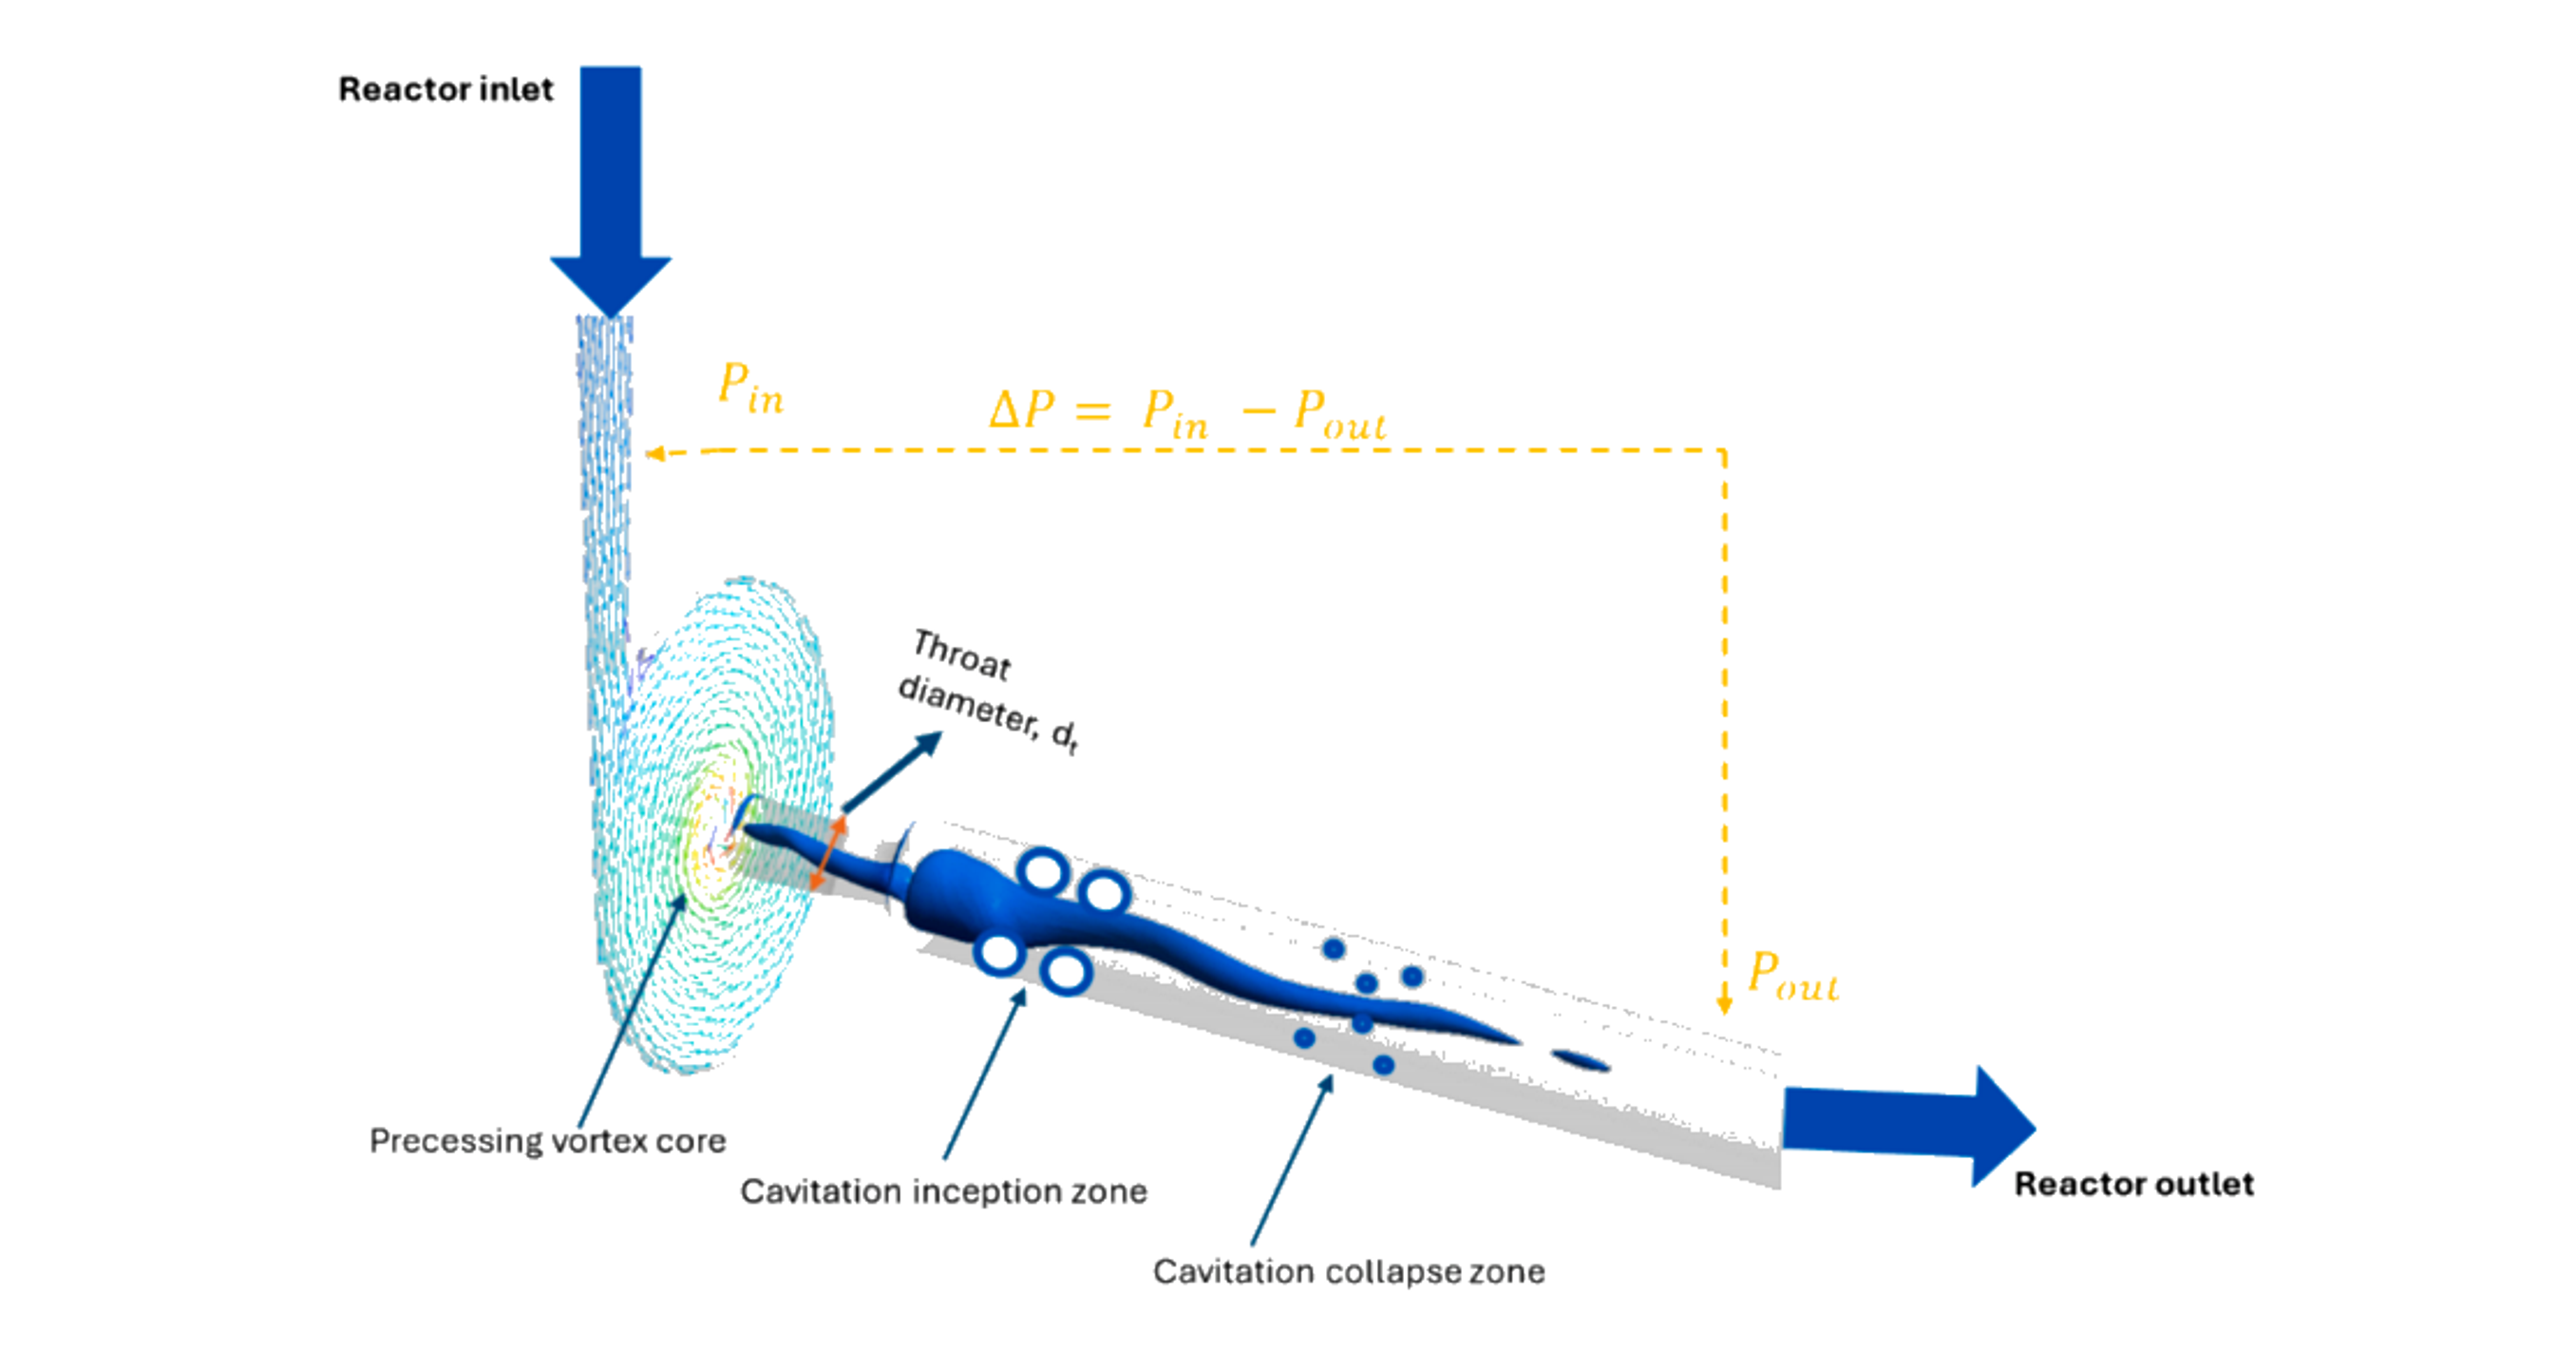
Figure 14.10. Vortex based hydrodynamic cavitation reactor and characteristic cavitation zones. [71].
Khare and Ranade used validated turbulence and cavitation models to study geometrically similar vortex devices over nearly three orders of magnitude in flow rate [72]. Their cavitation extent, defined as dimensionless vapor volume relative to input power, decreased strongly with throat diameter. The reduction persisted even when energy consumption per unit mass was held constant, because specific dissipation, pressure fluctuation amplitude, and characteristic turbulence frequency changed with scale. Figure 14.11 illustrates the decline in cavitation extent with increasing throat diameter and its nonlinear dependence on throat velocity.
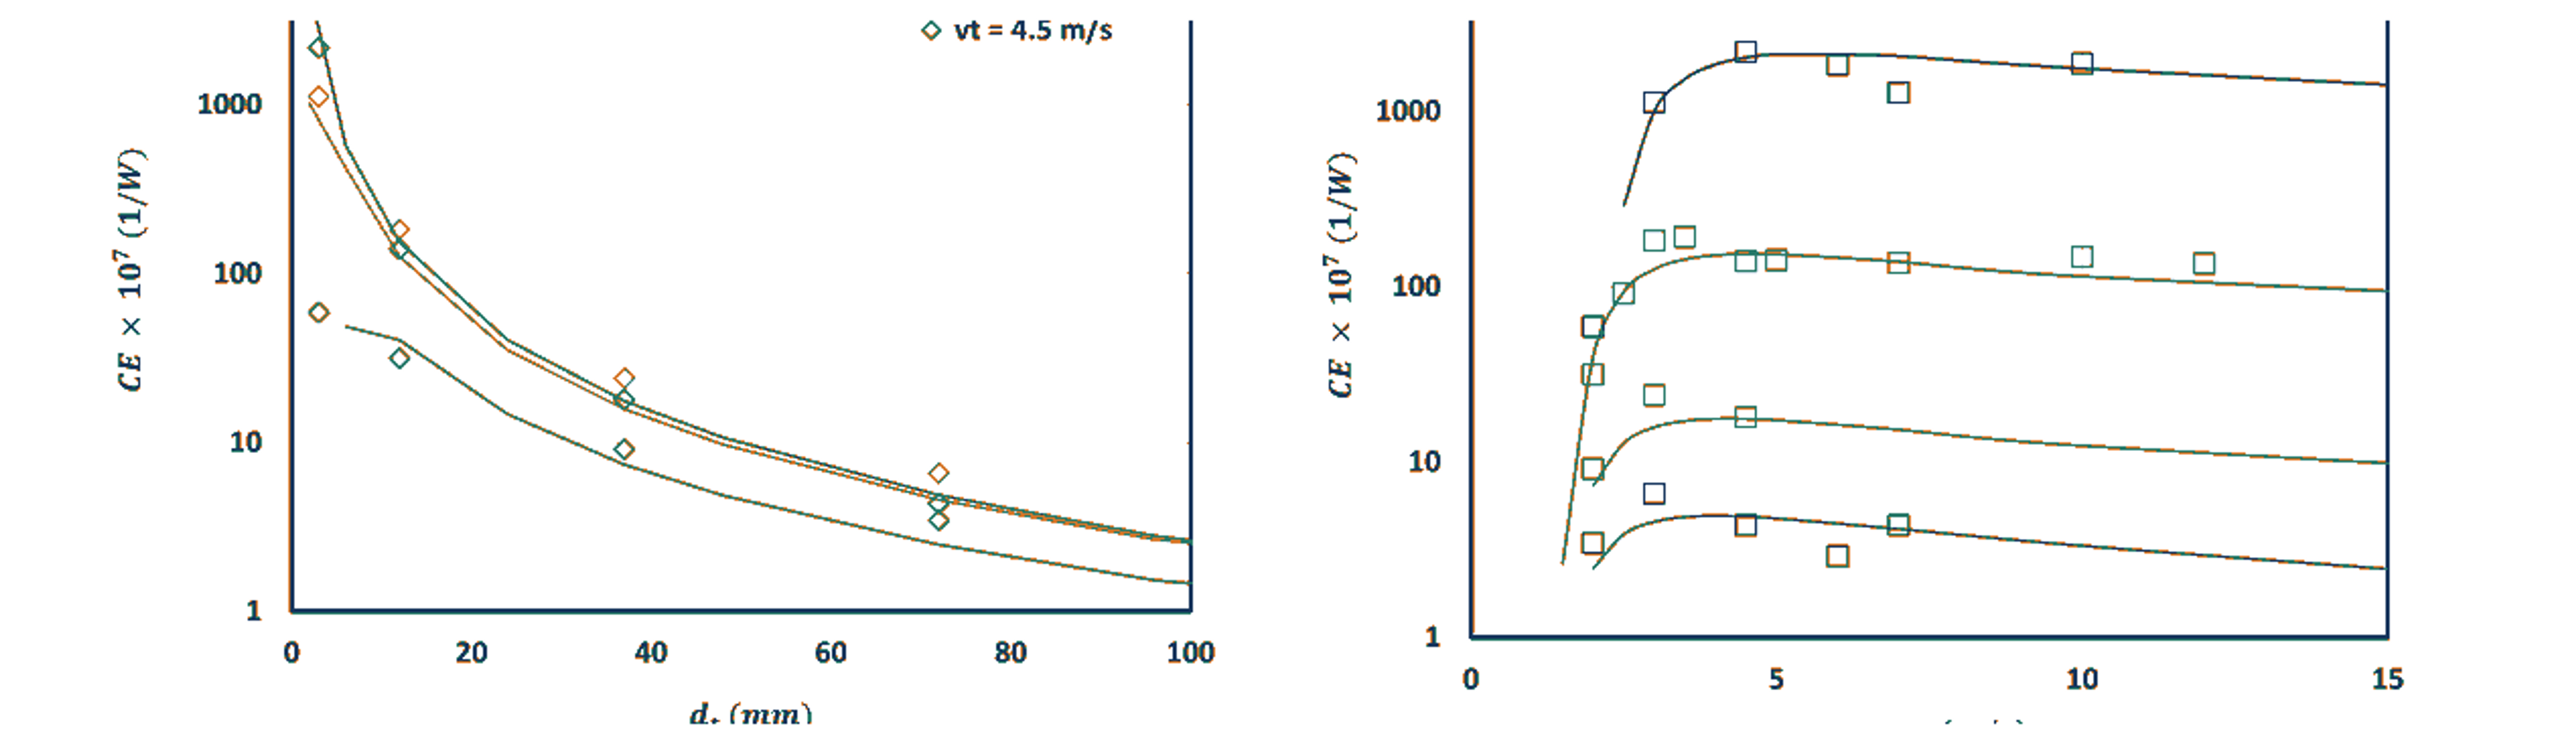
Figure 14.11. Scale and velocity dependence of cavitation extent in vortex devices. [72].
Pang and coworkers combined coumarin dosimetry datasets from 6, 12, and 38 mm vortex devices with machine learning models [71]. The XGB and ANN models reproduced experimental trends and predicted a general decline in radical yield per energy and throughput as throat diameter increased. Figure 14.12 compares model trends with experimental degradation data at a standardized number of passes. The result does not imply that a larger reactor produces fewer total radicals. It means that radical production does not scale proportionally with flow capacity or energy input.
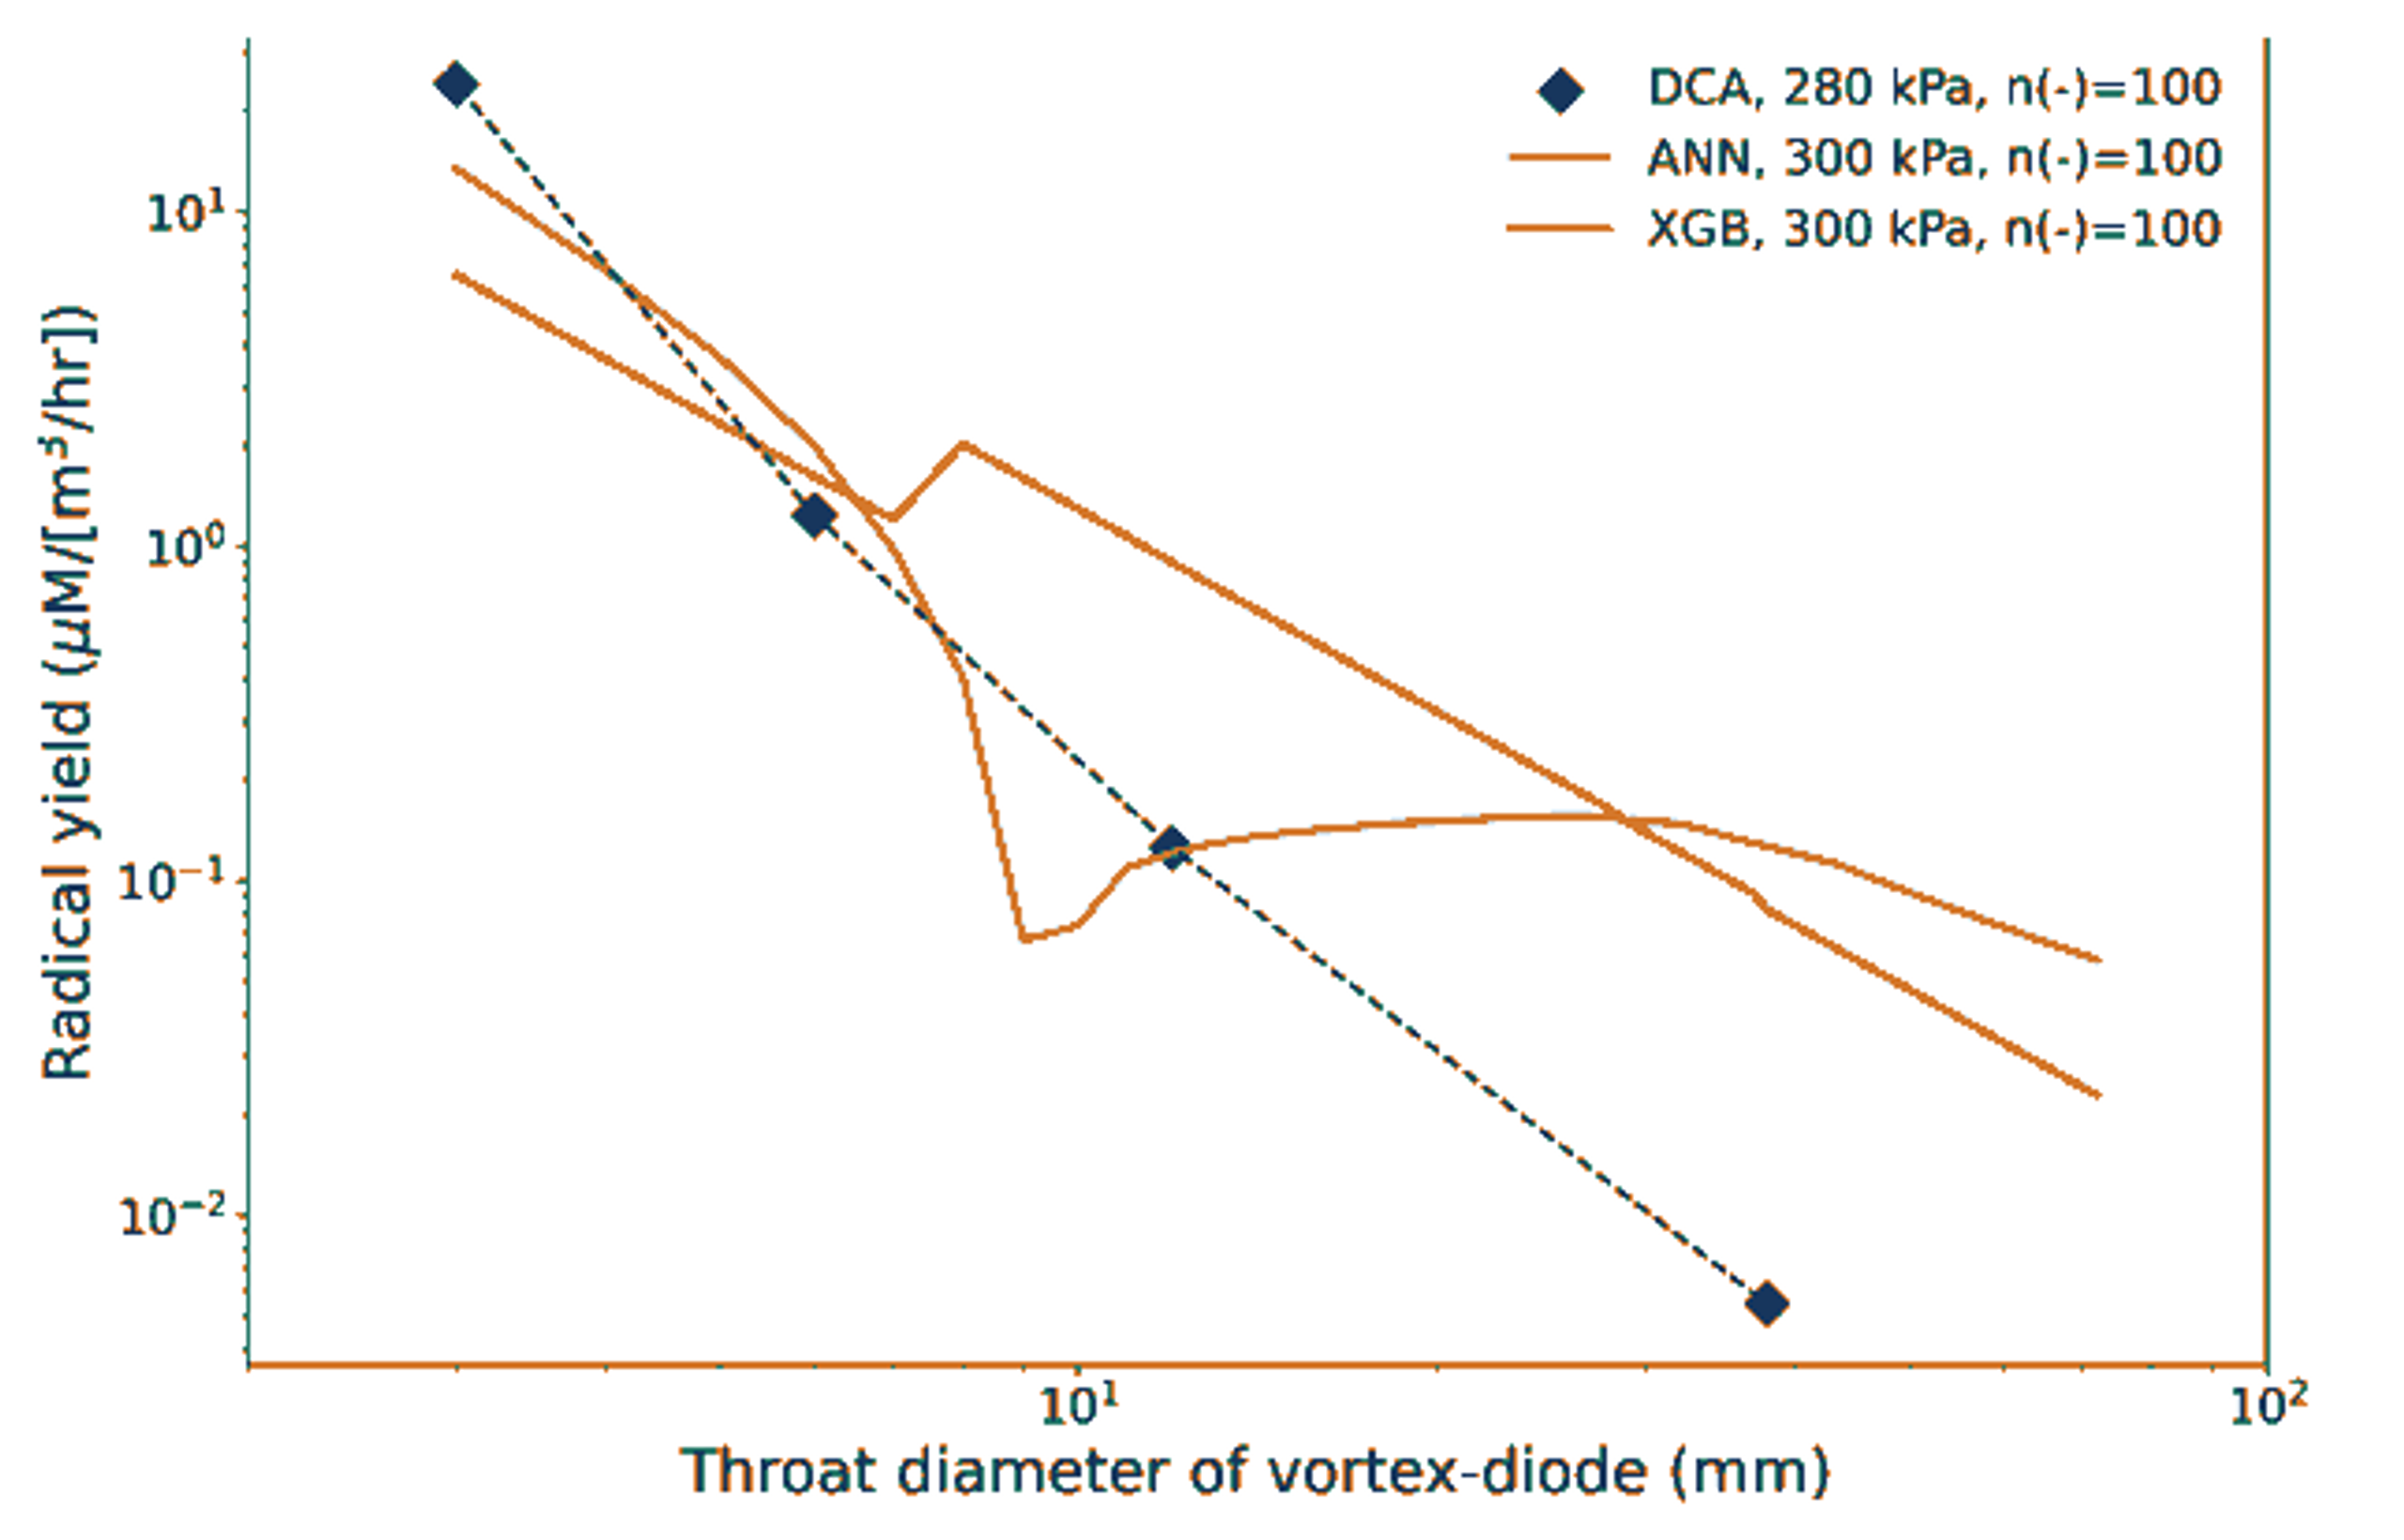
Figure 14.12. Relationship between vortex device throat diameter and radical yield. [71].
These studies establish a practical scale up rule: geometric similarity and constant pressure drop are insufficient. Scale up must preserve or compensate for the distributions of residence time, minimum pressure, pressure fluctuations, specific dissipation, bubble population, and collapse frequency. Numbering up smaller devices may be preferable when radical efficiency is the governing objective, while a larger unit may still be superior when solids handling, maintenance, and throughput dominate the process economics.
14.6 Luminescence and thermal diagnostics
Luminescence can indicate energetic excitation, but it must be interpreted cautiously. Lockett and Bonifacio observed a blue violet emission in an optically accessible model diesel injector return valve above an upstream pressure of about 180 bar and obtained a stable signal at 240 bar [73]. The mean spectrum contained broad maxima near 351, 370, 390, 410, 431, and 457 nm. The authors assigned contributions to aromatic electronic transitions and species including H, CH, C₂, and C₃, but they also argued that the steady spatial location was consistent with triboelectric or electrokinetic excitation rather than classical bubble cloud sonoluminescence. The observation therefore supports energetic chemistry in the high pressure nozzle while also demonstrating that visible light is not, by itself, proof of a hot bubble core.
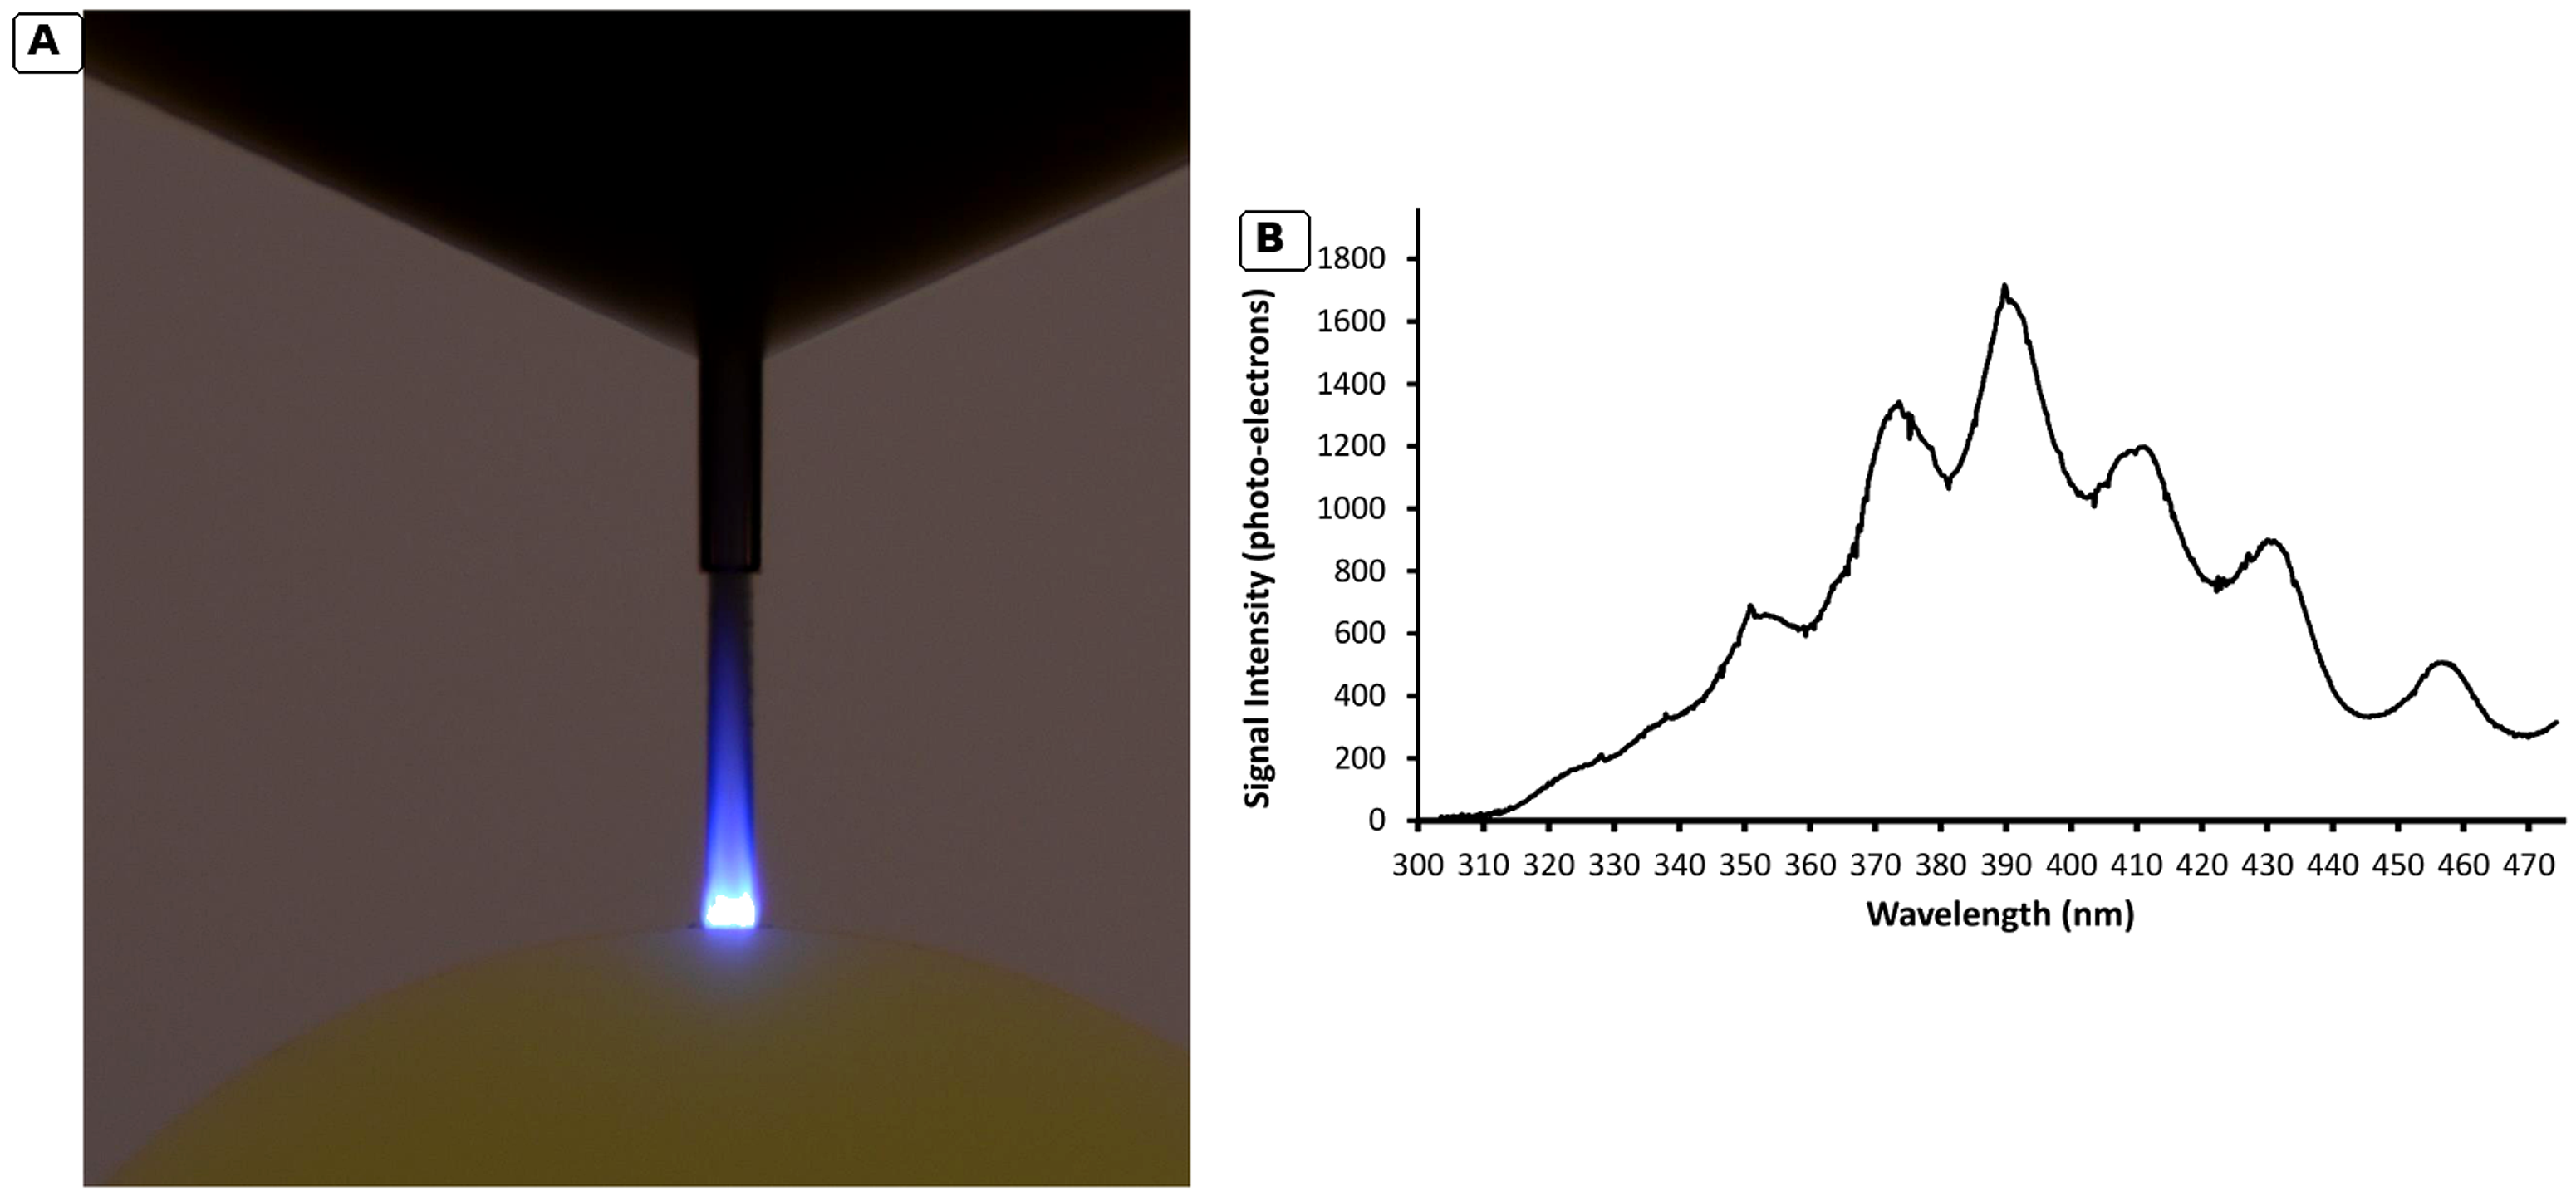
Figure 14.13. Hydrodynamic luminescence in a model diesel injector return valve and its mean spectrum. [73].
Thermal imaging can resolve a different part of the cavitation cycle. Osterman and coworkers used high speed infrared thermography at a water and silicon interface and measured local cooling associated with bubble growth [74]. The reported temperature depression reached approximately 0.3 K as a cold front developed and relaxed. This is a macroscopic interfacial thermal delay measurement, not a direct measurement of the nanosecond collapse temperature. It complements hot spot models by showing that evaporation removes latent heat before collapse and that the reactor can remain nearly isothermal in the bulk while containing extreme local events.
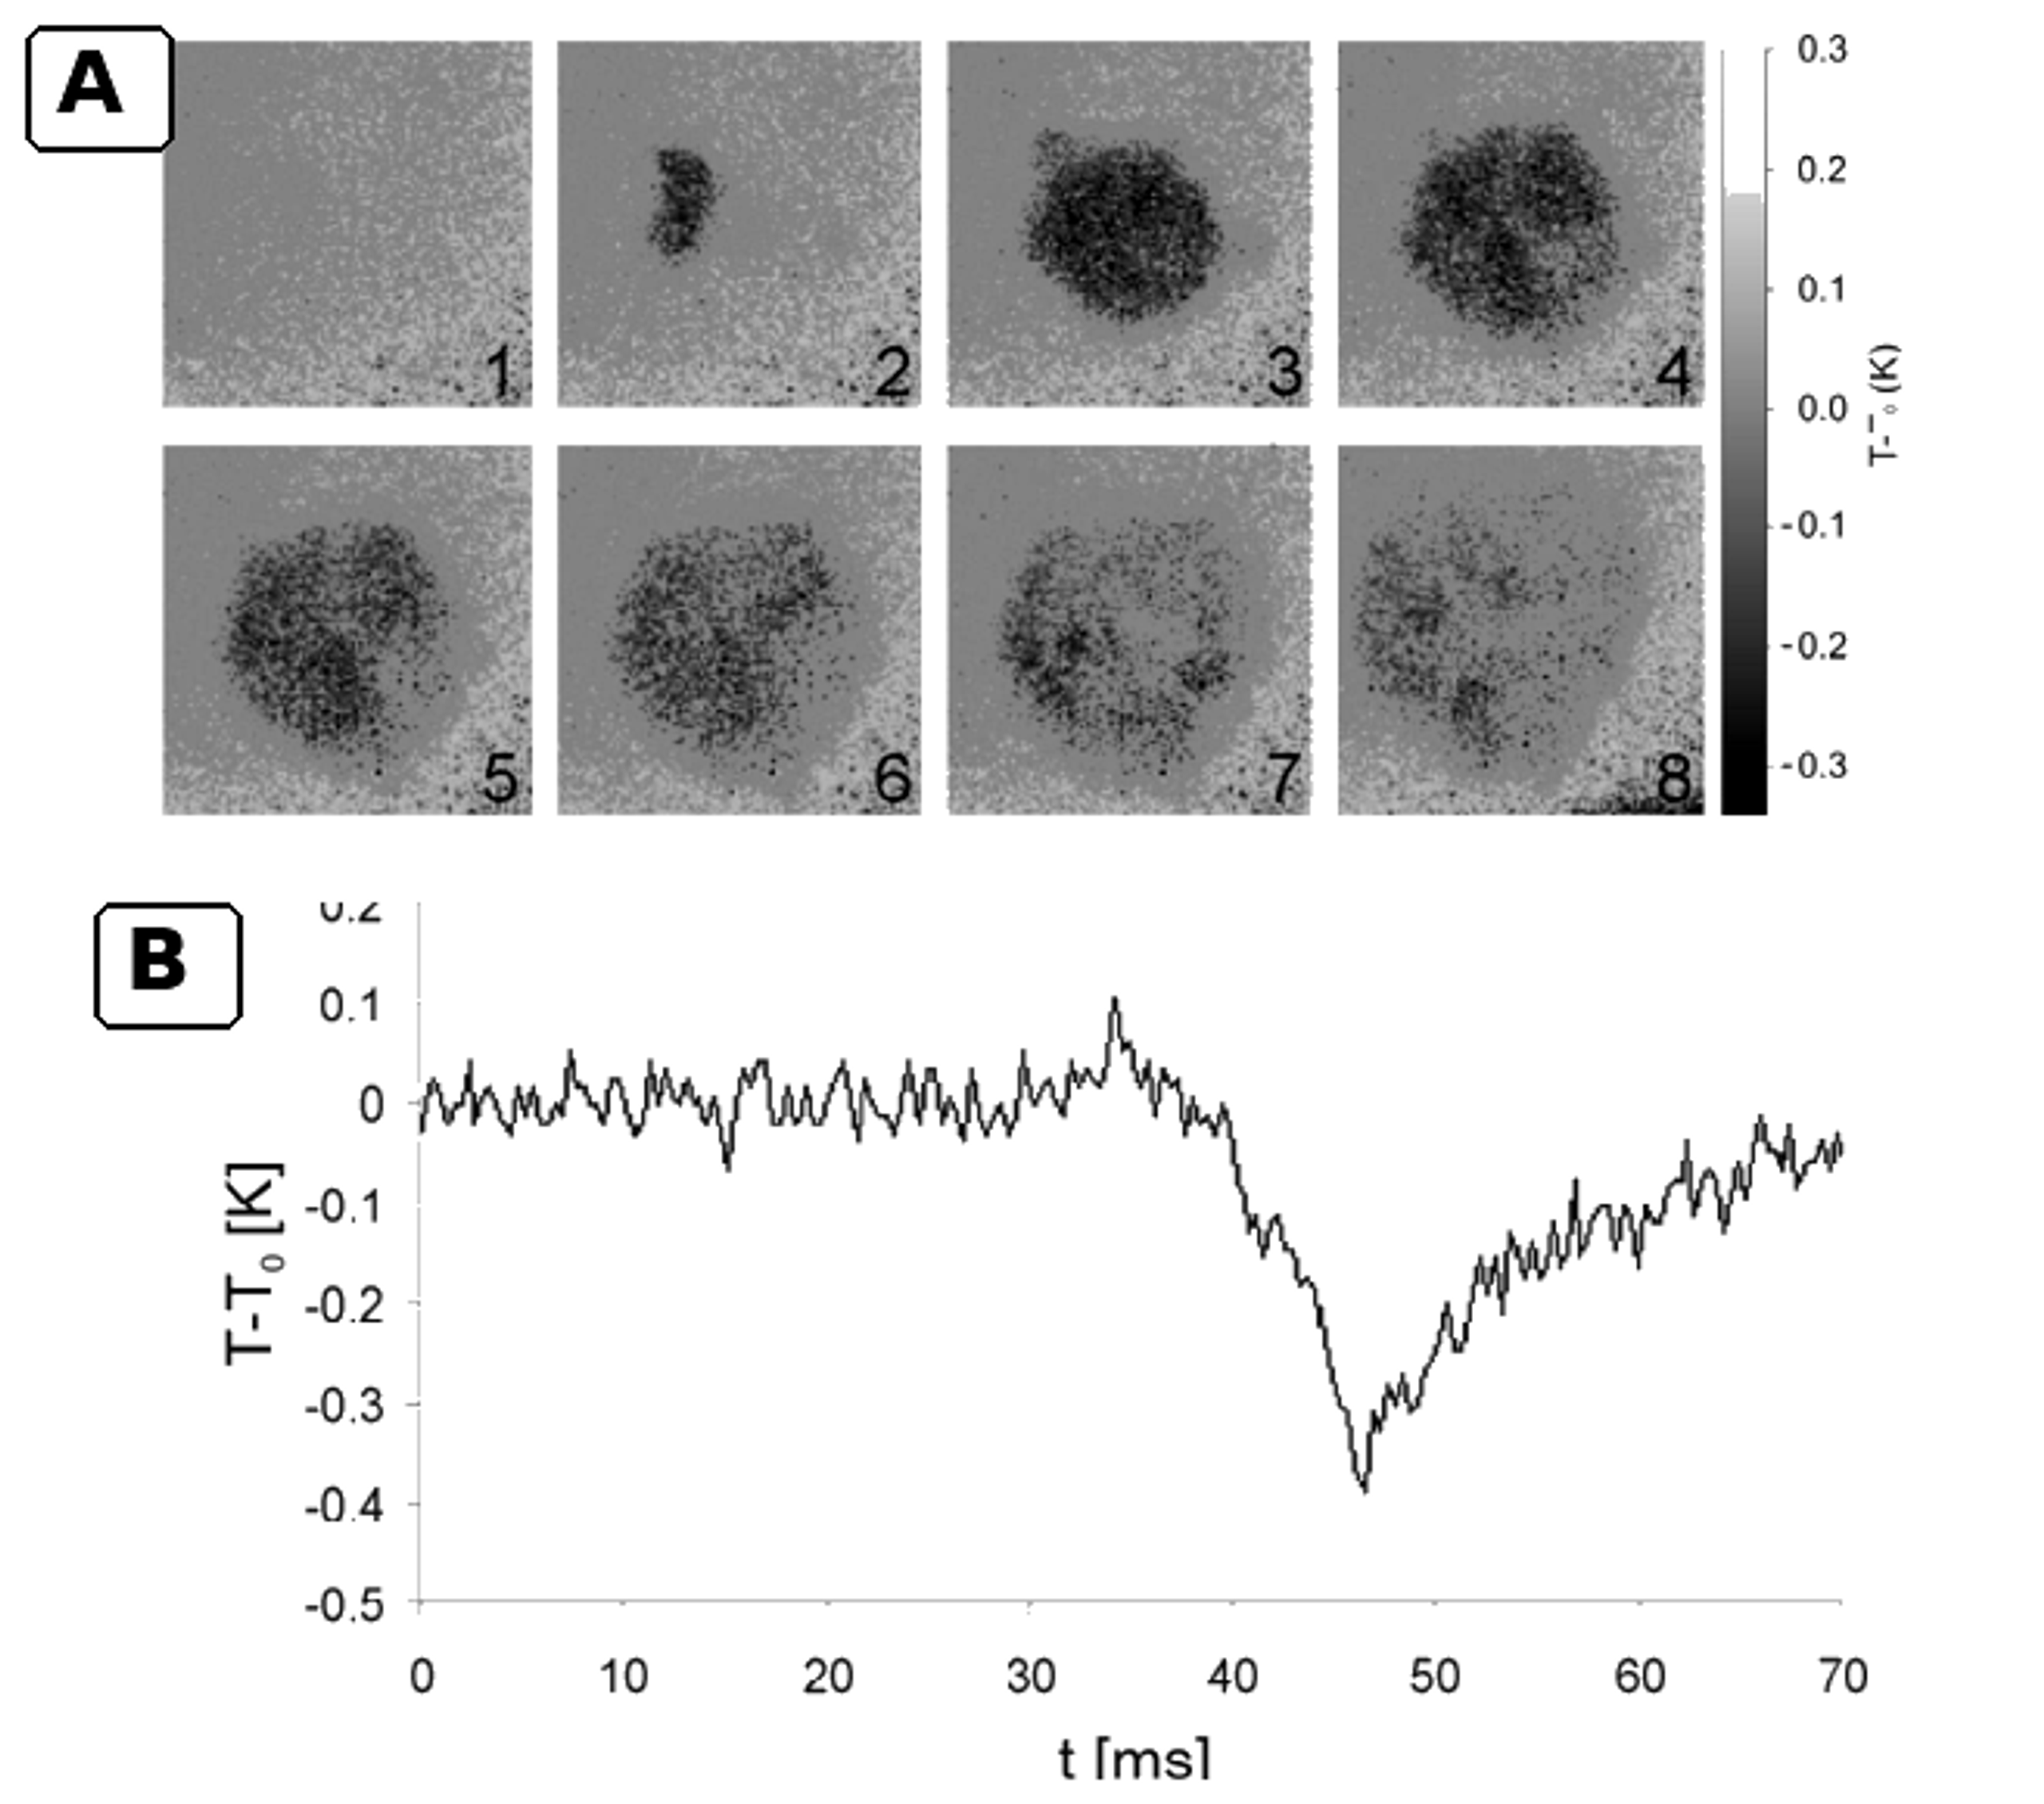
Figure 14.14. Infrared thermography of cavitation associated local cooling during bubble growth. [74].
14.7 Inorganic test programs supplied for this article
The provided technical reports [75-76] describe two complementary inorganic testing programs: iodide oxidation and sulfite oxidation. The iodide oxidation program employed UV visible spectral calibration of triiodide near 353 nm, multiple passes, controlled pressure, and energy normalized release calculations. The sulfite oxidation program utilized a nitrogen purged loop to suppress uncontrolled oxidation by atmospheric oxygen; residual sulfite was measured, and sulfate formation and oxidation efficiency were calculated. These reports are valuable for revealing practical issues often absent from journal reviews, including background signal correction, sampling, loop volume changes, heat exchanger loading, filtration, calibration drift, gas purging, and the distinction between per pass rates and rates per unit time.
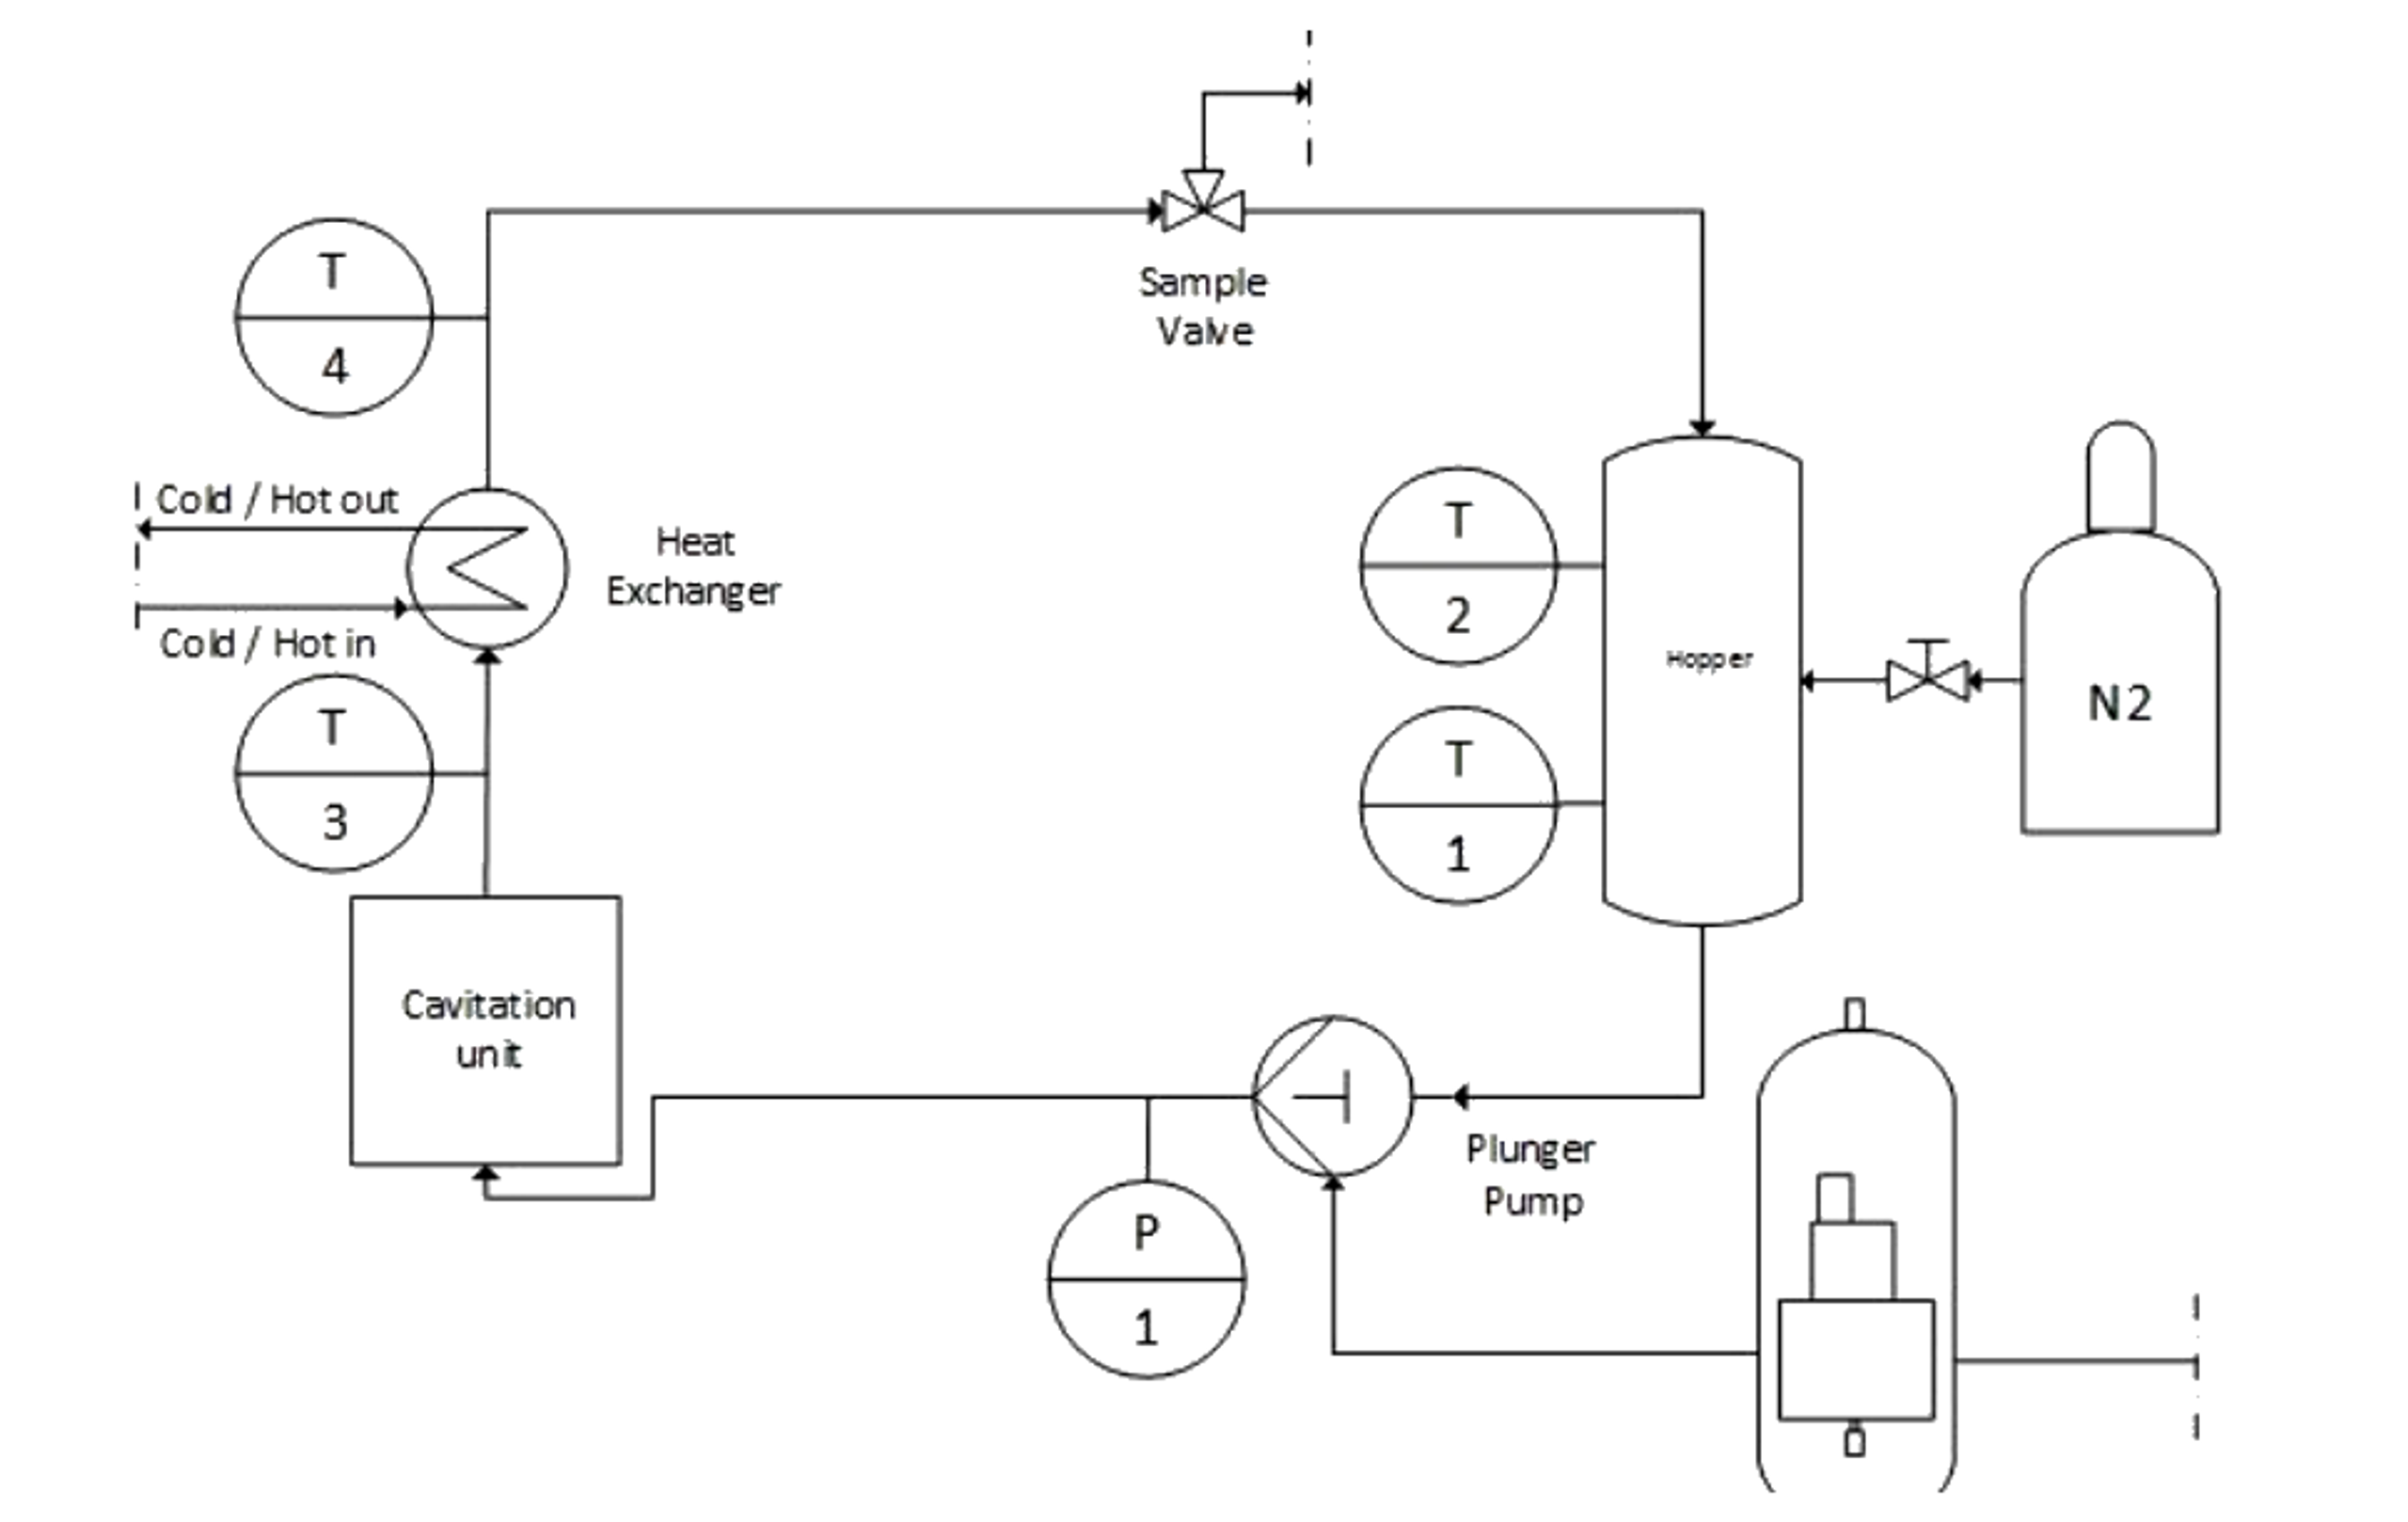
Figure 14.15. Nitrogen purged hydrodynamic cavitation loop used for sulfite oxidation measurements [76].
The supplied cavitating jet studies by Hutli and coworkers provide high speed and intensified camera records of jet morphology, cloud breakup, and discrete luminescence spots associated with bubble collapse [77-78]. Figure 14.16 presents a high contrast grayscale composite prepared from those records. The image processing removes the blue display background and increases contrast without adding, deleting, or relocating flow or luminescence features. These observations remain qualitative and should be related to chemical measurements only when pressure, nozzle geometry, exposure time, dissolved gas condition, and liquid temperature are matched.
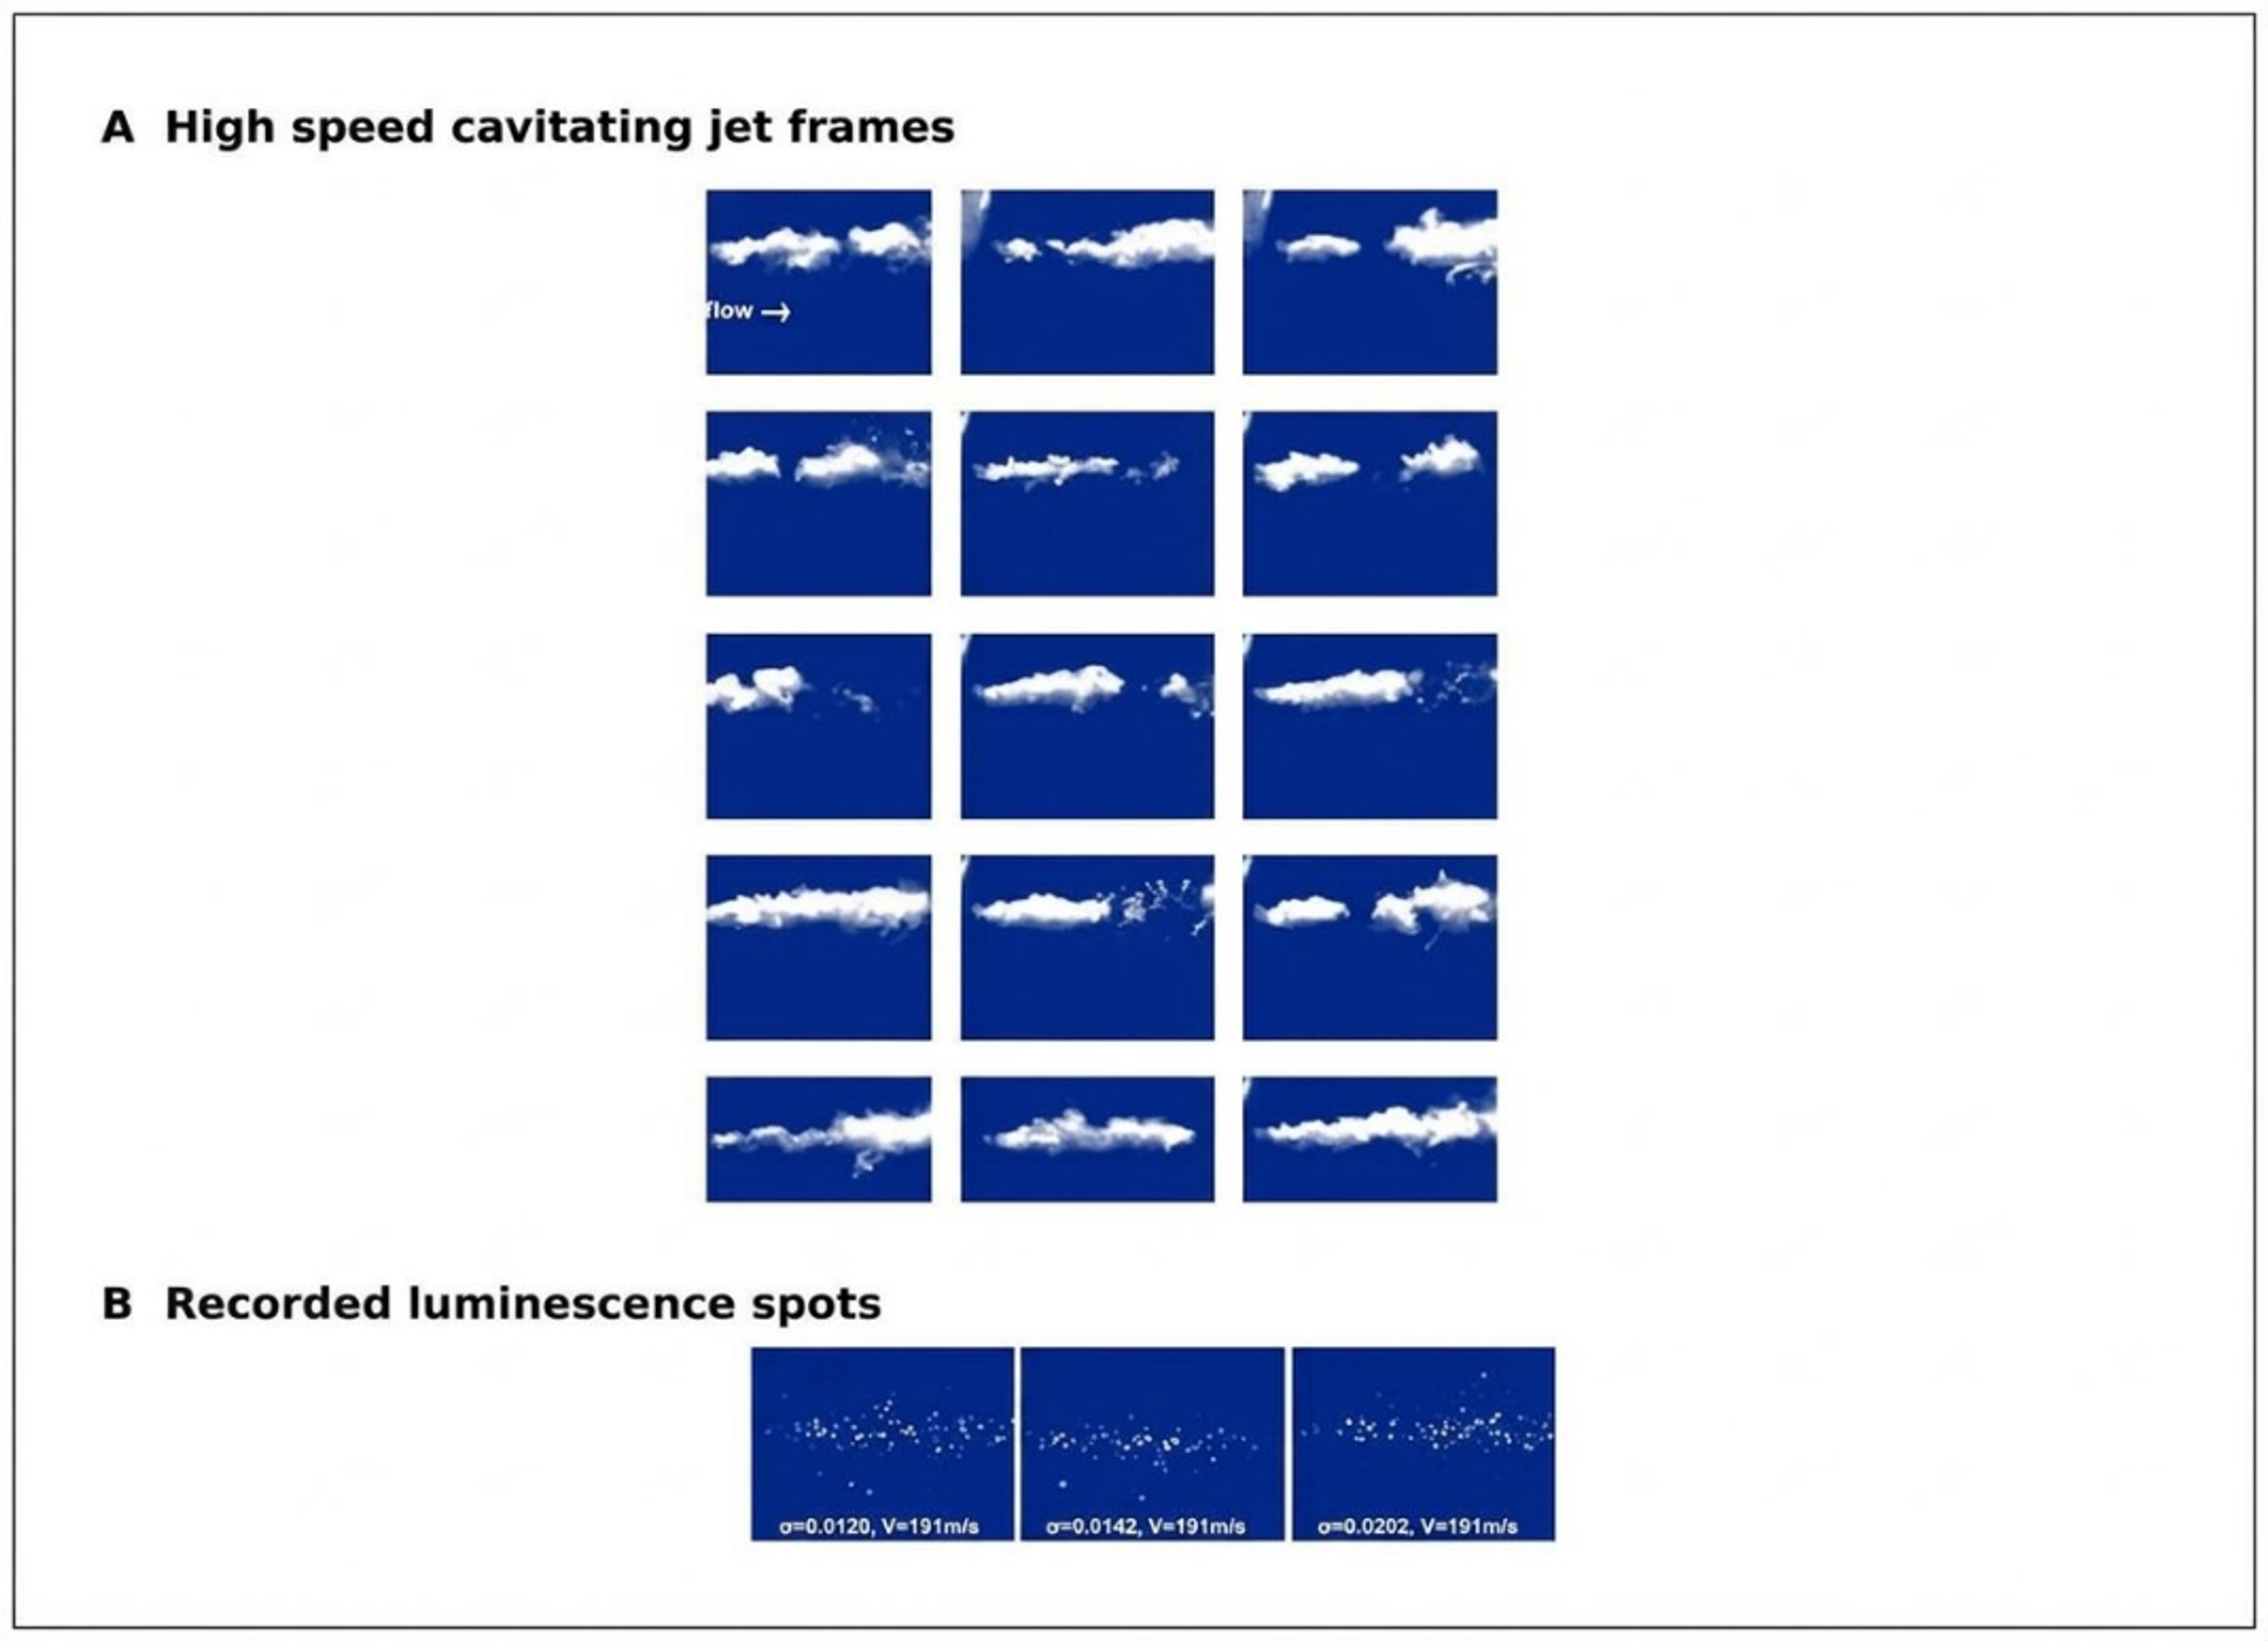
Figure 14.16. High speed cavitating jet frames and discrete luminescence spots recorded under submerged jet operation. [77], [78].
Table 14.1. Experimental evidence relevant to the design and validation of hydrodynamic sonochemical reactors
| Source and system | Measured evidence | Representative result | Engineering interpretation |
|---|---|---|---|
| Suslick et al. [4], high pressure microfluidizer | Iodide oxidation versus pressure, gas composition, and temperature | Threshold near 150 bar; rate decreased as gas thermal conductivity and liquid temperature increased | Supports hot spot analogy and demonstrates gas and vapor control |
| Kozyuk [16], controlled flow patent | Defined constriction and downstream pressure recovery zone | Local velocity at least 16 m s⁻¹ and pressure recovery claim of at least 0.85 kg cm⁻² | Separates cavity generation from collapse and supports multistage design |
| Pawar et al. [11], three Venturis and an orifice | CFD, single bubble model, high speed imaging, iodide dosimetry | Highest yield for orifice, 0.165 mg I₂ kJ⁻¹ | Dense cloud interaction can reduce net chemistry despite high vapor volume |
| Amin et al. [67], high pressure nozzle reactor | Salicylic acid hydroxylation by HPLC | Optimum probe concentration 750 ppm; no detected product below 100 psi | Probe concentration and apparatus threshold must be calibrated |
| Nöpel et al. [68], free jet reactor | Spatial luminol chemiluminescence | Luminous area increased with pressure and orifice diameter; volume organized by hydraulic power | Optical imaging locates chemistry but does not replace chemical yield |
| Rajoriya et al. [70], Venturi plus oxidants | Rh6G decolorization, TOC, LC MS | 100% decolorization with HC ozone; 84% TOC removal under a higher pressure, longer run | Distinguish chromophore destruction from mineralization and include oxidant energy |
| Khare and Ranade [72], vortex device scale study | Validated CFD across throat diameters and velocities | Cavitation extent and specific dissipation decreased with scale | Constant energy per mass does not preserve local cavitation conditions |
| Pang et al. [71], multiscale coumarin datasets | 7-hydroxycoumarin and ML interpretation | Radical yield per energy generally decreased as throat diameter increased | Use number of passes and scale aware models; consider numbering up |
| Lockett and Bonifacio [73], diesel nozzle | High speed luminescence and spectroscopy | Blue violet emission above about 180 bar with multiple spectral maxima | Luminescence may include electrokinetic excitation; do not equate all light with sonoluminescence |
| Osterman et al. [74], infrared thermography | Local interfacial temperature field | Cooling up to about 0.3 K during bubble growth | Quantifies thermal delay, not collapse core temperature |
| Technical iodide report [75] | Triiodide UV Vis calibration, passes, pressure, energy calculations | Documents blank correction, sample loss, and energy normalization | Useful protocol template; independent replication and uncertainty analysis required |
| Technica sulfite report [76] | Nitrogen purged loop, residual sulfite, sulfate production | Controls atmospheric oxygen and reports oxidation per pass and per joule | Gas exclusion and closed sampling are essential for oxidation dosimetry |
14.8 Integrated validation protocol
The preceding evidence supports a minimum validation protocol for a new hydrodynamic sonochemical reactor. First, characterize the hydraulic field with pressure, flow, temperature, and a stated cavitation number definition. Second, confirm the location and extent of the cavity population using imaging, acoustics, or void fraction measurements. Third, apply a chemically appropriate dosimeter at a validated concentration and include blanks, radical scavengers, and noncavitating hydraulic controls. Fourth, quantify the target compound, intermediates, mineralization, and off gas when relevant. Fifth, report hydraulic energy, electrical energy, auxiliary oxidant energy, and treatment throughput. Finally, repeat the experiment across the proposed scale up variable and report uncertainty. A reactor that satisfies only one or two of these steps may still be useful, but its mechanism and transferability remain uncertain.