
Technical publication
Back to publications
Industrial applications
Hydrodynamic Cavitation in Pharmaceutical Particle Engineering, Crystallization, and Drug Delivery
okozyuk.com
Published
Read complete publication for whole-document Find and printing. Browser Find and native printing on this reader include only loaded content.
6 Emulsification, Liposome Production, and Lipid Based Drug Delivery
6.1 Nanoemulsions and Liposomes Are Different Structures
A nanoemulsion is a kinetically stabilized dispersion of droplets, commonly oil in water or water in oil. A liposome is a vesicle composed of one or more phospholipid bilayers surrounding an aqueous space. Both systems can be processed by high pressure equipment, but their failure modes differ. Emulsion droplets are governed by interfacial tension, surfactant coverage, coalescence, and Ostwald ripening. Liposomes add bilayer phase behavior, lamellarity, membrane permeability, free drug, encapsulation efficiency, leakage, lipid oxidation, hydrolysis, and payload partitioning [7,15,16].
The FDA liposome guidance emphasizes chemistry, manufacturing, and controls, pharmacokinetics and bioavailability, and labeling information specific to liposome drug products. Product characterization should address the lipid components, drug to lipid ratio, vesicle size distribution, morphology, surface characteristics, encapsulated and free drug, release, leakage, impurities, and stability. Nanomaterial guidance further supports a risk based development approach for products whose performance depends on nanoscale attributes [7,8].
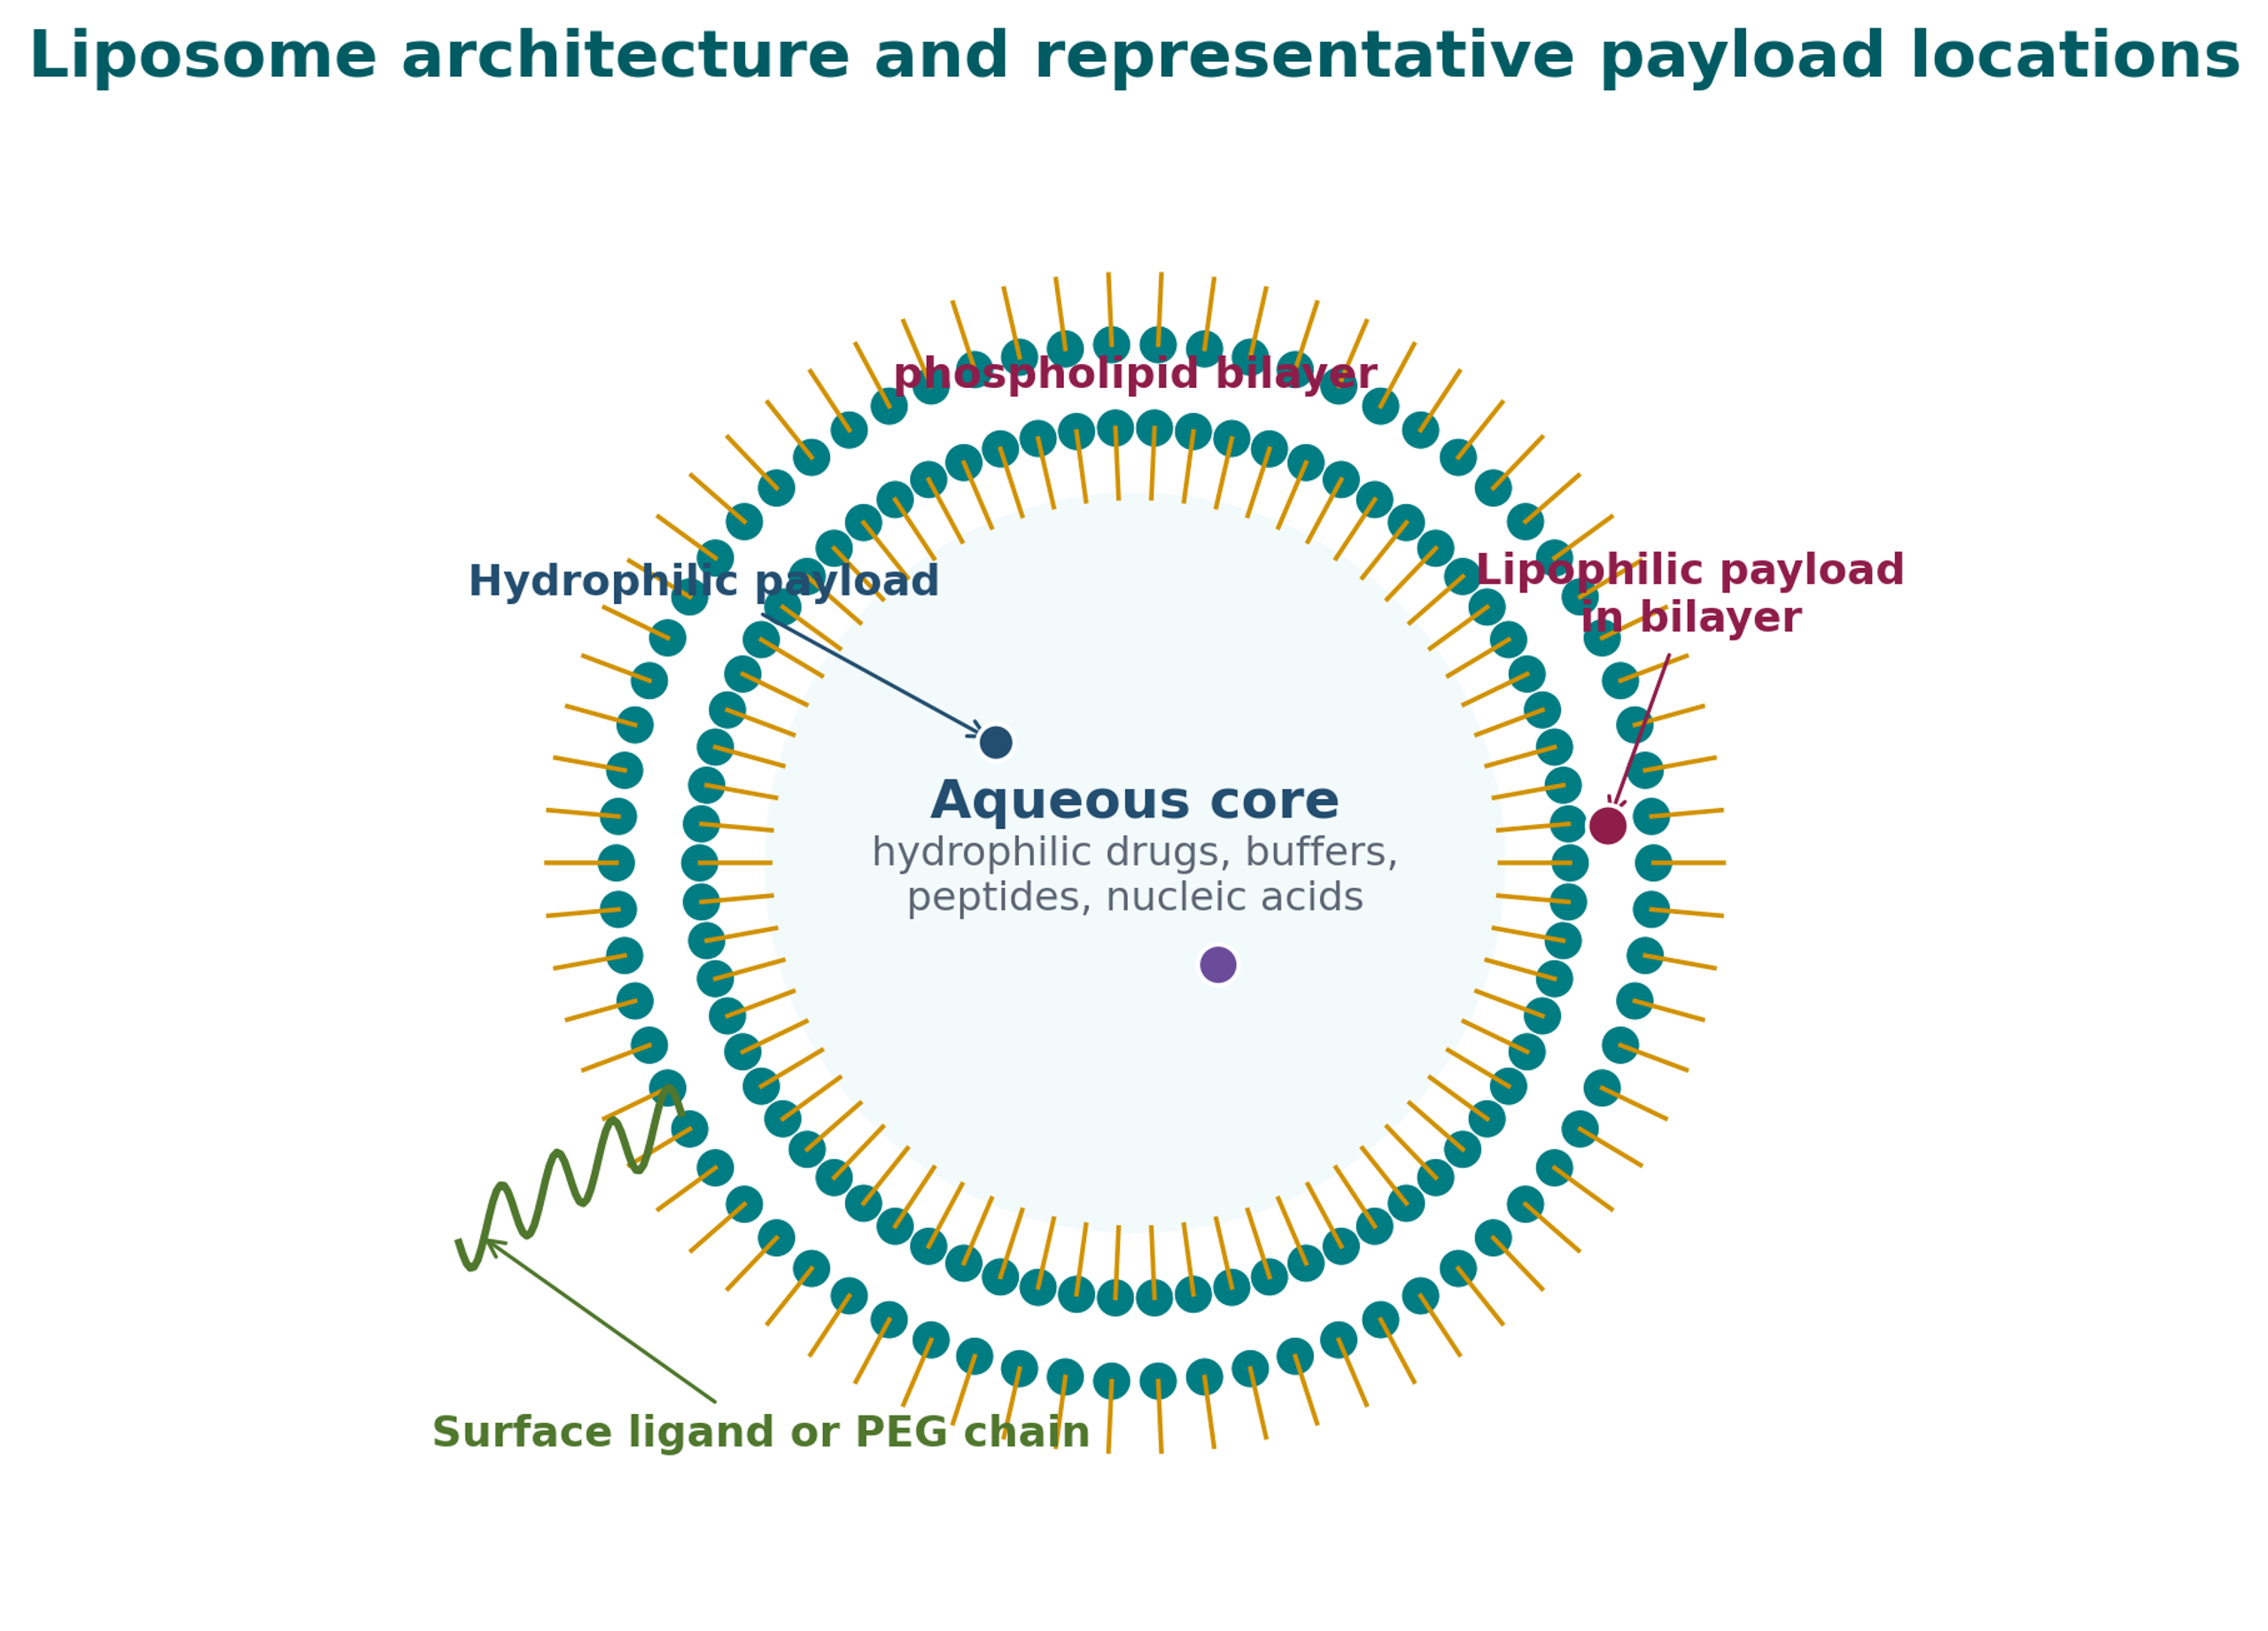
Figure 6.1. Liposome structure and representative payload locations [42].
6.2 Conventional and High Energy Preparation Routes
Common liposome formation routes include thin film hydration, ethanol or solvent injection, reverse phase evaporation, detergent removal, dehydration and rehydration, and microfluidic mixing. These methods generally create a coarse vesicle population that may require extrusion, sonication, high pressure homogenization, Microfluidizer processing, or another controlled energy step to reduce size and lamellarity. Scalable preparation requires attention to solvent handling, lipid concentration, membrane transition temperature, drug partitioning, and the sequence of hydration and size reduction [15].
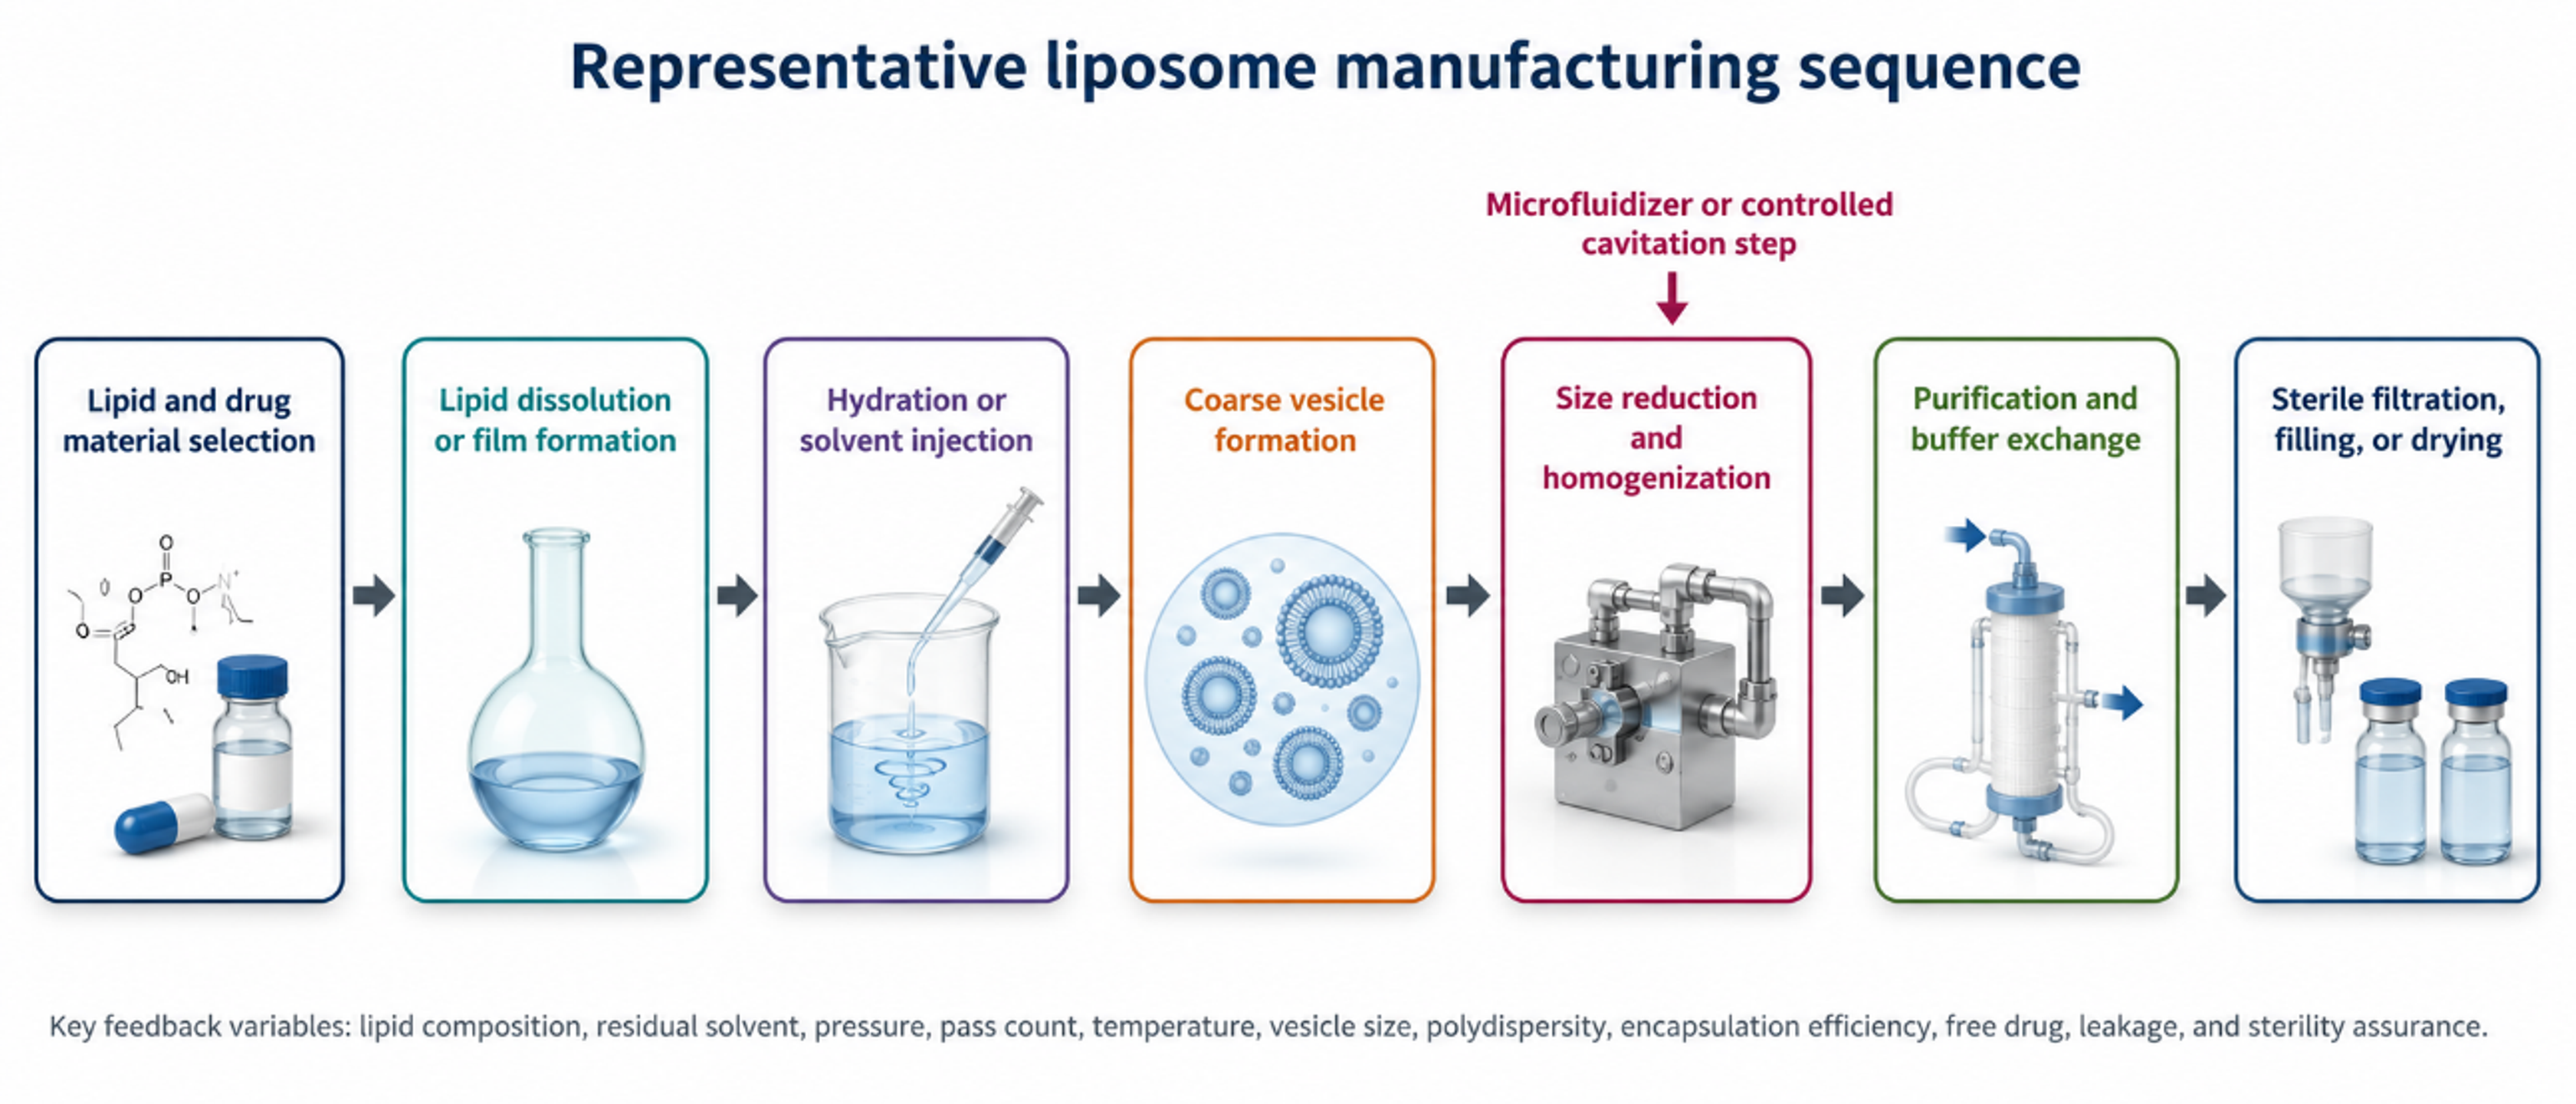
Figure 6.2. Representative liposome manufacturing sequence from lipid selection through final filling or drying [42].
For pressure based processing, the coarse dispersion should be free of particles that can obstruct the selected channel. Feed temperature may need to remain above or below a lipid phase transition depending on the desired remodeling mechanism. The cooling system must remove pressure work rapidly enough to prevent payload degradation, oxidation, hydrolysis, or uncontrolled bilayer permeability. Oxygen exposure, light, and trace metals can accelerate lipid oxidation and should be controlled as appropriate.
6.3 Microfluidizer Impinging Cavitating Jet Examples for Liposome Production
A topical drug liposome formulation was processed in a Microfluidizer M-110S at 20,000 psi for seven passes. The reported median size decreased from 4.523 µm to 0.097 µm, or 97 nm [22]. The supplied vitamin E example used an M-110EH-30 at 12,000 psi for two passes and reported a decrease from 5,281 nm to 72 nm while incorporating vitamin E into the liposomal system [23]. The BioPharmaceutical Formulations brochure reports a liposomal phospholipid reduction from 10.188 µm to 0.254 µm after two passes at 15,000 psi and a liposomal insect repellent reduction from 10.155 µm to 0.079 µm after one pass [24].
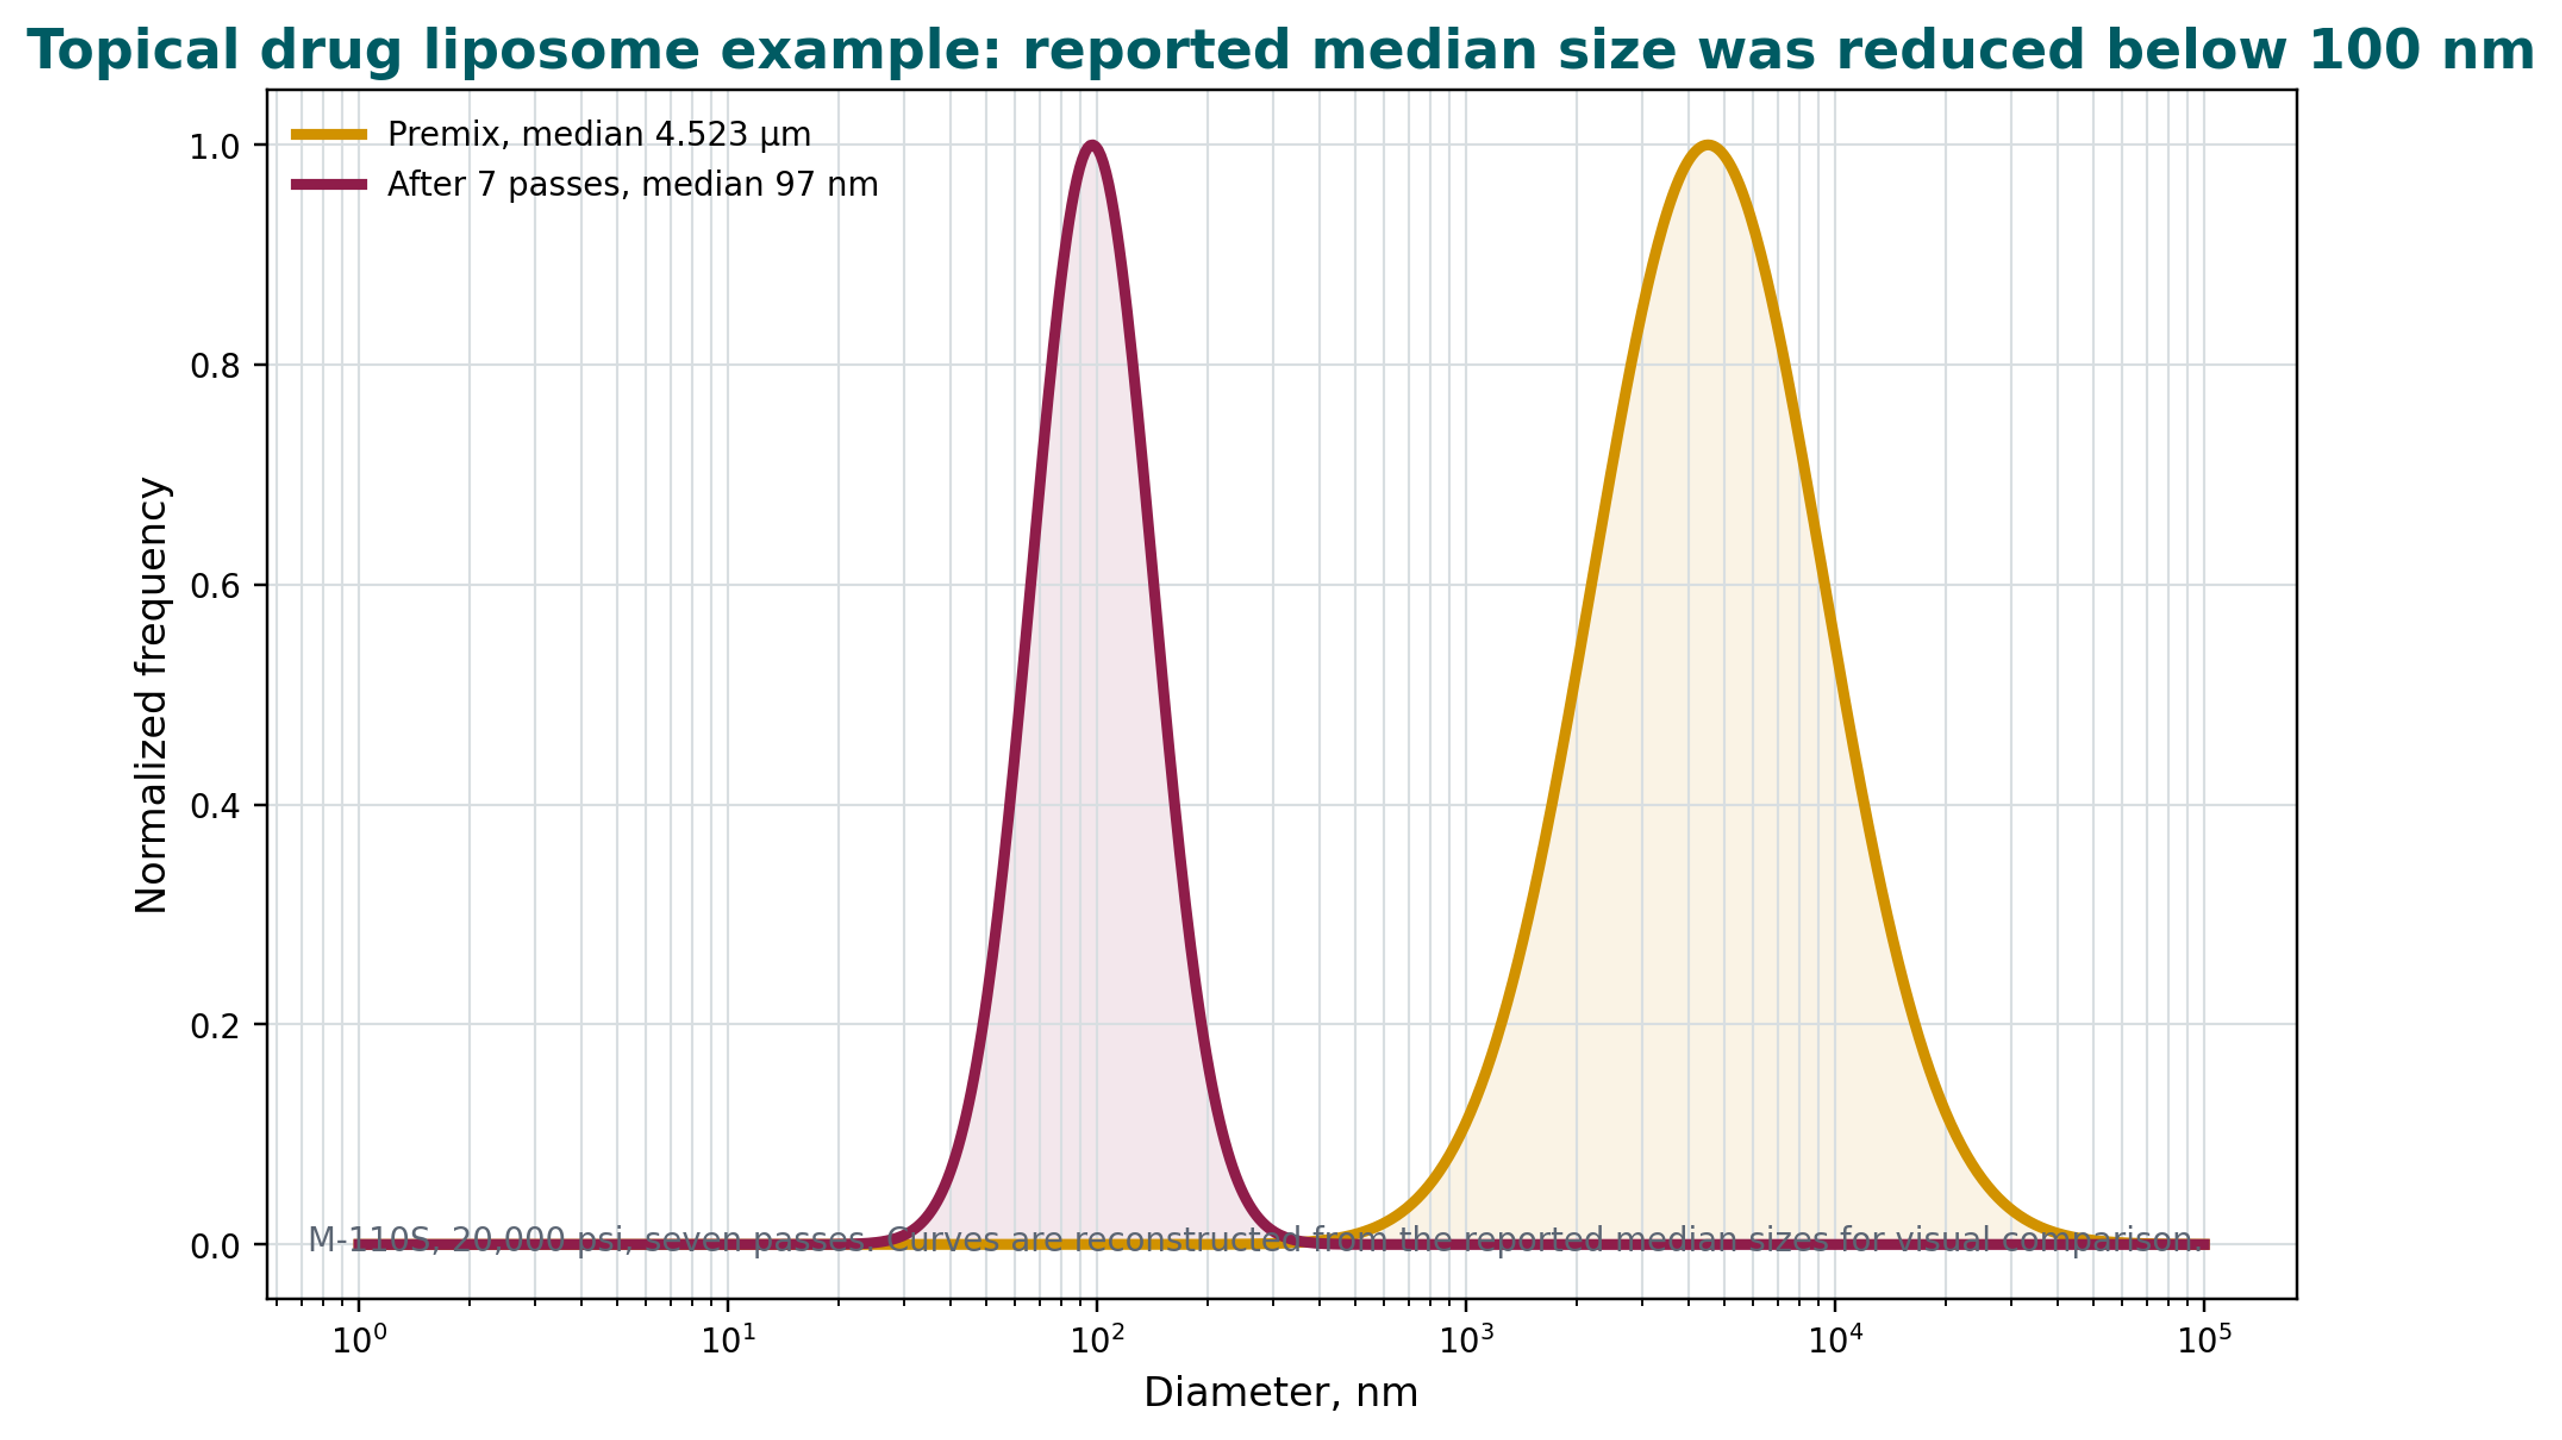
Figure 6.3. Reconstructed size distributions for the supplied topical liposome example. [22].
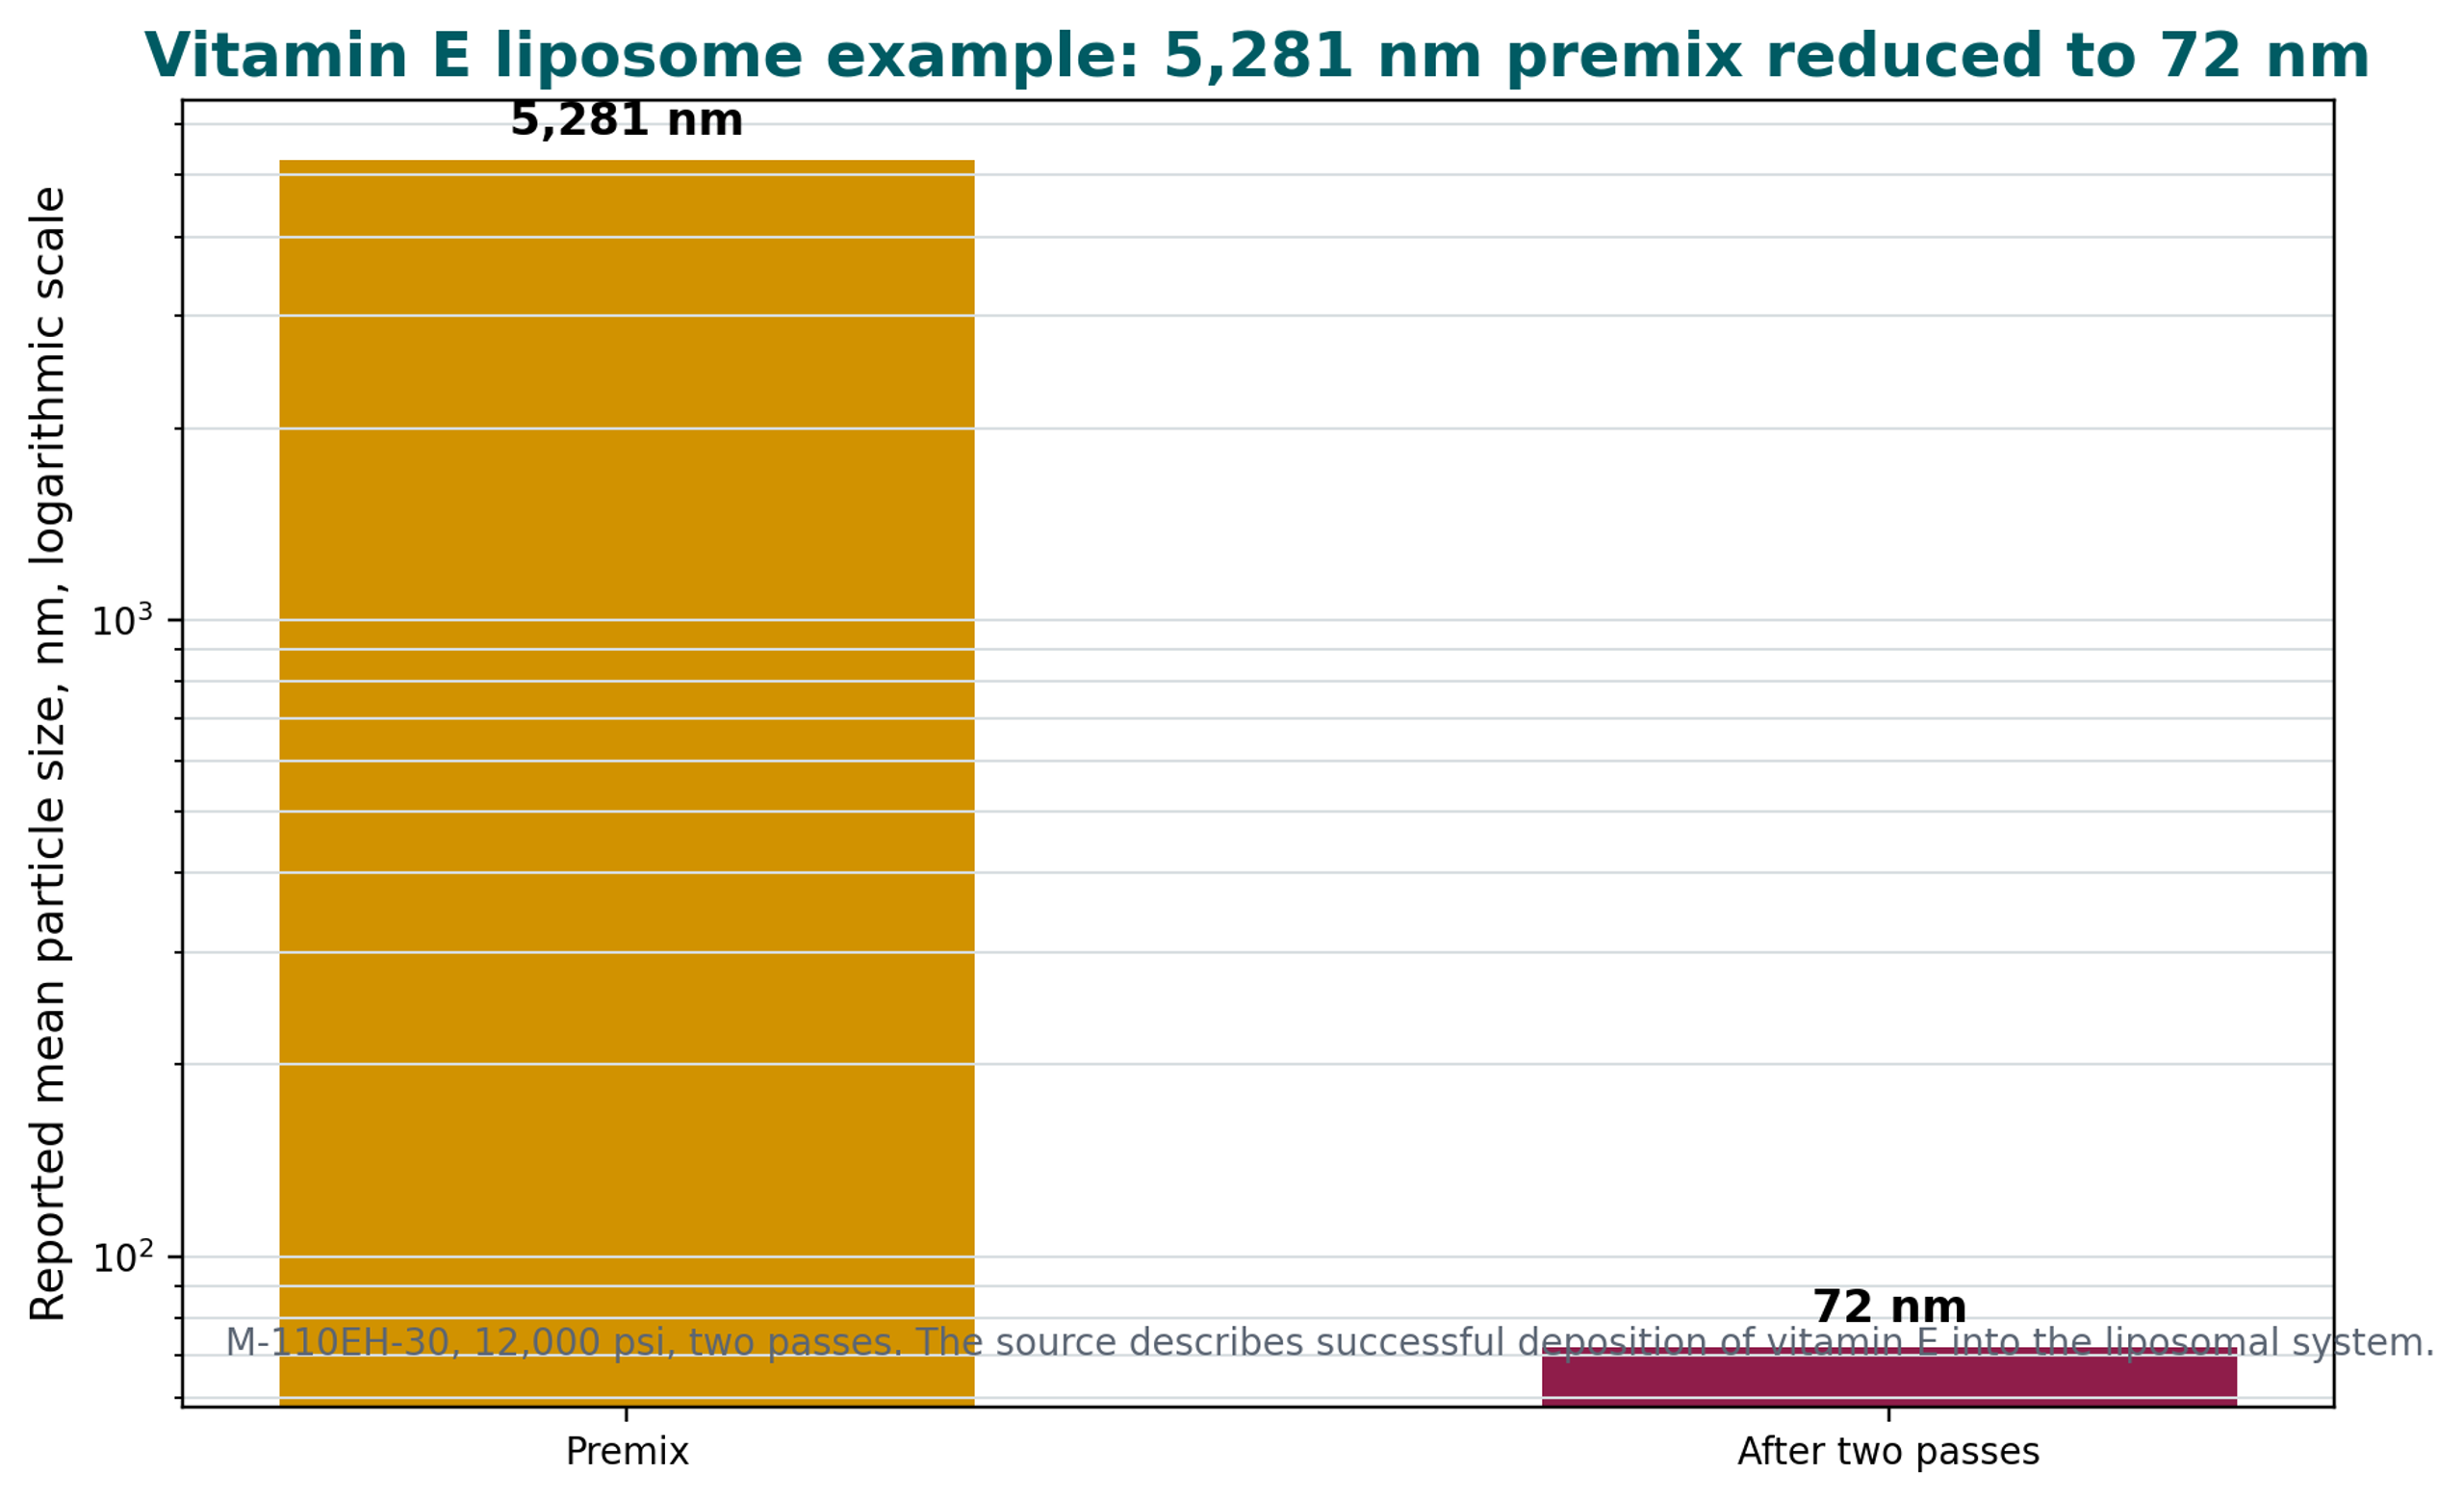
Figure 6.4. Reported mean size reduction for the supplied vitamin E liposome example. [23].
The Nanoencapsulation presentation reports a drug loaded liposome example processed for five passes at 18,000 psi with an F20Y chamber. The reported unloaded vesicle size was 58 nm, and the loaded vesicle size was 84 nm. The same source presents a 0.1% plasmid DNA liposome example in which the reported particle size decreased more rapidly at 18,000 psi than at 5,000 psi and states that the DNA remained intact after processing [18].
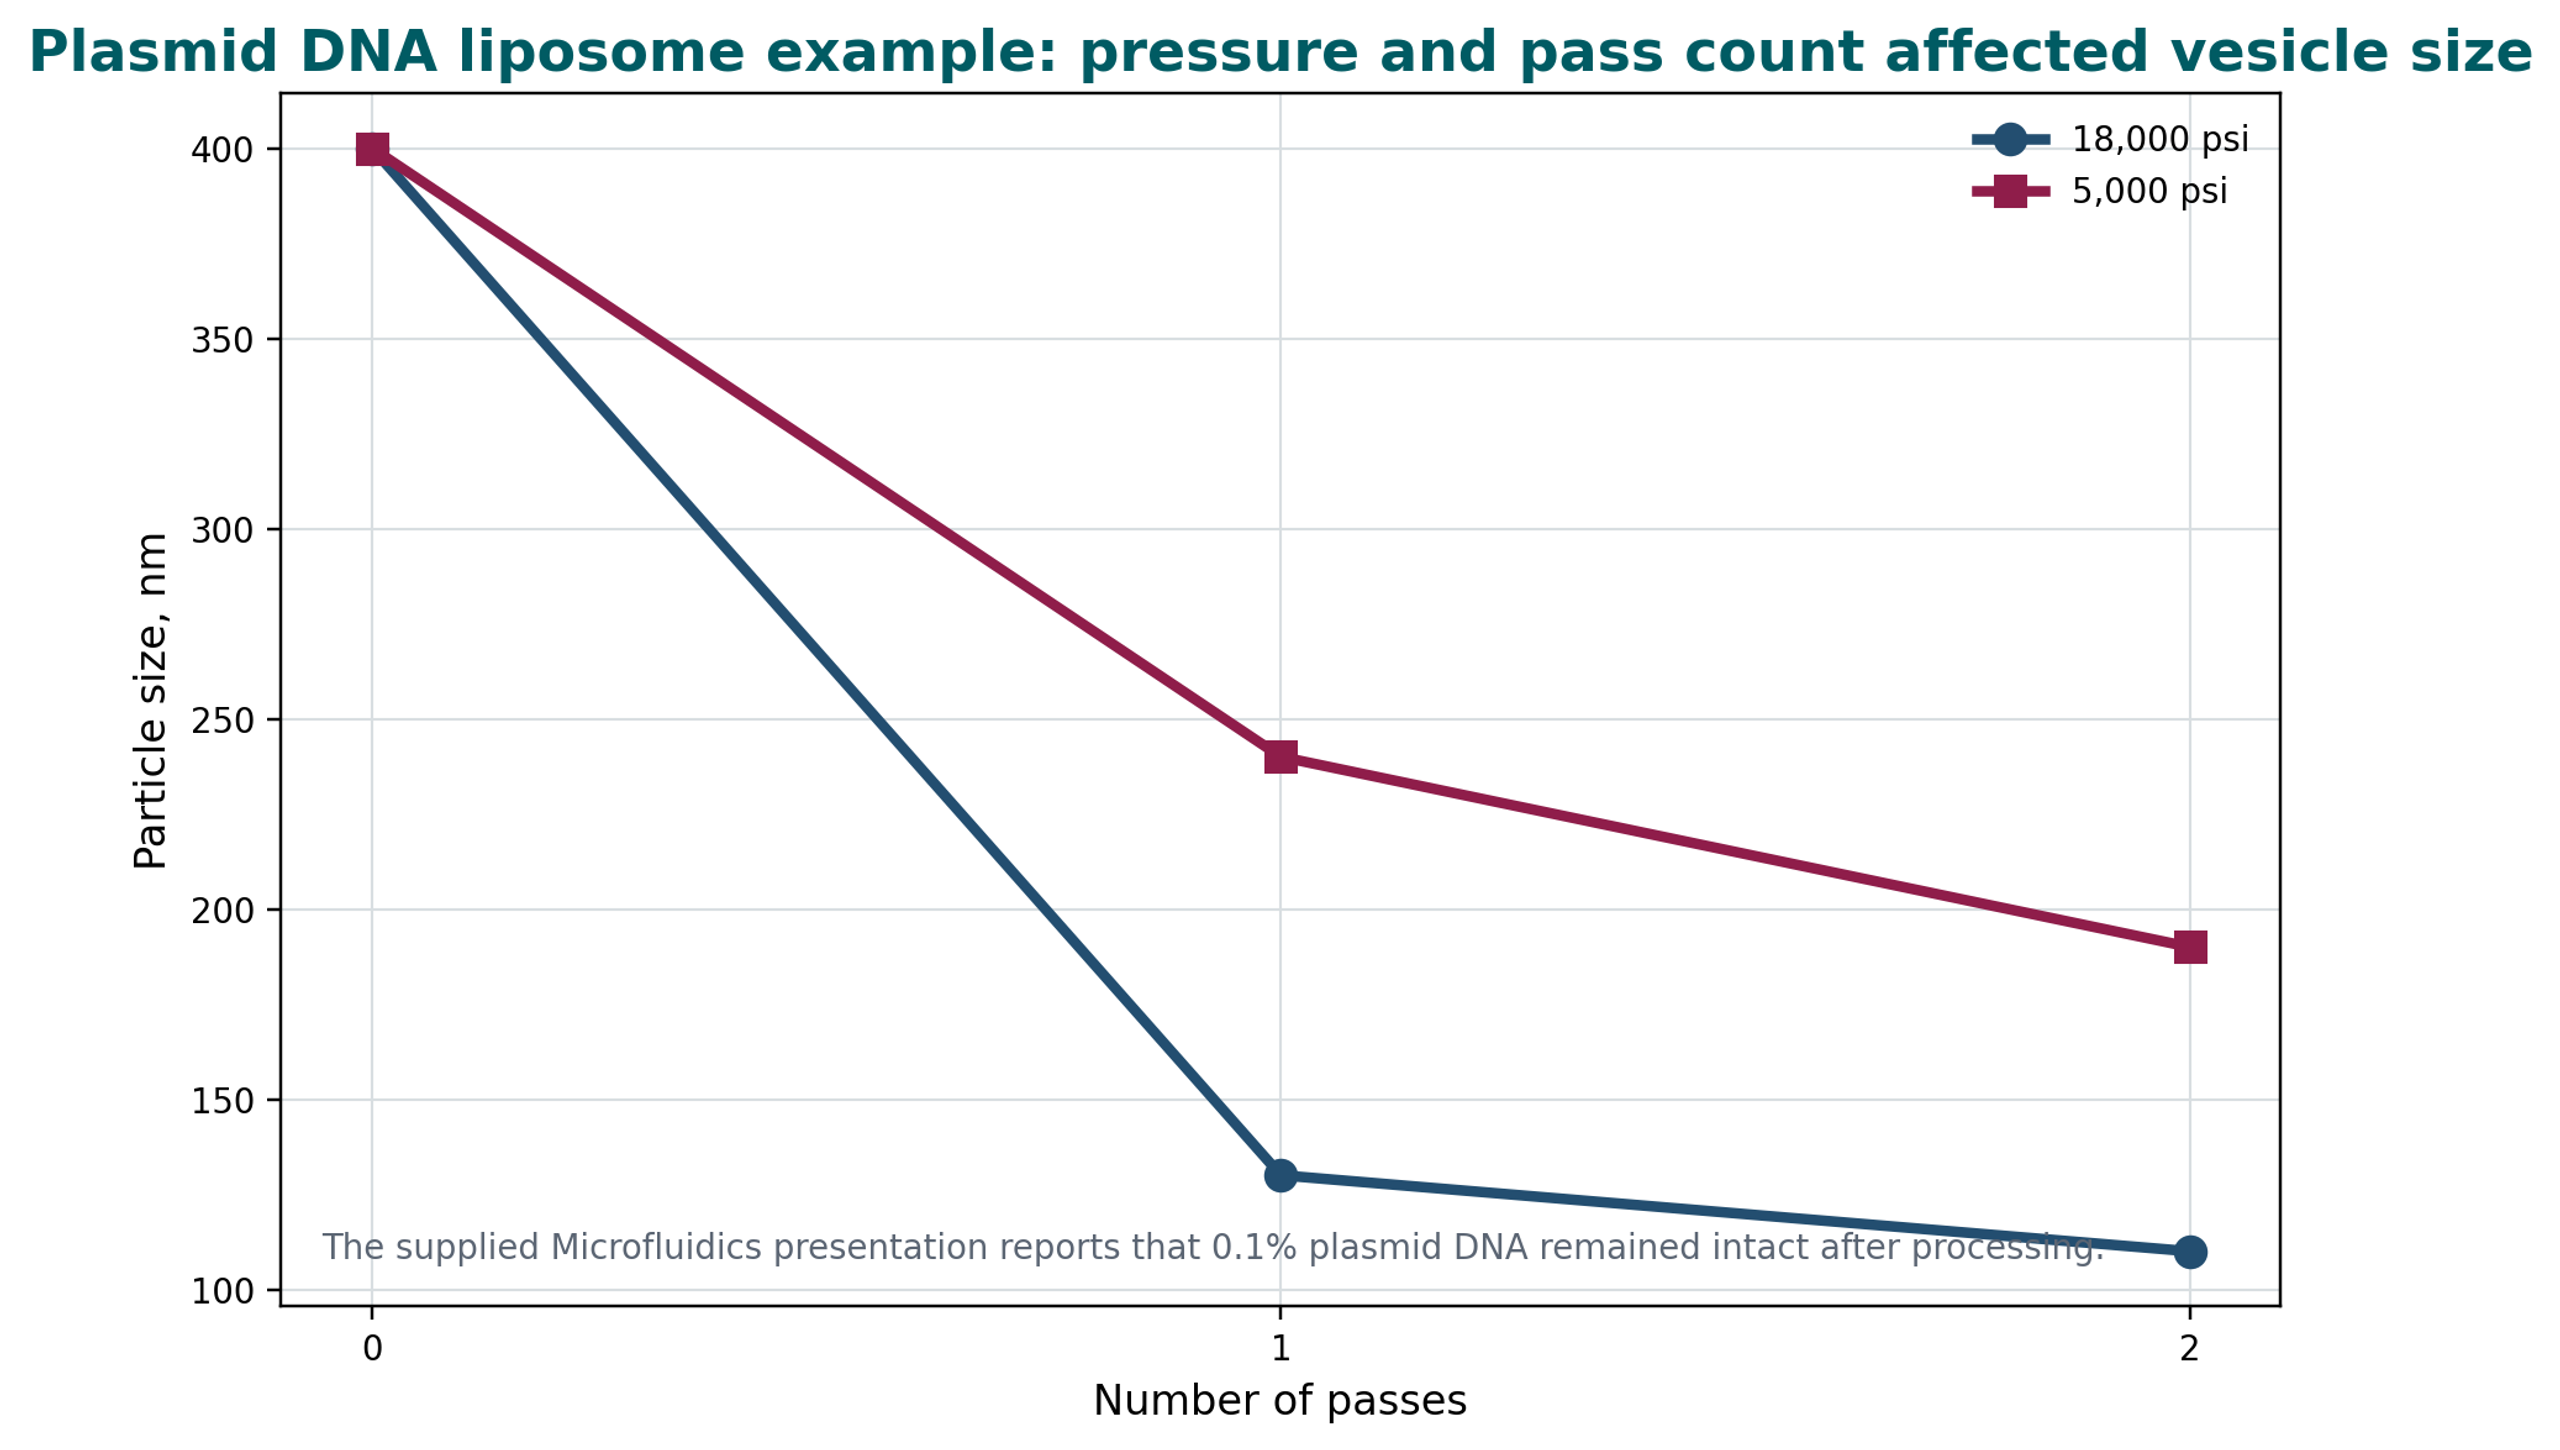
Figure 6.5. Reported plasmid DNA liposome size response to pressure and pass count. [18].
Table 6.1. Selected supplied liposome processing cases. [18,22–24].
| Formulation | Processor and conditions | Reported starting size | Reported final size | Additional source observation |
|---|---|---|---|---|
| Topical drug liposome | M-110S; 20,000 psi; 7 passes | 4.523 µm median | 0.097 µm median | Final median below 100 nm. |
| Vitamin E liposome | M-110EH-30; 12,000 psi; 2 passes | 5,281 nm mean | 72 nm mean | Source reports successful vitamin E deposition. |
| Liposomal phospholipid | 15,000 psi; 2 passes | 10.188 µm | 0.254 µm | Large early reduction in the corporate brochure. |
| Liposomal insect repellent | 15,000 psi; 1 pass | 10.155 µm | 0.079 µm | Sub 100 nm result in one reported pass. |
| Drug loaded liposome | F20Y; 18,000 psi; 5 passes | Not stated | 58 nm unloaded; 84 nm loaded | Loaded vesicles were larger than unloaded vesicles. |
| Plasmid DNA liposome | 5,000 or 18,000 psi; 2 passes | Approximately 400 nm | Approximately 190 or 110 nm | Source states DNA remained intact. |
6.4 Encapsulation Efficiency, Drug Loading, and Size Distribution
Liposome size cannot be optimized independently of encapsulation and retention. A small vesicle has a high surface to volume ratio and less aqueous internal volume per unit lipid than a larger vesicle. Hydrophilic payload encapsulation may therefore decrease during aggressive size reduction unless the process includes remote loading, concentration control, or another compensating mechanism. Lipophilic payloads can be lost if bilayer disruption or lipid phase changes promote leakage.
where EE is encapsulation efficiency; is the mass of drug retained in the carrier fraction; and is the total drug mass in the formulation.
where DL is drug loading relative to the combined lipid and encapsulated drug mass; is lipid mass; and is encapsulated drug mass.
Size distribution should be reported with more than one statistic. D10, D50, D90, and span are useful for volume based laser diffraction data. For DLS, hydrodynamic diameter and polydispersity index should be reported together with the analysis model, viscosity, temperature, and dilution method. A low D50 can conceal a small but important coarse fraction that affects sterile filtration or injectability.
where D10, D50, and D90 are the diameters below which 10%, 50%, and 90% of the selected distribution basis are found.
Zeta potential can indicate electrostatic stabilization in suitable dilute systems, although it is not a universal predictor for sterically stabilized or high ionic strength formulations. Under the Smoluchowski approximation:
where ζ is zeta potential; is the dynamic viscosity of the electrophoresis medium; is electrophoretic mobility; is relative permittivity; and ε₀ is vacuum permittivity.
6.5 Cavitation Assisted Production and Lipid Coating
Controlled hydrodynamic cavitation can couple particle size reduction with lipid coating or encapsulation. Figure 6.6 shows a processed drug and lipid system with a corresponding particle size distribution. Figure 6.7 compares cefazolin and oxytetracycline controls with samples processed in the presence of lipid at working pressures below 1500 psi [1].
The supplied examples suggest that lipid can adsorb to newly created surfaces during particle size reduction. Because intensive processing can also generate heat and shear, solid state and morphology should be evaluated to exclude process induced transformation and to confirm formulation stability [1].
These examples support the concept that newly created particle surfaces can be coated during the same operation that reduces particle size [1].
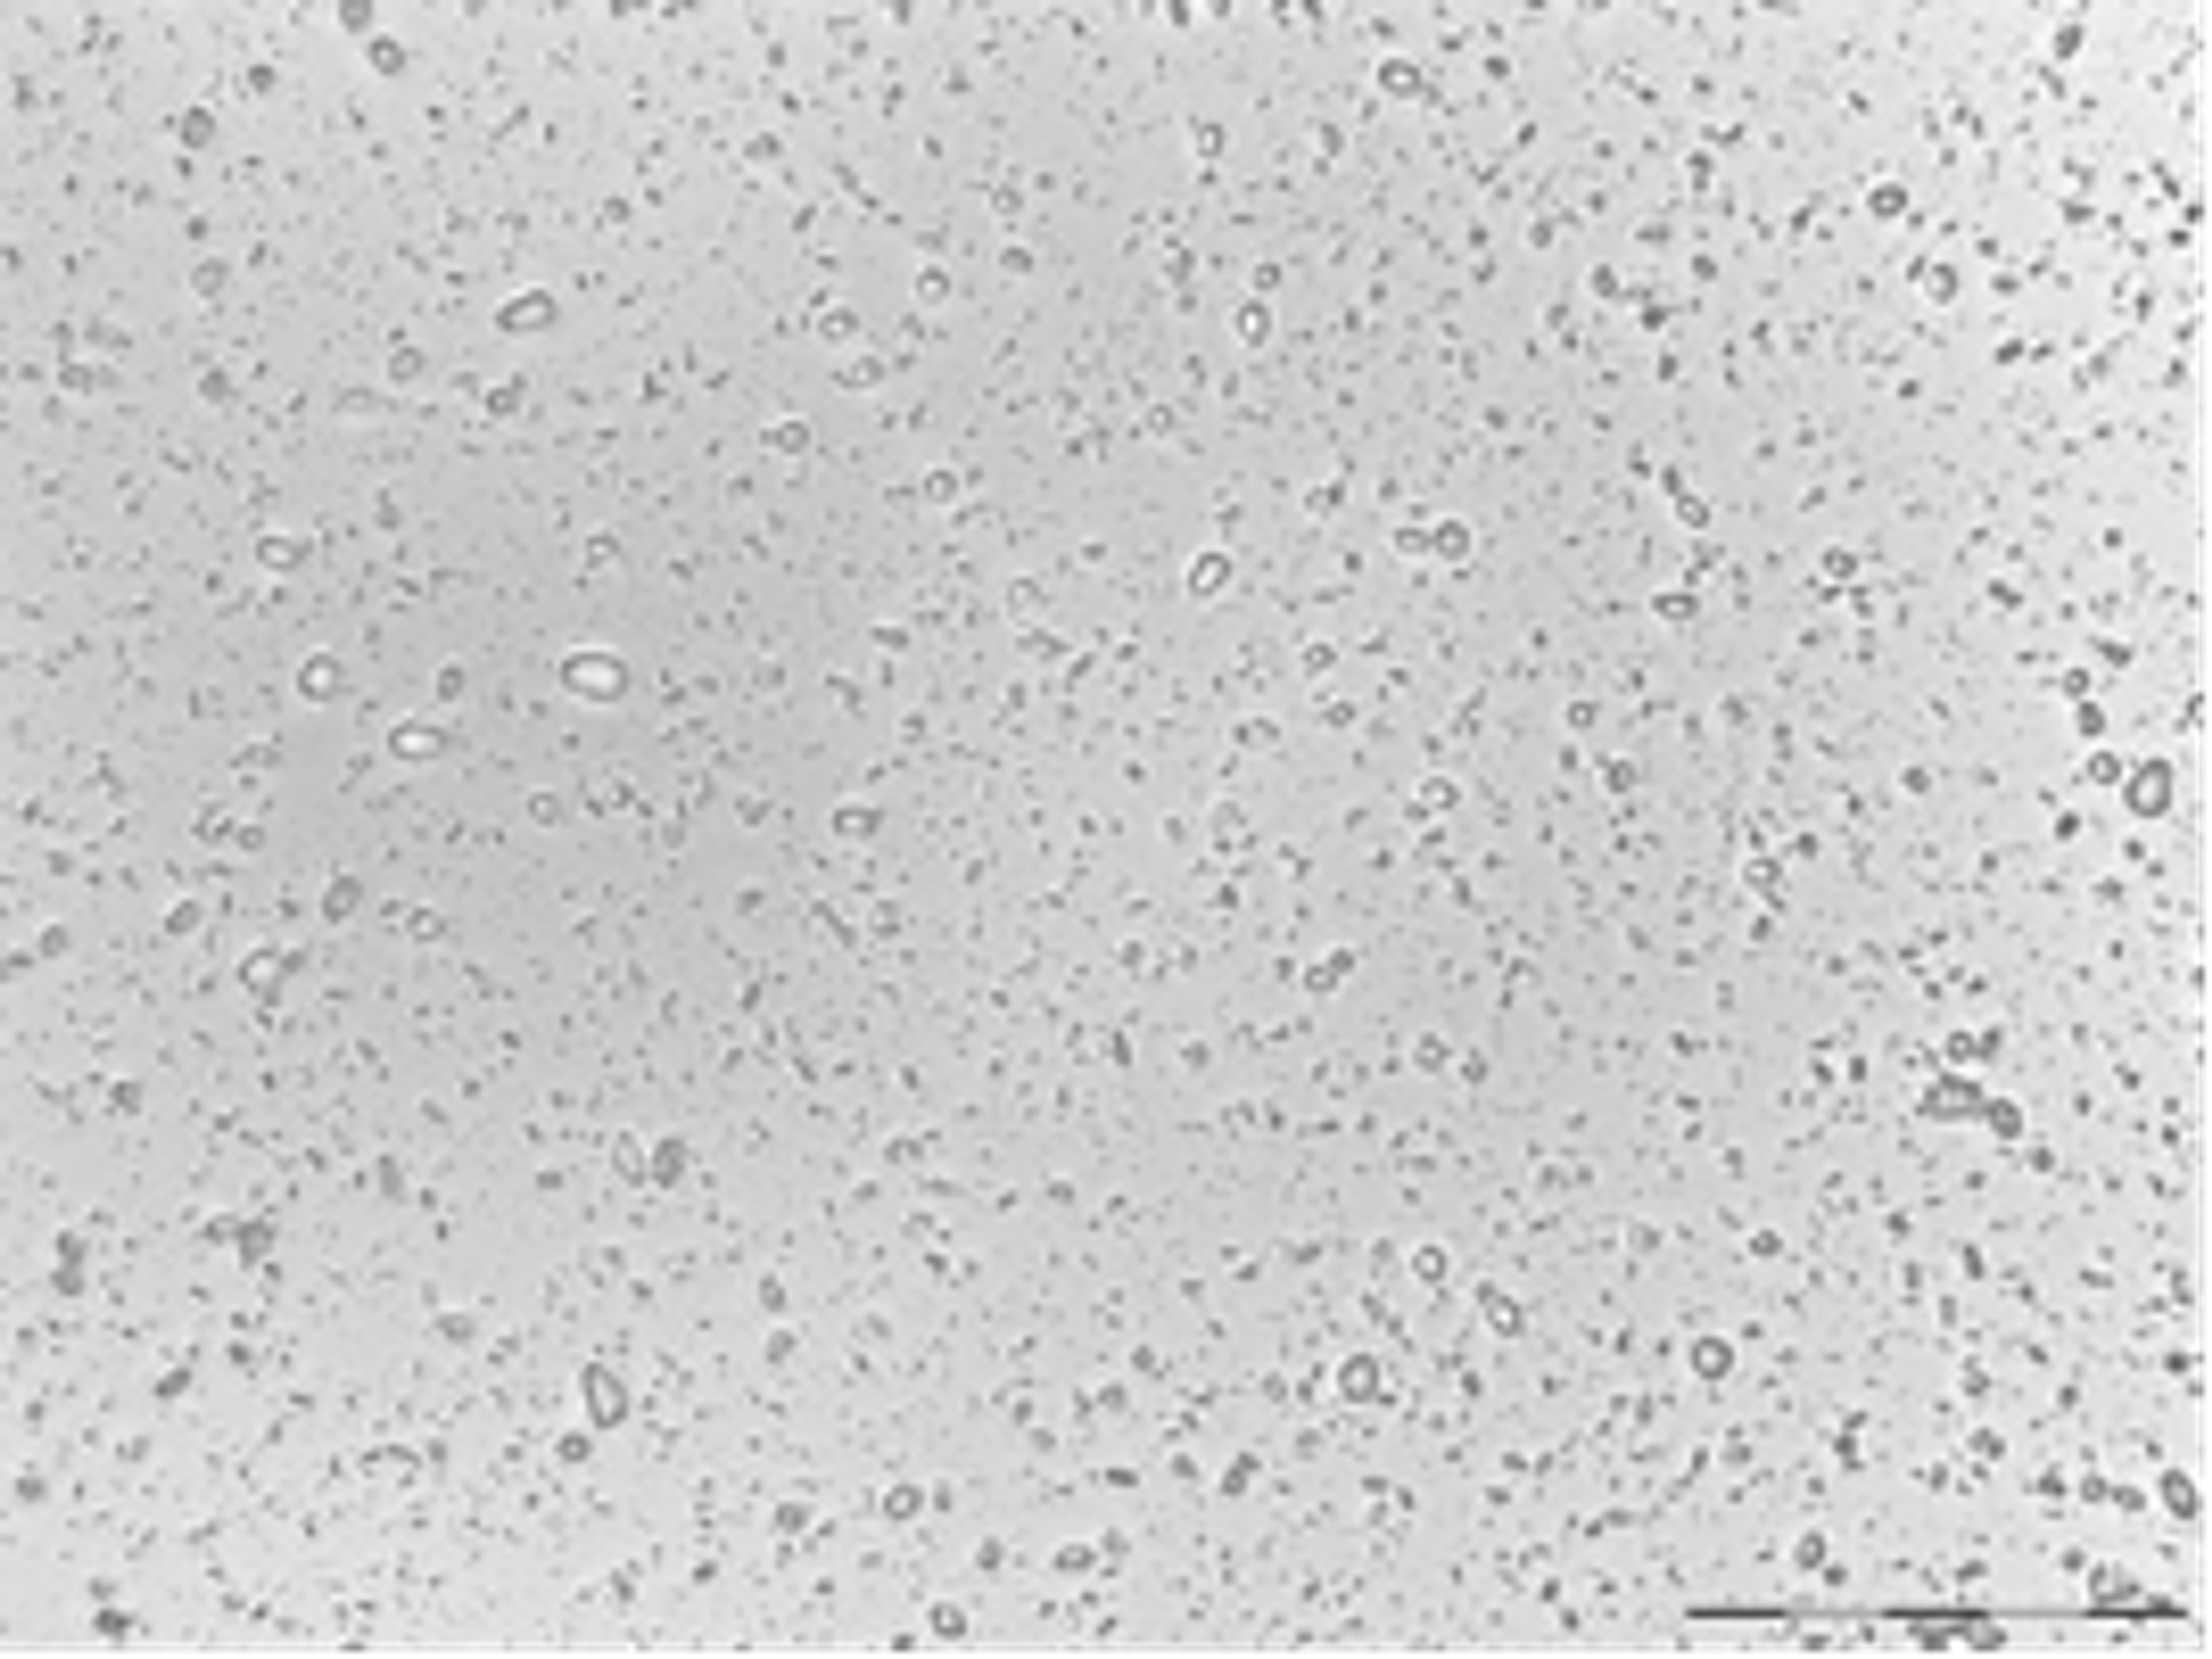
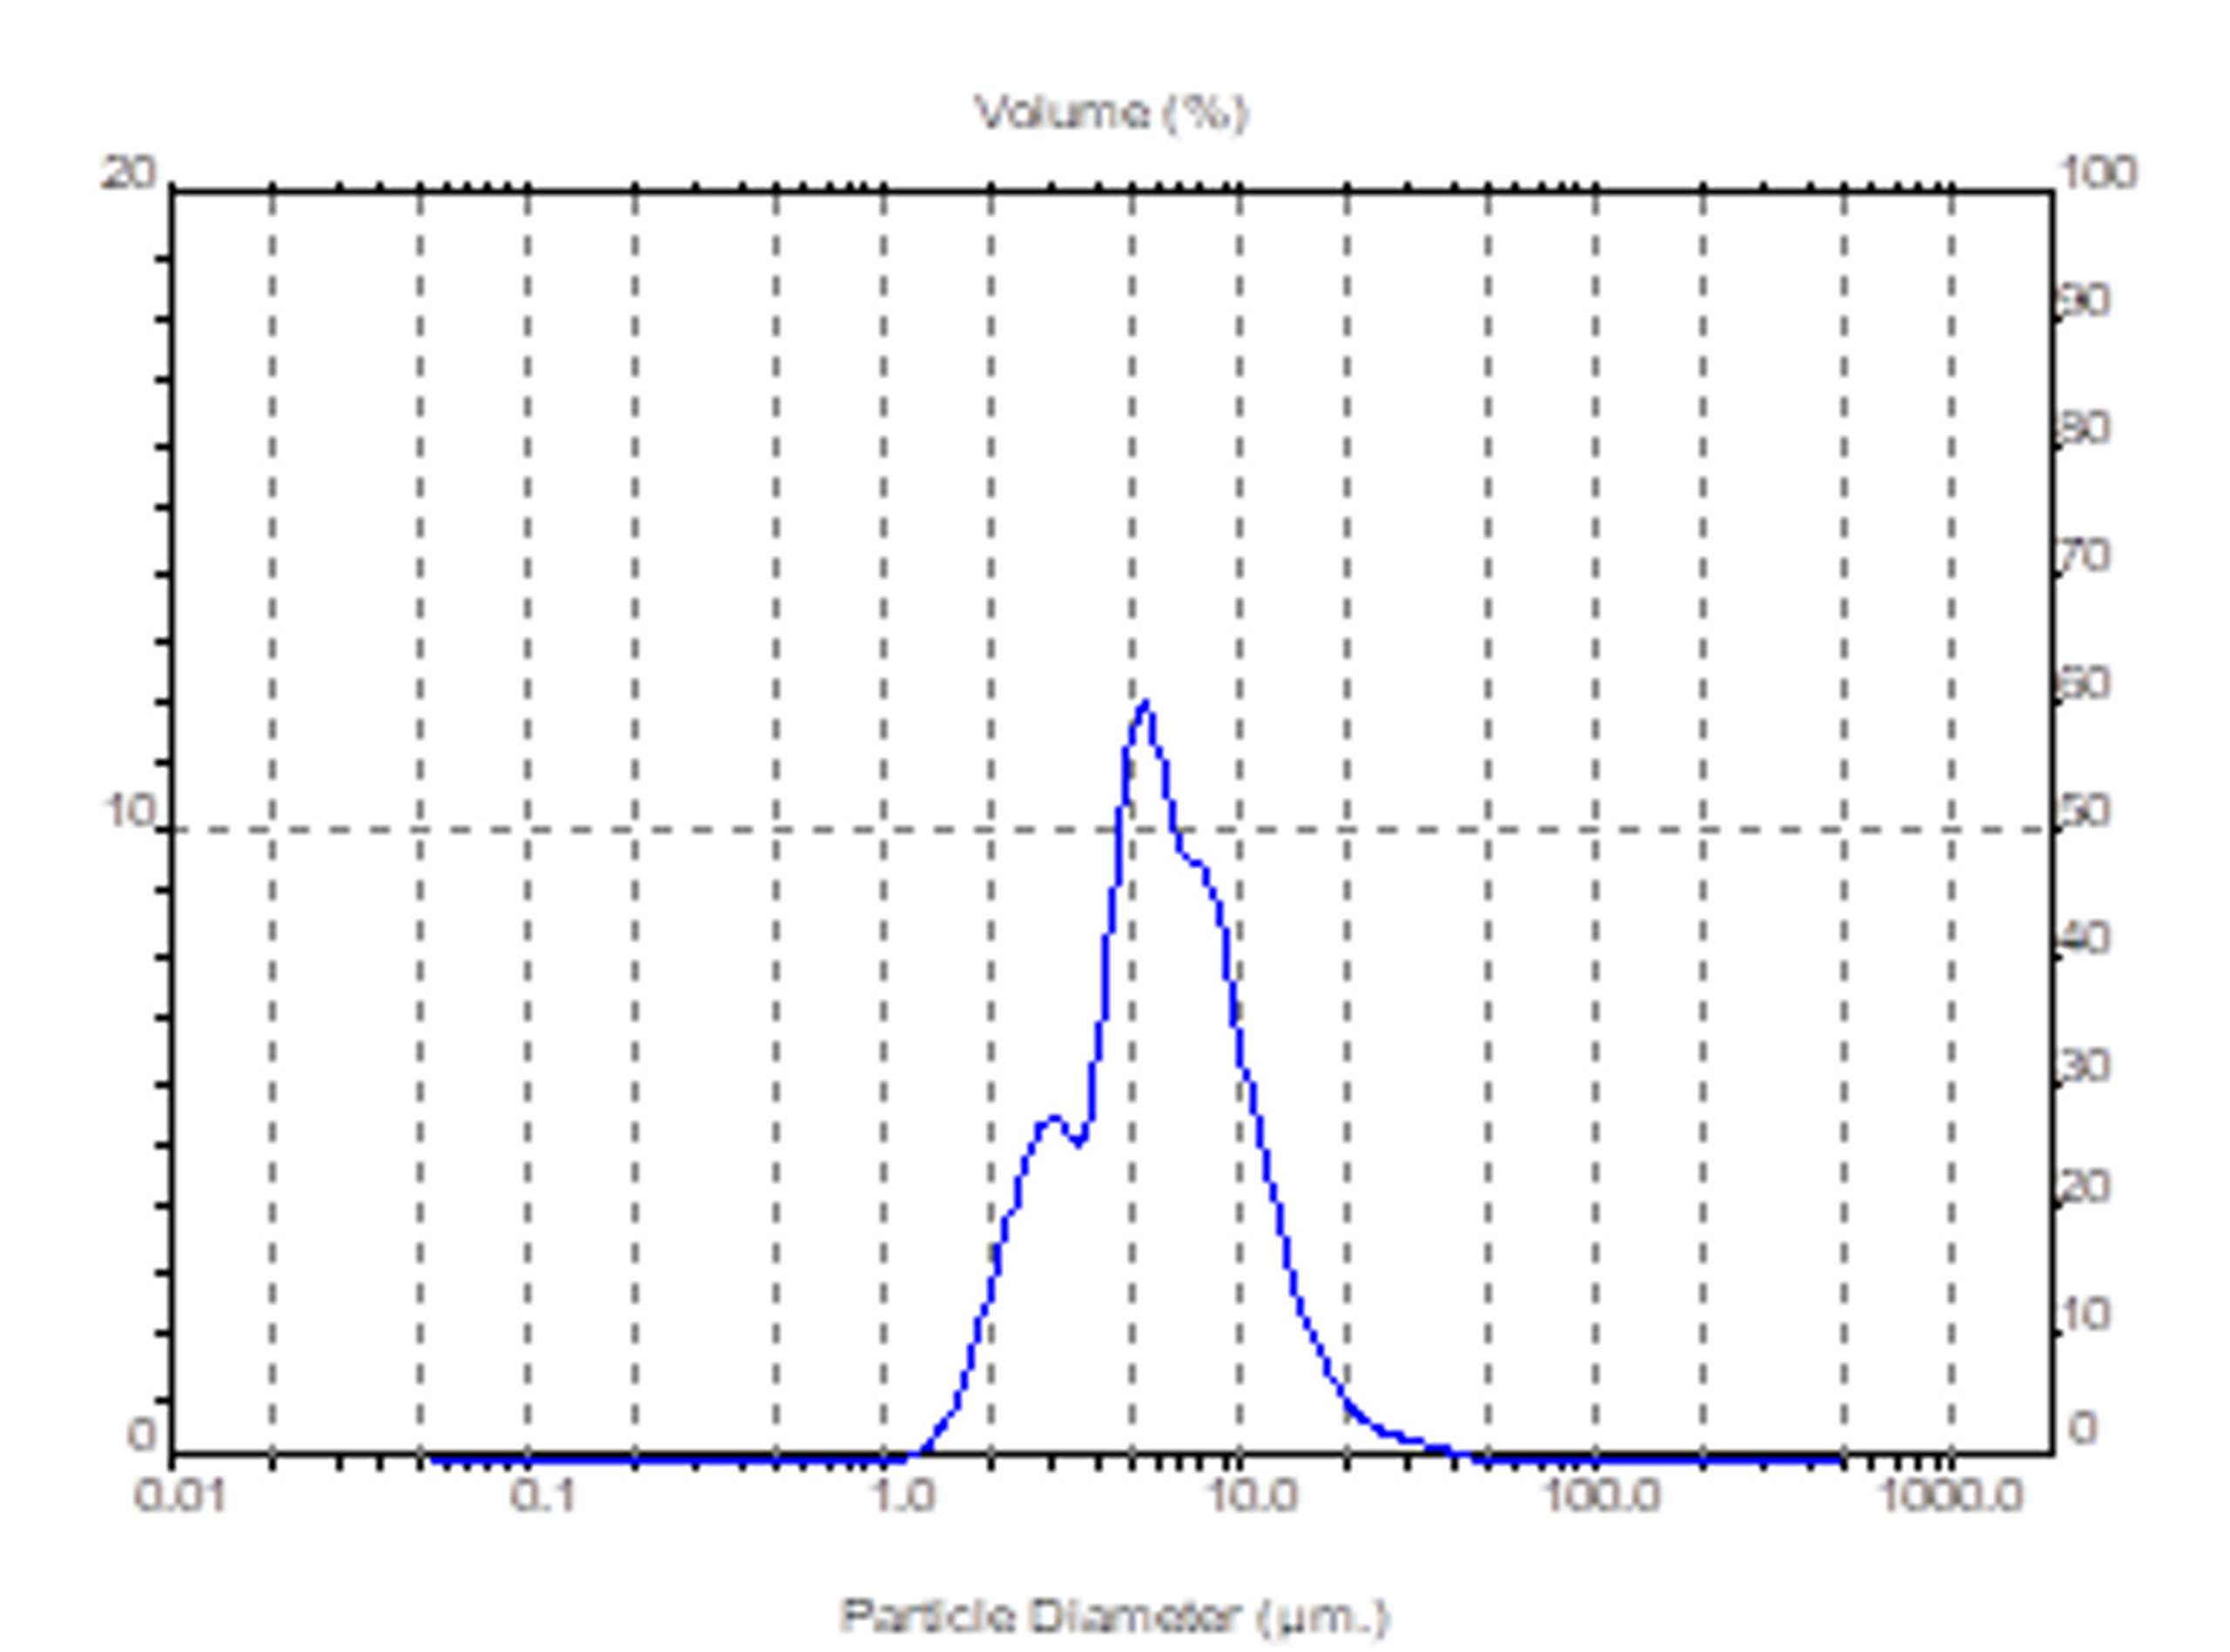
Figure 6.6. Micrograph and particle size distribution for a processed drug and egg yolk lipid system at a 3:1 ratio and 400× magnification. [1].
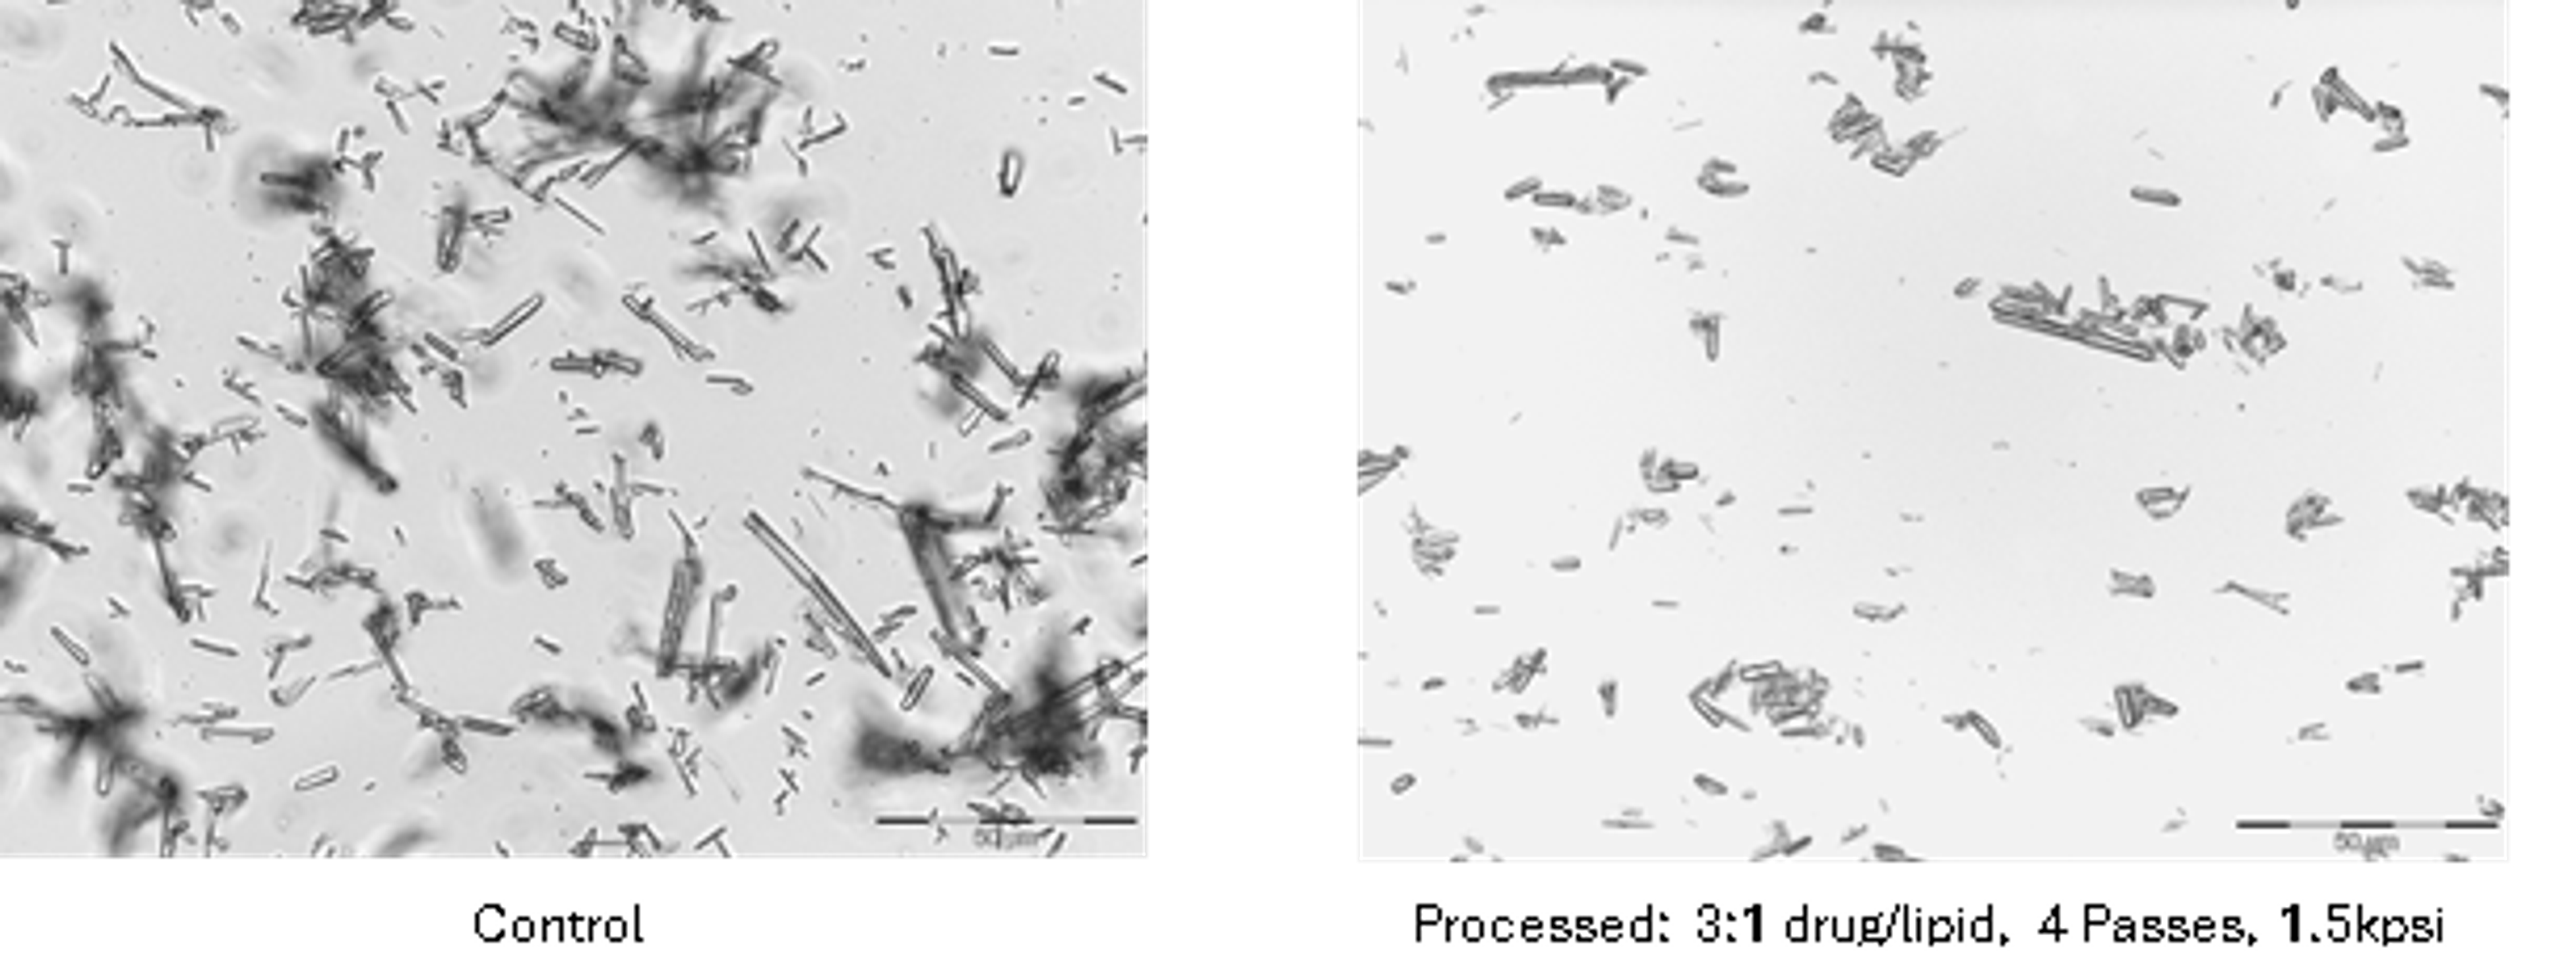
3% Cefazolin (400×)
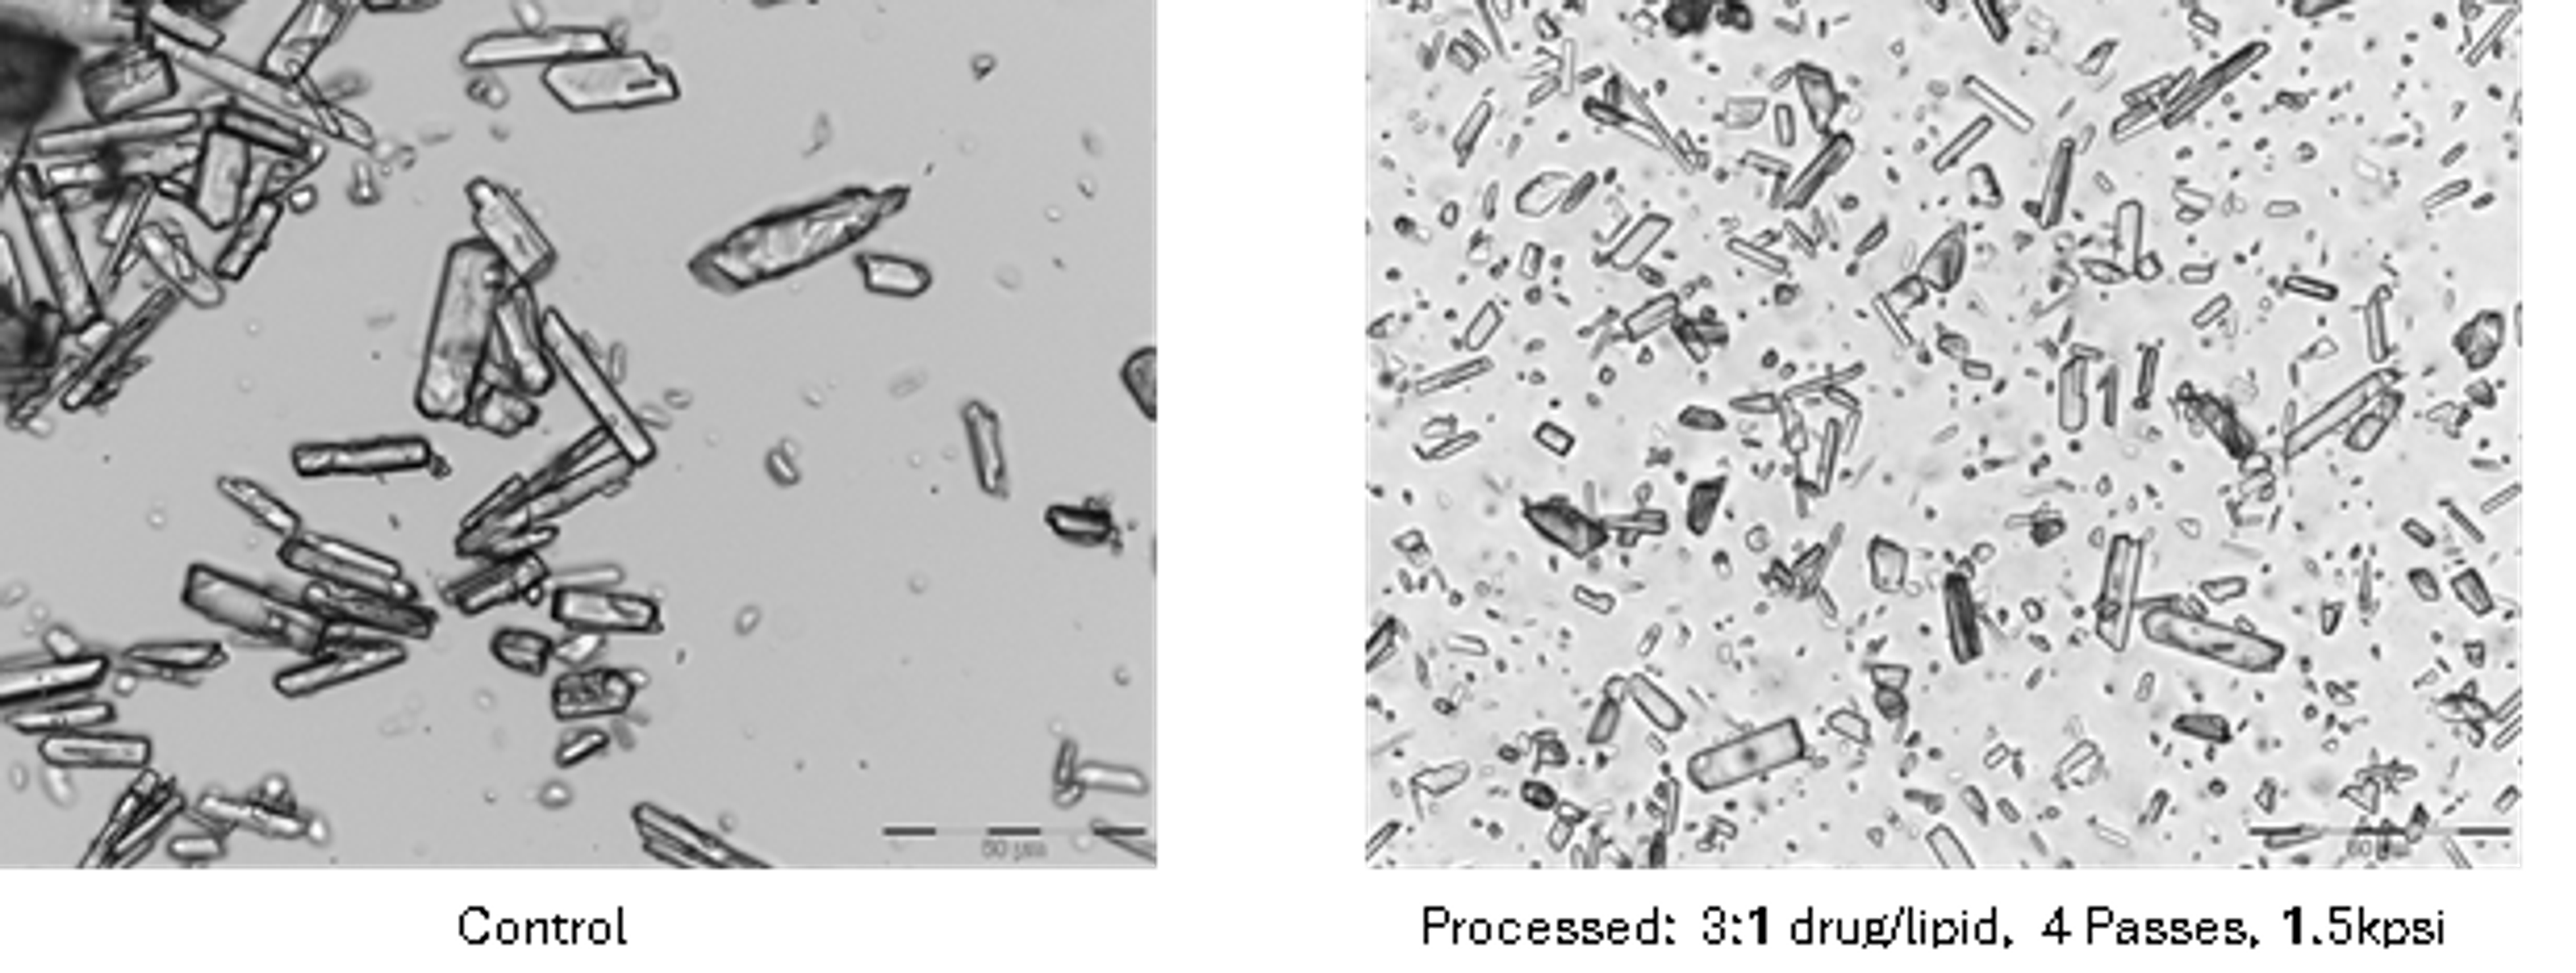
3% Oxytetracycline (400×)
Figure 6.7. Cefazolin and oxytetracycline controls and lipid processed samples at 400× magnification. [1].
A plausible process sequence is as follows. First, the drug particles or lipid aggregates encounter a high velocity cavitating or high shear field. Second, fracture and deagglomeration create new surface. Third, lipid or surfactant molecules adsorb onto the surface before reagglomeration. Fourth, additional passes refine the coating and distribution. This mechanism can produce a lipid stabilized particle dispersion even when a classical closed bilayer vesicle is not formed. Therefore, microscopy, cryogenic electron microscopy, free drug separation, lamellarity analysis, and release testing are needed to distinguish true liposomes from lipid coated particles, mixed micelles, emulsions, or other colloidal structures.
6.6 Processing Window for Liposomes
Liposome processing requires a defined intensity window. At low exposure, coarse multilamellar vesicles and a broad distribution may remain. At moderate exposure, vesicle size and lamellarity can decrease while encapsulation and bilayer integrity are preserved. At excessive exposure, further size reduction may be small while leakage, free drug, lipid oxidation, payload degradation, or equipment wear increases. Pressure and pass count should therefore be optimized against a multivariate objective, not against size alone [7,15,16].
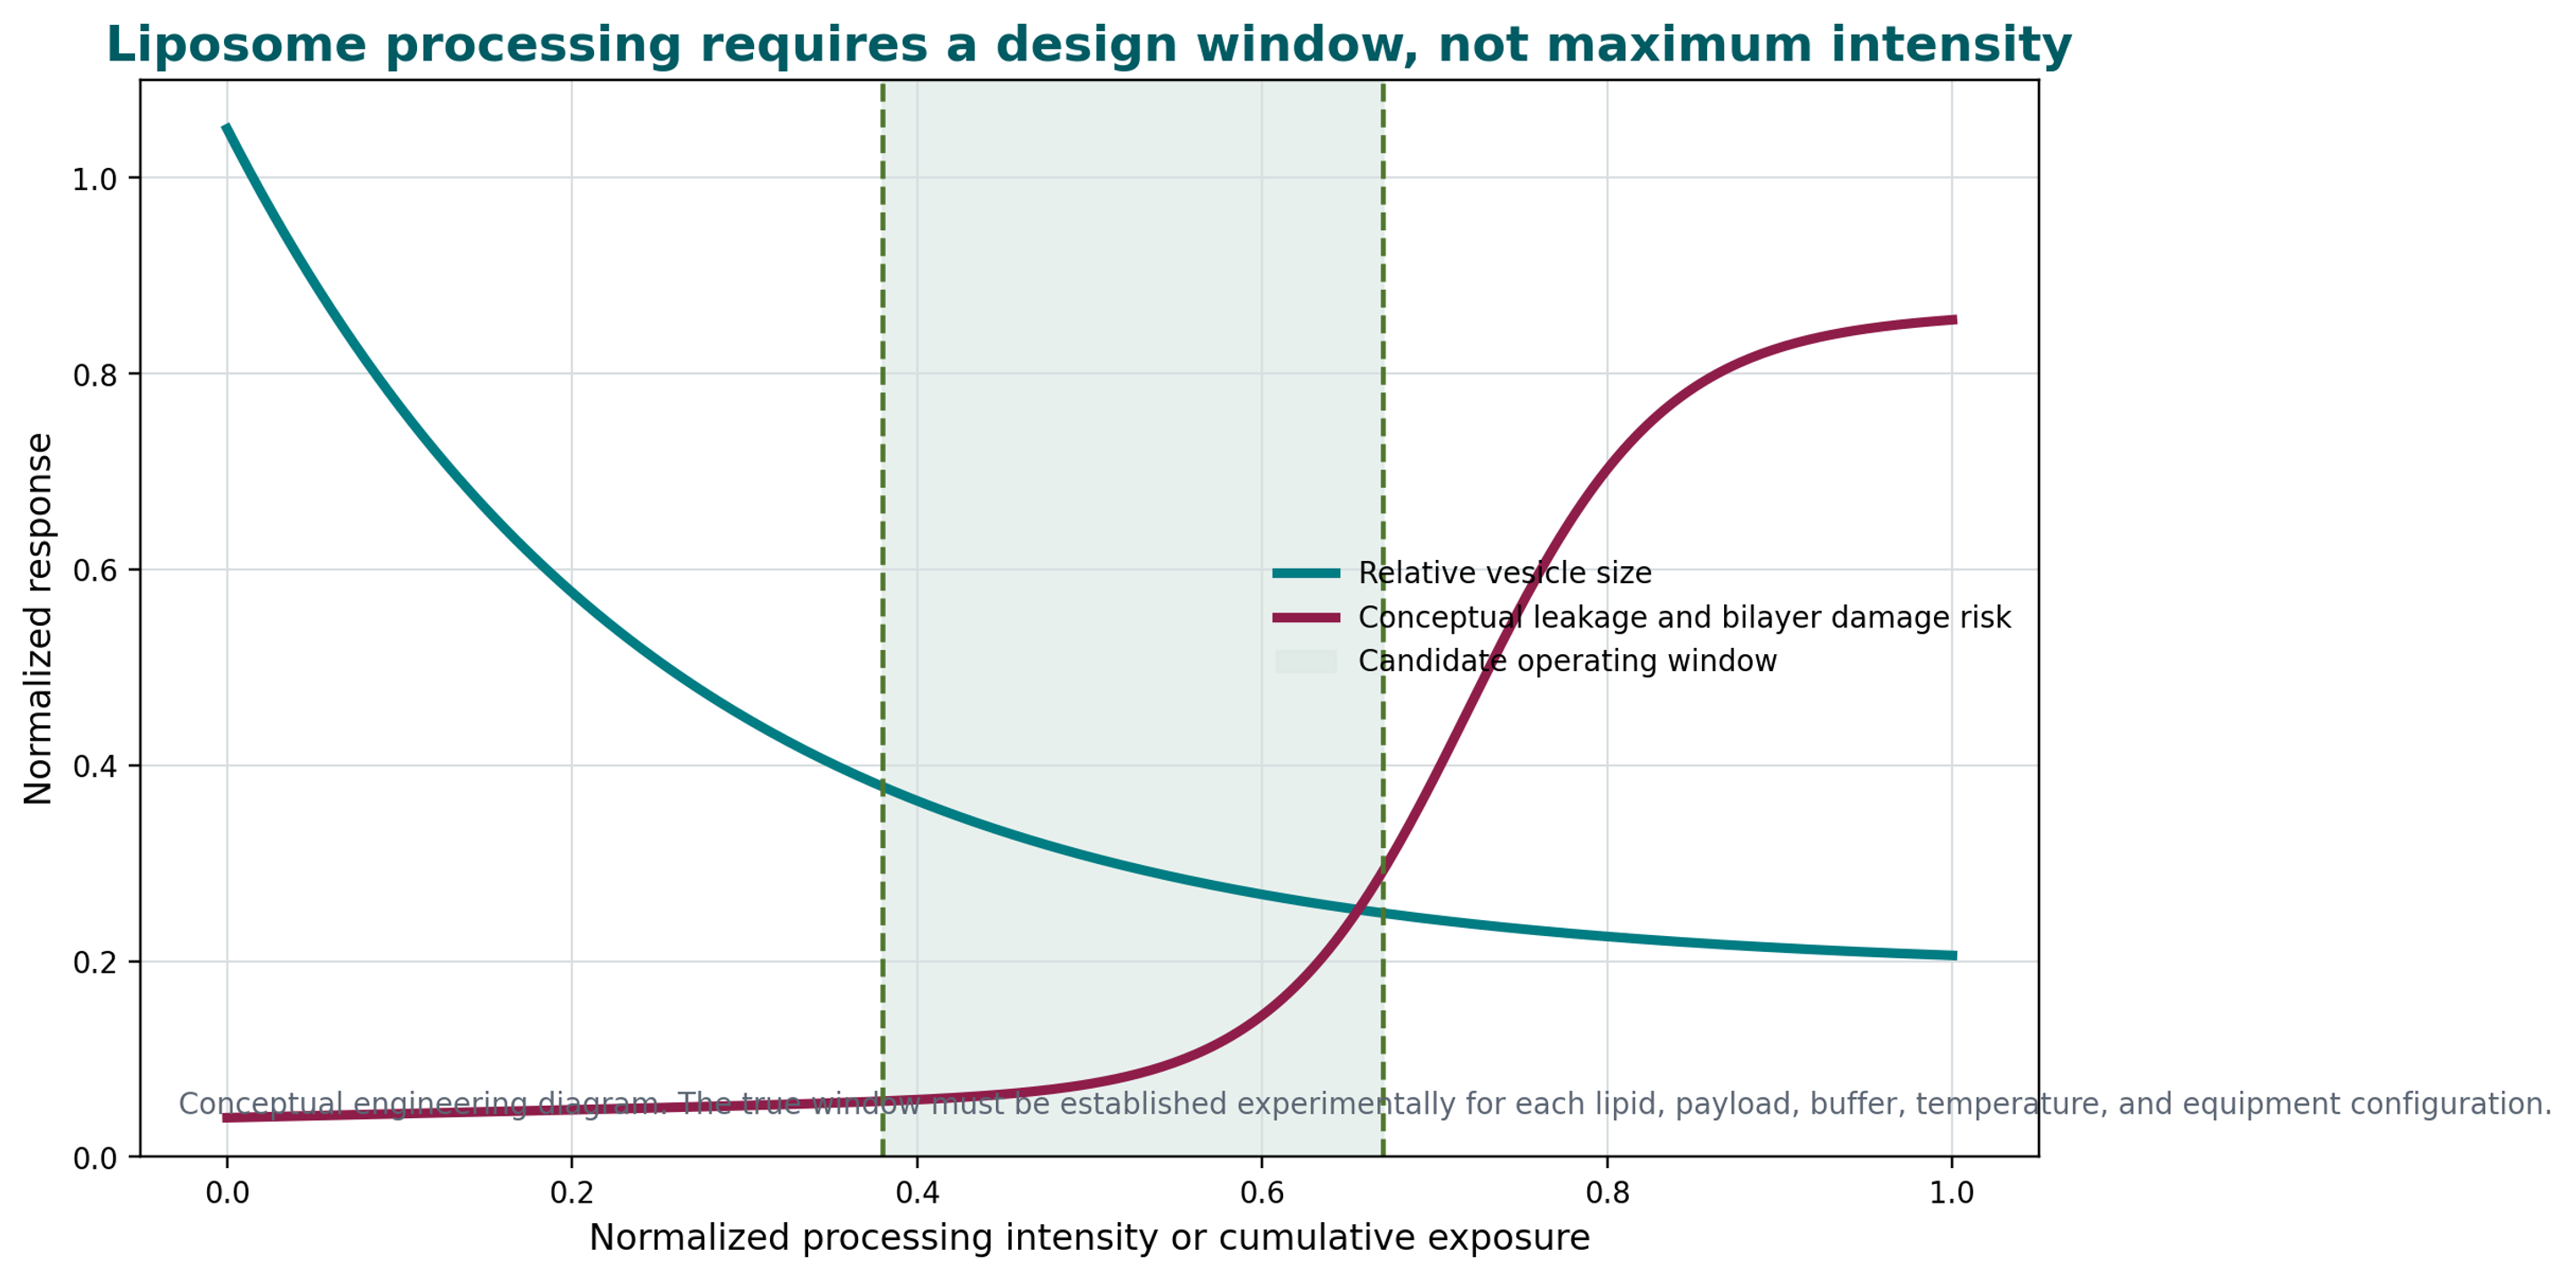
Figure 6.8. Conceptual liposome processing window balancing size reduction against leakage and bilayer damage risk [42].
6.7 Release Models and Interpretation
Drug release from particles and liposomes can be governed by diffusion, dissolution, membrane permeation, erosion, degradation, desorption, pore formation, or a combination of mechanisms. Empirical models are useful for comparison but should not be mistaken for proof of mechanism. The Higuchi square root relation is commonly used when diffusion through a matrix is approximately controlling:
where is cumulative released mass at time t; and is the Higuchi release constant for the selected test conditions.
A first order expression can be used for a system in which the unreleased fraction decreases exponentially:
where is released mass at time t; M∞ is asymptotic released mass; and k₁ is the apparent first order release rate constant.
Release testing should be discriminatory with respect to process variability. The test medium, sink conditions, membrane or separation method, agitation, temperature, analytical recovery, and prevention of particle carryover should be justified. For liposome products, a method should distinguish released drug from intact carrier and should be sensitive to leakage or bilayer changes caused by manufacturing and storage [7].