
Technical publication
Back to publications
Industrial applications
Hydrodynamic Cavitation in Food and Fermentation Processing
okozyuk.com
Published
Read complete publication for whole-document Find and printing. Browser Find and native printing on this reader include only loaded content.
9 Dry Mill Corn Ethanol and Fermentation
9.1 Process rationale and pilot system
Dry mill corn ethanol production includes milling, slurry preparation, cooking or pretreatment, liquefaction, saccharification, simultaneous saccharification and fermentation, distillation, and recovery of distillers grains. Residual starch remains in distillers dried grains with solubles because some granules are inaccessible, incompletely gelatinized, trapped in cellular structure, or converted to poorly fermentable products during severe heating. Finer dry milling can improve accessibility but increases electrical demand and capital cost [44-50].
The Ramirez Cadavid et al. study evaluated controlled flow hydrodynamic cavitation at energy densities representative of commercial processing. A 379 L heated vessel and 74.6 kW centrifugal pump delivered corn slurry through a patented multi orifice device formed by two flow channels separated by a perforated diaphragm. The active restriction created a bubble rich zone, and pressure recovery collapsed the bubbles during exposure on the order of 0.5 s. The system was configured for pressure, differential pressure, flow, and temperature and could either recirculate or discharge to the next process stage [44,56-59].
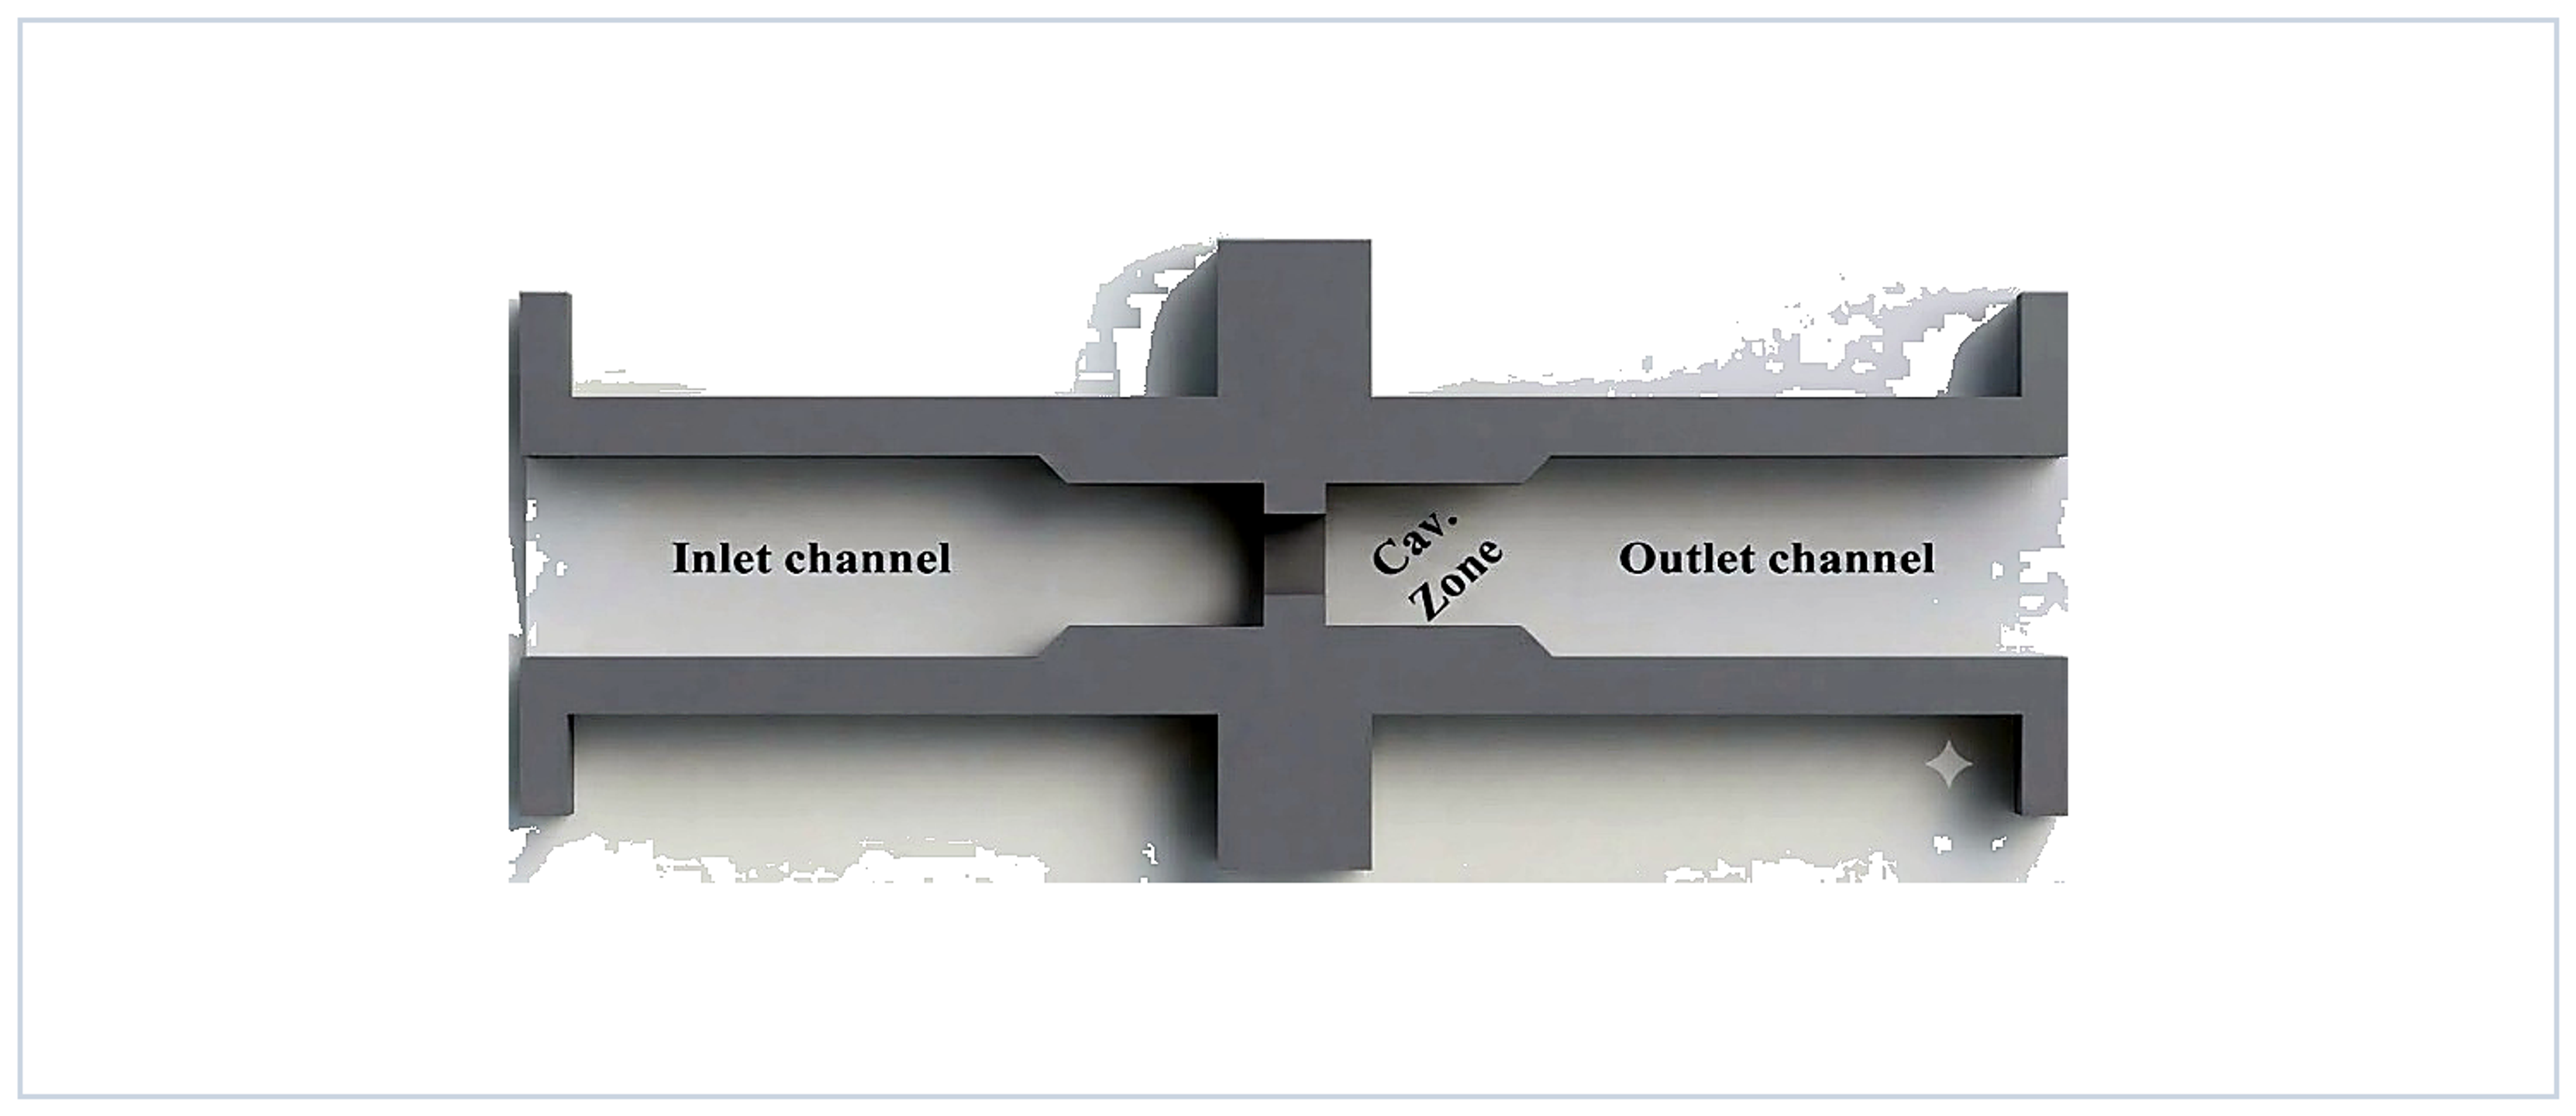
Figure 9.1. Controlled flow cavitation device used in grain slurry pretreatment. [56,57].
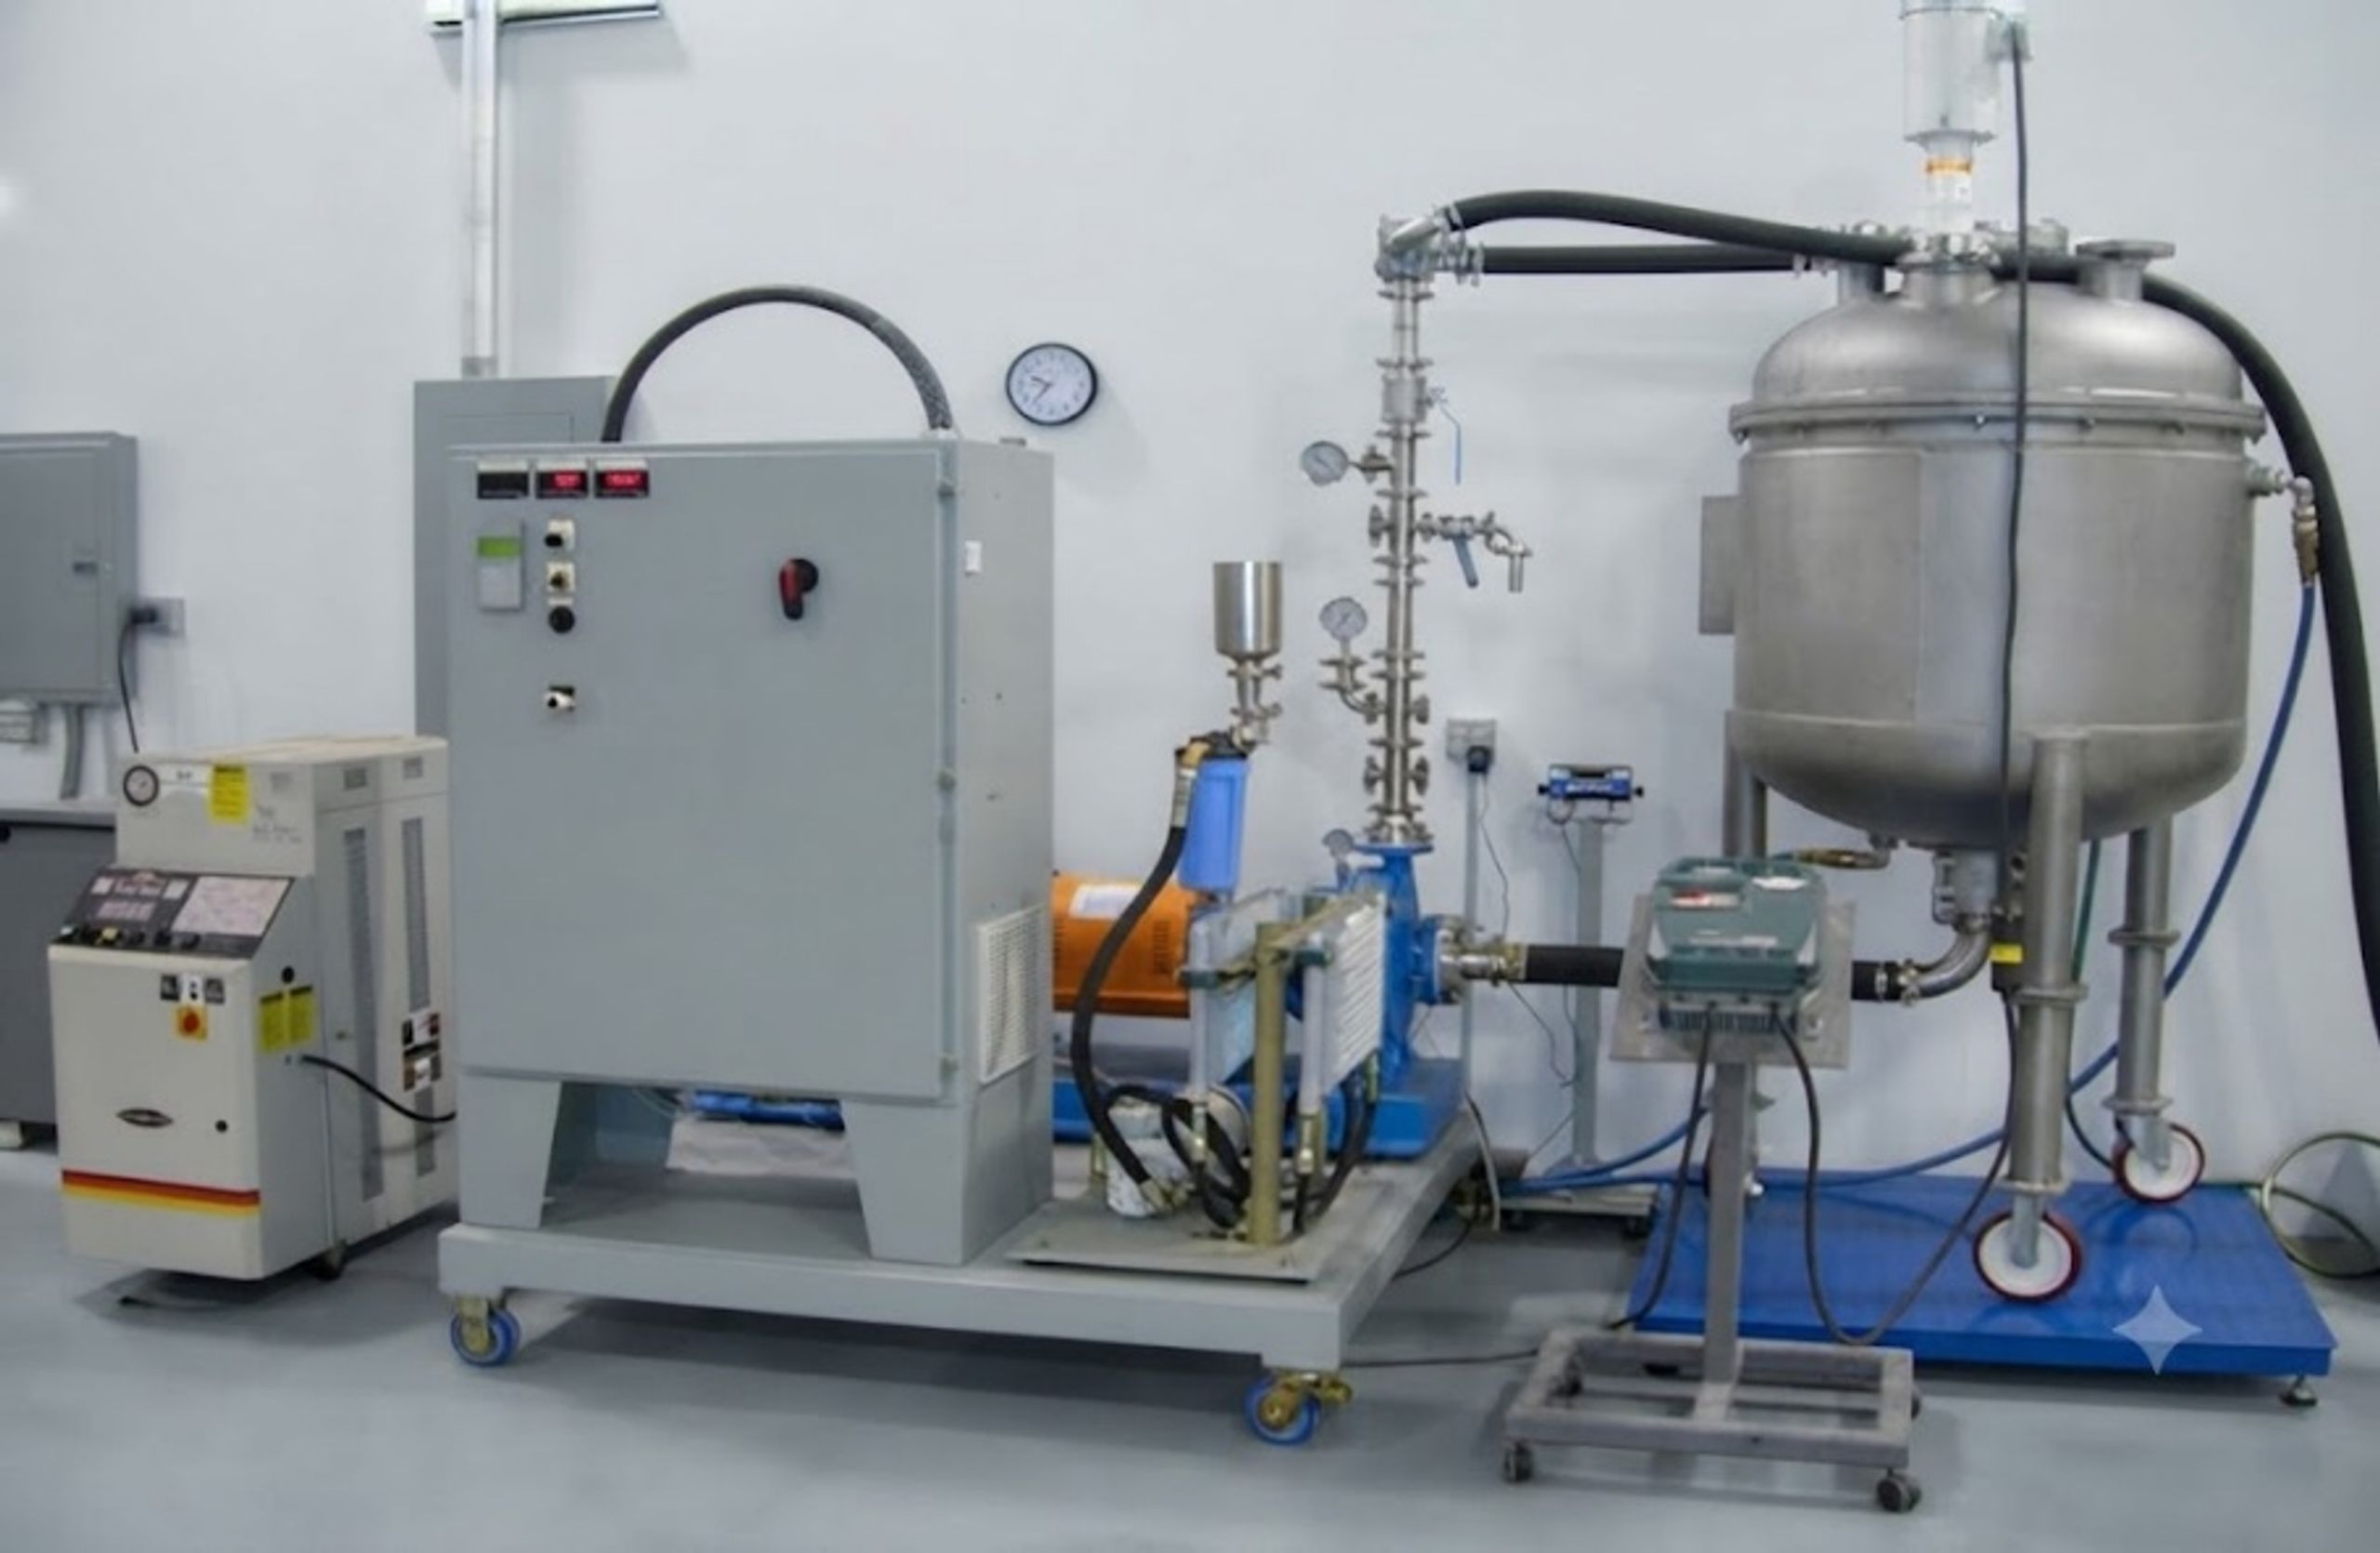
Figure 9.2. Pilot and commercial controlled flow cavitation equipment used for corn slurry treatment. [58].
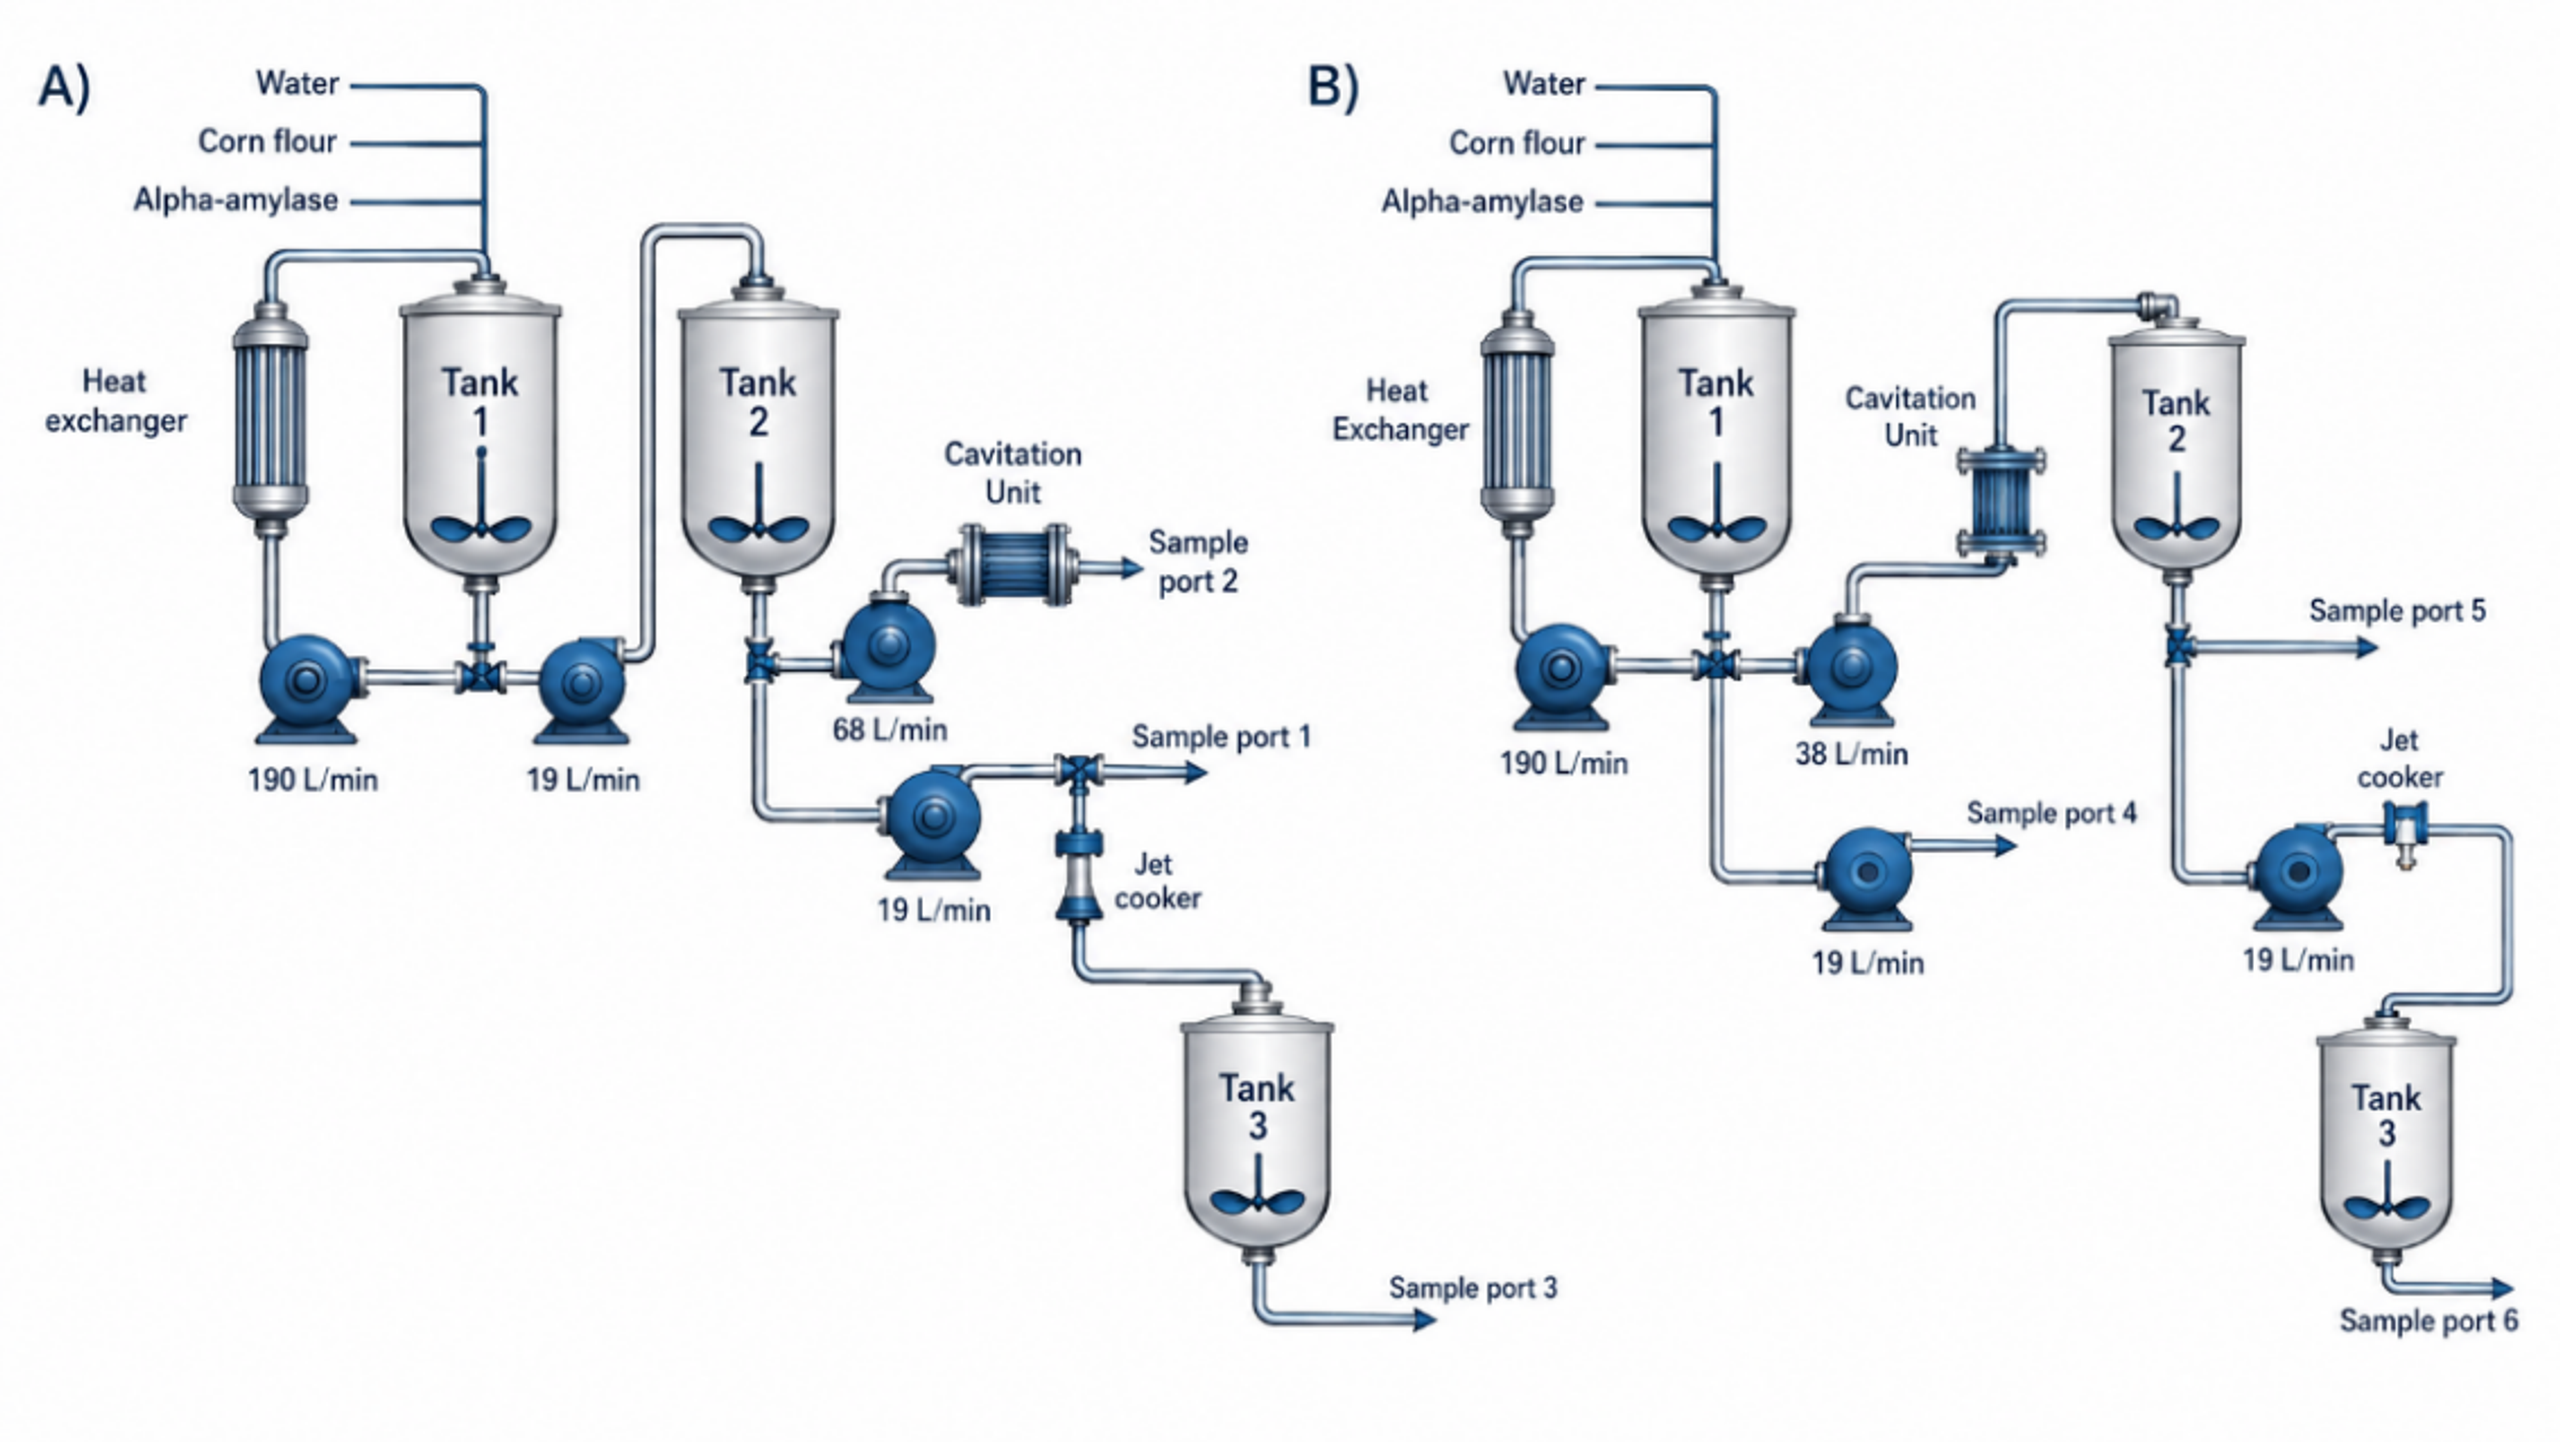
Figure 9.3. Pilot process configurations used to compare untreated slurry, hydrodynamic cavitation, jet cooking, and combined treatment. [58].
9.2 Experimental conditions and analytical basis
The starch release experiment treated mash near 80 °C at specific energy inputs of 627, 940, 1254, and 1567 J/kg slurry. The ethanol yield experiments compared hydrodynamic cavitation treatments of 313, 940, and 1567 J/kg with an untreated control and jet cooking at approximately 106 °C. Corn slurry contained approximately 30.9% solids. Alpha amylase was evaluated at 40%, 70%, and 100% of the conventional total dose, corresponding to 0.016%, 0.028%, and 0.040% by dry corn mass [44,58,59].
After pretreatment, samples underwent liquefaction and simultaneous saccharification and fermentation. Ethanol, glucose, oligosaccharides, lactic acid, glycerol, acetic acid, and carbon dioxide were quantified. Unfermented total glucose converted DP4+, maltotriose, maltose, and glucose to a common glucose equivalent basis. This prevents an apparent improvement caused only by shifting carbohydrate from one oligomer fraction to another [44,58,59].
where UFTG is unfermented total glucose equivalent, DP4+ is the concentration of oligomers containing four or more glucose units, DP3 is maltotriose, DP2 is maltose, and G is glucose. Coefficients correct for water addition during hydrolysis to monomers [44,59].
Table 9.1. Pilot dry mill corn cavitation conditions.
| Treatment | Specific energy, J/kg slurry | Representative pump flow, L/min | Temperature rise across treatment | Purpose |
|---|---|---|---|---|
| Cav2A | 313 | 26.1 ± 0.7 | Approximately 3.2 °C | Low severity ethanol yield treatment |
| Cav2B | 940 | 40.5 ± 2.6 | Approximately 6.2 °C | Intermediate treatment and cavitation plus jet comparison |
| Cav2C | 1567 | 51.5 ± 0.4 | Approximately 8.4 °C | High severity ethanol yield treatment |
| Starch release series | 627, 940, 1254, 1567 | Condition dependent | Measured at each setting | Particle size and soluble starch response |
| Jet cooking | Not expressed as HC energy density | Process dependent | Slurry held near 106 °C under pressure | Conventional thermal comparator |
9.3 Particle size, starch accessibility, fermentation, and enzyme dose
Hydrodynamic cavitation preferentially reduced the coarse portion of the corn particle distribution and increased soluble starch and saccharides. The highest starch release treatment increased soluble starch by approximately 11% relative to the untreated mash. Because collapse acts most strongly at weak points, pores, and interfaces, large particles are fragmented disproportionately while fine particles approach a limiting size [44,58,59].
Pooled ethanol results increased with cavitation energy density. Ethanol concentrations were approximately 35.10% for the control, 35.04% for 313 J/kg, 35.73% for 940 J/kg, 36.01% for 1567 J/kg, and 34.86% for jet cooking, expressed on the study's dry corn basis. The intermediate and high cavitation treatments produced statistically higher pooled ethanol than the control and jet cooked samples. Unfermented total glucose declined modestly, and carbon dioxide production tracked ethanol closely [44,59].
Alpha amylase dose from 40% to 100% of the conventional dose did not produce a significant pooled difference in ethanol yield under the tested conditions. This indicates that improved starch accessibility permitted reduction from 0.040% to 0.016% alpha amylase by dry corn mass without a significant yield penalty. Enzyme economics should nevertheless be rechecked with the plant's corn quality, solids, pH, enzyme formulation, and recycle streams [44,58,59].
A separate comparison using 940 J/kg found approximately 35.8% ethanol for cavitation alone, 35.3% for cavitation followed by jet cooking, and 35.0% for the untreated control. The lower result for the combined treatment suggests that severe heating after cavitation can offset accessibility benefits through formation of unfermentable products or other thermal effects. This is consistent with the earlier commercial scale study, where controlled flow cavitation alone outperformed cavitation followed by jet cooking [44,45,58,59].
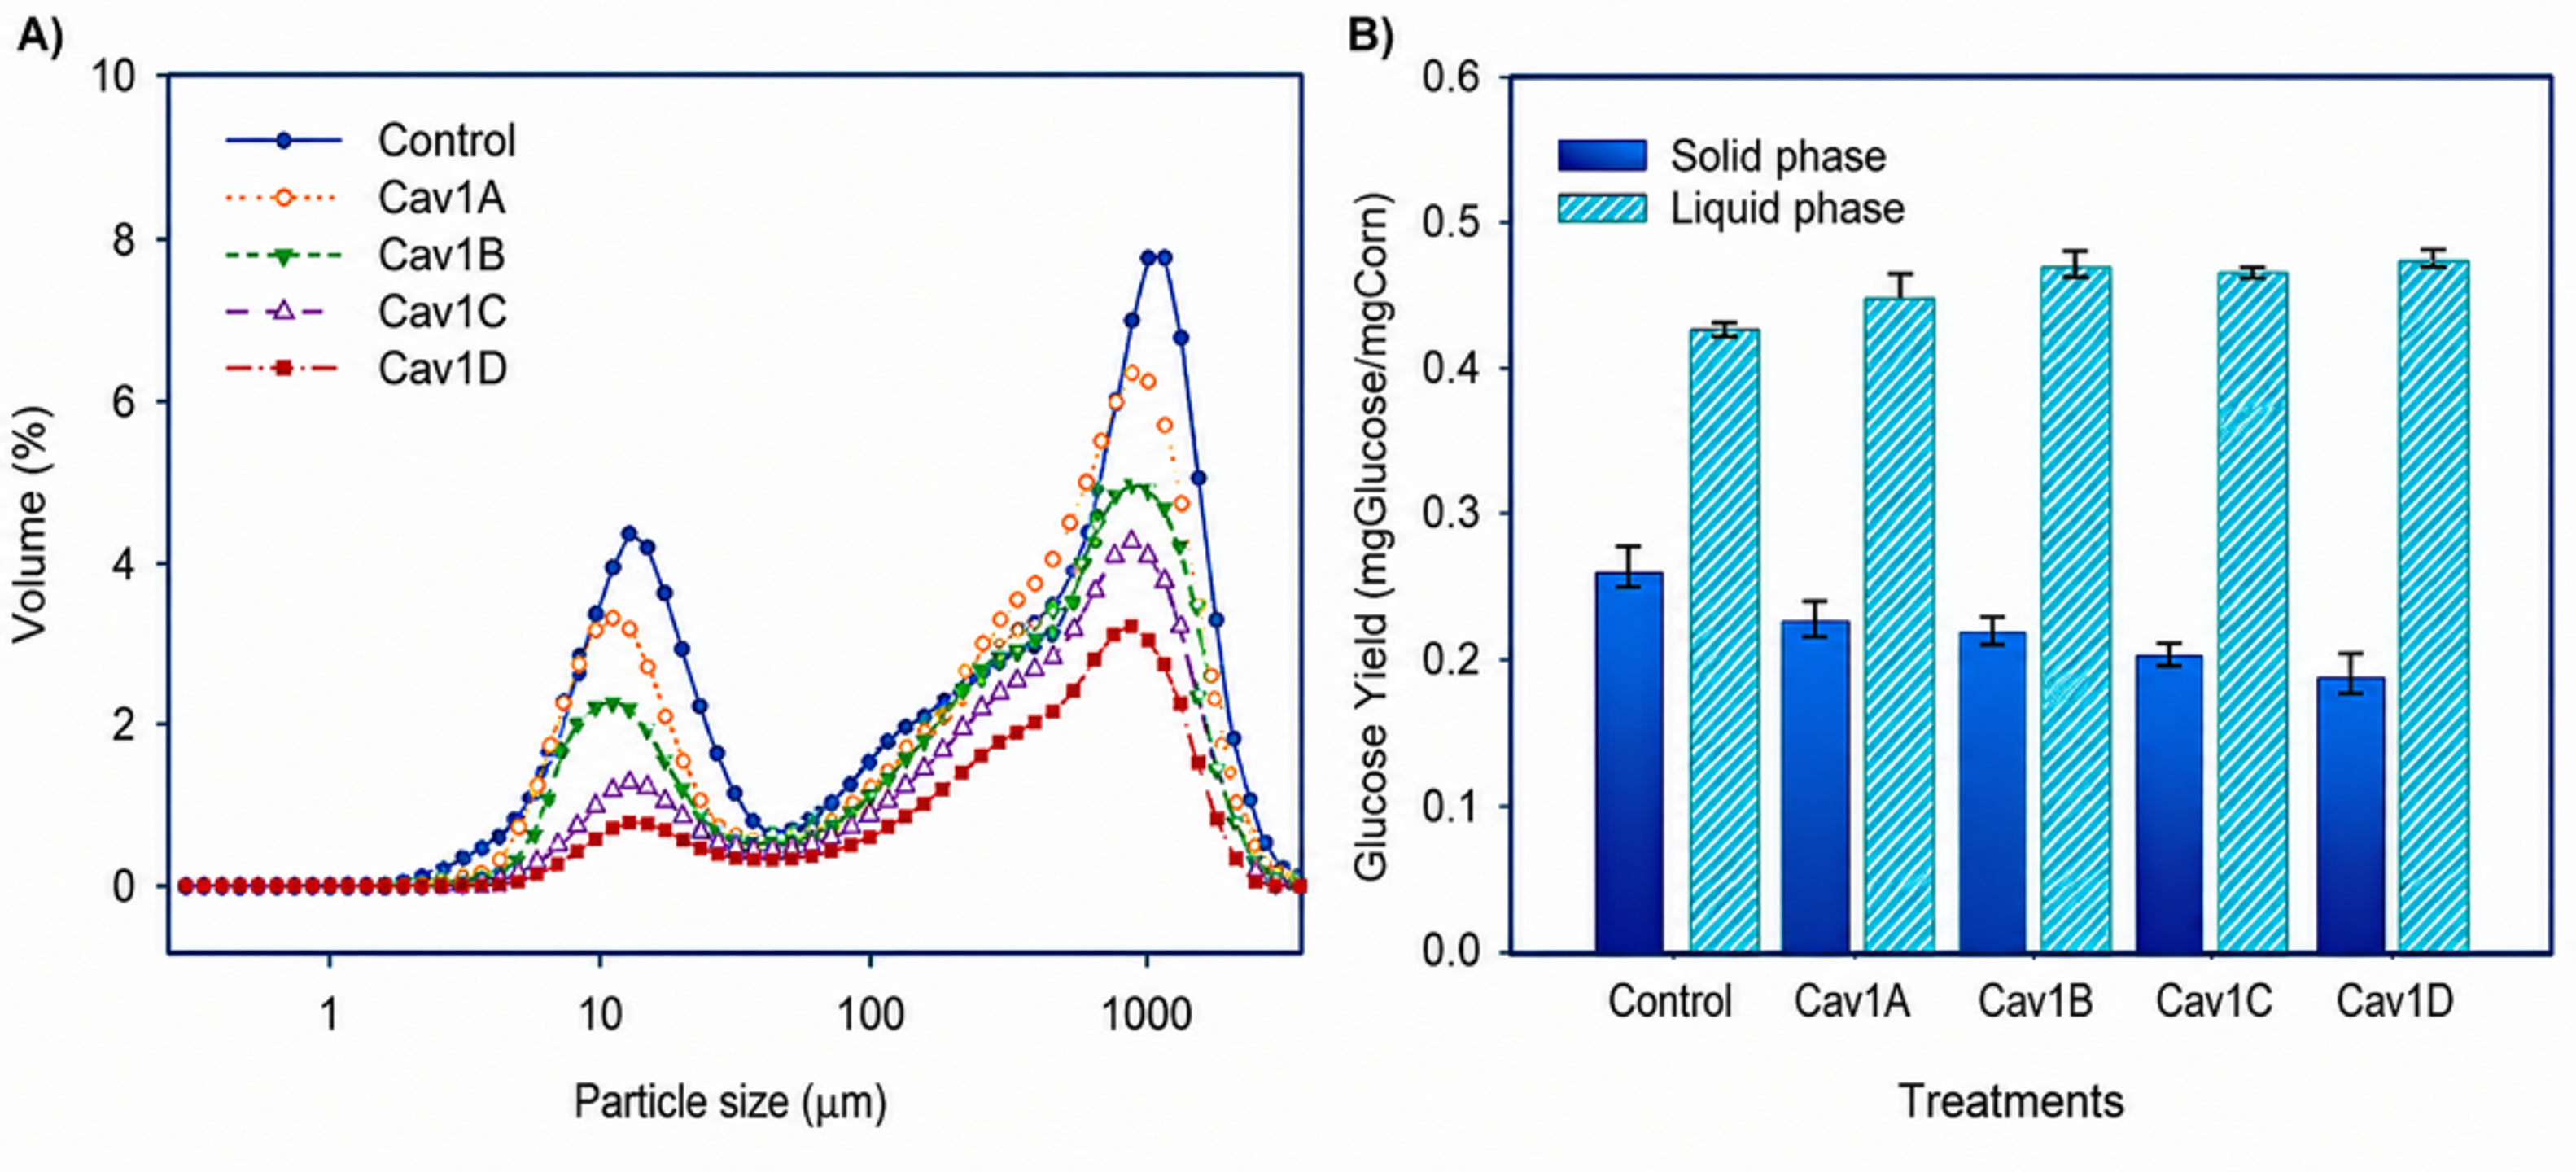
Figure 9.4. Effects of cavitation energy density on corn slurry particle size distribution and glucose related responses.. [59].
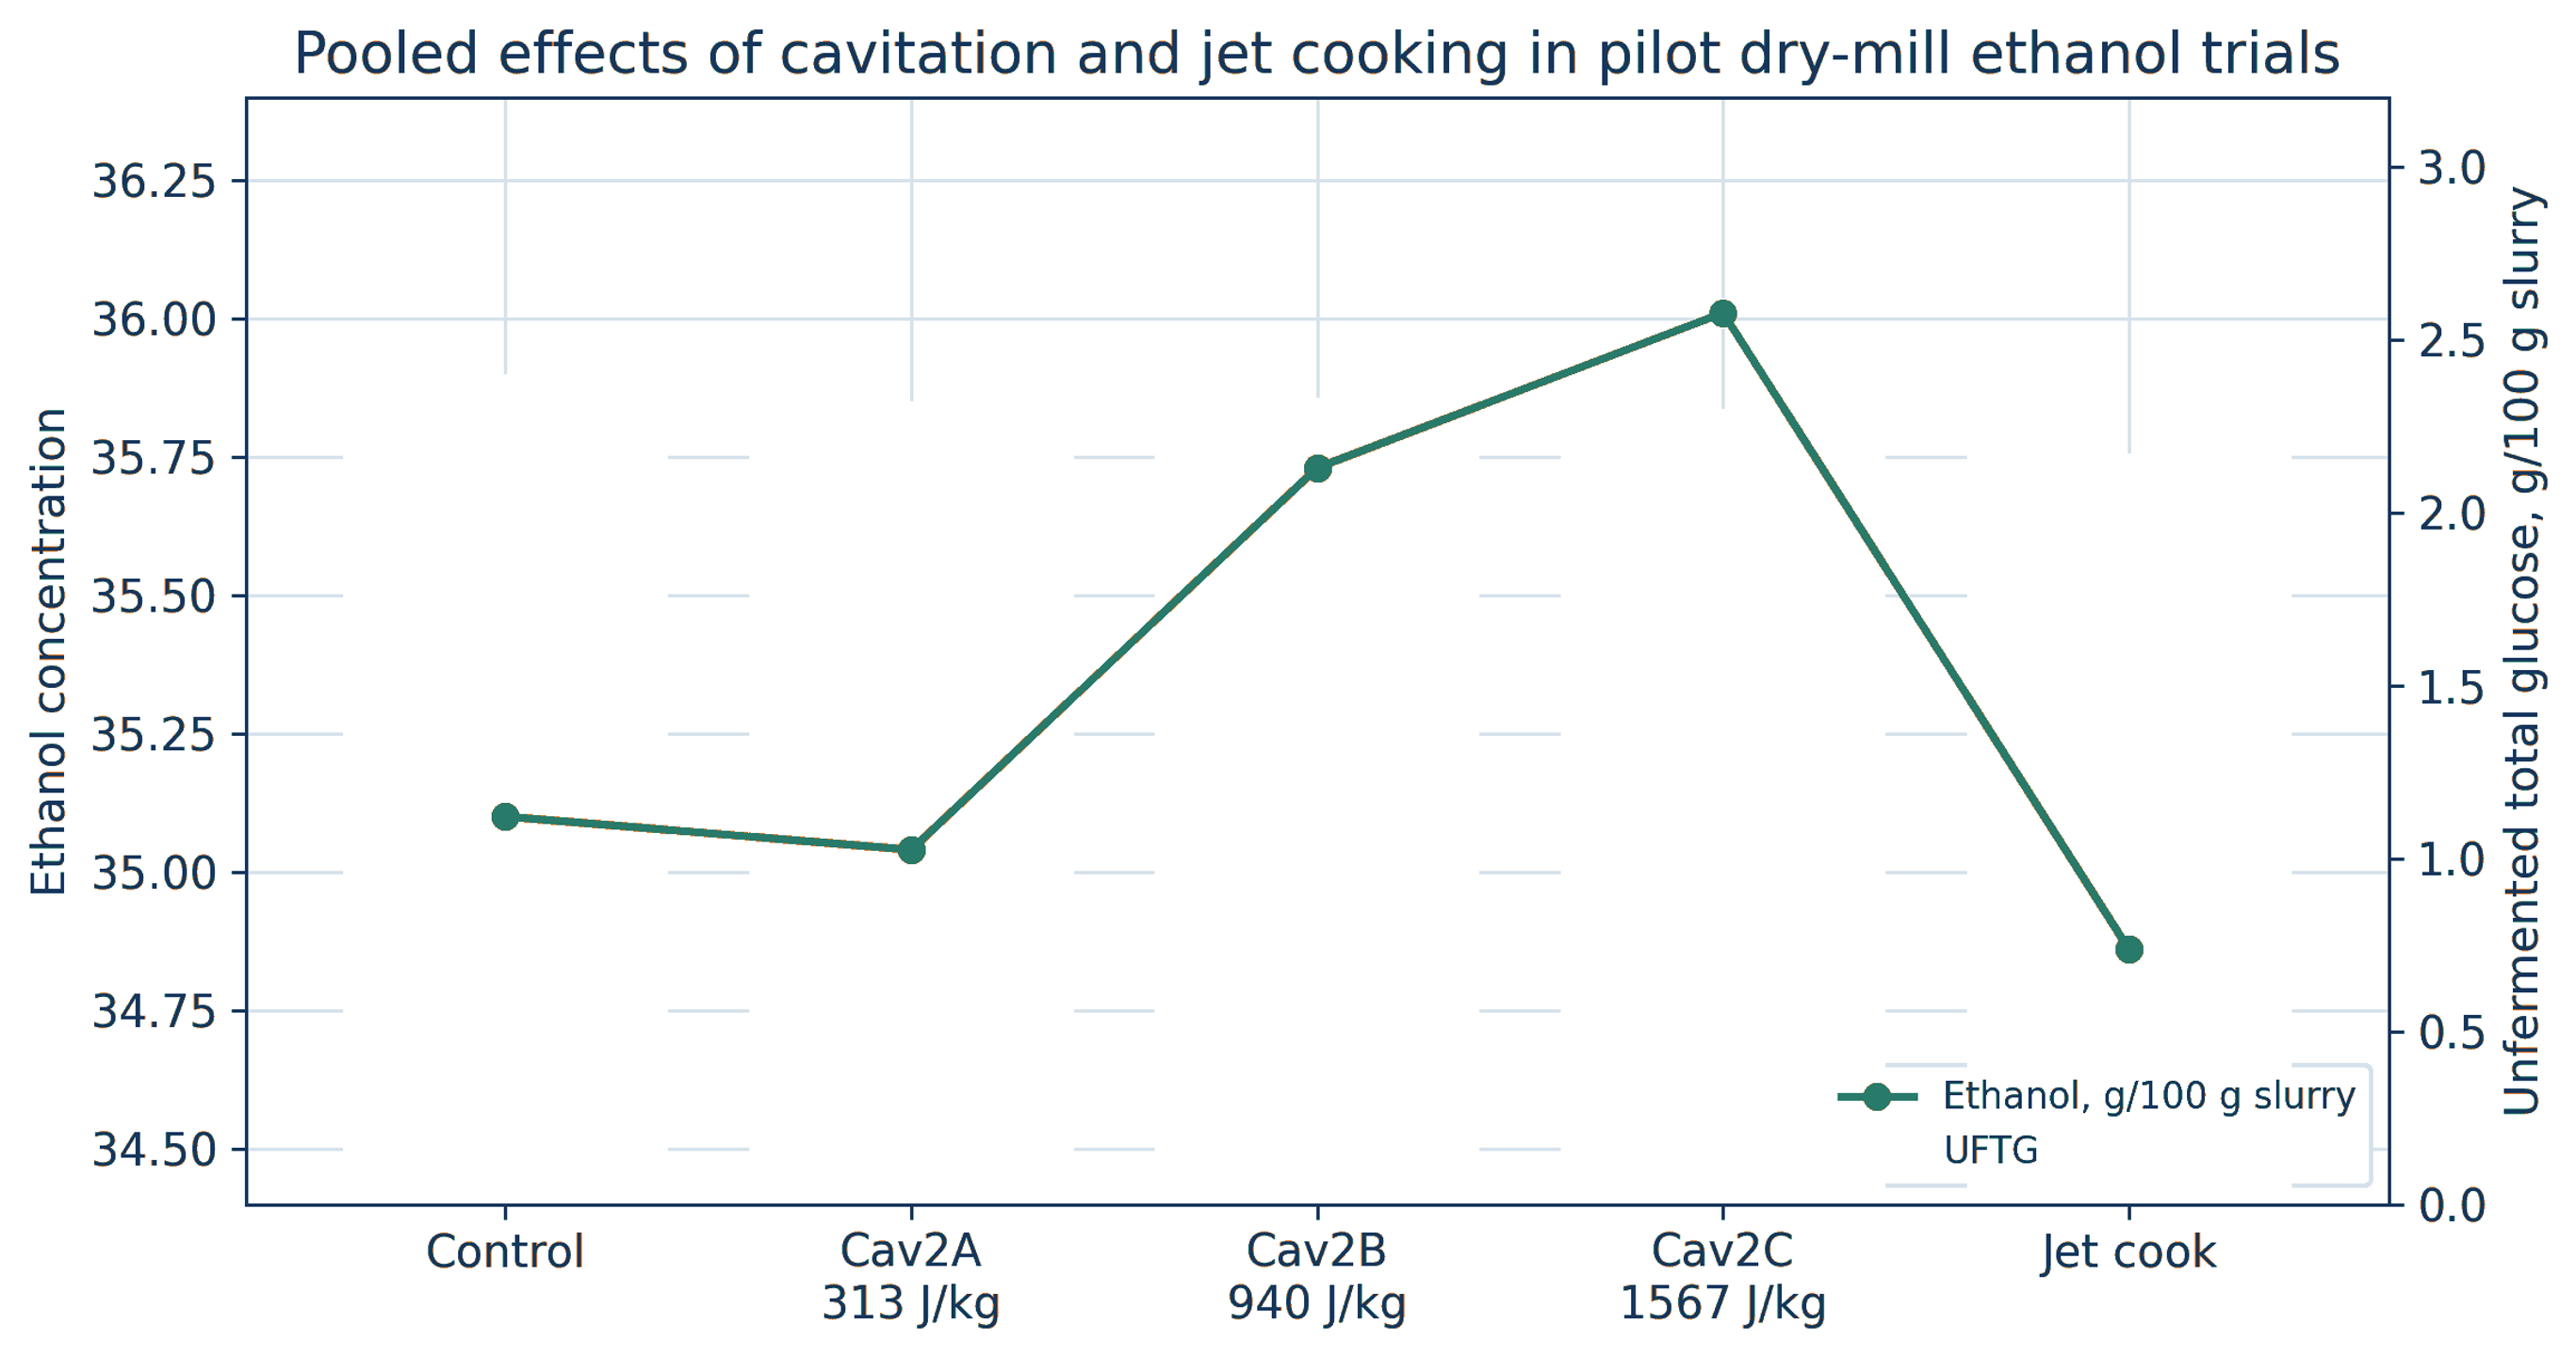
Figure 9.5. Pooled ethanol and unfermented total glucose responses in the pilot dry mill study. [59].
Table 9.2. Pooled fermentation results from the pilot pretreatment comparison.
| Treatment | Ethanol | UFTG | Lactic acid | Glycerol | Acetic acid | CO2 |
|---|---|---|---|---|---|---|
| Control | 35.10 ± 0.70 | 2.40 ± 0.06 | 0.12 ± 0.01 | 2.54 ± 0.06 | 0.13 ± 0.01 | 36.00 ± 0.50 |
| Cav2A, 313 J/kg | 35.04 ± 0.38 | 2.32 ± 0.13 | 0.12 ± 0.01 | 2.60 ± 0.07 | 0.14 ± 0.00 | 35.93 ± 0.47 |
| Cav2B, 940 J/kg | 35.73 ± 0.16 | 2.33 ± 0.02 | 0.10 ± 0.01 | 2.57 ± 0.03 | 0.14 ± 0.00 | 36.87 ± 0.11 |
| Cav2C, 1567 J/kg | 36.01 ± 0.25 | 2.30 ± 0.14 | 0.10 ± 0.01 | 2.42 ± 0.03 | 0.14 ± 0.00 | 37.17 ± 0.09 |
| Jet cooking | 34.86 ± 0.44 | 2.17 ± 0.19 | 0.11 ± 0.02 | 2.61 ± 0.09 | 0.14 ± 0.01 | 35.64 ± 0.74 |
9.4 Energy return and commercial interpretation
The incremental energy return () is calculated using Equation (9.2):
where is net incremental energy return, is additional ethanol produced relative to the control, has ethanol lower heating value, and the denominator is additional electrical energy used by cavitation.
The pilot study reported approximately 47 kJ of additional ethanol energy for each kilojoule used by hydrodynamic cavitation at the selected optimum. The earlier commercial scale study at a 379 million L/y plant reported an energy return near 16 and an average ethanol increase of about 2.2% [44,45,59]. The difference reflects system boundary, operating point, baseline, and statistical uncertainty; both results indicate that a small specific mechanical input can unlock a much larger chemical energy value when it improves conversion of existing carbohydrate.
Commercial evaluation should include the installed pressure drop, pump efficiency, maintenance, erosion inspection, enzyme savings, increased ethanol, DDGS composition, downstream evaporation, and any eliminated jet cooking steam. The cavitation device should be positioned where mash temperature, viscosity, and particle size permit reliable flow. Differential pressure, flow, and temperature should be interlocked to prevent operation outside the validated envelope.
9.5 Commercial scale evidence and patent integration
The controlled flow cavitation patents disclose several integration points in a grain to alcohol plant. The device may be installed in a slurry tank recirculation loop, between slurry preparation and cooking, after cooking and before liquefaction, or in a liquefaction loop. Localized flow restrictions generate the low pressure zone, while downstream pressure recovery and an optional resistance control bubble collapse. These patents establish apparatus and process options, but patent claims are not independent proof of yield, energy, or reliability [56,57].
The NCERC pilot report provides a controlled experimental comparison. At both 58 and 77 °C slurry preparation temperatures, treatment at 200 and 300 psig increased ethanol yield by approximately 2 to 3% relative to untreated slurry. At 77 °C, yield rose from 0.363 to 0.376 g ethanol per g dry corn at 300 psig. At 58 °C, yield rose from 0.358 to 0.366 g/g. No statistically significant increase was found for jet cooking or 100 psig cavitation under the tested conditions [58].
The Ohio State thesis extended the work to a commercial dry mill plant with annual production near 100 million gal. Cavitation alone increased ethanol production by 2.2% relative to uncavitated samples. Cellulase without cavitation increased production by about 2.5%, while the combination of cavitation and cellulase increased production by about 4.3%. The electrical energy used for cavitation was reported as approximately one sixteenth of the energy contained in the additional ethanol, and the value of the added ethanol exceeded the electricity cost by more than thirty times. These are study specific results and require confirmation with current feedstock, enzyme, energy, and coproduct economics [59].
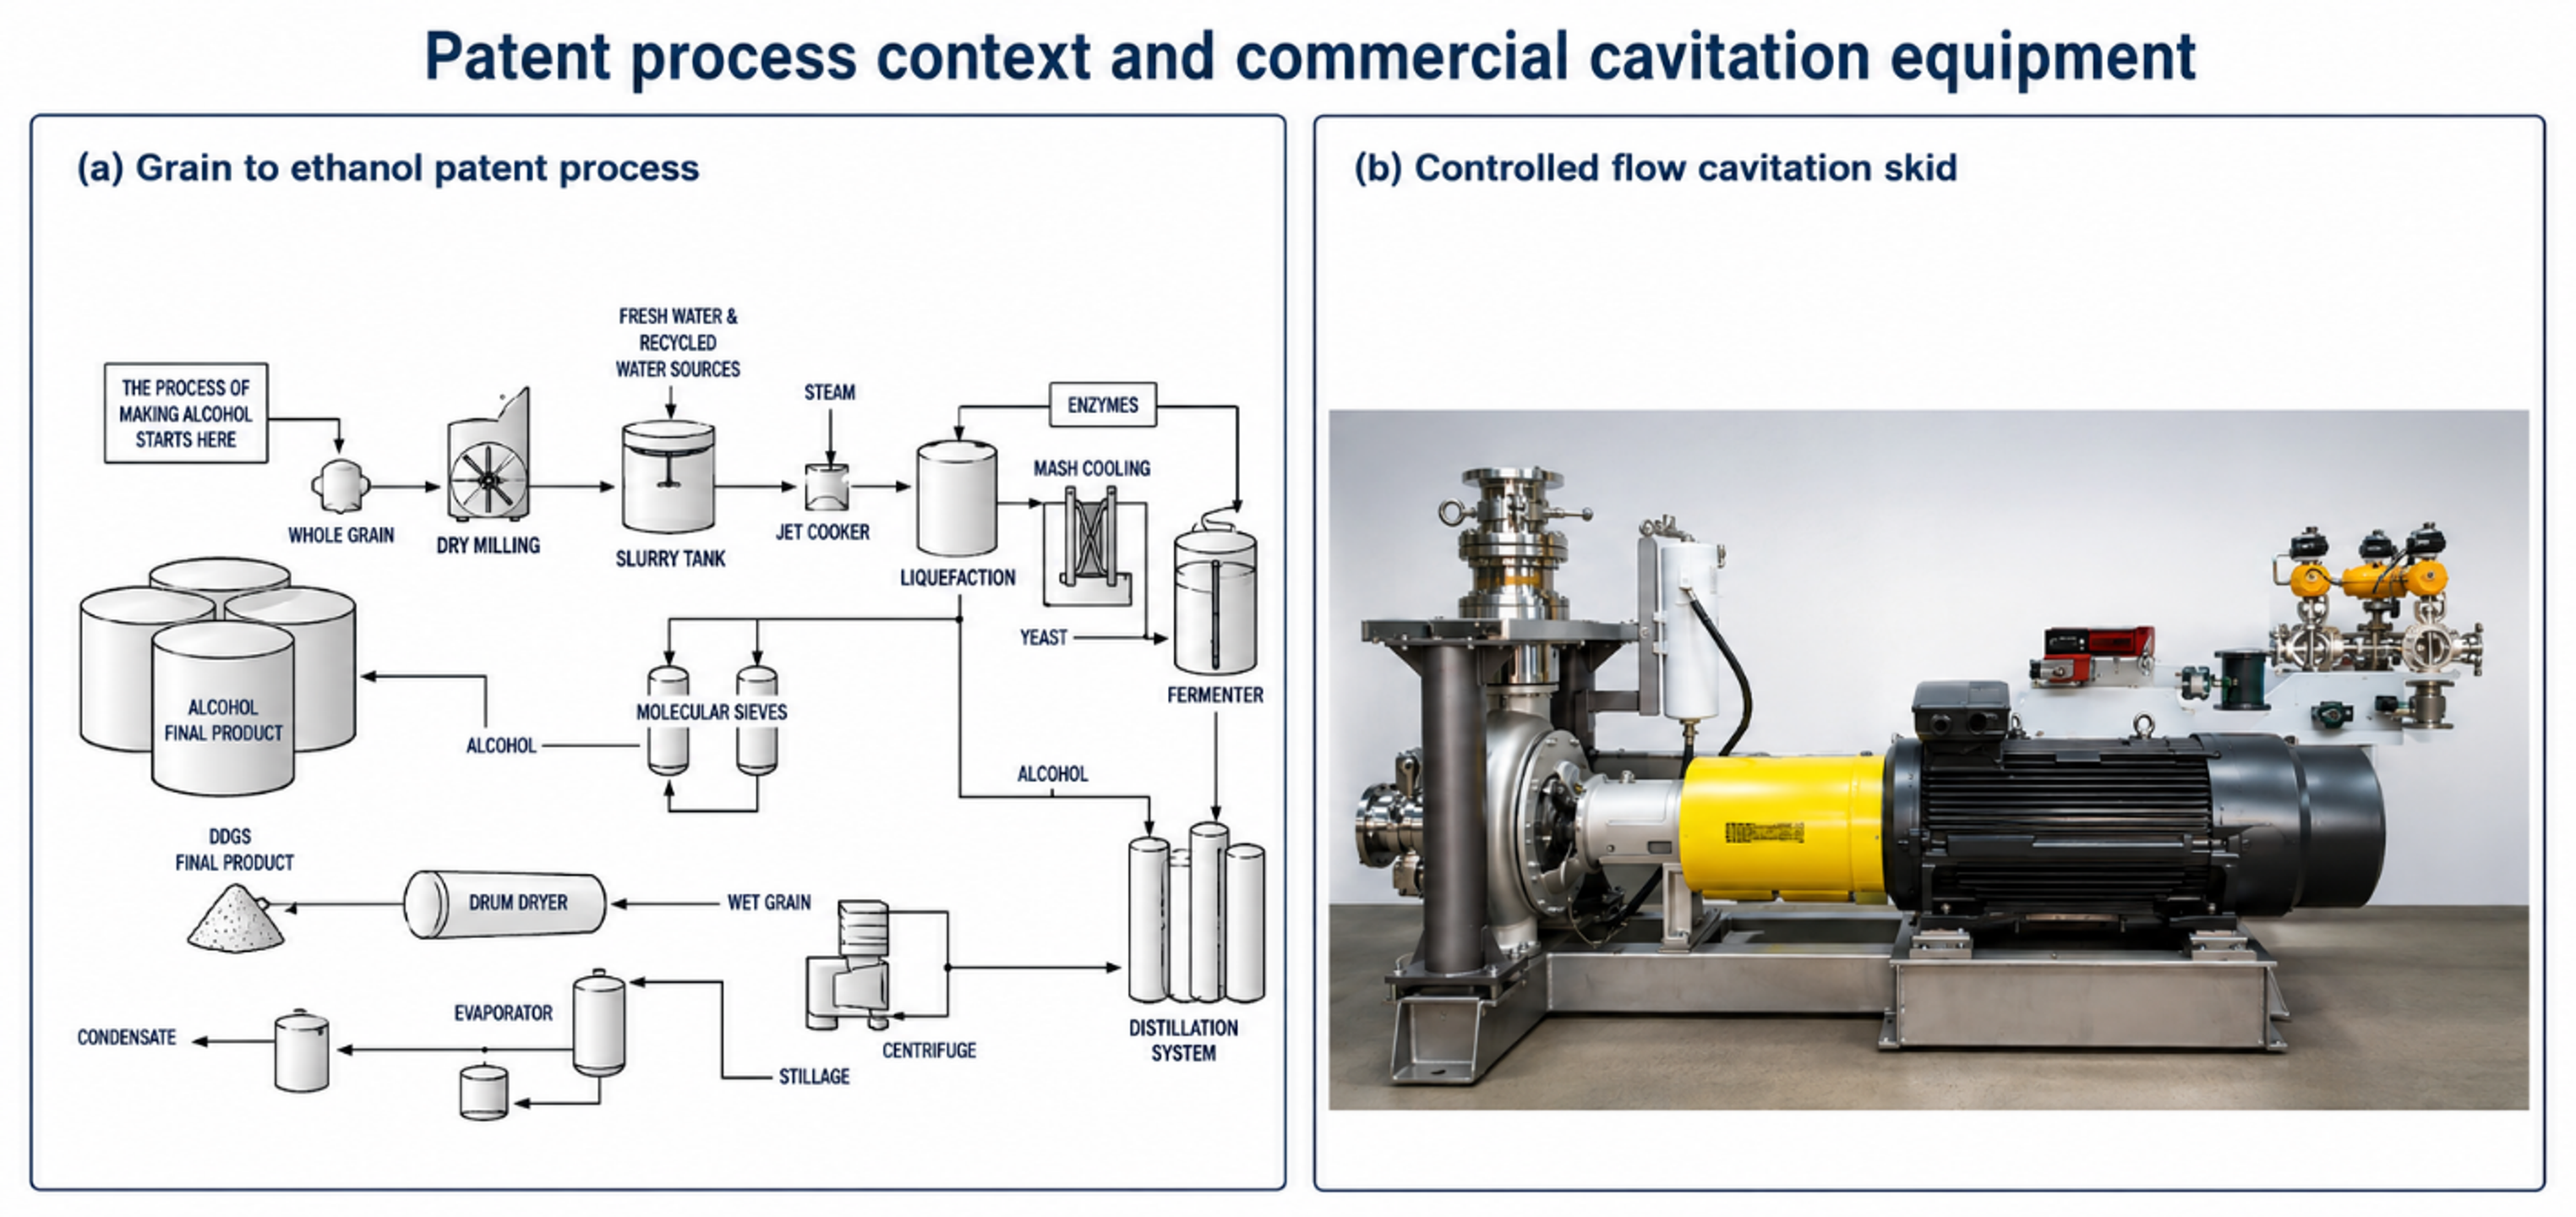
Figure 9.6. Patent process context and commercial controlled flow cavitation equipment. [57,58].
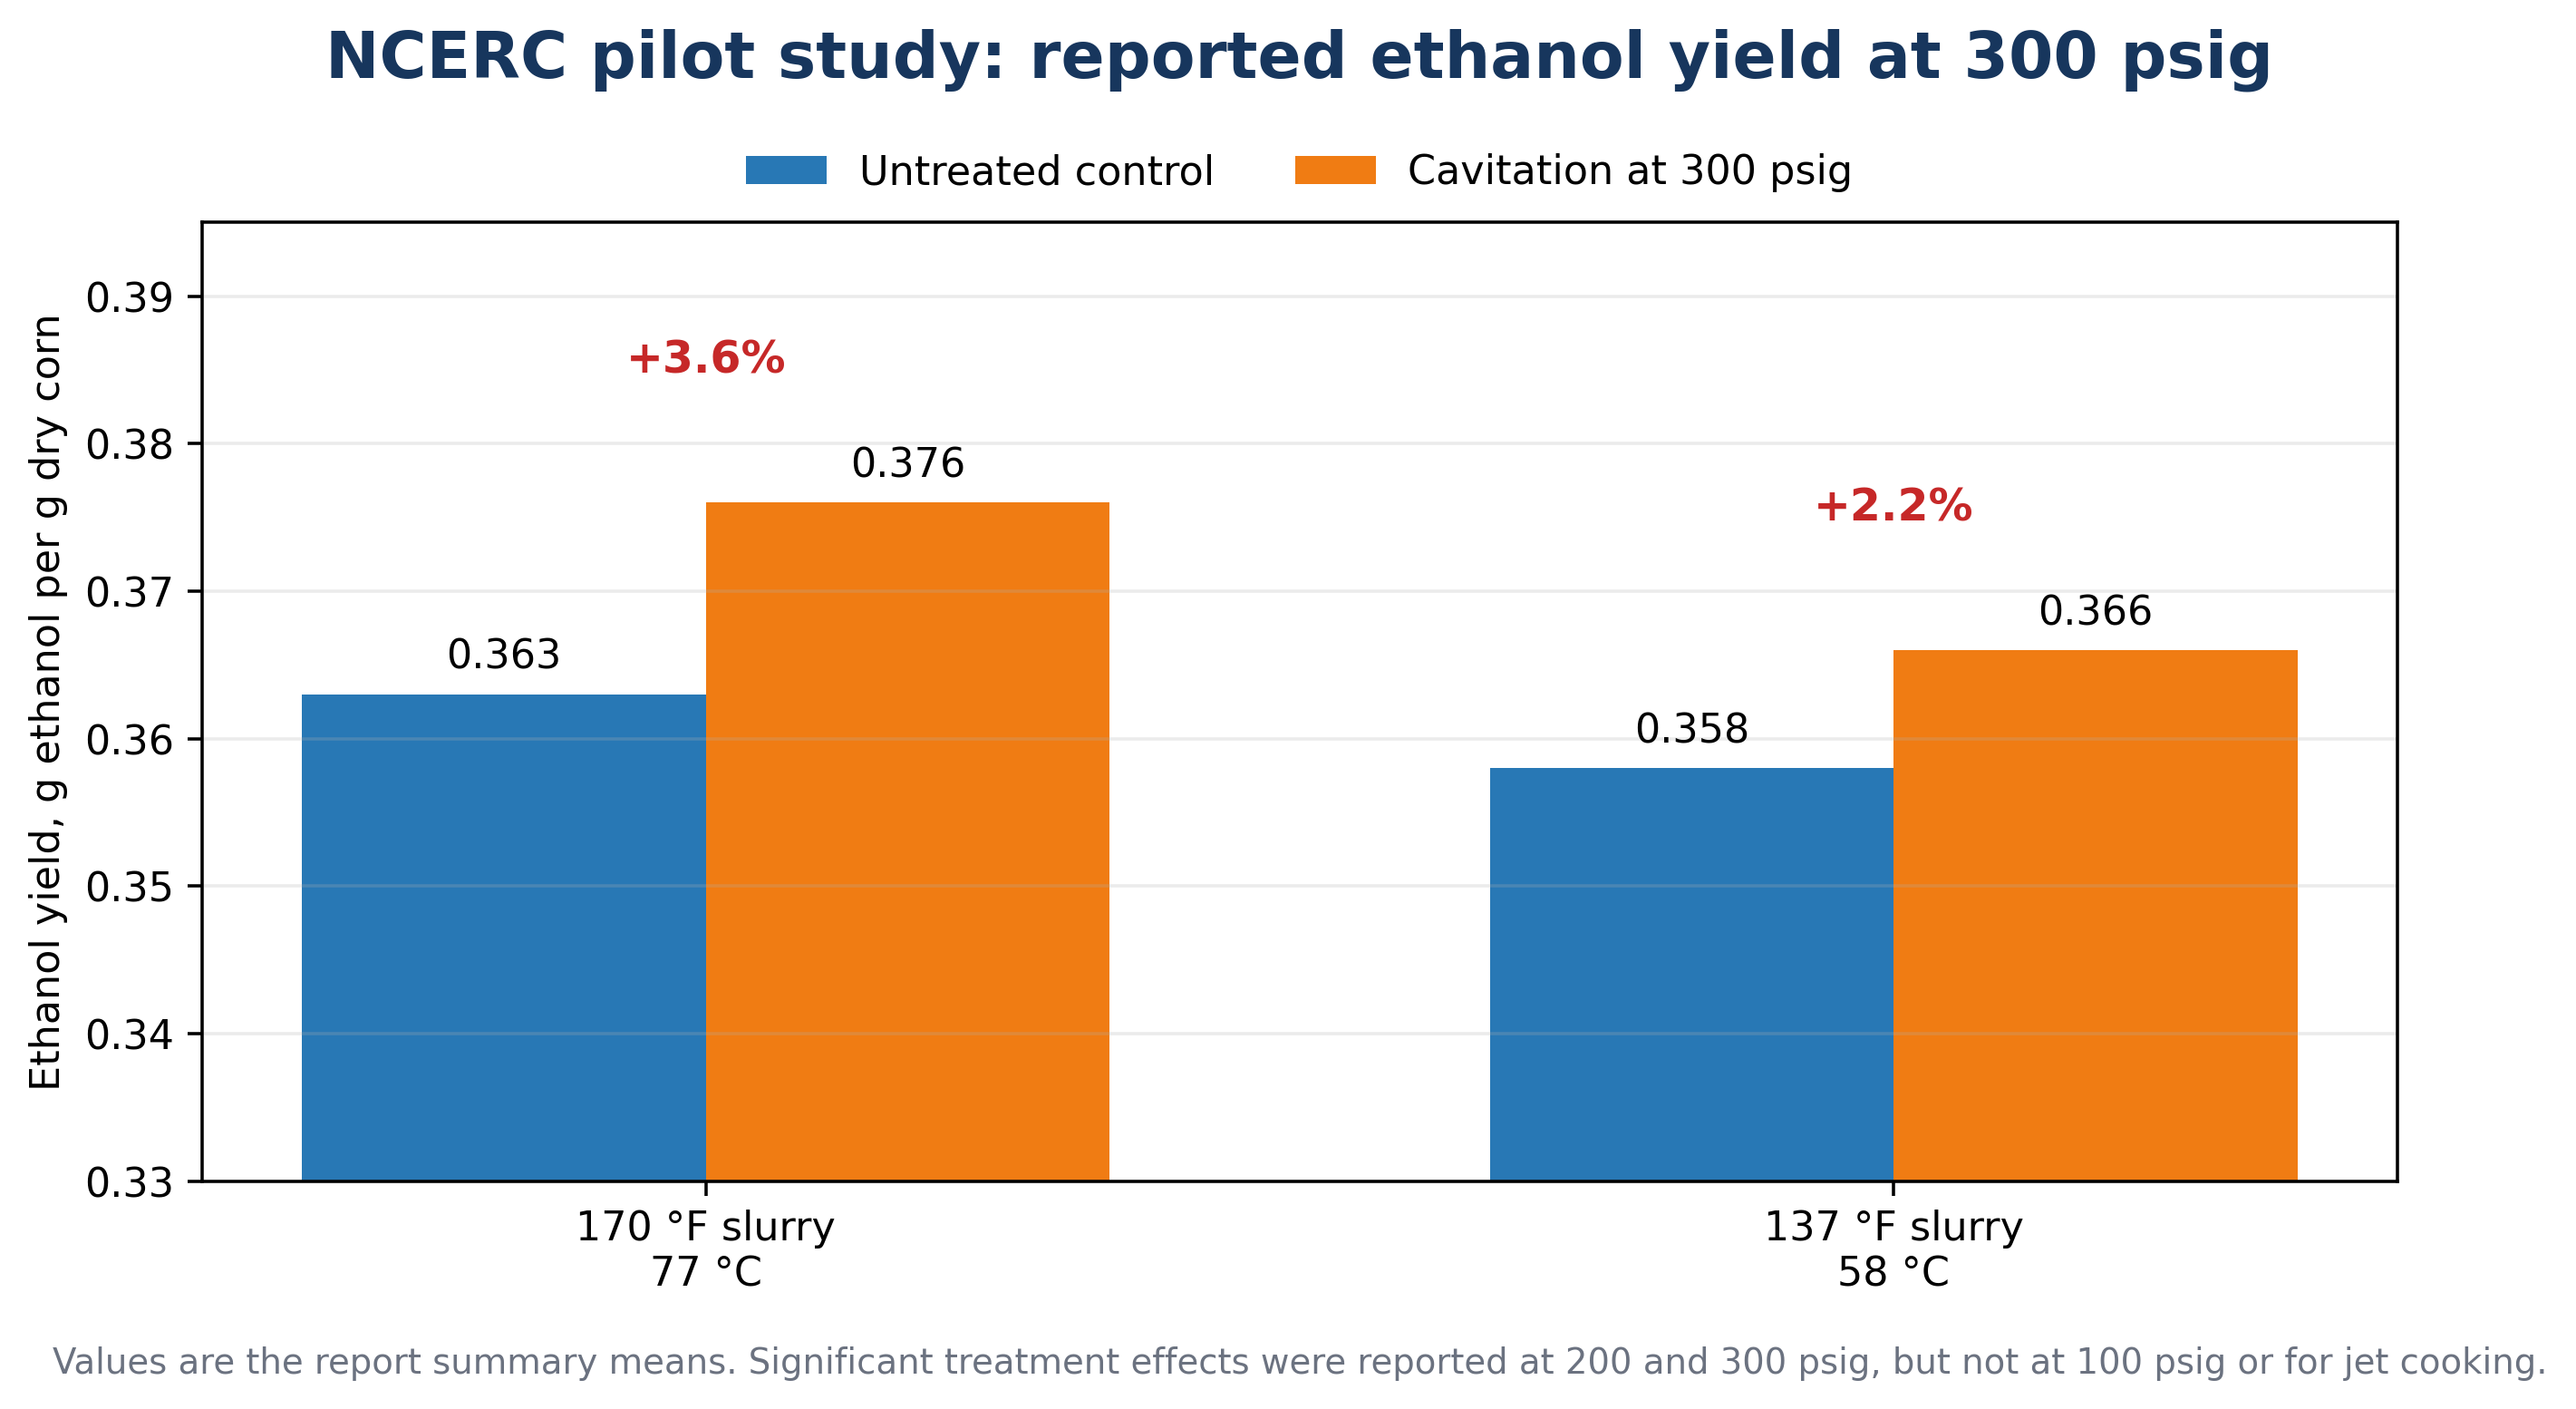
Figure 9.7. NCERC pilot study ethanol yields at 300 psig compared with untreated controls at two slurry preparation temperatures.[58].
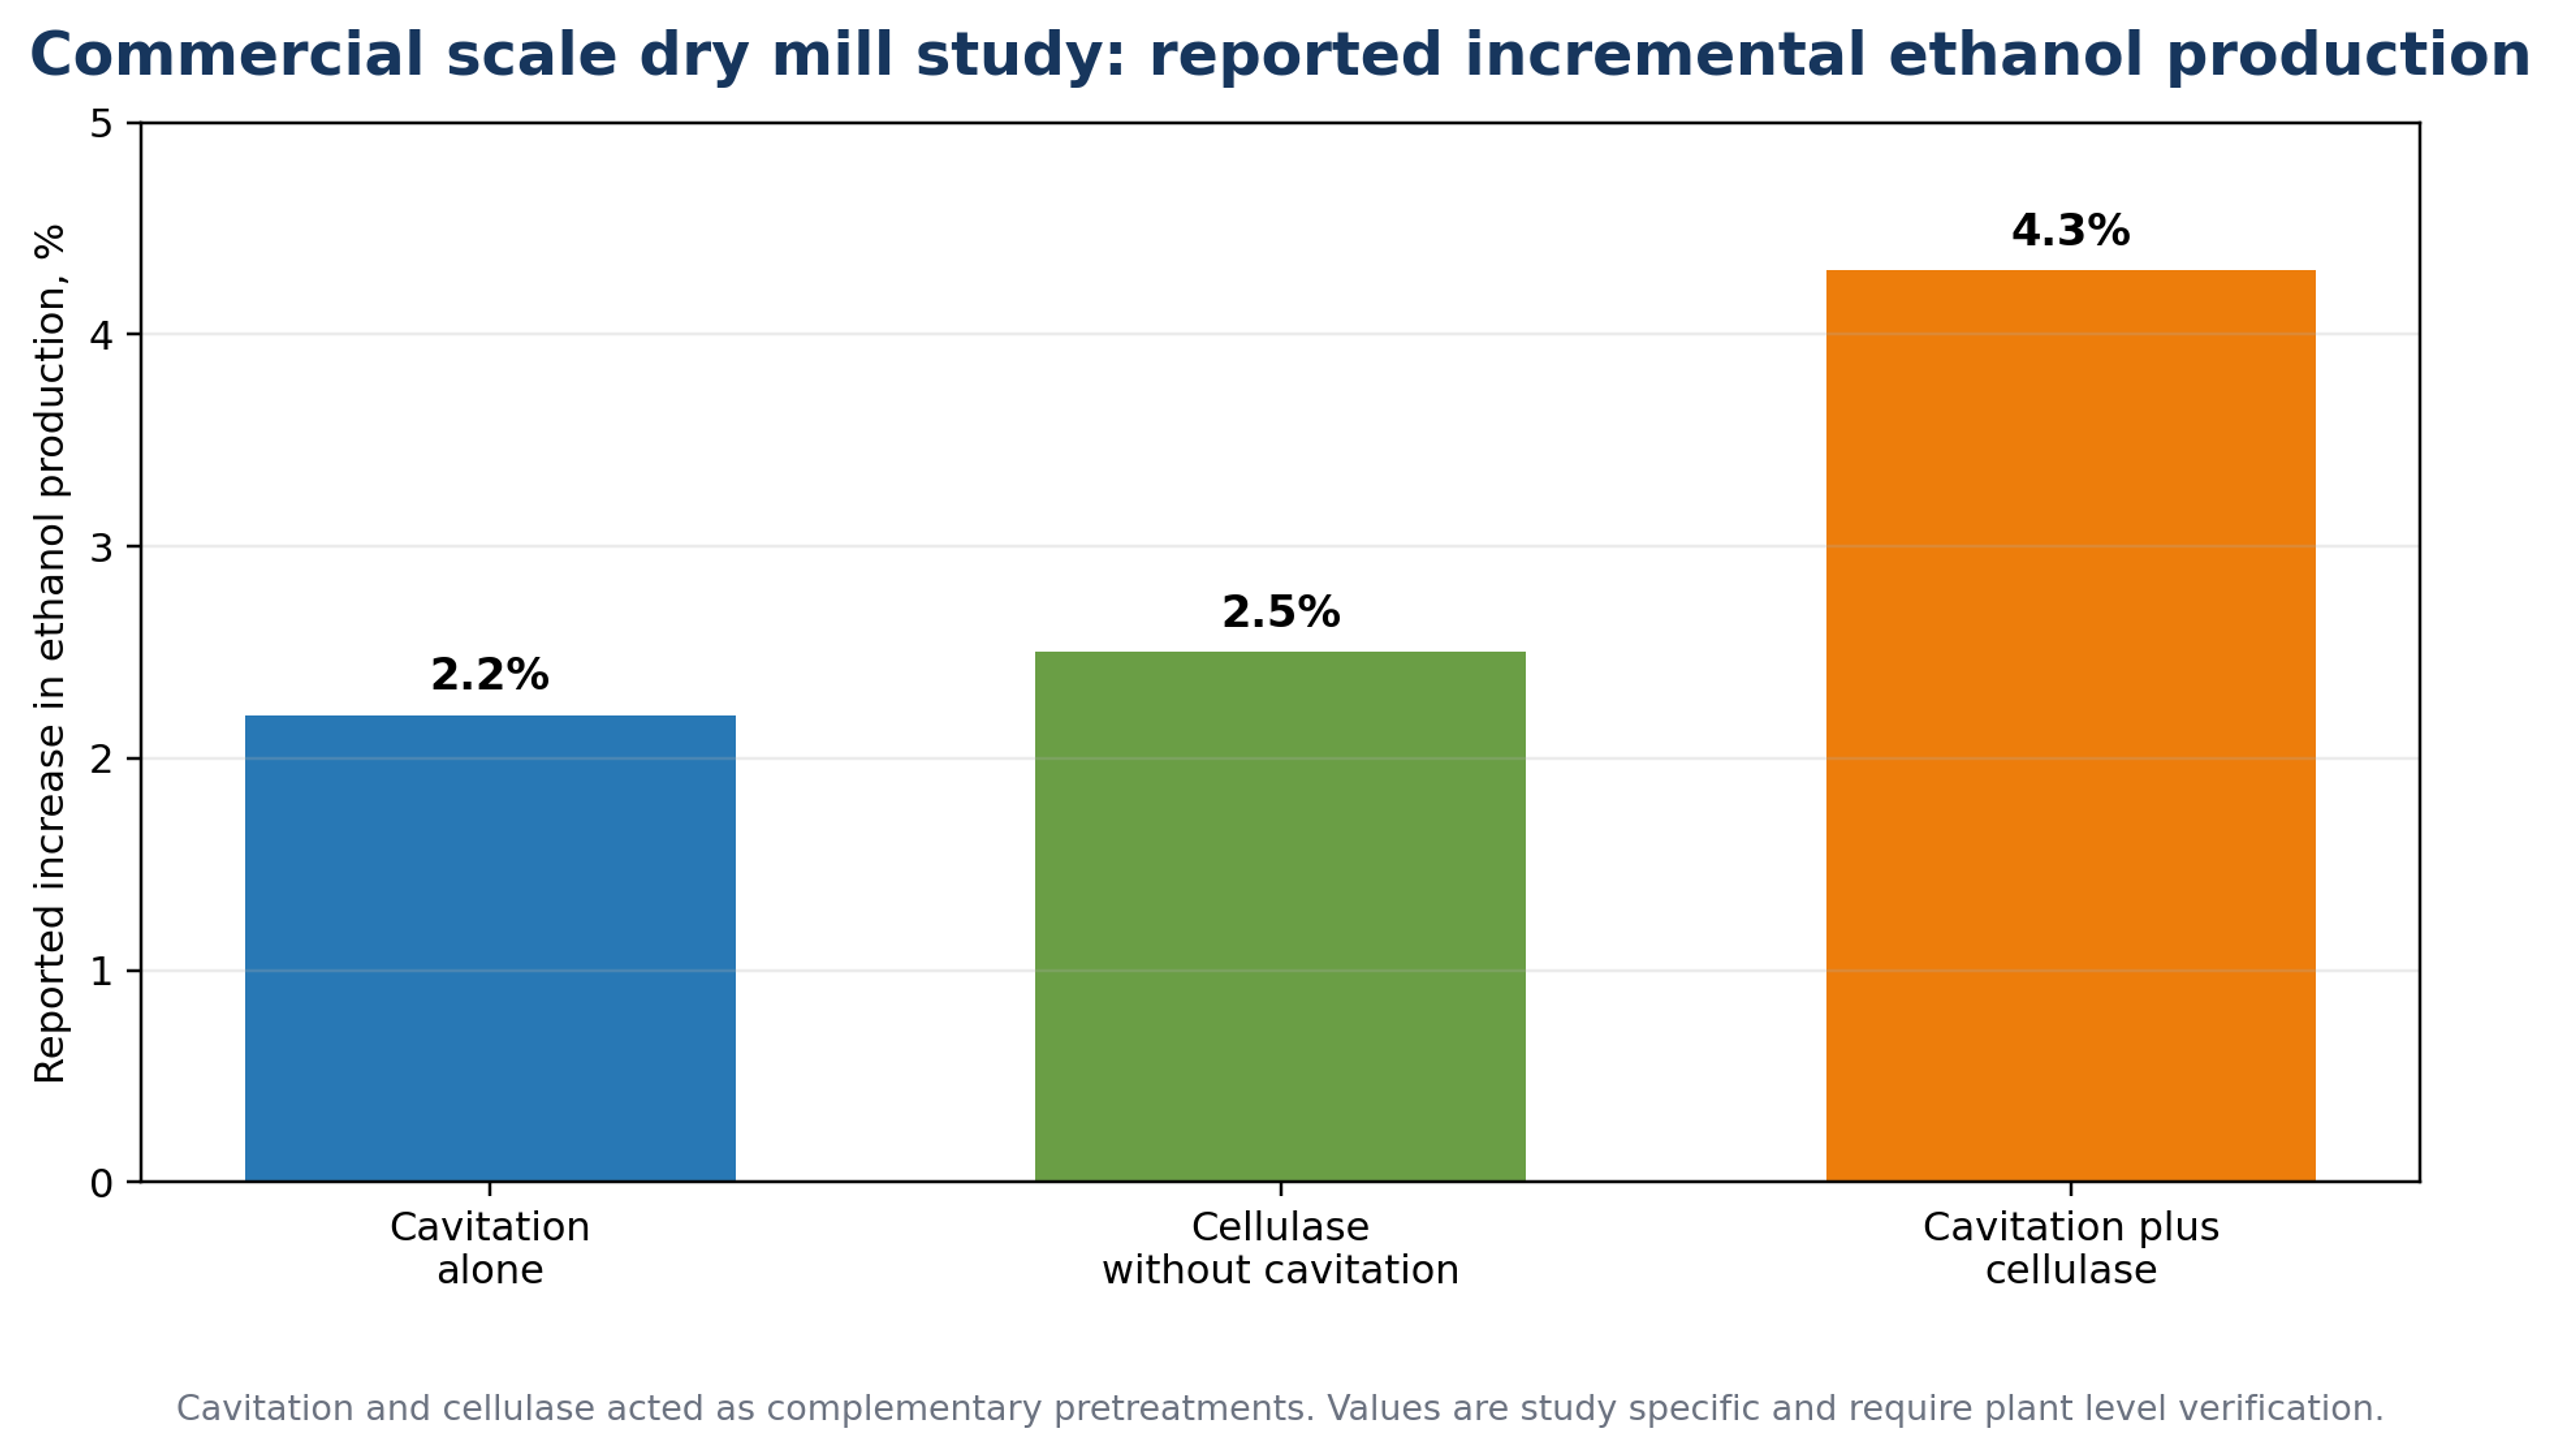
Figure 9.8. Commercial scale reported incremental ethanol production from cavitation, cellulase without cavitation, and combined cavitation plus cellulase. [59].
Table 9.3. Supplied corn ethanol evidence and engineering interpretation.
| Source | Scale and treatment | Reported outcome | Engineering interpretation |
|---|---|---|---|
| Wrenn [58] | NCERC pilot slurry; 100, 200, and 300 psig | Approximately 2 to 3% yield increase at 200 and 300 psig; no significant increase at 100 psig or with jet cooking | Defines a pressure threshold for the tested corn, solids, temperature, enzyme, and fermentation protocol |
| Ramirez Cadavid [59] | Pilot dry mill treatment over a wider energy range | 11.6% increase in total glucose released and 2.7% increase in ethanol at the maximum tested treatment | Shows that particle opening and liquefaction response must be evaluated together |
| Ramirez Cadavid [59] | Commercial plant near 100 million gal/y | 2.2% cavitation only; 2.5% cellulase only; 4.3% combined | Supports plant scale opportunity, but economics depend on feedstock, enzymes, coproduct, and energy boundaries |
| Kozyuk patents [56,57] | Multiple possible insertion points and recirculation arrangements | Apparatus and integration claims | Useful configuration disclosure; not independent performance evidence |