
Technical publication
Back to publications
Other
Emulsification and Homogenization in Rotor-Stator Mixers
okozyuk.com
Published
Read complete publication for whole-document Find and printing. Browser Find and native printing on this reader include only loaded content.
15 Worked engineering example
15.1 Design basis
The following calculation illustrates how interfacial area, emulsifier coverage, pass requirement, energy, and temperature can be evaluated on one consistent basis. The values are an assumed engineering design case and do not represent a new experimental dataset. A 1,000 L oil in water batch contains 20 percent dispersed oil by volume. Its initial Sauter mean diameter is ,0 = 50 µm, and the target is ,f = 5 µm with ≤ 12 µm. The assumed density is 980 kg m⁻³, heat capacity is 3.8 kJ kg⁻¹ K⁻¹, and maximum permissible temperature rise is 8 K. Dynamic interfacial tension at the relevant surface age is 10 mN m⁻¹, and effective interfacial coverage requires 2 mg m⁻² of emulsifier. The estimated flow through the batch head is 0.035 m³ s⁻¹ and net shaft power is 30 kW. For illustration, the empirical pass model in equation (7.7) is assigned = 4.2 µm and = 0.95.
The batch volume expressed in SI units is
and the dispersed phase volume is
The initial droplet distribution corresponds to an interfacial area of
At the target Sauter mean diameter, the required area becomes
The increase in interfacial area is
With the assumed effective coverage of 2 mg m⁻², the adsorbed mass required on the final interface is
Assuming that 40 percent of the added formulation is effectively available for adsorption and applying a coverage allowance of 25 percent, the screened total formulation dose is
This is a total dose on the stated availability basis. When emulsifier is already present in the premix, its effective contribution must be subtracted before an additional quantity is specified. The calculation does not establish that the resulting adsorption rate is sufficient during droplet breakup.
15.2 Pass requirement and processing time
The empirical pass model translates the size target into a mean cumulative exposure requirement. Solving equation (7.7) for the number of equivalent passes required to reach 5 µm gives
With the assumed constant circulation through the head, the corresponding ideal processing time is
which is approximately 2.0 min. Here, denotes equivalent pass number; it should not be confused with the rotor frequency used elsewhere in the article.
The predicted endpoint is a screening value because individual fluid elements receive different exposure in a batch. Samples at approximately 90, 120, 150, and 180 s would bracket the calculated endpoint and permit evaluation of , , span, and stability. The pass model predicts the selected mean size; it does not establish compliance with the requirement or guarantee that every part of the batch has passed through the head.
15.3 Energy and heat balance
The energy calculation uses the same processing interval as the droplet calculation so that product performance can be related to its energy and thermal demand. The estimated batch mass is
At the rounded processing time of 122 s, the accumulated net specific energy is
The corresponding adiabatic temperature increase is
when the specific energy and heat capacity are expressed consistently in kJ kg⁻¹ and kJ kg⁻¹ K⁻¹.
Under these assumptions, the calculated temperature rise is below the specified 8 K limit. The result excludes additional energy from auxiliary pumping or other sources and increases if processing continues beyond the assumed endpoint. Continuous temperature measurement remains necessary because the actual circulation, power, and heat transfer may differ from the design estimates.
Using the assumed constant interfacial tension, the increase in interfacial free energy is
The calculated net mechanical input over the same interval is 3.66 × 10⁶ J. The apparent interfacial energy efficiency is therefore
or approximately 0.059 percent.
This small ratio is consistent with most mechanical input being dissipated outside the final interfacial free energy increase. It demonstrates why theoretical surface work alone cannot be used to select a motor or compare process productivity. The practical comparison should use measured specific energy at a common product specification, together with throughput and stability.
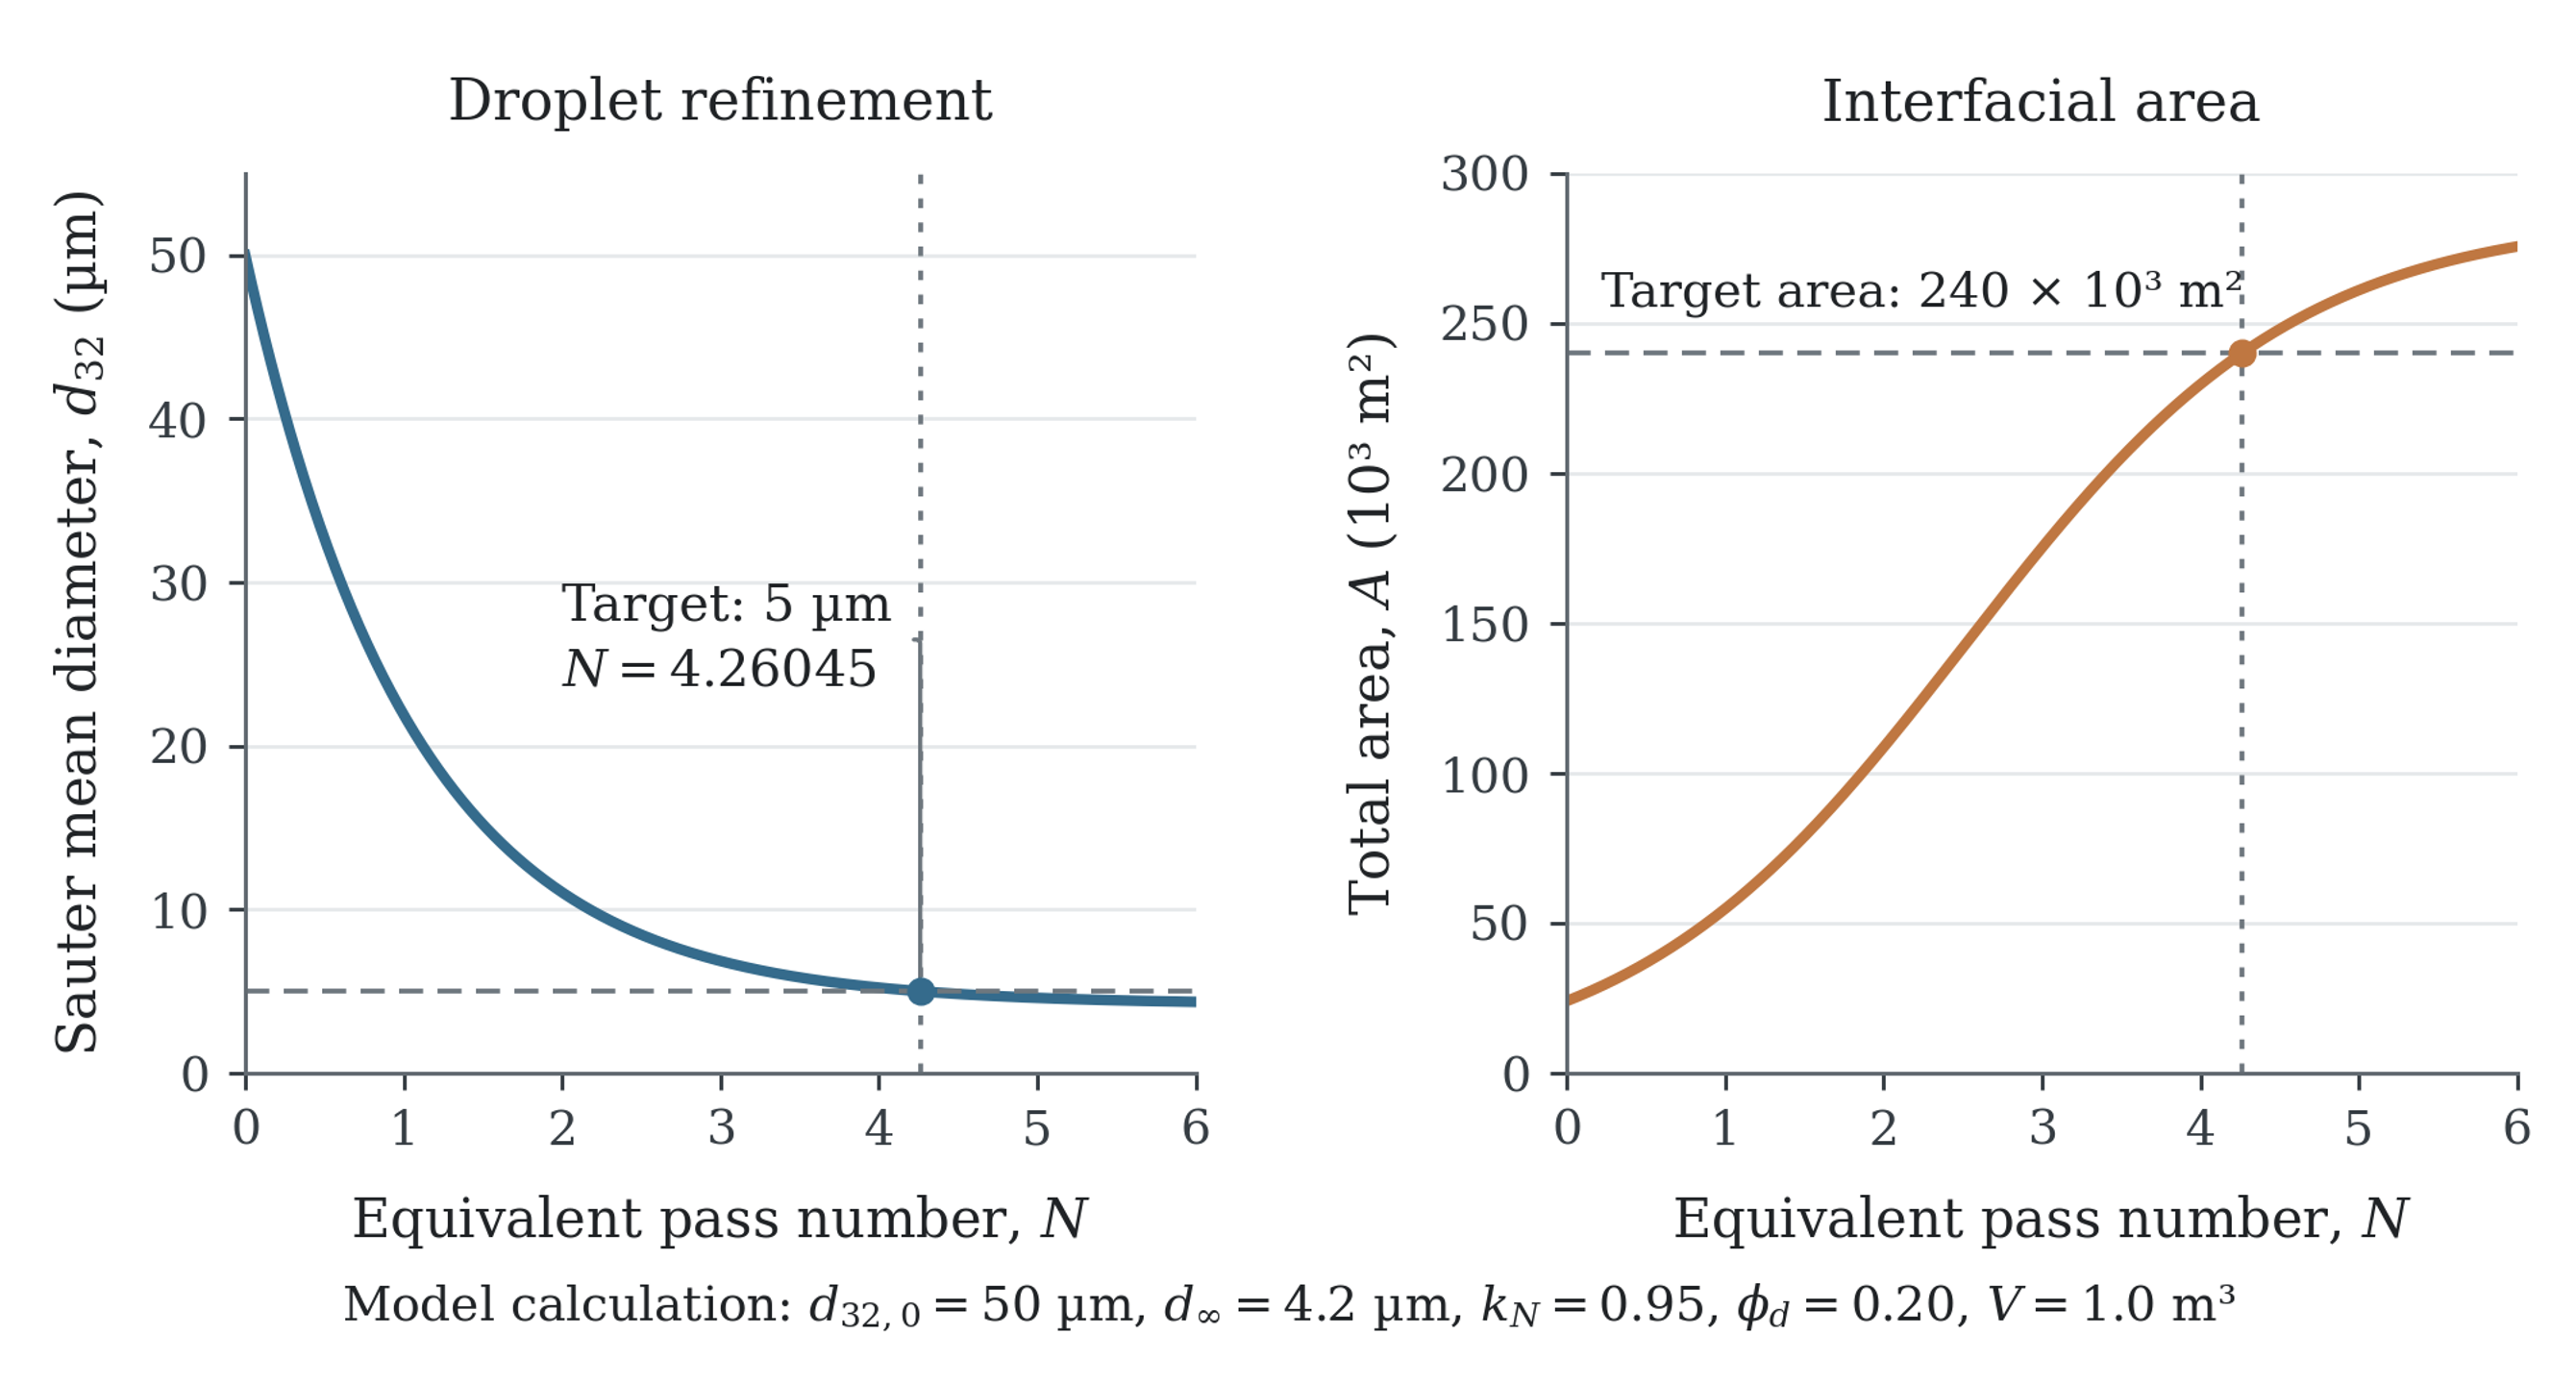
Figure 15.1. Calculated droplet diameter and total interfacial area for the assumed design basis in Section 15. The curves follow equations (7.7) and (2.8), with an initial diameter of 50 µm, an asymptote of 4.2 µm, and a pass coefficient of 0.95. The 5 µm target is reached at approximately 4.26 equivalent passes, when the total interface is 2.40 × 10⁵ m².
Table 15.1. Worked example summary and verification requirements.
| Item | Calculated value | Design interpretation | Verification |
|---|---|---|---|
| Initial interfacial area | 24,000 m² | Coarse premix | Confirm premix |
| Target interfacial area | 240,000 m² | Tenfold increase | Confirm final and topology |
| Ideal adsorbed emulsifier | 0.48 kg | Surface coverage only | Measure stability and free emulsifier |
| Screened formulation dose | 1.50 kg | Includes adsorption efficiency and reserve | Optimize by formulation trials |
| Equivalent passes | 4.26 | Mean model prediction | Sample around endpoint |
| Ideal time | 122 s | Based on 0.035 m³ s⁻¹ head flow | Verify circulation with tracer or manufacturer data |
| Specific energy | 3.73 kJ kg⁻¹ | Reasonable pilot endpoint | Measure net torque or power |
| Adiabatic rise | 0.98 K | Below 8 K limit | Record actual thermal history |
| Apparent interfacial efficiency | 0.059% | Most energy dissipates elsewhere | Compare only on common formulation basis |